RR904 - Mists created by the use of compressed … · Health and Safety Executive Mists created by...
48
Health and Safety Executive Mists created by the use of compressed airlines for the removal of metalworking fluids Assessment of the possible exposure health risks Prepared by the Health and Safety Laboratory for the Health and Safety Executive 2011 RR904 Research Report
Transcript of RR904 - Mists created by the use of compressed … · Health and Safety Executive Mists created by...

Health and Safety Executive
Mists created by the use of compressed airlines for the removal of metalworking fluids Assessment of the possible exposure health risks
Prepared by the Health and Safety Laboratory for the Health and Safety Executive 2011
RR904 Research Report
Health and Safety Executive
Mists created by the use of compressed airlines for the removal of metalworking fluids Assessment of the possible exposure health risks
Dr Helena Scaife
with contributions from
Mr Dominic Pocock Mr Steven Bennett Dr Gareth Evans
Harpur Hill Buxton Derbyshire SK17 9JN
The potential impact of the use of compressed air for the removal of residual metalworking fluids on health was investigated using a test chamber approach followed by a workplace study. The former had the advantage in that the background levels of particles could be reduced significantly. The greatest risk was found to be dermal exposure due to large droplets of MWF coating the worker’s torso and arms. The visualisation of respirable mist using back lighting was not a reproducible phenomenon in either setting but in the test chamber, the use of particle counters revealed that a reduction in compressed air pressure decreased the levels of respirable particles. Microbial contamination did not appear to alter the concentrations of particles or their size distribution. However, background levels of airborne particles in the ‘well managed’ workshops visited were sufficiently high to mask any increase in particle concentrations due to the use of compressed air but dermal exposure was observed.
This report and the work it describes were funded by the Health and Safety Executive (HSE). Its contents, including any opinions and/or conclusions expressed, are those of the authors alone and do not necessarily reflect HSE policy.
HSE Books
© Crown copyright 2011
First published 2011
You may reuse this information (not including logos) free of charge in any format or medium, under the terms of the Open Government Licence. To view the licence visit www.nationalarchives.gov.uk/doc/open-government-licence/, write to the Information Policy Team, The National Archives, Kew, London TW9 4DU, or email [email protected].
Some images and illustrations may not be owned by the Crown so cannot be reproduced without permission of the copyright owner. Enquiries should be sent to [email protected].
ACKNOWLEDGEMENTS
The authors would like to acknowledge Mr Peter Woolridge and Mr Vincent Riding from Presspart Manufacturing Ltd, Blackburn, UK for kindly agreeing to provide access to their workshops to undertake this study. We are also grateful to Mr Riding from Presspart and to Mr John Belien from Quaker Chemicals for technical advice regarding the use of compressed air. Thanks are also given to Mr John Saunders (technical lead Exposure Control team) and to Dr Andrew Thorpe for their assistance with the particle counting devices and during development of the test chamber facility at HSL. Mr Martin Roff is acknowledged for the UV visualisation work with the fluorescently labelled MWF.
ii
KEY MESSAGES
The use of compressed air to clean fines and residual used metalworking fluids from machined components and machinery has been considered by HSE as a potential contributory factor to the creation of mists containing particles that could enter the respiratory tract. The study was based on a laboratory simulation and a workplace site visit to quantify and characterise the mists that may result from the use of compressed airlines to remove metal working fluids (MWFs).
Key findings: • Deposition of MWF on body surfaces was found to be a significant risk when using
compressed air to remove used MWF.
• The observation of mist droplets in the breathing zone that were inhalable (<100μm) or respirable (<10μm) occurred both in the workplace and in the test chamber. However, this was not an easily reproducible phenomenon compared to the formation and spread of large droplets of cutting fluid.
• The formation of mist appears to be influenced by a variety of factors: the accumulation of small quantities of fluid in indentations and blind holes, the angle at which the compressed air hits the fluid and the amount of energy produced on release of the compressed air.
• Contamination of the MWFs either with intact bacteria or lysed (broken open) bacteria (simulating poorly managed MWF) did not alter the propensity for mist formation under laboratory test conditions.
• By being able to reduce the background levels of particles, the test chamber studies showed no influence of pressure on the formation of airborne droplets at the upper end of the respirable range i.e. >5μm but an increase in pressure did have an effect in increasing the quantity of respirable particles between 0.3μm and 3.0μm in diameter within the breathing zone.
• Clear increases in the level of mist due to compressed air usage in the two ‘well managed’ workshops were not observed because the background levels of airborne particles were very high. This could be due partially to an accumulation of mist formed by prior compressed air use or from other activities such as machining, exhaust fumes, or general environmental contamination.
• There is a risk of inhaling MWF mist particles when using compressed airlines especially where poor working practices exist. Principles of good control and hygiene should reduce the risk significantly.
iii

iv
EXECUTIVE SUMMARY
The formation of mists in metalworking workshops and the implications for worker health have been of concern to HSE for a number of years. The use of compressed air to clean fines and residual used metalworking fluids (MWF) from machined components and machinery has been suggested as a contributory factor to generation of aerosols that can be inhaled by the workers.
The findings reported here suggest that deposition of MWF on the skin of an operator is likely to occur if no protective equipment is worn, and that there may be a risk of breathing in mist particles, when compressed air is used for cleaning. It was shown both in a test chamber and in a workplace that there was significant deposition of fluid droplets on the side of the worker’s torso (i.e., the side where the compressed air gun was held). This demonstrated the need to avoid the procedure where possible or to provide suitable PPE to minimise the dermal contamination. The test chamber studies revealed that a reduction in pressure led to a decrease in deposition of the MWF onto the body surfaces.
MWF was labelled with a fluorescent dye to demonstrate its dispersion using an ultraviolet (UV) light source. Little deposition of MWF was observed on the facial area of the test chamber manikin, but significant amounts were deposited on the forearm and torso. Increasing the pressure of the compressed air from 1.1 to 2.2 bars on a pressure gauge increased the amount of MWF deposited on these regions of the body but the deposited material consisted of large ‘non-respirable’ droplets.
To assess the possible exposure to mist and the likelihood of it entering the respiratory tract, two different optical particle counters were employed. The TSI Aerotrack measured airborne particles in different size classes from 0.3μm to >10.0μm. Airborne particles <10.0μm are referred to as respirable. The second particle counter, the Cassella MicroDust Pro measured the mass of the total respirable particles (ie <10.0μm).
The observation of mist droplets in the breathing zone that were inhalable (<100μm) or respirable (<10μm) occurred only very occasionally both in the workplace and in the test chamber. The majority of the MWF was forced off the surfaces as large droplets >100μm and fell to the floor or onto the lower torso of the worker suggesting a significant proportion of the MWF removed was not inhalable. The formation of mist that could potentially be harmful to the respiratory system appears to be influenced by a variety of factors: the accumulation of small quantities of fluid in indentations and in particular in blind holes, the angle at which the compressed air hits the fluid and the amount of energy produced on release of the compressed air. The latter will vary according to the type of compressed air gun, the distance held from the object and the pressure with which the compressed air is supplied.
The use of a test chamber allowed the background levels of particles to be reduced and thus variations in different particle size ranges to be more clearly observed during a series of tasks using compressed air. It was shown that an increase in pressure increased the quantity of respirable particles between 0.3μm and 3.0μm in diameter within the breathing zone. By repeating the compressed air task thirty times it was possible to quantify respirable exposure to MWFs as measured using MHDS 95/2 (a boron marker method). These data suggested that at increased pressure the amount of MWF in the respirable fraction almost doubled but these measurements were undertaken at the lower limits of detection for this assay. When old MWF that contained very high levels of endotoxin due to large-scale bacterial cell death was used, approximately 15EU/m3 of bacterial endotoxin was measured in the respirable samples of MWF. This is relatively low and below the newly proposed Dutch NOEL (no observed effect level based upon human exposure response studies) of 90EU/m3 (DECOS, 2010). Airborne
v
levels of endotoxin in freshly prepared MWF containing whole or lysed bacteria were below the limit of detection. However, the presence of intact bacteria or bacterial products did not alter the formation of mist particles either by low, or high, pressure compressed air.
Sampling work was also undertaken at an engineering plant where compressed airlines were typically used at higher pressures (up to 5.5.bar) than could be achieved at the HSL test facility. At this site background levels of fine and ultrafine particles were found to be very high (over 100 fold greater than those measured in an office environment) and this limited accurate quantification of any mist raised by the use of the compressed airline. As previously noted during the test chamber study, mist was visualised using back lighting but only observed close to the breathing zone under specific conditions. However, heavy contamination of the arm and torso of the operator close to where the airline was held was consistent with the results of the experimental laboratory study.
Conclusions
The following conclusions were drawn from this study:
• Deposition of MWF on the torso of the operator was reproducible whereas the formation of mist particles within the breathing zone was only clearly demonstrated under specific experimental conditions.
• Dermal (and clothing) exposure to used MWFs is greater than exposure to respirable mist particles when compressed air is used to clean ‘water mix MWF’ from surfaces. This emphasises the importance of using control systems and PPE to protect the hands, exposed arms, torso and legs of the worker. Contamination of personal clothing could result in prolonged skin contact with MWFs.
• There is a potential risk for formation of mists with compressed airlines used at high pressures, in close proximity to work pieces, or on surfaces with uneven surfaces. Practical techniques could be introduced to minimise this risk such as identifying pressures sufficient to remove MWFs but minimising mist formation. Good principles of control and hygiene should minimise this risk.
• The formation of mist was not altered by the presence of intact or degraded bacteria in the MWF but when using old MWF, in which microorganisms had accumulated over long periods and subsequently died, the potential for inhaling endotoxin was increased.
• Background respirable particles (<10μm) in a ‘visibly clean’ workshop were found to be on average 100 fold higher than in a standard office. If this is typical of other machine plants, it suggests that compressed airlines may not be the major factor contributing to high levels of respirable particles (<10μm).
• The use of particle counting instruments could help to identify activities that increase the formation of respirable particles (<10μm) in machining workshops and to identify effective controls to reduce levels of particles (containing either chemical or biological hazards).
vi
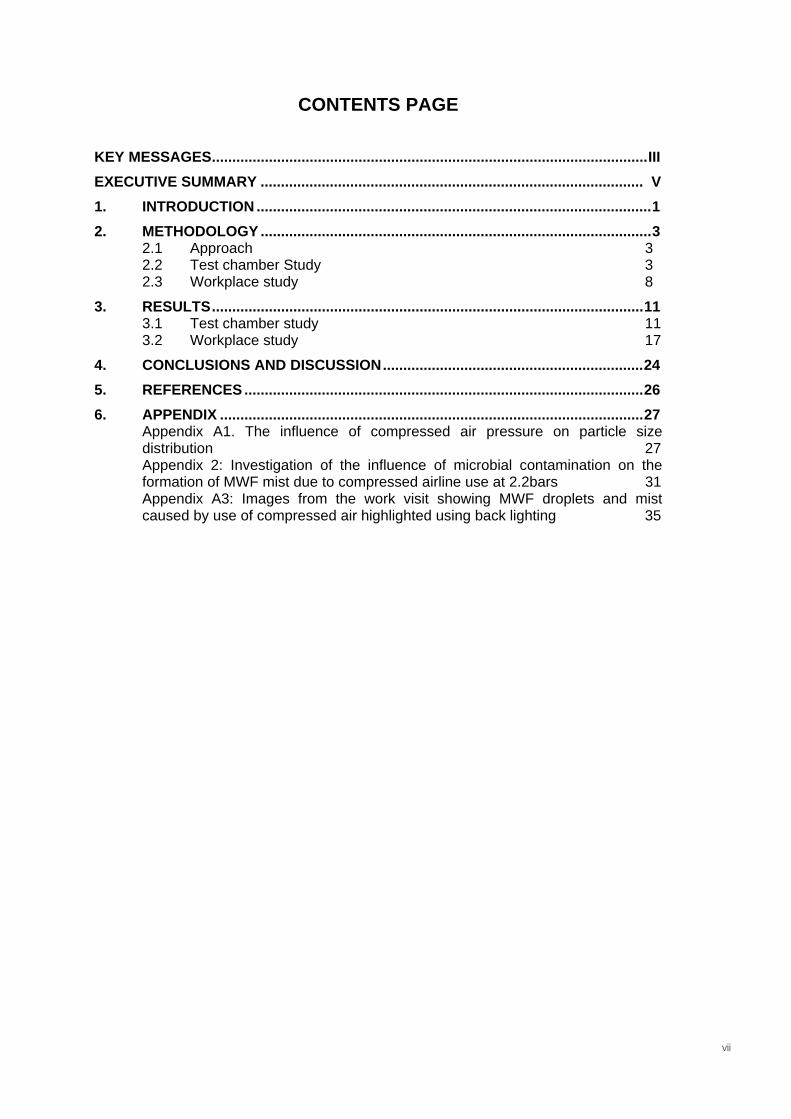
CONTENTS PAGE
KEY MESSAGES...........................................................................................................III EXECUTIVE SUMMARY .............................................................................................. V
1. INTRODUCTION .................................................................................................1
2. METHODOLOGY ................................................................................................3 2.1 Approach 3 2.2 Test chamber Study 3 2.3 Workplace study 8
3. RESULTS..........................................................................................................11 3.1 Test chamber study 11 3.2 Workplace study 17
4. CONCLUSIONS AND DISCUSSION................................................................24
5. REFERENCES ..................................................................................................26
6. APPENDIX ........................................................................................................27 Appendix A1. The influence of compressed air pressure on particle size
Appendix A3: Images from the work visit showing MWF droplets and mist
distribution 27 Appendix 2: Investigation of the influence of microbial contamination on the formation of MWF mist due to compressed airline use at 2.2bars 31
caused by use of compressed air highlighted using back lighting 35
vii

viii

1. INTRODUCTION
Metalworking fluids (MWF) are used as a coolant in the machining of metals. They are either used as complete mineral oils or water miscible emulsions. The latter can be sub-divided into those containing mineral oils, those containing semi-synthetic oils and those containing synthetic oils. As water miscible emulsions are routinely prepared with mains water, low concentrations of microorganisms are introduced into the MWF from the start. Subsequent poor management can lead to heavy colonisation of the MWF with microorganisms in particular bacteria increasing the potential risk for respiratory allergy. Whilst biocides are added to MWFs to control the growth of microorganisms, the accumulation of biomass and dead bacteria can result in the accumulation of toxins such as endotoxin, which can provoke inflammation within the respiratory tract (Passman and Rossmoore 2002).
In 2004, an outbreak of respiratory ill health occurred at Powertrain, a car component factory at Longbridge, Birmingham. This was a large outbreak of respiratory disease consisting of cases of occupational asthma, extrinsic allergic alveolitis and humidifier fever. Although the direct cause of the cases has never been determined, it was concluded that the inhalation of mists of metal working fluid containing microorganisms (or their constituents) was a relevant risk factor (Robertson et al. 2007). Mists are defined as aerosols of liquid particles within the size range 0.01μm to 100μm. Particles of < 10μm are defined as respirable as they are small enough to penetrate beyond the nasal and upper respiratory tract entering the gas exchange surfaces of the lungs. Inhalable particles of <100μm are defined as those particles that enter the body, but are trapped in the nose, throat and upper respiratory tract. The median aerodynamic diameter of inhalable particles is approximately <10μm. In comparison to aerosols of dust that contain solid particles of fixed size, particle size distribution of mists may change as volatile liquids evaporate (HSE: 2008).
Following the outbreak of respiratory ill health at Powertrain, there has been a focus on improving ventilation in factories and thus reducing the inhalation of mists. HSE also updated its guidance following the Powertrain investigation, and this guidance emphasised the importance of restricting the growth of microorganisms in MWFs as well as the importance of controlling the formation of respirable mists.1 Many machines that create mists during the machining process are now fitted with local exhaust ventilation (LEV) and / or mist extraction to prevent exposure of the worker. However, not all machines operate under LEV and ventilation systems are often not well maintained. It has been observed that one particular task, that is not performed under LEV and could potentially lead to inhalation of mist, is the cleaning of components and machinery with compressed air. Historically, cleaning with compressed air has been used in a variety of industries including the textile and metalworking industries, for the removal of waste particles. The process involves the operation of a compressed air gun by the worker to blow the particles off the surface, often into the atmosphere. In respect to metalworking, metal components that are to be machined are coated with metalworking fluid that acts as a coolant. Following the machining process, the majority of the used fluid drains into the sump tank but a thin layer of fluid and in places small pools of MWF are left. The worker uses the compressed air to blow this remaining MWF off the machine bed, machining tool and / or machined component. The fluid also often contains fines that are very small metal particles, formed during the machining process. The majority of workers do not wear gloves, long sleeves (protection of the lower arm), or eye protection whilst using compressed airlines. Dermatitis and damage to skin due to fines being forced into the skin have been reported across the metalworking industry and recognised as a problem associated with the use of compressed airlines.
The large outbreak of respiratory ill health at Powertrain demonstrated that exposure to metalworking fluids could lead to respiratory disease with a wide spectrum of symptoms and symptom severity. HSE inspectors have reported that when compressed airlines are used to remove MWF, they can produce mists, with potential to provoke respiratory disease in susceptible workers. If a MWF has been poorly managed the inhaled particles may also contain microorganisms or microbial by-products. Due to the
1 http://www.hse.gov.uk/metalworking/bacterial.htm 1
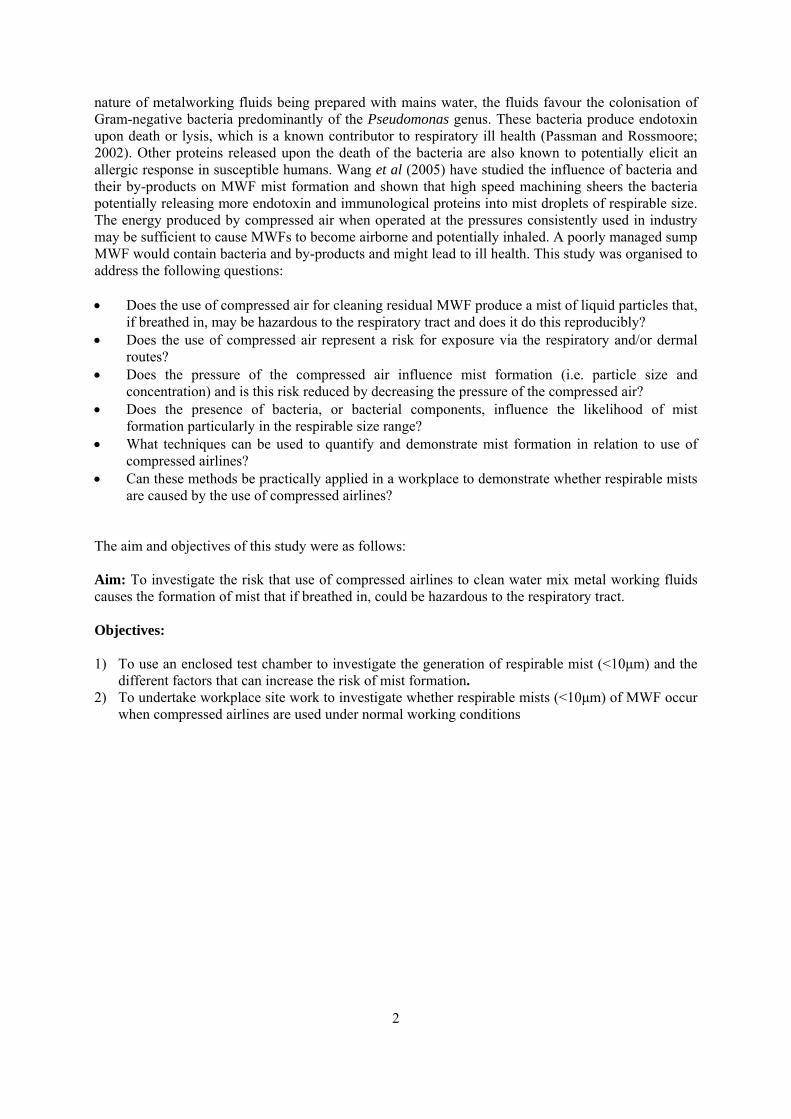
nature of metalworking fluids being prepared with mains water, the fluids favour the colonisation of Gram-negative bacteria predominantly of the Pseudomonas genus. These bacteria produce endotoxin upon death or lysis, which is a known contributor to respiratory ill health (Passman and Rossmoore; 2002). Other proteins released upon the death of the bacteria are also known to potentially elicit an allergic response in susceptible humans. Wang et al (2005) have studied the influence of bacteria and their by-products on MWF mist formation and shown that high speed machining sheers the bacteria potentially releasing more endotoxin and immunological proteins into mist droplets of respirable size. The energy produced by compressed air when operated at the pressures consistently used in industry may be sufficient to cause MWFs to become airborne and potentially inhaled. A poorly managed sump MWF would contain bacteria and by-products and might lead to ill health. This study was organised to address the following questions:
• Does the use of compressed air for cleaning residual MWF produce a mist of liquid particles that, if breathed in, may be hazardous to the respiratory tract and does it do this reproducibly?
• Does the use of compressed air represent a risk for exposure via the respiratory and/or dermal routes?
• Does the pressure of the compressed air influence mist formation (i.e. particle size and concentration) and is this risk reduced by decreasing the pressure of the compressed air?
• Does the presence of bacteria, or bacterial components, influence the likelihood of mist formation particularly in the respirable size range?
• What techniques can be used to quantify and demonstrate mist formation in relation to use of compressed airlines?
• Can these methods be practically applied in a workplace to demonstrate whether respirable mists are caused by the use of compressed airlines?
The aim and objectives of this study were as follows:
Aim: To investigate the risk that use of compressed airlines to clean water mix metal working fluids causes the formation of mist that if breathed in, could be hazardous to the respiratory tract.
Objectives:
1) To use an enclosed test chamber to investigate the generation of respirable mist (<10μm) and the different factors that can increase the risk of mist formation.
2) To undertake workplace site work to investigate whether respirable mists (<10μm) of MWF occur when compressed airlines are used under normal working conditions
2

2. METHODOLOGY
2.1 APPROACH
The original intention of the study had been to undertake only workplace measurements as the most relevant way to address the study objectives. It had also been intended to use methods to quantify personal inhalation exposure based on HSE approved methods for quantifying mist and MWFs (MHDS 84 and MHDS 95/2) with Exposure Level Visualisation (ELVis) as a means to provide qualitative evidence. It was anticipated that two factories using mineral oil fluids and three factories using water miscible MWFs would be recruited. However it proved difficult to recruit factories as the employers were aware that HSE inspectors deemed the use of compressed airline to be poor practice, and for which several improvement notices had already been served.
Following discussions with HSE and an examination of peer-reviewed literature on MWF mists, it was decided to focus on water miscible MWFs due to the greater association with ill health. The study would be undertaken in a test chamber at HSL to contain any MWF mist and to mimic as closely as possible real life use of compressed airlines. The formation of MWF mist is likely to be influenced by a large number of factors such as type of fluid, age or contamination levels within the fluid, the pressure of the compressed air, type of gun, nozzle diameter, distance held from component being cleaned, geometry of piece being cleaned etc. It was decided the study would focus on two aspects: the influence of pressure and the influence of microbial contamination. In order to do this, a single type of MWF was used for each set of test runs; the same gun type, test piece and distance held from the metal test piece to be cleaned was maintained throughout the test runs.
The influence of compressed air pressure would be investigated as there had been observations by HSE inspectors, that cleaning could still be undertaken if pressure was reduced. It was hypothesised that a reduction in pressure would lead to a reduction in mist formation. Research by Wang et al (2005) describes a shift in particle size distribution of MWF mist due to sheering of bacteria caused by high speed machining. From these observations it could be suggested that ill health is more likely due to bacterial components such as endotoxin and other immunological proteins than whole bacteria. Therefore, it was decided to compare the size distribution of particles produced when cleaning fresh MWF containing whole bacteria and fresh MWF with a similar number of lysed bacteria using compressed air at a fixed pressure. The effect of using compressed air with a MWF that had been colonised by a Gram negative bacterium and allowed to stand for one year leading to a high concentration of lysed bacteria / endotoxin was also examined as a worst case scenario.
The dermal exposure of the worker to MWF during use of compressed air was also examined. A safe fluorescent label was added to the MWF and spread of the MWF across the body was demonstrated using a UV light source.
Towards the end of the investigations, Presspart Manufacturing Ltd (a small engineering plant in Blackburn) that uses compressed airlines agreed to HSL undertaking experimental work in two of their workshops. This allowed the results of the test chamber study to be related to a workplace setting and for pressures commonly used in industry to be examined.
2.2 TEST CHAMBER STUDY
2.2.1 Pilot study
A test chamber was designed that would allow the remote operation of compressed air for the cleaning of MWF coated machined metal components. The test chamber had dimensions of 3m x 3m x 3m (27m3) and contained an open steel box of 1m3 volume on legs that was used to mimic a machine enclosure. A manikin (1.8m tall) representing the operator of the compressed air gun used for cleaning
3

Dust track monitor
Engine
componentIOM &Cyclone
samplers
PPE for Fivesvisualisation
2m
Compressed airline
1.5m
a metal component was placed in front of the enclosure. Mist formation was determined using a combination of particle counters and personal samplers sited in the breathing zone and fixed samplers. This is summarised in Figure 1.
3m3m
perambulator
‘ ’
3m
Dust track monitor
perambulator
Engine
component IOM &Cyclone
samplers
PPE for ‘Fives’ visualisation
3m
2m
Compressed airline
1.5m
Figure 1. Schematic of test chamber Figure 2. Engine block used as test component
A machined metal test piece was placed in the enclosure and was coated with MWF from above using an overhead showering system operated by an external peristaltic pump. A single type of compressed air gun was used throughout the test chamber study. It had a 75mm length nozzle of an inner diameter of 3.5mm. The compressed air gun was held closed in the hand of a full size manikin which was placed initially on a perambulator. This allowed the manikin to be moved horizontally back and forth.
The initial stage of the pilot study was to establish a means of coating a suitable piece of metal with a similar amount of MWF that occurs in industry. It had been noted during previous site visits that much of the MWF drained off the machinery leaving a thin coating. HSL had already acquired a car engine block (Figure 2) during the Powertrain investigation and this was used as it had a non-uniform geometry that would most closely mimic the geometry of an enclosed cutting machine. As the test piece needed to be repeatedly coated with MWF from outside the test chamber, a peristaltic pump and small spray nozzle were used to coat the engine block. The spray nozzle was positioned above the test piece. The flow rate was fixed at 0.75ml/second and the volume of fluid sprayed in a given time to achieve the desired coverage was determined.
Plant air fed to HSL laboratory was initially used with a gauge fitted near the operating valve just outside the test chamber and adjusted to a maximum of 5bar (~70psi). It was understood that this was how the pressure compressed air guns were operated in industry (Personal communication, John Belien, Quaker Chemicals, Holland). On opening the valve to operate the compressed air the pressure recorded by the gauge dropped to approximately 2bar. A gauge was subsequently placed just prior to the gun in the test chamber and the pressure was checked prior to each experimental test run. It was found that the maximum pressure of compressed air that was consistently achievable in the test chamber was 2.2bar. The use of a cylinder of compressed air instead of the plant air did not lead to any increase in the pressure of compressed air that was achieved. The pressure observed to be lowest pressure that would effectively remove the fluid from the component was 1.1bar. The distance
4
between the end of the compressed air gun nozzle and the MWF coated surface was set at 3cm based on observations of operators using compressed airlines.
IOM and cyclone personal air samplers were sited in the breathing zone of the manikin and at the same height approximately 1.5 m behind the manikin in both front corners of the test chamber. Each personal sampler was attached to a pump, which was operated at 2L/min for IOM samplers and 2.2L/min for cyclone samplers, respectively. The pumps were sited outside the test chamber. Particles were collected on 2.5cm diameter, glass quartz filters. MHDS 95/2 was adopted to determine the concentration of MWF mist using boron as a marker of the quantity of fluid collected in comparison to the bulk fluid (HSE: 2003). The initial pilot study and investigation of the influence of pressure on particle size distribution was undertaken using a conventional biocide treated water miscible MWF that was known to be highly stable in respect to microbial contamination and was shown to contain boron by inductively coupled plasma mass spectrometry. (ICP-MS)
Initial trials did not produce sufficient mist to lead to quantification using MHDS 95/2 (HSE: 2003). In order to determine the particle size distribution of any mist a TSI Aerotrack particle sampler was used. This particle size counter has been used previously to study the particles released in mists by processes such as cooking in a restaurant and aluminium dye casting (Young Park et al: 2010). This device samples the air at ten second intervals and collects particles into six different size ranges: 0.3-0.5μm, 0.5-1.0μm, 1.0-3.0μm, 3.0-5.0μm, 5.0-10.0μm and greater than 10μm. The data was recorded as particles per cubic meter of air (pt/m3). The TSI Aerotrack is reported to have a size resolution of <15% at 0.5μm sizes of particles and a counting efficiency of ~50% for 0.3μm size particles and 100% counting efficiency for particles >0.45μm. It has a concentration limit of >2,000,000 particles/ft3
(56,634 particles/m3) at 5% coincidence loss. This device was positioned on the front of the manikin’s chest with the sampling port in the breathing zone. A Casella MicroDust Pro counter was also used to quantify respirable mass of particles and was positioned with the sampling port in the breathing zone of the manikin. The Casella Microdust Pro is a portable, real time ‘aerosol’ mass concentration analyser measuring from 1μg/m3 to 2500mg/m3 and within the size range of 0.1μm to 10μm. The measurement is based on an infrared light source of 880nm wavelength projected through the sampled volume. Contact with the particles causes the light to scatter, and the amount of scatter is proportional to the mass concentration measured using a photo detector. It has a resolution of 0.001mg/m3 (1μgm-3)
Using the TSI Aerotrack the presence of fairly high concentrations of airborne particles in each of the particle size ranges was determined with little difference when the compressed air was used. Similar trends in total particle mass were observed with the Casella MicroDust Pro over time supporting the findings of the TSI Aerotrack. It was concluded that sealing the test chamber and using a ventilation system to cleanse the air and maintain the chamber at a slight negative pressure would improve the likelihood of observing differences in particle concentrations when compressed air was used. Installation of the ventilation system consisted of replacing half the area of the test chamber wall behind the manikin with Technostat electrostatic filter material that would cleanse the air entering the room. The Technostat filters particles down to 0.05μm in size. The air in the test chamber was drawn from the room through a much smaller filter also made from Technostat via an extract plemum in the opposite wall. A Wilson flow grid was positioned beyond the extraction fan outside the test chamber and the volume air flow through the grid was monitored using a manometer. The volume air flow was adjusted using a choke on the grid to approximately 60m3/h. This gave approximately 2.2 air exchanges within the test chamber per hour. It was found that the operation of the ventilation system led to an approximate ten-fold reduction in particles in each of the different size ranges if operated for one hour prior to the use of the compressed air.
Further trials were then performed, as it appeared that the bulk of the MWF was visibly pushed off the metal component onto the floor when the compressed air was directed along one edge of the test piece placed at an angle. In order to determine the destination of the MWF when the compressed air was operated, a fluorescent marker (Tinopal) was added to the bulk MWF at a concentration of 1g/litre. The use of a UV lamp revealed that the majority of the fluid was pushed away from the test piece and
5
not up into the breathing zone. A variety of orientations of the test piece were tried but it was found that the majority of the fluid was pushed off to sides of the test piece as large droplets. Metal pieces with a variety of other geometries were tried including a metal test tube block with holes of approximately 5cm deep. It was concluded that this would maximise the pooling of fluid and thus give the greatest potential for MWF to travel up towards the breathing zone. Again, although fluid droplets were forced out of the holes no evidence of mist particles near the breathing zone was obtained.
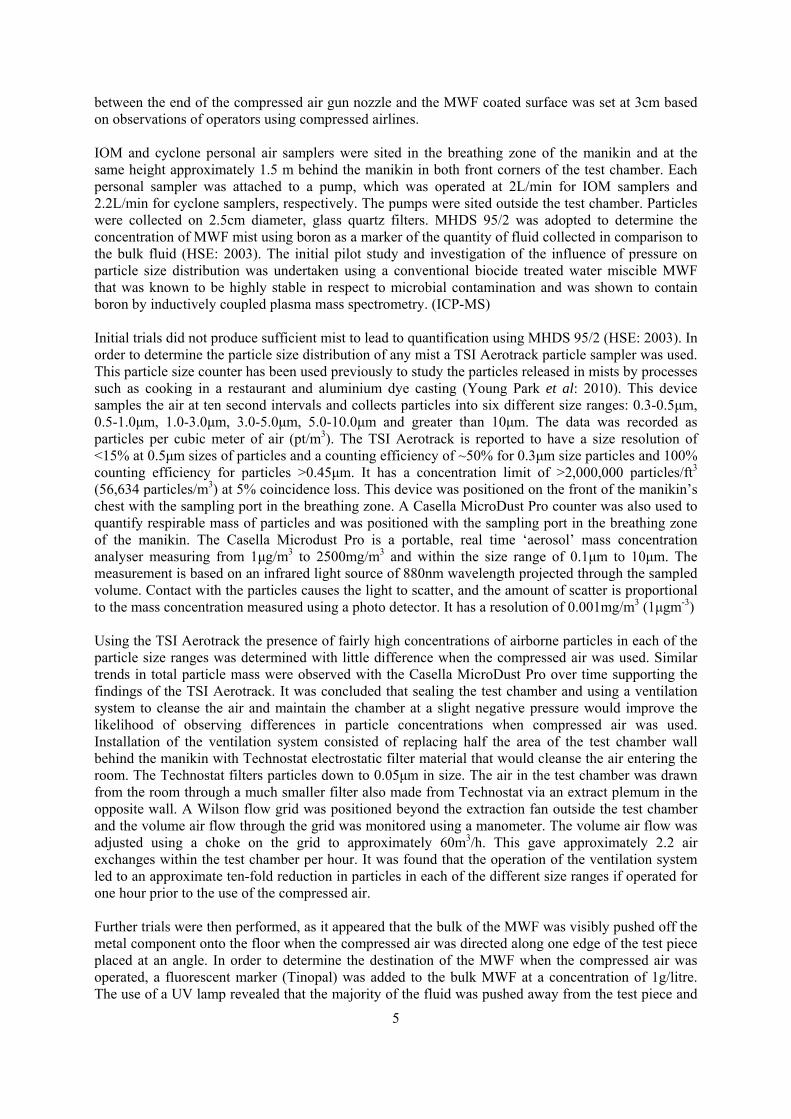
HSE has previously visited a site that used compressed air for cleaning and had the process photographed (Figure 3).
Figure 3a. Removal of MWF from a Figure 3b Removal of MWF from a steel flange in workplace machine bed
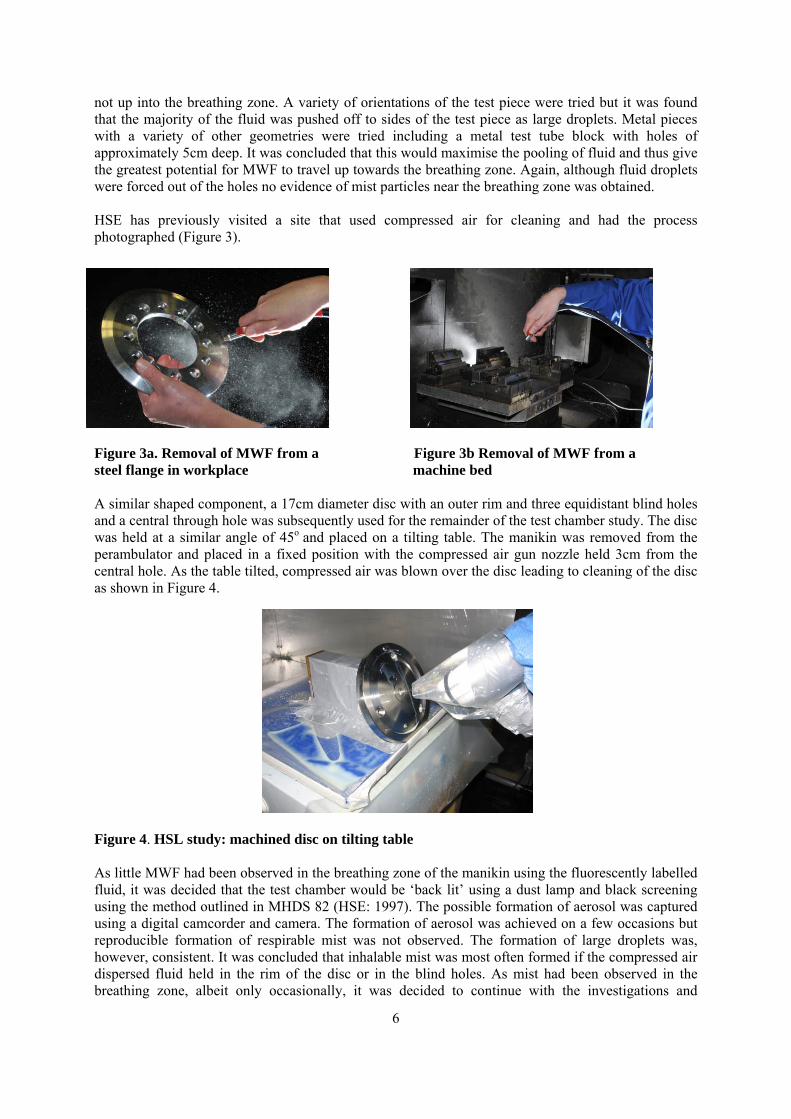
A similar shaped component, a 17cm diameter disc with an outer rim and three equidistant blind holes and a central through hole was subsequently used for the remainder of the test chamber study. The disc was held at a similar angle of 45o and placed on a tilting table. The manikin was removed from the perambulator and placed in a fixed position with the compressed air gun nozzle held 3cm from the central hole. As the table tilted, compressed air was blown over the disc leading to cleaning of the disc as shown in Figure 4.
Figure 4. HSL study: machined disc on tilting table
As little MWF had been observed in the breathing zone of the manikin using the fluorescently labelled fluid, it was decided that the test chamber would be ‘back lit’ using a dust lamp and black screening using the method outlined in MHDS 82 (HSE: 1997). The possible formation of aerosol was captured using a digital camcorder and camera. The formation of aerosol was achieved on a few occasions but reproducible formation of respirable mist was not observed. The formation of large droplets was, however, consistent. It was concluded that inhalable mist was most often formed if the compressed air dispersed fluid held in the rim of the disc or in the blind holes. As mist had been observed in the breathing zone, albeit only occasionally, it was decided to continue with the investigations and
6
perform a series of test runs in order to determine the potential for mist to be inhaled over an eight hour shift due to the use of compressed air.
2.2.2 Test run scenario
From information gained from industry, it was determined that a worker would clean his machine approximately thirty times in an eight hour shift. Each use of the compressed air would last from approximately 3 to 20 seconds. In order to mimic a representative work shift, a fixed process was followed for each test run that condensed the work shift into a 1.5 hour time period but allowed sufficient time for the majority of particles to settle between uses of the compressed air. As established in the pilot study, each test run commenced with the ventilation of the test chamber for 1 hour. The reduction in particle concentration in the manikin’s breathing zone was monitored by the TSI Aerotrack and the Casella Micro Dust Pro. Following the reduction in background levels, a series of thirty repeated tasks commenced and the personal IOM and cyclone samplers were activated. Each task consisted of showering the disc for 10 seconds (7.5ml of MWF) followed by activation of the compressed air for 15 seconds at a fixed distance of 3 cm from the tilting disc held at 45o. A delay of 2 minutes occurred before the process was repeated. After thirty tasks were completed the IOM and cyclone samplers were operated for a further 15 minutes, and the TSI Aerotrack and Casella particle counters were operated for a further 30 minutes to quantify any reduction in particle concentrations.
The initial test run scenario was performed to show the showering process did not influence the particle concentrations collected during the test runs and consisted of following the test run protocol but without the use of compressed air. Test runs to examine the influence of pressure on the particle size distribution and concentrations were undertaken at 2.2bar and 1.1bar. All test runs were performed in triplicate.
2.2.3 Body deposition monitoring
Following use of the Tinopal fluorescent marker in the pilot study, it was decided to use the tagged fluid to determine the surface deposition and to show whether any MWF accumulates in the manikin’s breathing zone during the test scenarios. Glass quartz filter papers of 9cm diameter were placed on the cheek and forearm of the manikin. Following each test run the filters were removed and placed in Petri dishes that were wrapped in foil. These were examined under UV light and photographed at the end of the study. Exposure of the whole manikin was investigated in the latter stage of the project. On these occasions, the manikin was cleaned and changed into fresh paper suits that had not been exposed to Tinopal, photographed under UV light before and after exposure to fluorescently tagged MWF following the test run scenario.
2.2.4 The role of microorganisms and their by-products on mist formation
Further experiments were performed, following the same test run scenario as described above, to examine the influence of microbial contamination on particle size distribution and the aerosolisation of endotoxin. A MWF that was known to be readily colonised by Gram negative bacteria was chosen. Fresh stocks of Pseudomonas pseudoalcaligenes, a Gram negative bacterium, were grown and used to inoculate the freshly prepared MWF. An equivalent number of bacteria were lysed by sonication and the addition of a lytic enzyme and added to equivalent freshly prepared fluid. Destruction of the bacteria was confirmed by examination under a microscope. To examine the impact of long-term bacterial cell death on the MWF, a sample of the fluid that had been used for a previous HSL project was utilised. This MWF was of the same type but had been inoculated weekly for three months with a variety of Gram negative bacteria and then allowed to stand for a further 12 months. This fluid was found to have low concentration of viable bacteria but high endotoxin levels. It was also noted that the fluid was more viscous than the freshly prepared MWF.
7

The TSI Aerotrack and Casella MicroDust Pro were utilised as previously described in Section 3.2.1 for the determination of particle size distribution and total respirable particles respectively. Airborne endotoxin was captured using IOM and cyclone personal samplers operated as previously described in Section 3.2.1. The concentration of both airborne endotoxin and in the bulk fluids was determined using the standard Limulus Amoebocyte Lysate (LAL) test (Cooper et al, 1972).
2.2.5 Analysis of data
In order to determine the accumulation of particles within each size range following each use of compressed air, the average ‘low’ background reading was deducted from each individual particle concentration measurement. The average ‘low’ background for each size range was the mean of the three particle concentrations immediately following the initial ventilation of the test chamber for one hour and just prior to the start of the thirty uses of compressed air. The summary graphs of particle count and analytical measurements represent the mean of three independent test run scenarios.
2.3 WORKPLACE STUDY During the test chamber study, an engineering firm willing to allow HSL to undertake experimental work using their machinery and compressed air lines was recruited. Following the laboratory simulation work it was considered essential to undertake work with compressed air operating at the higher pressures of 5-6bar (~80psi) reportedly used by industry, and which were not obtainable at HSL. It was also important to repeat the measurements undertaken in the test chamber, in a workplace under conditions that were more realistic. Presspart Manufacturing Ltd makes precision components mainly for the pharmaceutical industry and the factory has a pressing plant and two workshops that were deemed relatively clean during inspection by a HSE occupational hygiene inspector. The MWF used by the company visited was a water miscible MWF that is biostable and bactericide free.
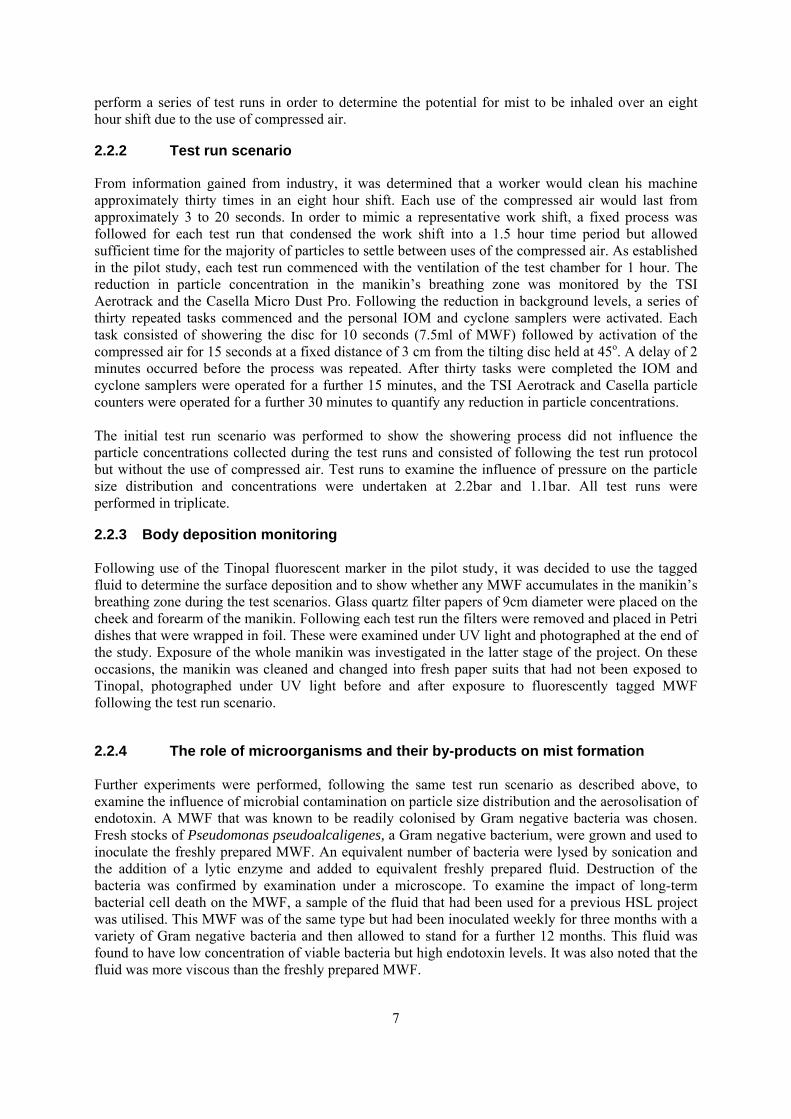
2.3.1 Assessment of airborne particles due to compressed air use The majority of the workplace study data was carried out in one of the workshops that had two lathes and four CNC machines. The latter were enclosed with LEV but the lathes were not under LEV. The TSI Aerotrack particle counter was initially operated for 30 minutes to establish the background levels of particles. The staff of Presspart Manufacturing Ltd kindly set up a lathe with a cylinder of metal and demonstrated how the flow of MWF was controlled. The compressed air gun attached to the lathe had a narrow nozzle of 2.5mm diameter as shown in Figure 5 and was normally operated at 5.4bar pressure. A gauge was placed in the airline just prior to the gun and it was established that the maximum pressure achievable was 5.4bar but this could be reduced using a valve. It was decided to focus on pressures of 5.4, 2.2 and 1.1bar. The area was ‘back lit’ using a dust lamp and a black background used to enhance contrast. The possibility of observing aerosols was confirmed by the use of a water sprayer that produced a cloud of fine droplets and aerosol. The cylinder of metal was initially coated with MWF and removed with compressed air set at 5.4bar pressure. A lot of splatter (large droplets pushed away from the cylinder) was observed but no aerosols. The compressed air was subsequently used to remove the MWF from the bed of the machine and again it was noted that the majority of the fluid was pushed away as large droplets by the jet of compressed air. However, small amounts of aerosol were observed when the air hit an edge that was angled at 45o.
Presspart Manufacturing Ltd produces components including flanges that were similar to those previously observed by HSE when investigating the use of compressed air. The flanges are 12.5cm in diameter with a large central hole and further holes in the outer ring. A flange acted as the test piece for the remainder of the workplace study. After coating it with fluid and removing the excess, the compressed air was used for a period of 15 seconds. During this time period the gun was held approximately 3cm from the disc and moved around the circumference of the disc approximately three times. Initially the test piece was held at a 45o angle to the titling table and different pressures of
8
1.1bar, 2.2bar and 5.4bar were examined for 15second periods as described above. The TSI Aerotrack was worn by the operator of the compressed air, with the sampling port in the breathing zone. For each run, the particle counter was operated for 5 minutes prior to the use of the compressed air, throughout the cleaning process and for 5 minutes after completion. Each test run was performed in triplicate. Further tests were performed to briefly examine the influence of angle on the possible formation of mist. The above process was repeated with the compressed air pressure set at 5.4bar. The disc was held horizontally, at 30o to the horizontal and at 45o to the horizontal. As previously, the particle concentrations were recorded with the TSI Aerotrack that was worn by the operator and filmed to capture any possible mist visually.
Figure 5. Compressed air gun with single narrow orifice
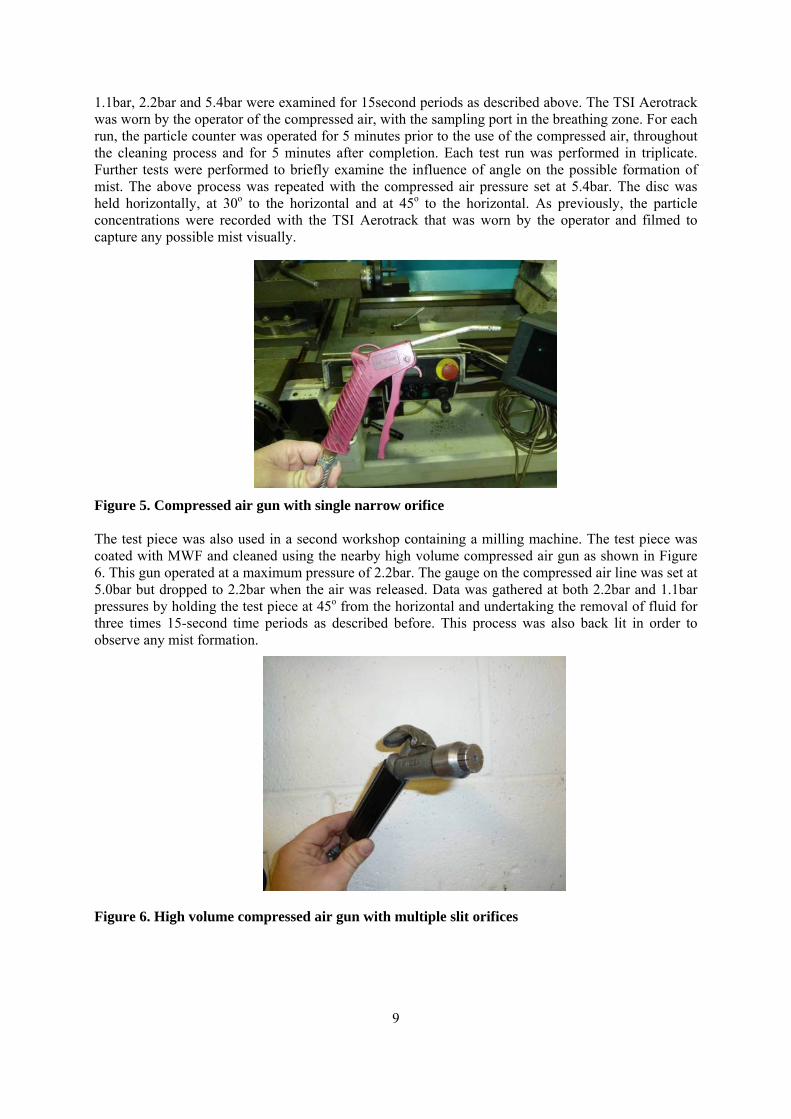
The test piece was also used in a second workshop containing a milling machine. The test piece was coated with MWF and cleaned using the nearby high volume compressed air gun as shown in Figure 6. This gun operated at a maximum pressure of 2.2bar. The gauge on the compressed air line was set at 5.0bar but dropped to 2.2bar when the air was released. Data was gathered at both 2.2bar and 1.1bar pressures by holding the test piece at 45o from the horizontal and undertaking the removal of fluid for three times 15-second time periods as described before. This process was also back lit in order to observe any mist formation.
Figure 6. High volume compressed air gun with multiple slit orifices
9
2.3.2 Assessment of skin deposition due to compressed air use
Skin deposition was examined using an HSL manikin when the narrow nozzle compressed air gun was used at 5.4bar and 2.2bar pressures. Similarly to the test chamber study, a volume of the MWF was collected and tagged with Tinopal fluorescent dye at a concentration of 1g/litre. Glass fibre filter papers of 12.5cm diameter were placed across the face of the HSL manikin, previously used in the test chamber study, and across the chest area and smaller 9cm filter papers were placed on the cheek and forearm. Each test run consisted of removing the MWF three times from the test piece as described in section 2.3.1. The filter papers were removed and kept in the dark for visualisation under UV light at HSL.
10
3.1
3. RESULTS
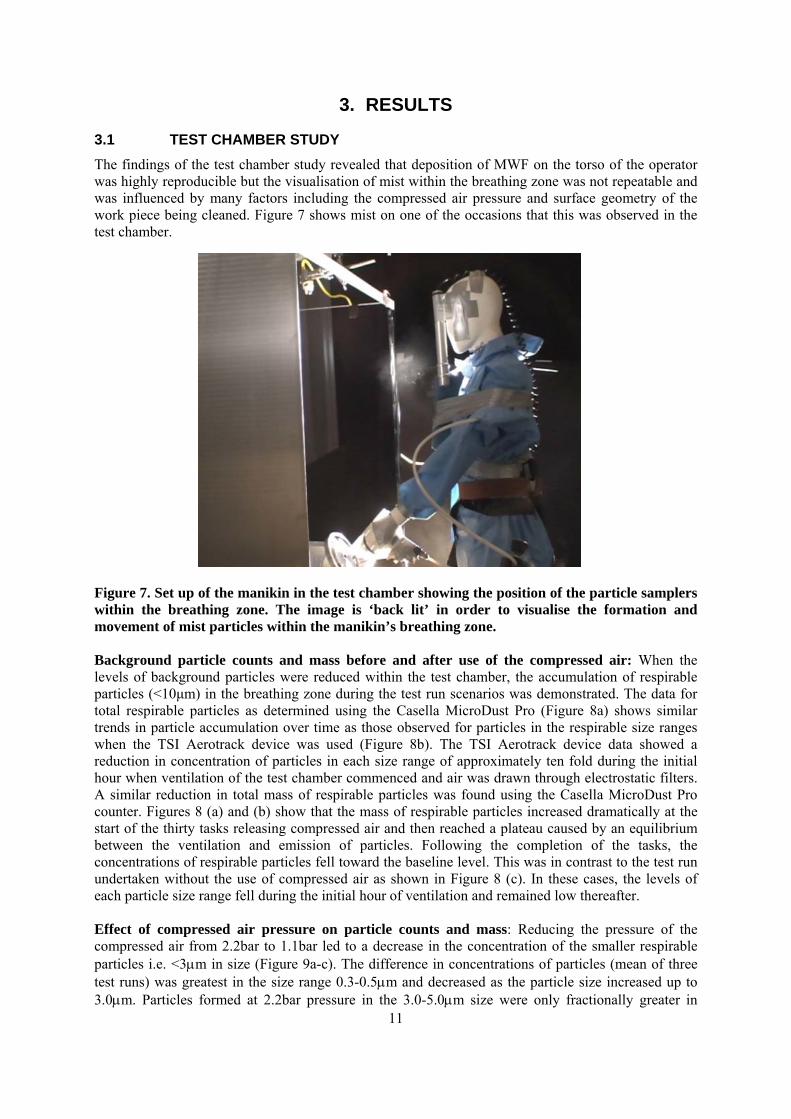
TEST CHAMBER STUDY The findings of the test chamber study revealed that deposition of MWF on the torso of the operator was highly reproducible but the visualisation of mist within the breathing zone was not repeatable and was influenced by many factors including the compressed air pressure and surface geometry of the work piece being cleaned. Figure 7 shows mist on one of the occasions that this was observed in the test chamber.
Figure 7. Set up of the manikin in the test chamber showing the position of the particle samplers within the breathing zone. The image is ‘back lit’ in order to visualise the formation and movement of mist particles within the manikin’s breathing zone.
Background particle counts and mass before and after use of the compressed air: When the levels of background particles were reduced within the test chamber, the accumulation of respirable particles (<10μm) in the breathing zone during the test run scenarios was demonstrated. The data for total respirable particles as determined using the Casella MicroDust Pro (Figure 8a) shows similar trends in particle accumulation over time as those observed for particles in the respirable size ranges when the TSI Aerotrack device was used (Figure 8b). The TSI Aerotrack device data showed a reduction in concentration of particles in each size range of approximately ten fold during the initial hour when ventilation of the test chamber commenced and air was drawn through electrostatic filters. A similar reduction in total mass of respirable particles was found using the Casella MicroDust Pro counter. Figures 8 (a) and (b) show that the mass of respirable particles increased dramatically at the start of the thirty tasks releasing compressed air and then reached a plateau caused by an equilibrium between the ventilation and emission of particles. Following the completion of the tasks, the concentrations of respirable particles fell toward the baseline level. This was in contrast to the test run undertaken without the use of compressed air as shown in Figure 8 (c). In these cases, the levels of each particle size range fell during the initial hour of ventilation and remained low thereafter.
Effect of compressed air pressure on particle counts and mass: Reducing the pressure of the compressed air from 2.2bar to 1.1bar led to a decrease in the concentration of the smaller respirable particles i.e. <3μm in size (Figure 9a-c). The difference in concentrations of particles (mean of three test runs) was greatest in the size range 0.3-0.5μm and decreased as the particle size increased up to 3.0μm. Particles formed at 2.2bar pressure in the 3.0-5.0μm size were only fractionally greater in
11

concentration than those formed at 1.1bar, and at particle sizes >5.0μm no differences in particle concentrations were observed. The findings were corroborated by the data for total respirable particles as shown in Figure 9d and with the results of the boron marker analyses for mist concentration as determined by MHDS 95/2 (Table 1). The full set of data collected with the TSI Aerotrack are summarised in the Appendix.
Figure 8a, b & c: Effect of compressed airline use on measurement with time of: a) MWF particle mass using a Cassella counter; b) MWF particle (pt) concentration using AeroTrak and showing the results for one size class of particles;
12
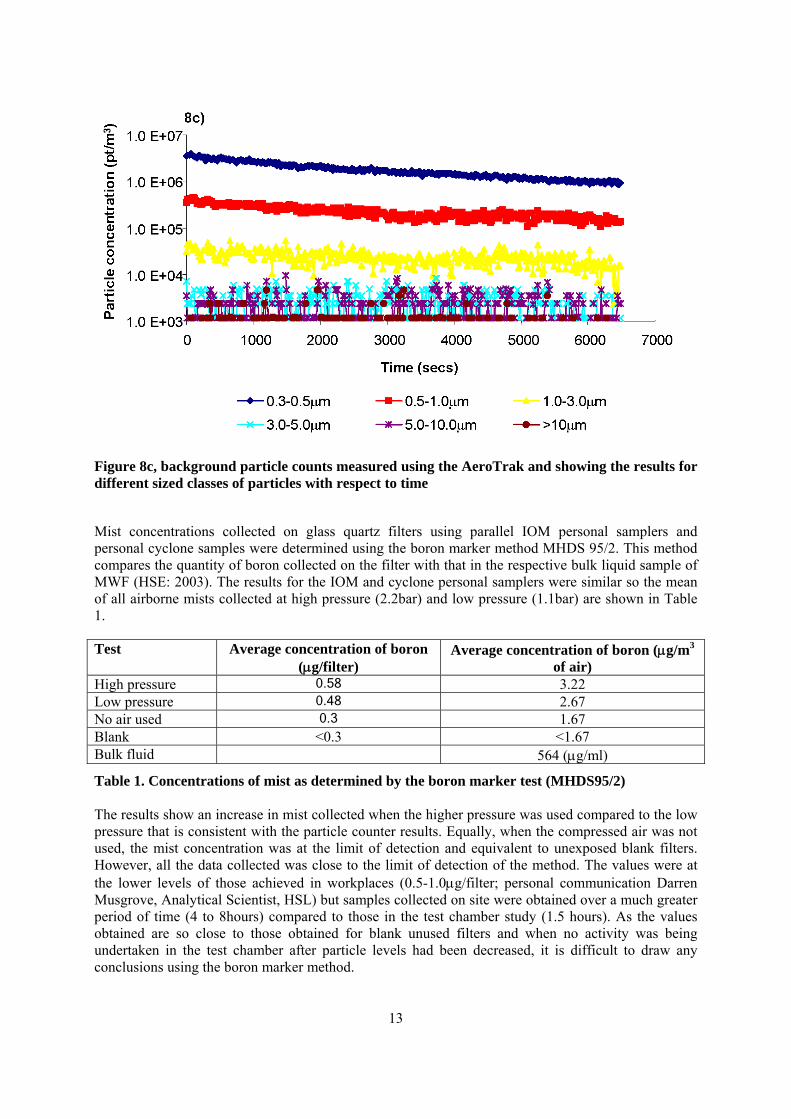
Figure 8c, background particle counts measured using the AeroTrak and showing the results for different sized classes of particles with respect to time
Mist concentrations collected on glass quartz filters using parallel IOM personal samplers and personal cyclone samples were determined using the boron marker method MHDS 95/2. This method compares the quantity of boron collected on the filter with that in the respective bulk liquid sample of MWF (HSE: 2003). The results for the IOM and cyclone personal samplers were similar so the mean of all airborne mists collected at high pressure (2.2bar) and low pressure (1.1bar) are shown in Table 1.
Test Average concentration of boron (μg/filter)
Average concentration of boron (μg/m3
of air) High pressure 0.58 3.22 Low pressure 0.48 2.67 No air used 0.3 1.67 Blank <0.3 <1.67 Bulk fluid 564 (μg/ml)
Table 1. Concentrations of mist as determined by the boron marker test (MHDS95/2)
The results show an increase in mist collected when the higher pressure was used compared to the low pressure that is consistent with the particle counter results. Equally, when the compressed air was not used, the mist concentration was at the limit of detection and equivalent to unexposed blank filters. However, all the data collected was close to the limit of detection of the method. The values were at the lower levels of those achieved in workplaces (0.5-1.0μg/filter; personal communication Darren Musgrove, Analytical Scientist, HSL) but samples collected on site were obtained over a much greater period of time (4 to 8hours) compared to those in the test chamber study (1.5 hours). As the values obtained are so close to those obtained for blank unused filters and when no activity was being undertaken in the test chamber after particle levels had been decreased, it is difficult to draw any conclusions using the boron marker method.
13

The pressure of the compressed air was also shown to have an impact on the dermal exposure of the manikin. It was found that the levels of deposition on the filter papers was less on the forearm and cheek when the pressure used for the test run scenario was 1.1bar compared to 2.2bar, with no deposition if compressed air was not used. This is shown in Figure 10(a-h).
Figure 9a & b: Measurement of background fine and ultrafine particle counts using the AeroTrak with the compressed airline on low (1.1bar) and high (2.2 bar) pressure showing the distribution with time of the aerosol particles of the size class; a) 0.3-0.5μm; b) 0.5-1.0μm.
14

Figure 9c & d: Measurement of particle counts using the AeroTrak with the compressed airline on low (1.1 bar) and high (2.2 bar) pressure showing the distribution with time of the aerosol particles of (c) the size class 1.0-3.0μm; and (d) total respirable particle mass using the Cassella counter.
15
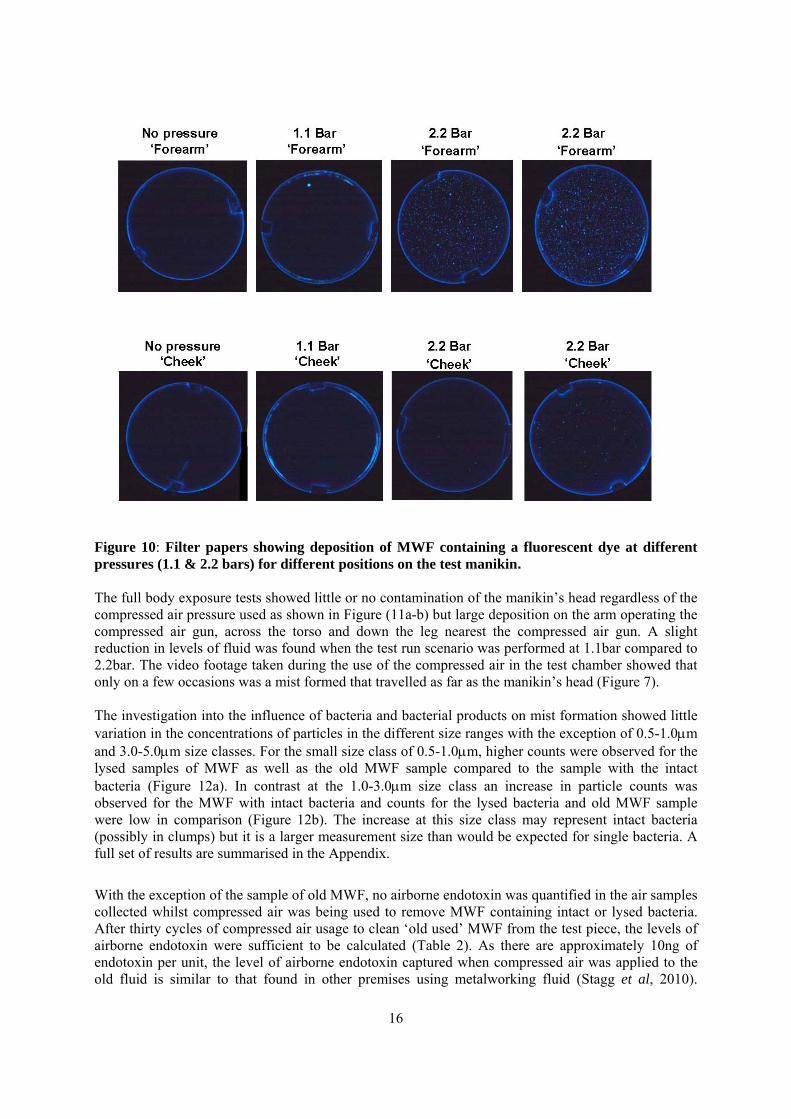
Figure 10: Filter papers showing deposition of MWF containing a fluorescent dye at different pressures (1.1 & 2.2 bars) for different positions on the test manikin.
The full body exposure tests showed little or no contamination of the manikin’s head regardless of the compressed air pressure used as shown in Figure (11a-b) but large deposition on the arm operating the compressed air gun, across the torso and down the leg nearest the compressed air gun. A slight reduction in levels of fluid was found when the test run scenario was performed at 1.1bar compared to 2.2bar. The video footage taken during the use of the compressed air in the test chamber showed that only on a few occasions was a mist formed that travelled as far as the manikin’s head (Figure 7).
The investigation into the influence of bacteria and bacterial products on mist formation showed little variation in the concentrations of particles in the different size ranges with the exception of 0.5-1.0μm and 3.0-5.0μm size classes. For the small size class of 0.5-1.0μm, higher counts were observed for the lysed samples of MWF as well as the old MWF sample compared to the sample with the intact bacteria (Figure 12a). In contrast at the 1.0-3.0μm size class an increase in particle counts was observed for the MWF with intact bacteria and counts for the lysed bacteria and old MWF sample were low in comparison (Figure 12b). The increase at this size class may represent intact bacteria (possibly in clumps) but it is a larger measurement size than would be expected for single bacteria. A full set of results are summarised in the Appendix.
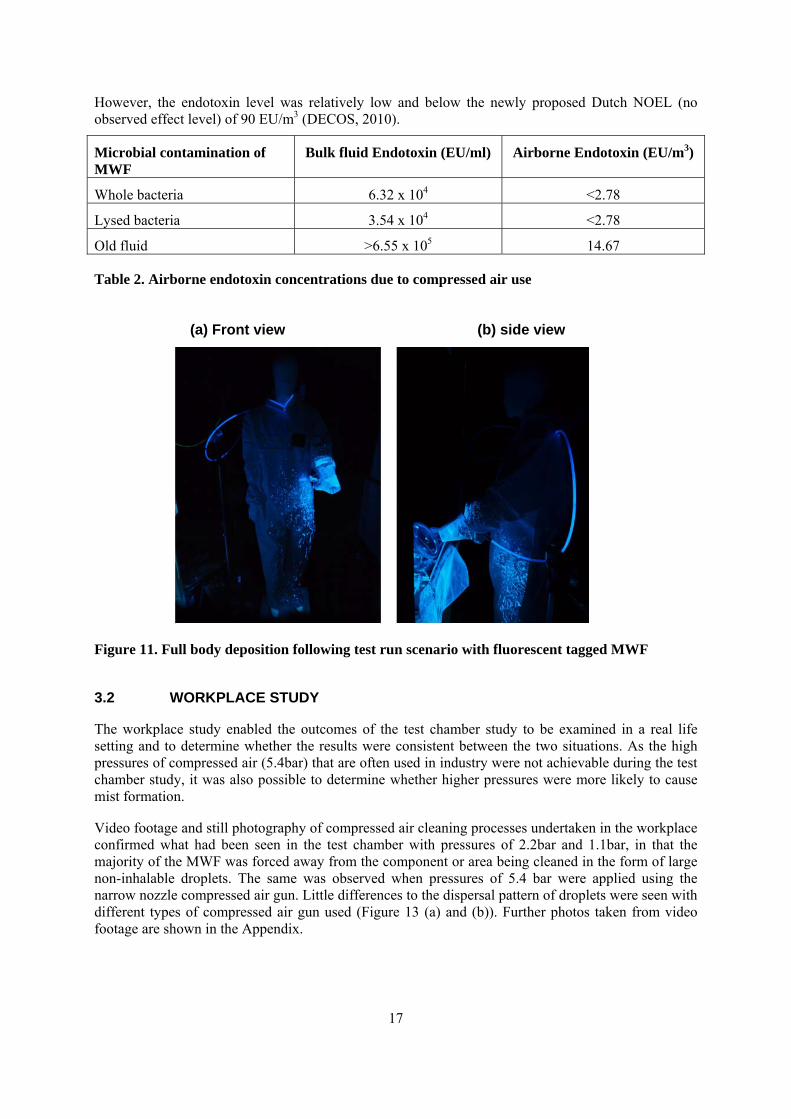
With the exception of the sample of old MWF, no airborne endotoxin was quantified in the air samples collected whilst compressed air was being used to remove MWF containing intact or lysed bacteria. After thirty cycles of compressed air usage to clean ‘old used’ MWF from the test piece, the levels of airborne endotoxin were sufficient to be calculated (Table 2). As there are approximately 10ng of endotoxin per unit, the level of airborne endotoxin captured when compressed air was applied to the old fluid is similar to that found in other premises using metalworking fluid (Stagg et al, 2010).
16
3.2
However, the endotoxin level was relatively low and below the newly proposed Dutch NOEL (no observed effect level) of 90 EU/m3 (DECOS, 2010).
Microbial contamination of MWF
Bulk fluid Endotoxin (EU/ml) Airborne Endotoxin (EU/m3)
Whole bacteria 6.32 x 10⁴ <2.78
Lysed bacteria 3.54 x 10⁴ <2.78
Old fluid >6.55 x 10⁵ 14.67
Table 2. Airborne endotoxin concentrations due to compressed air use
(a) Front view (b) side view
Figure 11. Full body deposition following test run scenario with fluorescent tagged MWF
WORKPLACE STUDY
The workplace study enabled the outcomes of the test chamber study to be examined in a real life setting and to determine whether the results were consistent between the two situations. As the high pressures of compressed air (5.4bar) that are often used in industry were not achievable during the test chamber study, it was also possible to determine whether higher pressures were more likely to cause mist formation.
Video footage and still photography of compressed air cleaning processes undertaken in the workplace confirmed what had been seen in the test chamber with pressures of 2.2bar and 1.1bar, in that the majority of the MWF was forced away from the component or area being cleaned in the form of large non-inhalable droplets. The same was observed when pressures of 5.4 bar were applied using the narrow nozzle compressed air gun. Little differences to the dispersal pattern of droplets were seen with different types of compressed air gun used (Figure 13 (a) and (b)). Further photos taken from video footage are shown in the Appendix.
17
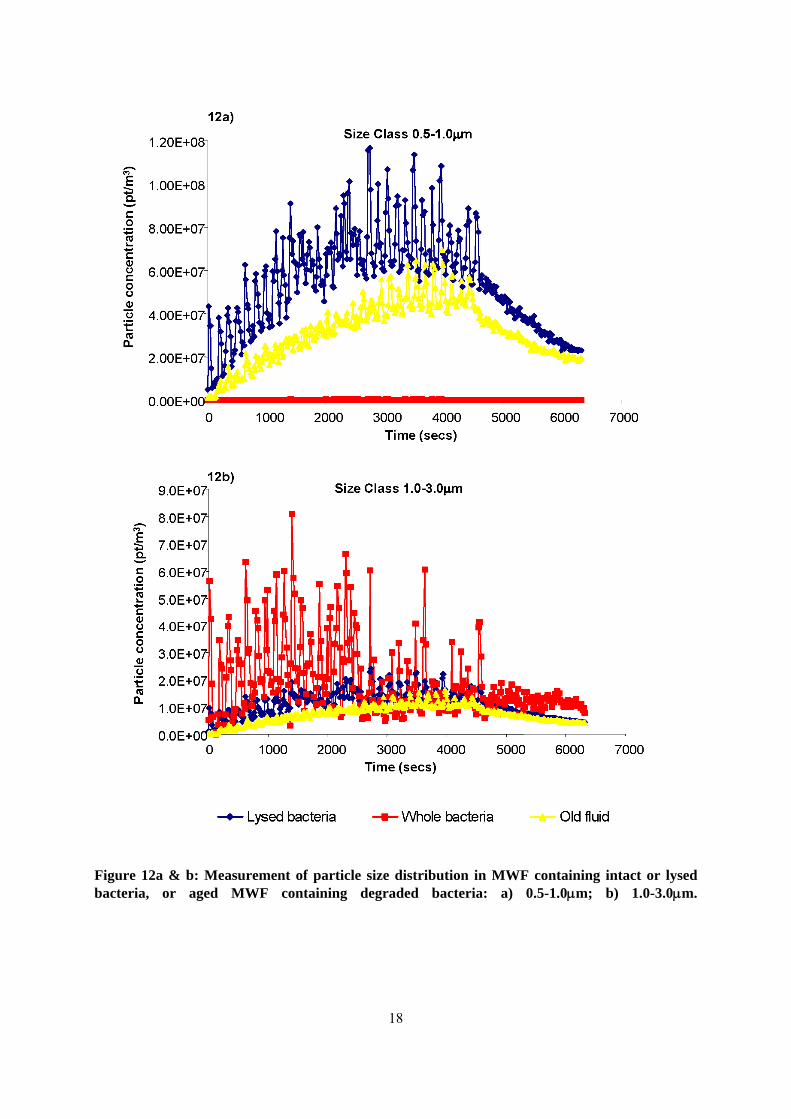
Figure 12a & b: Measurement of particle size distribution in MWF containing intact or lysed bacteria, or aged MWF containing degraded bacteria: a) 0.5-1.0μm; b) 1.0-3.0μm.
18
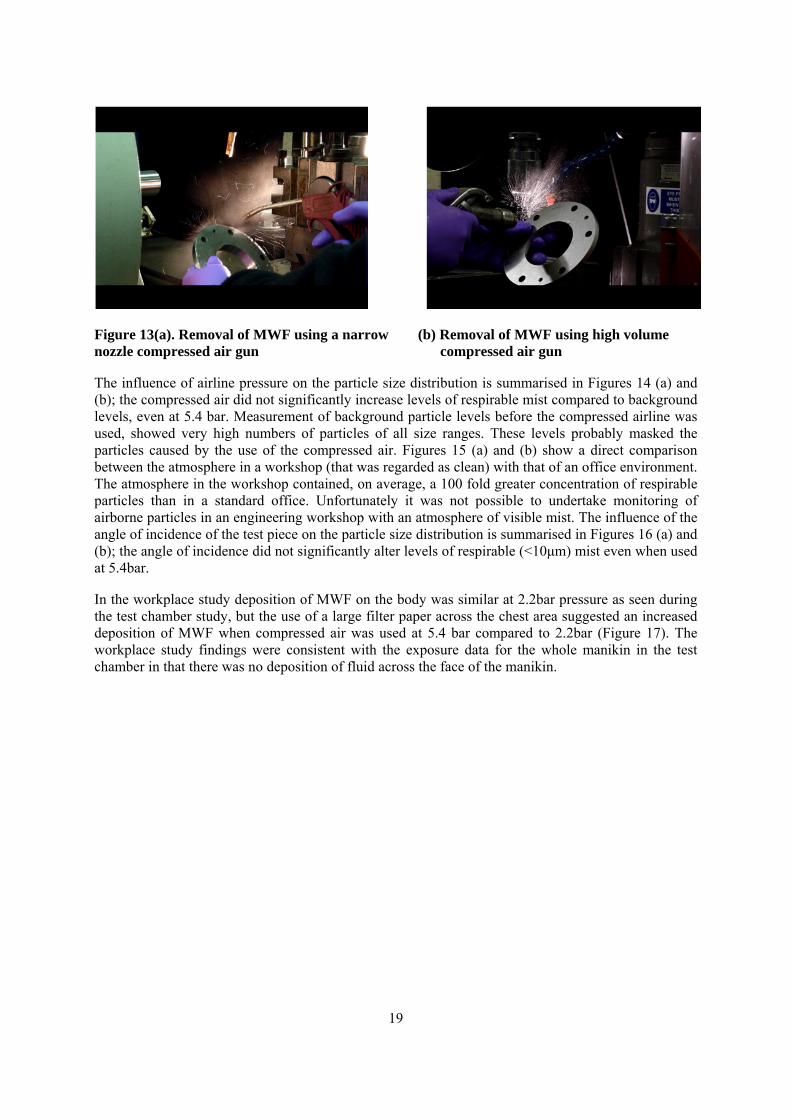
Figure 13(a). Removal of MWF using a narrow (b) Removal of MWF using high volume nozzle compressed air gun compressed air gun
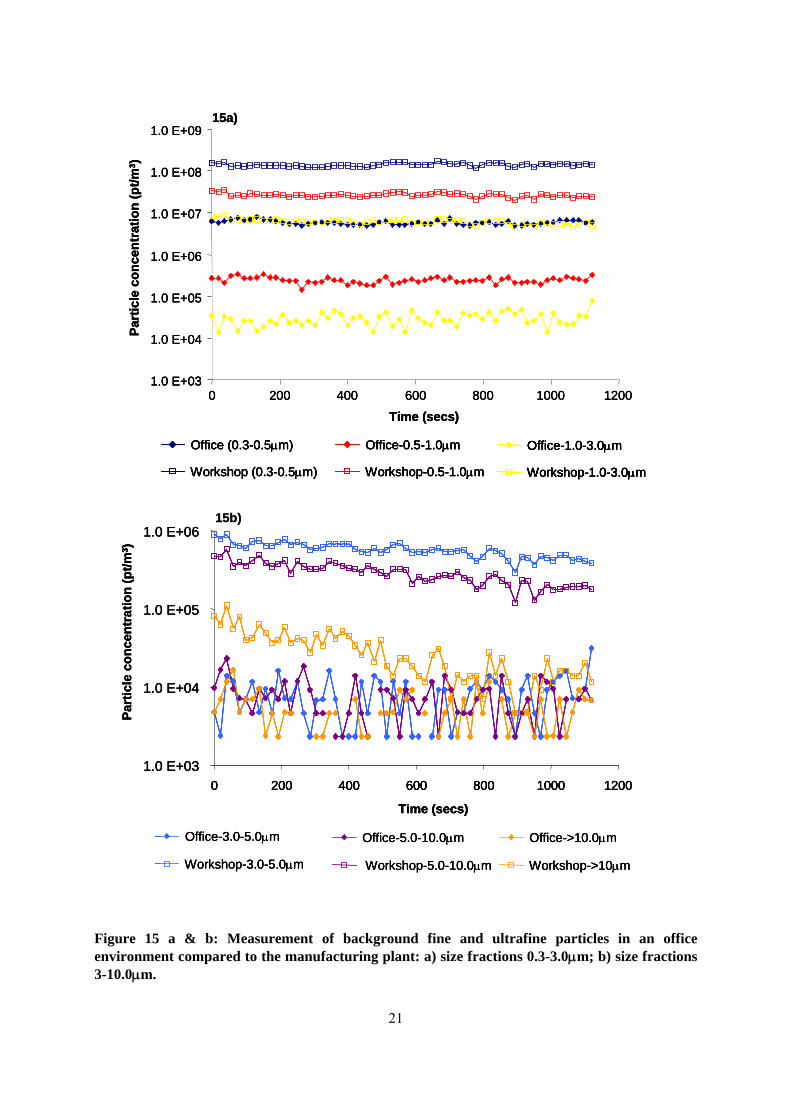
The influence of airline pressure on the particle size distribution is summarised in Figures 14 (a) and (b); the compressed air did not significantly increase levels of respirable mist compared to background levels, even at 5.4 bar. Measurement of background particle levels before the compressed airline was used, showed very high numbers of particles of all size ranges. These levels probably masked the particles caused by the use of the compressed air. Figures 15 (a) and (b) show a direct comparison between the atmosphere in a workshop (that was regarded as clean) with that of an office environment. The atmosphere in the workshop contained, on average, a 100 fold greater concentration of respirable particles than in a standard office. Unfortunately it was not possible to undertake monitoring of airborne particles in an engineering workshop with an atmosphere of visible mist. The influence of the angle of incidence of the test piece on the particle size distribution is summarised in Figures 16 (a) and (b); the angle of incidence did not significantly alter levels of respirable (<10μm) mist even when used at 5.4bar.
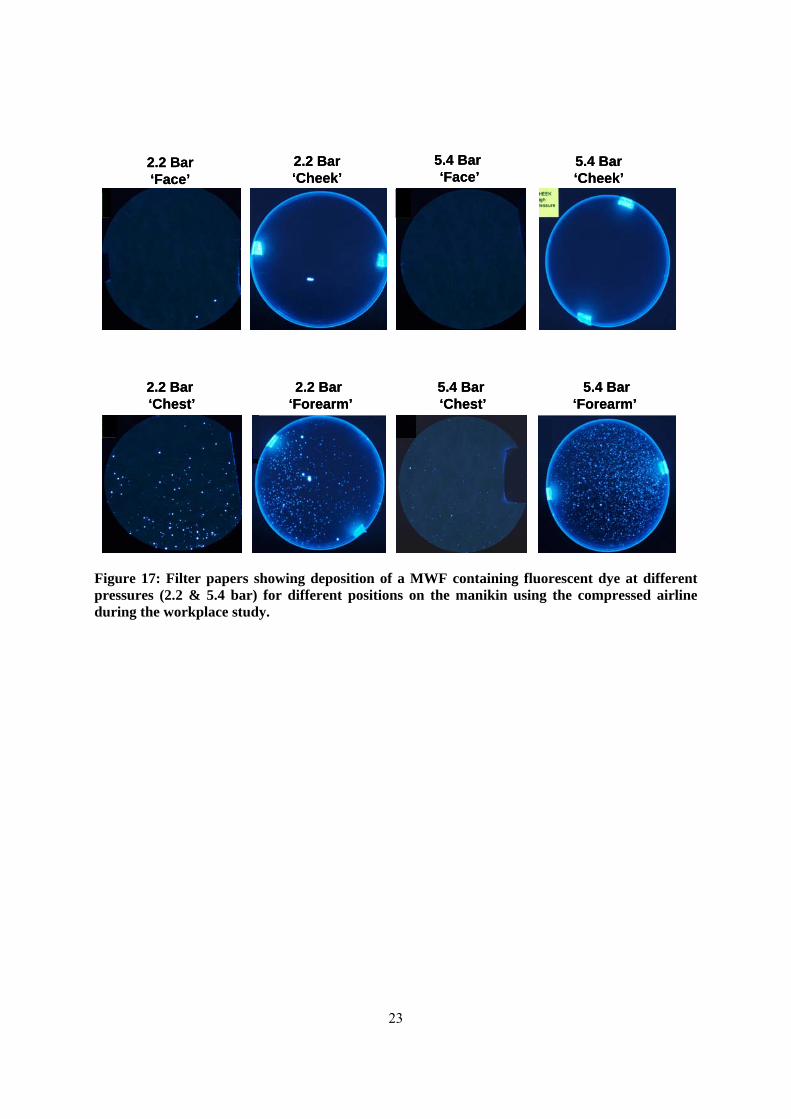
In the workplace study deposition of MWF on the body was similar at 2.2bar pressure as seen during the test chamber study, but the use of a large filter paper across the chest area suggested an increased deposition of MWF when compressed air was used at 5.4 bar compared to 2.2bar (Figure 17). The workplace study findings were consistent with the exposure data for the whole manikin in the test chamber in that there was no deposition of fluid across the face of the manikin.
19

Part
iPa
rtic
lclee
coconcnc
enenttrr
ati
atioo
nn ((pp
t/t/mm33 ))
1.0 E+091.0 E+09 1414a)a)
1.0 E+081.0 E+08
1.0 E+071.0 E+07
1.0 E+061.0 E+06
1.0 E+051.0 E+05 00 110000 220000 330000 404000 550000
TTiime (me (sesecs)cs) 660000 770000 880000
babackckgrounground (0.d (0.33-0.-0.55μμm)m) backbackgrgroound (und (0.5-0.5-11..00μμm)m) bbaackckggrrouound (1.nd (1.00--33.0.0μμm)m) 5.5.44 bar (0.bar (0.3-0.3-0.55μμm)m) 5.5.4 b4 bar (ar (00..5-1.5-1.00μμm)m) 55..4 ba4 barr (1.(1.00--3.03.0μμm)m) 2.2.22 bar (0.bar (0.3-0.3-0.55μμm)m) 2.2.2 b2 bar (ar (00..5-1.5-1.00μμm)m) 22..2bar (1.2bar (1.0-3.0-3.00μμm)m)
1.1.11 bar (0.bar (0.3-0.3-0.55μμm)m) 1.1.1 b1 bar (ar (00..5-1.5-1.00μμm)m) 11..1 ba1 barr (1.(1.00--3.03.0μμm)m)
1.1.00 E+E+0707 14b14b))
PPaart
irt
icclele
ccoonn
cceenntt
rraattioio
n (
n (pp
t/mt/m33 ))
1.1.00 E+E+0606
1.1.00 E+E+0505
1.1.00 E+E+0404
1.1.00 E+E+030300 100100 220000 300300 404000 550000
TimTimee ((ssecs)ecs) 600600 707000 880000
backbackgroundground ((33..0-5.0-5.00μμm)m) babackgrckgroounundd ((55..0-0-110.0.00μμm)m) bbackackggrrouound (>10.0nd (>10.0μμm)m) 5.5.4 bar4 bar ((33..0-5.0-5.00μμm)m) 55..4 ba4 barr (5.(5.00--110.0.00μμm)m) 55..4 ba4 barr (>10(>10..00μμm)m) 2.2.22 bar (3.bar (3.0-5.0-5.00μμm)m) 22..2 ba2 barr (5.(5.00--110.0.00μμm)m) 22..2 ba2 barr (>10(>10..00μμm)m) 1.1.1 bar1 bar ((33..0-5.0-5.00μμm)m) 11..1 ba1 barr (5.(5.00--110.0.00μμm)m) 11..1 ba1 barr (>10(>10..00μμm)m)
Figure 14 a & b: Effect of compressed airline pressure on the distribution of aerosol particle size for three different sized ranges of particles: a) Size fractions 0.3-3.0μm; b) size fractions 3-10.0μm.
20
1115a)5a)5a)1.1.1.0 E+00 E+00 E+0999
1.1.1.0 E+00 E+00 E+0888
1.1.1.0 E+00 E+00 E+0777
1.1.1.0 E+00 E+00 E+0666
1.1.1.0 E+00 E+00 E+0555
1.1.1.0 E+00 E+00 E+0444
1.1.1.0 E+00 E+00 E+0333 000 200200200 404040000 600600600 800800800 100010001000 111200200200
TiTiTimmme (e (e (secssecssecs)))
OffOffOffOffiiiicccceeee (0(0(0(0.3.3.3.3-0-0-0-0.5.5.5.5μμμμm)m)m)m) OffOffOffOffiiiicccceeee----0000.5.5.5.5-1-1-1-1.0.0.0.0μμμμmmmm OfOfOfOfOffififififice-1.ce-1.ce-1.ce-1.ce-1.00000-----33333.0.0.0.0.0μμμμμmmmmm
WWWWoooorrrrkkkksssshhhhoooopppp (0(0(0(0.3.3.3.3----0000.5.5.5.5μμμμm)m)m)m) WWWWororororkkkkshshshshop-op-op-op-0.5-0.5-0.5-0.5-1.1.1.1.0000μμμμmmmm WWWWWooooorrrrrkkkkkssssshop-hop-hop-hop-hop-1.01.01.01.01.0-----3.3.3.3.3.00000μμμμμmmmmm
1515bb))1.1.1.0 E+00 E+00 E+0666
1.1.1.0 E+00 E+00 E+0555
1.1.1.0 E+00 E+00 E+0444
1.1.1.0 E+00 E+00 E+0333 0000 200200200200 400400400400 606060600000 800800800800 1010101000000000 1200120012001200
TiTiTimmme (e (e (secssecssecs)))
OffOffOffiiiccceee-3-3-3.0-.0-.0-555.0.0.0μμμmmm OOOffffffiiice-5.ce-5.ce-5.000-10.0-10.0-10.0μμμmmm OfOfOffifificcce->e->e->10.10.10.000μμμmmm
WWWooorrrkkkshop-3.shop-3.shop-3.000-5.0-5.0-5.0μμμmmm WWWooorrrkkkshop-shop-shop-5.5.5.0-100-100-10.0.0.0μμμmmm WWWooorrrkkkssshop-hop-hop->10>10>10μμμmmm
Figure 15 a & b: Measurement of background fine and ultrafine particles in an office environment compared to the manufacturing plant: a) size fractions 0.3-3.0μm; b) size fractions 3-10.0μm.
Part
Part
Part
iiiclclcle
conc
ene
conc
ene
conc
entr
atr
atr
atttiiio
nonon (((ppp
t/t/t/mmm333 )))
Part
Part
Part
iiicccllle
con
cee
conc
ee
conc
ennntrtrtr
ati
ati
atio
n (p
ton
(pt
on (p
t///mmm333 )))
21

1616a)a)1.0 E1.0 E++0909
1.0 E1.0 E++0808
1.0 E1.0 E++0707
1.0 E1.0 E++0606
AAnglnglee 00oo (0.3-0.5(0.3-0.5μμm)m) AAnglngle 0e 0oo (0.5-1(0.5-1.0.0μμm)m) Angle 0Angle 0oo (1.0-3.0(1.0-3.0μμm)m) AnAngglle 30e 30oo (0.3-0(0.3-0.5.5μμm)m) AAnglngle 30e 30oo (0(0.5.5-1.0-1.0μμm)m) AngAnglle 30e 30oo (1.0-3.0(1.0-3.0μμm)m)
AnAngglle 45e 45oo (0.3-0.5(0.3-0.5μμm)m) AAnglngle 45e 45oo (0(0.5.5-1.0-1.0μμm)m) AngAnglle 45e 45oo (1.0-3.0(1.0-3.0μμm)m)
16b)16b)1.1.0 E+0 E+0077
1.1.0 E+0 E+0066
1.1.0 E+0 E+0055
1.1.0 E+0 E+0044
1.1.0 E+0 E+0033
AAnglnglee 00oo (3.0-(3.0-55..00μμmm AnAnglgle 0e 0oo (5.0-(5.0-110.0.00μμm)m) Angle 0Angle 0oo (>1(>100.0.0μμm)m) AnAngglle 30e 30oo (3.0-5.0(3.0-5.0μμm)m) AnAnglgle 3e 300oo (5.0-1(5.0-10.00.0μμm)m) AngAnglle 30e 30oo (>10.0(>10.0μμm)m) AnAngglle 45e 45oo (3.0-5.0(3.0-5.0μμm)m) AnAnglgle 4e 455oo (5.0-1(5.0-10.00.0μμm)m) AngAnglle 45e 45oo (>10.0(>10.0μμm)m)
Figure 16 a & b: Changes to particle counts measured using the AeroTrak in response to angle of incidence of the test piece to the compressed airline (5.4bar); showing the results for different sized classes of particles with respect to time: a) 0.3-3.0μm sizes; b) 3.0->10μm sizes.
22
PPaartrt
iciclele
ccoon
cncenen
trat
iotr
atio
nn (p(p
t/mt/m33 ))
Part
icle
co
Part
icle
conn
cceennt
ratio
trat
ionn
(p(pt/t/mm
33 ))
00 5050 100100 151500 202000 225500 303000 353500 404000 TiTime (seme (secs)cs)
00 5050 101000 115050 220000 252500 330000 353500 440000
Time (sTime (secsecs))
2.2. 2.2 Bar2 Bar 2. 5.2 Bar2 Bar 5. 5.4 Bar4 Bar 5.4 Bar4 Bar ‘‘FF ‘ace’ace’ ‘CC ‘heek’heek’ ‘FF ‘ace’ace’ ‘CCheek’heek’
2.2.2 Bar2 Bar 2.2. 5.2 Bar2 Bar 5. 5.4 Bar4 Bar 5.4 Bar4 Bar ‘‘CChest’hest’ ‘‘ForForearearmm ‘’’ ‘CC ‘hest’hest’ ‘ForForearearmm’’
Figure 17: Filter papers showing deposition of a MWF containing fluorescent dye at different pressures (2.2 & 5.4 bar) for different positions on the manikin using the compressed airline during the workplace study.
23
4. CONCLUSIONS AND DISCUSSION
This study has shown that the likelihood of deposition of MWF potentially contaminated with fines across the torso and arms of the operator is more likely than mist particles occurring in the breathing zone when compressed air is used for cleaning. Evidence was obtained that mists of respirable particles (<10μm) can be produced when compressed air is used but this required specific conditions in a test chamber in which background air particle levels were reduced by filtering intake air. The limitation of the test chamber work was that the levels of compressed air pressure obtained were less than that achieved by industrial compressed air systems; the use of a fixed manikin also did not reproduce all of the variables that may apply when compressed airlines are used by workers. The benefit of using the test chamber was that air sampling, and the particle counting methods, were optimised prior to their application in a workplace.
The following outcomes were obtained in this study but these need to be considered with respect to limitations in the design aspects of some parts of the work undertaken.
The clearest finding from this study was the frequent spread of droplets of MWF across the arm and lower torso of the operator. Use of the fluorescent tracking dye provided a very sensitive method to trace the movement and deposition of these particles across the body. Quantifying deposition of this dye using a fluorescence detector could further increase the value of this qualitative method. The deposition of the MWF was particularly heavy across the arm and hand operating the compressed airline. Typically machine operators do not wear protective gloves when using compressed airlines and one factor mitigating against their use is concern that gloves can snag in moving machinery. Despite this there clearly is a need to provide the arm and body torso with protection from exposure to metal working fluids when compressed airlines are being used. This evidence also points to the importance of staff wearing protective clothing since there is a risk of significant contamination of personal clothing. There is also the risk that protective clothing soaked in MWF will act a reservoir holding MWF in contact with the skin for prolonged periods. Contact with used MWFs also carries with it the risk from exposure to microbial toxins as well as soluble metal ions and fines. These factors may all contribute to the risk for contact dermatitis.
In most circumstances compressed air forced droplets of MWF in the opposite direction to the operator. However, when MWF was forced against an edge or closed opening, a fluid spray was forced back towards the operator. The particle size sampler (TSI Aerotrack) and particle mass sampler (Casella MicroDust Pro) demonstrated similar patterns of particle counts (for specific size classes) and particle mass. On some occasions, a fine mist was recorded moving upwards to the head of the manikin, and corresponding to this the particle samplers detected a large increase in numbers of fine particles. The results from the TSI AeroTrack sampler showed the largest increases for particles smaller than 3.0μm diameter, which is well within the respirable range.
Based on the total of 30 individual compressed air cycles sufficient MWF was captured by the personal air sampling to quantify MWF exposure but the values recorded were at the lower limits of detection for this assay. The Casella counter provided a measure of the mass of the MWF within the respirable range but further work may be required to validate its specific use as means to monitor MWF mists. Similar considerations apply to the TSI Aerotrack monitor, which has been used to release of respirable oil and water particles (Young Park et al: 2010).
Whilst filtration of the test chamber air lowered background particle counts sufficiently to demonstrate mist production under specific circumstances using particle counters, the high background levels of particles in the workplace prevented clear resolution of any mist generated due to the use of compressed airline. The high concentrations of particles within the workshops visited during the workplace study effectively masked the measurement of particles formed during the compressed air cleaning process. Particle counters may be of use in assessing the general levels of airborne exposure
24
and control of mist generation, but these results suggest that high background particle levels in such plants may not allow the formation of mist to be attributed to a particular task or machine. The particle concentration was almost 100 fold greater in the workshops visited than a clean office environment and these were perceived as clean and well-managed areas. The numbers of respirable particles (<10μm) in the workplace visited was high in comparison to an office environment and this workshop was well managed and no visible mist was present. It needs to be established what concentrations of respirable particles are present in circumstances where mists are visible as has been observed previously in other factories.
Whilst the presence of bacteria or bacterial products did not fundamentally alter the number and size distribution of aerosol particles, it was found that when an old MWF heavily contaminated with bacteria was used, respirable endotoxin (<10μm) was detected (~15 EU/m3). Other studies have reported on the risk that the small respirable constituents of MWF contain endotoxin (Wang et al 2007), and shown concentrations of respirable endotoxin varying from <0.4EU / m3 to 1.4 x 10³EU / m3 in workplaces (Passman & Rossmoore: 2002).
With regard to the impact of bacterial contamination on the formation of respirable (<10μm) mists it was not found that compressed air disrupted intact bacteria or that the presence of bacterial constituents increased the formation of smaller particles. Evidence has been published that high rotational speeds in machining equipment produce fine mists of MWF and that average diameter of these particles decreases when bacteria are added to the fluids. The diameter of these particles was too small for intact bacteria suggesting that the high rotational speeds had broken down the bacteria into smaller fragments (Wang et al 2005). In the present study when intact bacteria were added to MWF the only changes in numbers of particles occurred within the 0.3-3.0μm diameter range, consistent with the presence of intact bacteria. This suggests that the airline pressures used in this study were insufficient to disrupt bacterial cell walls. Furthermore the presence of disrupted bacteria did not appear to increase the numbers of respirable (<10μm) particles although a larger number of bacteria could have altered this result.
The following conclusions can be drawn from this study:
• Deposition of used MWFs on the operator’s torso and arms is more likely to occur than breathing in respirable mist particles when compressed air is used to clean water mix MWF from surfaces. This emphasises the importance of using control systems and PPE to protect the hands, exposed arms, torso and legs of the worker. Contamination of personal clothing could result in prolonged skin contact with MWFs.
• There is a potential risk for formation of respirable (<10μm) mists when compressed airlines are used at high pressures, in close proximity to work pieces, or on uneven surfaces. Practical techniques could be introduced to minimise this risk such as identifying pressures sufficient to remove MWFs but minimising mist formation. Good principles of control and hygiene should minimise this risk.
• The formation of mist was not altered by the presence of intact or degraded bacteria in the MWF but when using old MWF in which microorganisms had accumulated over long periods, the potential for inhaling endotoxin was increased.
• Background respirable particles (<10μm) in a ‘visibly clean’ workshop were found to be on average 100 fold higher than in a standard office. If this is typical of other machine plants, it suggests that compressed airlines may not be the major factor contributing to high levels of airborne particles.
• The use of particle counting instruments could help to identify activities that increase the formation of respirable particles in machining workshops and to identify effective controls to reduce levels of particles (either chemical or biological hazards).
25
5. REFERENCES
Cooper JF and Pearson SM (1972) The Limulus test for endotoxin (pyrogen) in radiopharmaceuticals and biologicals. Bull Parenter Drugs Assoc: 26: 153-162
DECOS (2010). Endotoxins- A health based recommended occupational exposure limit. ISBN: 978-90-5549-804-8
HSE (1997) MDHS 82 The Dust lamp: A simple tool for observing the presence of airborne particles. HSE Books ISBN 071763623
HSE (2003) MDHS 95/2 Measurement of personal exposure of metalworking machine operators to airborne water-mix metalworking fluid. HSE Books ISBN 0717627349
HSE: (2008) Controlling airborne contaminants at work. A guide to local exhaust ventilation (LEV) HSE Books ISBN 9780717662982
Passman FJ and Rossmoore HW (2002) Reassessing The Health Risks Associated With Employee Exposure To Metalworking Fluid Microbes: Journal of the Society of Tribologists and Lubrication Engineers 58 (7): 30-38
Robertson W, Robertson AS, Burge CBSG, Moore VC, Jaakkola MS, Dawkins PA, Burd M, Rawbone R, Gardner I, Kinoulty M, Crook B, Evans GS, Harris-Roberts J, Rice S, Burge PS (2007) Clinical investigation of an outbreak of alveolitis in a car engine manufacturing plant. Thorax 62:981-990
Stagg S, Bowry A, Kelsey A, Crook B (2010) HSE Research Report RR786 - Bioaerosol emissions from waste composting and the potential for workers’ exposure. Available at http://www.hse.gov.uk/research/rrhtm/rr786.htm
Wang H, Reponen T, Adhikari A, Willeke K, Grinshpun SA (2005) Aerosolization of fine particles increases due to microbial contamination of metalworking fluids Aerosol Science 36: 721–734
Wang H, Reponen T, Lee SA, White E, Grinshpun SA. (2007) 'Size Distribution of Airborne Mist and Endotoxin-Containing Particles in Metalworking Fluid Environments', Journal of Occupational and Environmental Hygiene: 4 (3) 157-165
Young Park, J, Ramachandran, G, Raynor PC and Olson GM: (2010) Determination of Particle Concentration Rankings by Spatial Mapping of Particle Surface Area, Number, and Mass Concentrations in a Restaurant and a Die Casting Plant: Journal of Occupational and Environmental Hygiene, 7: 466–476
26

6. APPENDIX
Appendix A1. The influence of compressed air pressure on particle size distribution
Figure A1a & b: Measurement of background fine and respirable particle counts using the AeroTrak with the compressed airline on low (1.1bar) and high (2.2bar) pressure showing the distribution with time of the aerosol particles of the size class: a) 0.3-0.5μm; b) 0.5-1.0μm
27
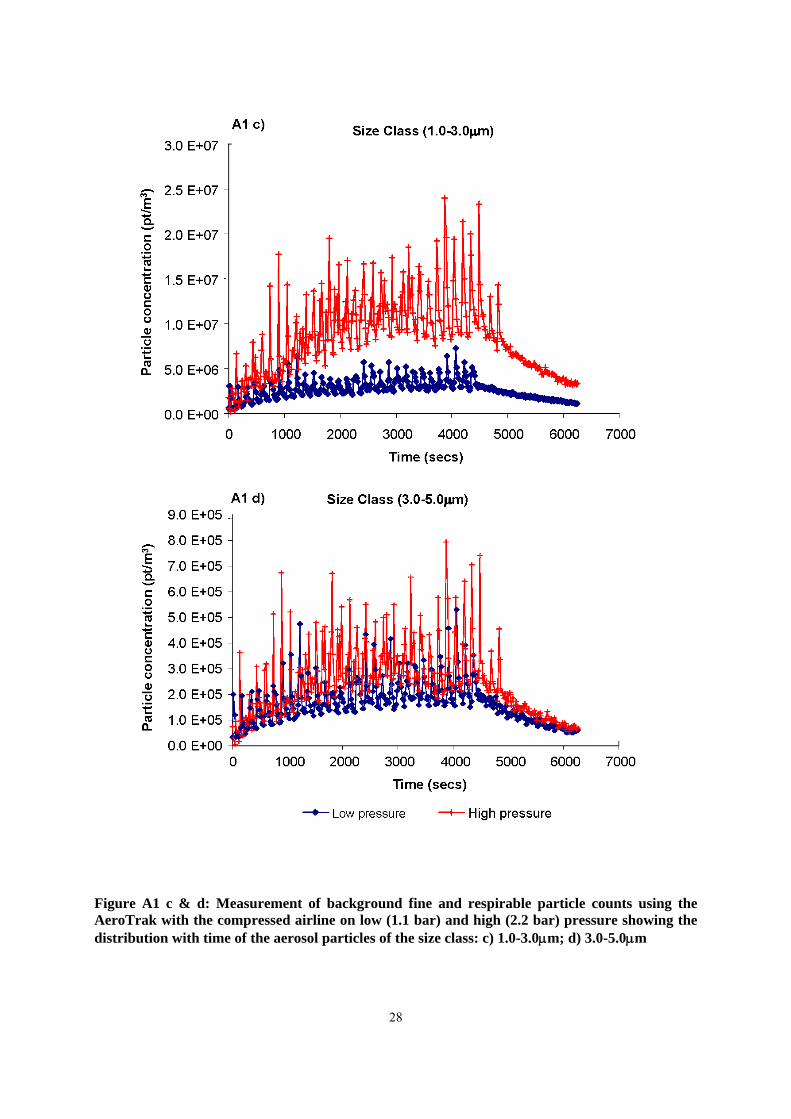
Figure A1 c & d: Measurement of background fine and respirable particle counts using the AeroTrak with the compressed airline on low (1.1 bar) and high (2.2 bar) pressure showing the distribution with time of the aerosol particles of the size class: c) 1.0-3.0μm; d) 3.0-5.0μm
28
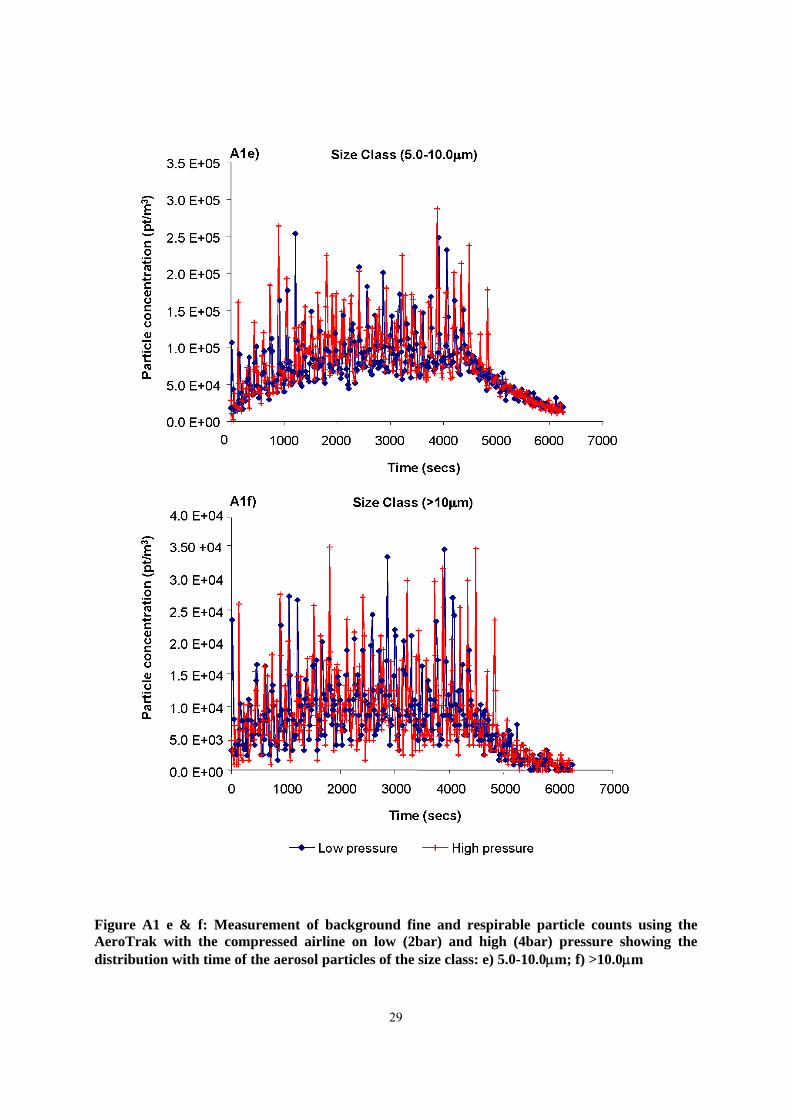
Figure A1 e & f: Measurement of background fine and respirable particle counts using the AeroTrak with the compressed airline on low (2bar) and high (4bar) pressure showing the distribution with time of the aerosol particles of the size class: e) 5.0-10.0μm; f) >10.0μm
29
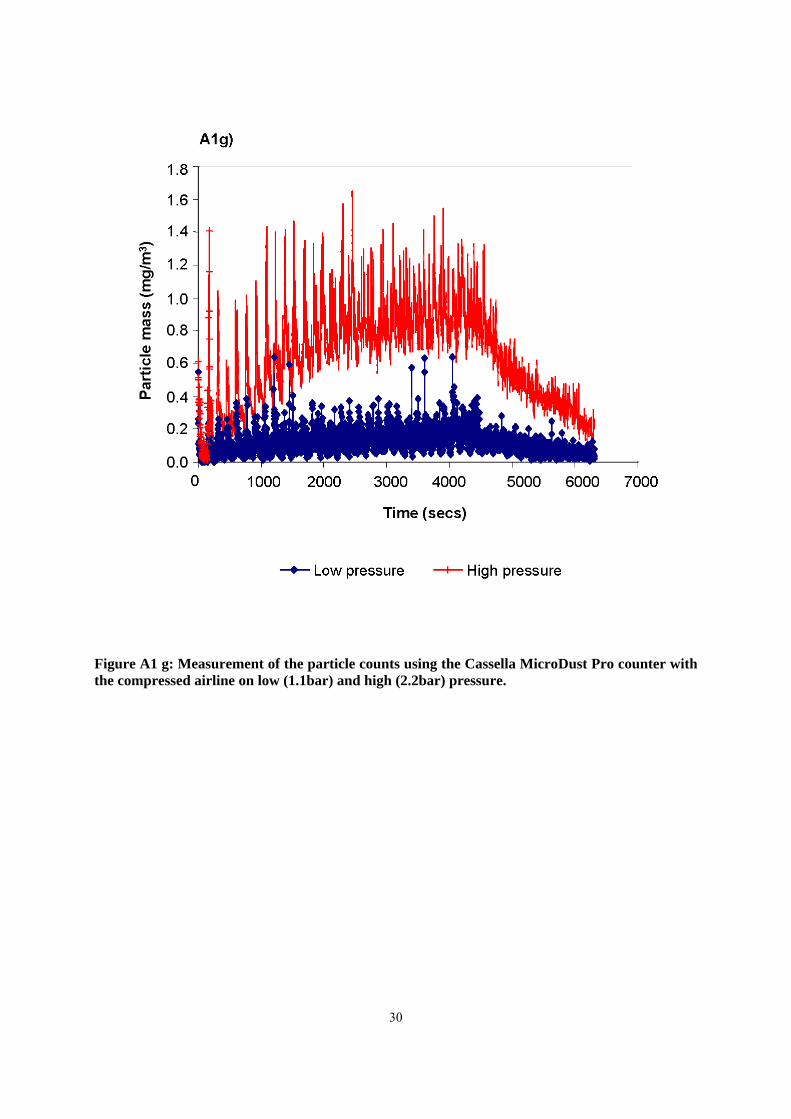
Figure A1 g: Measurement of the particle counts using the Cassella MicroDust Pro counter with the compressed airline on low (1.1bar) and high (2.2bar) pressure.
30
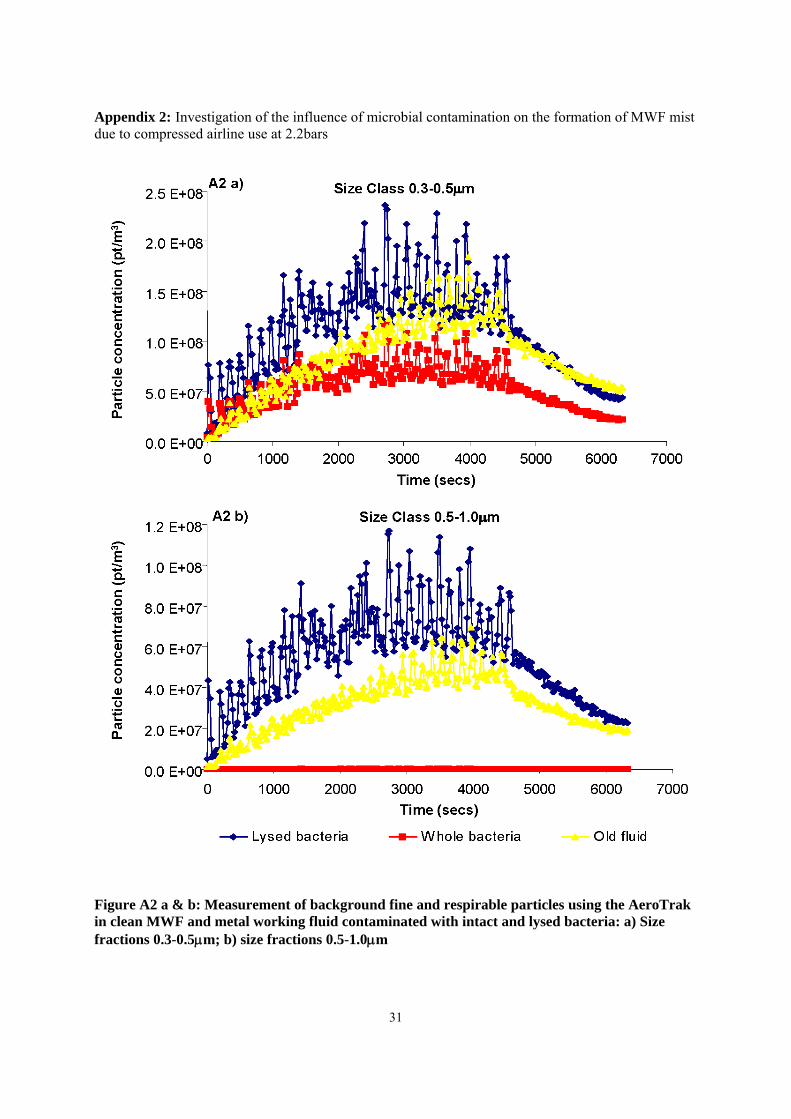
Appendix 2: Investigation of the influence of microbial contamination on the formation of MWF mist due to compressed airline use at 2.2bars
Figure A2 a & b: Measurement of background fine and respirable particles using the AeroTrak in clean MWF and metal working fluid contaminated with intact and lysed bacteria: a) Size fractions 0.3-0.5μm; b) size fractions 0.5-1.0μm
31
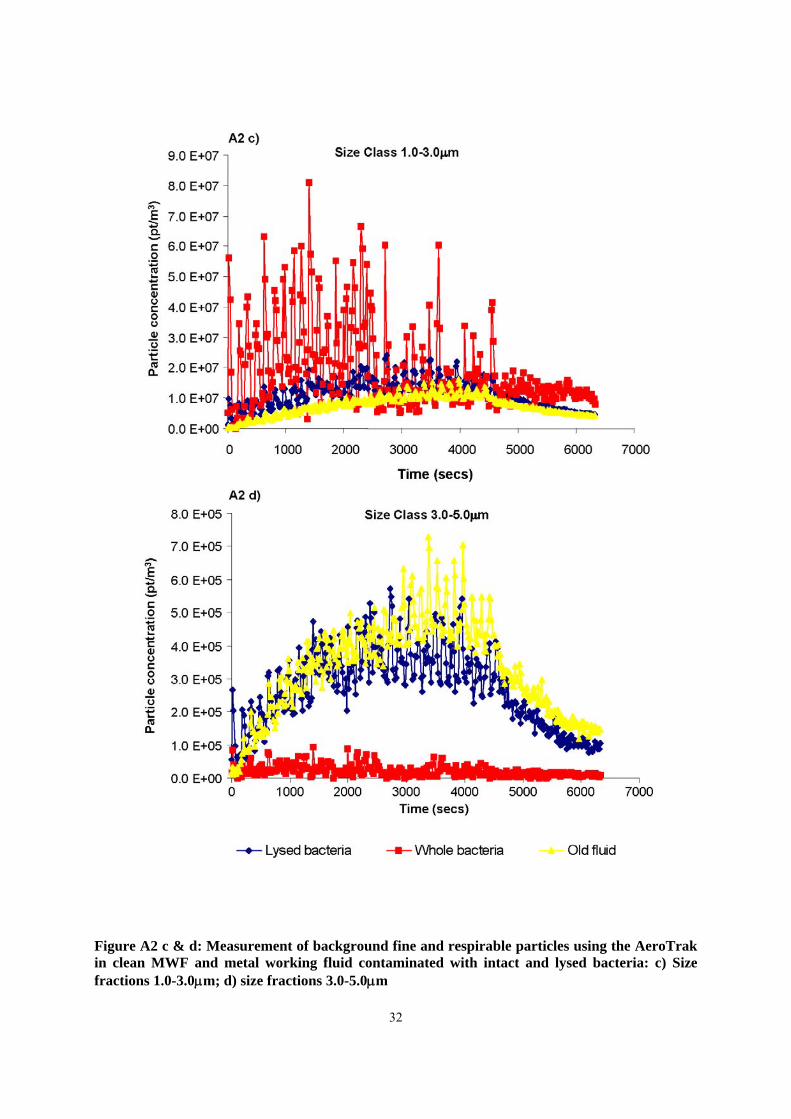
Figure A2 c & d: Measurement of background fine and respirable particles using the AeroTrak in clean MWF and metal working fluid contaminated with intact and lysed bacteria: c) Size fractions 1.0-3.0μm; d) size fractions 3.0-5.0μm
32
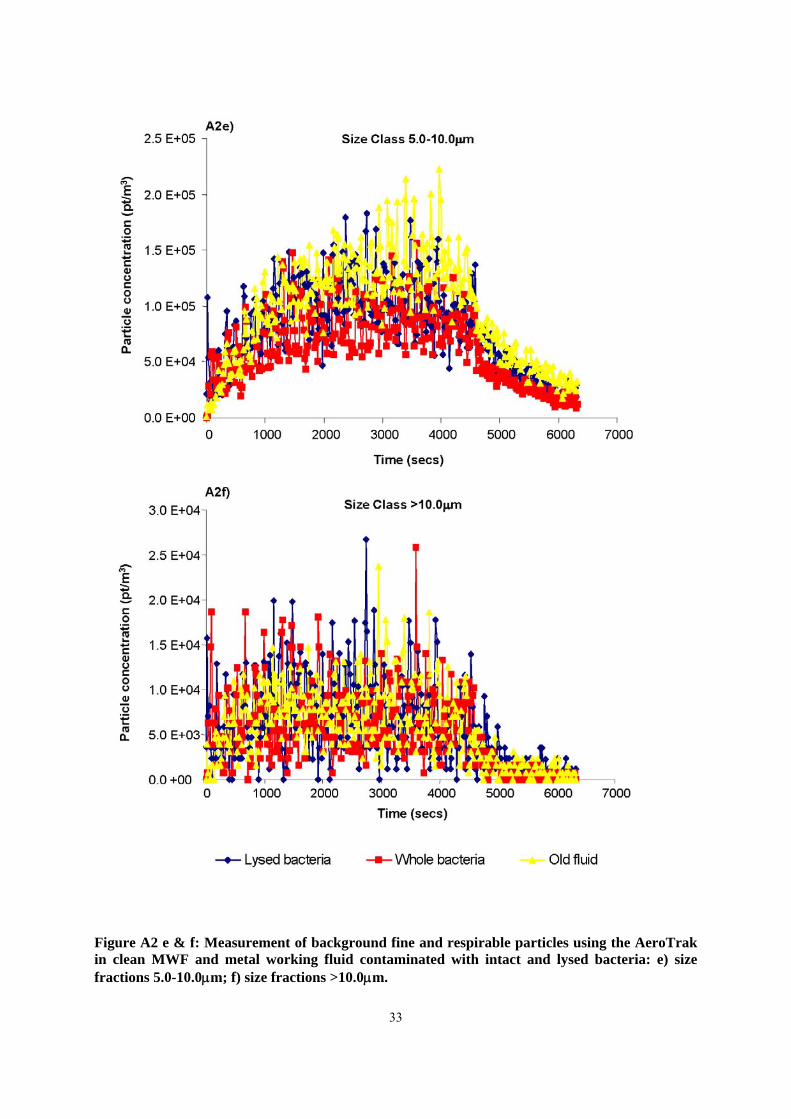
Figure A2 e & f: Measurement of background fine and respirable particles using the AeroTrak in clean MWF and metal working fluid contaminated with intact and lysed bacteria: e) size fractions 5.0-10.0μm; f) size fractions >10.0μm.
33
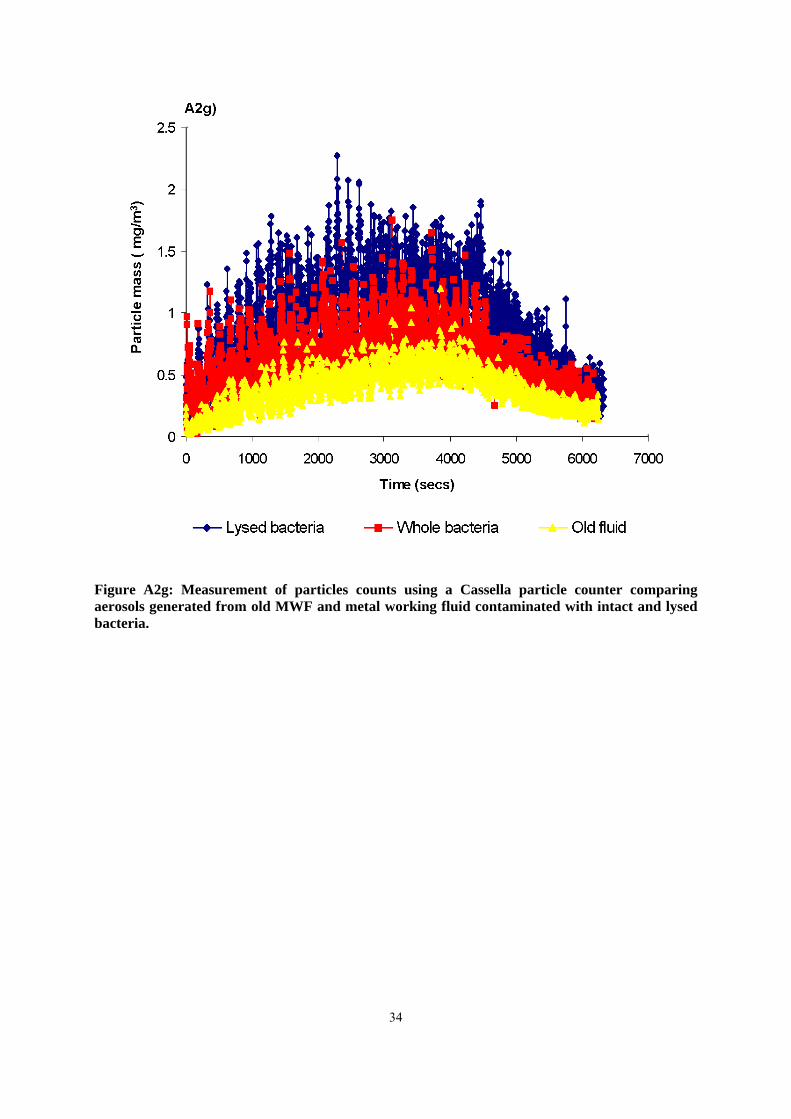
Figure A2g: Measurement of particles counts using a Cassella particle counter comparing aerosols generated from old MWF and metal working fluid contaminated with intact and lysed bacteria.
34
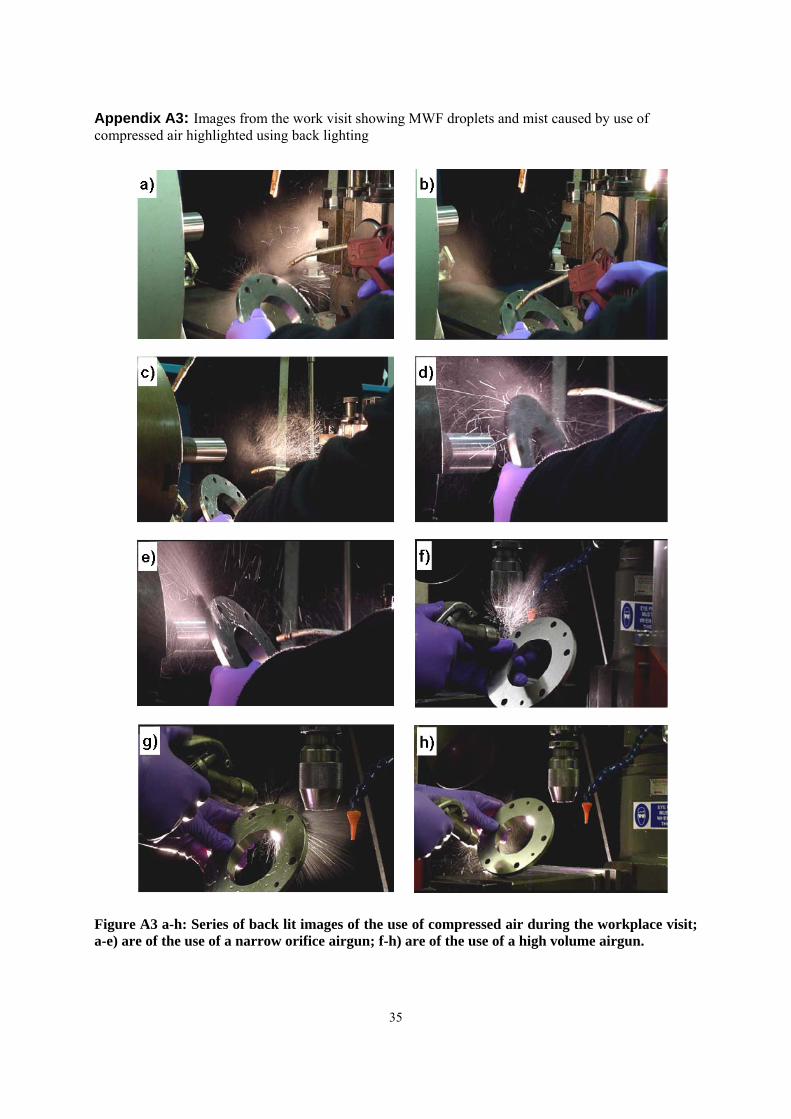
Appendix A3: Images from the work visit showing MWF droplets and mist caused by use of compressed air highlighted using back lighting
Figure A3 a-h: Series of back lit images of the use of compressed air during the workplace visit; a-e) are of the use of a narrow orifice airgun; f-h) are of the use of a high volume airgun.
35

36

37

Published by the Health and Safety Executive 12/11

Health and Safety Executive
Mists created by the use of compressed airlines for the removal of metalworking fluids Assessment of the possible exposure health risks
The potential impact of the use of compressed air for the removal of residual metalworking fluids on health was investigated using a test chamber approach followed by a workplace study. The former had the advantage in that the background levels of particles could be reduced significantly. The greatest risk was found to be dermal exposure due to large droplets of MWF coating the worker’s torso and arms. The visualisation of respirable mist using back lighting was not a reproducible phenomenon in either setting but in the test chamber, the use of particle counters revealed that a reduction in compressed air pressure decreased the levels of respirable particles. Microbial contamination did not appear to alter the concentrations of particles or their size distribution. However, background levels of airborne particles in the ‘well managed’ workshops visited were sufficiently high to mask any increase in particle concentrations due to the use of compressed air but dermal exposure was observed.
This report and the work it describes were funded by the Health and Safety Executive (HSE). Its contents, including any opinions and/or conclusions expressed, are those of the authors alone and do not necessarily reflect HSE policy.
RR904
www.hse.gov.uk