RR300 - Development of a field method for the assessment of the ...
86
HSE Health & Safety Executive Development of a field method for the assessment of the effectiveness of barrier creams in preventing skin irritation reactions Prepared by the University of Birmingham, University of Central England and City Hospital Birmingham for the Health and Safety Executive 2005 RESEARCH REPORT 300
Transcript of RR300 - Development of a field method for the assessment of the ...

HSEHealth & Safety
Executive
Development of a field method for theassessment of the effectiveness of barrier
creams in preventing skin irritation reactions
Prepared by the University of Birmingham,University of Central England and City Hospital Birmingham for the Health and Safety Executive 2005
RESEARCH REPORT 300
HSEHealth & Safety
Executive
Development of a field method for theassessment of the effectiveness of barrier
creams in preventing skin irritation reactions
Steven Sadhra and Sarah Holloway The Institute of Occupational and Environmental Medicine
University of Birmingham
Craig A. JacksonUniversity of Central England
Perry BarrBirmingham
Iain FouldsBirmingham Skin Centre
City HospitalBirmingham
This report presents findings of a study designed to develop a field test method using non-invasivebioengineering skin instrumentation for evaluating the effectiveness of a barrier cream againstchemical skin irritants used in a typical work place setting. Both the baseline and test protocolsdeveloped can be easily adopted in different industrial settings and used to evaluate other barriercreams (BCs) for different substances used on industrial sites. The instruments and test protocols usedhere showed that the BC we evaluated was effective in protecting the skin from a strong skin irritant(SLS) and one of the two oils used on site. Of the instruments used in the factory setting, theChromameter and the TEWL provided the most reliable and stable data.
This report and the work it describes were funded by the Health and Safety Executive (HSE). Itscontents, including any opinions and/or conclusions expressed, are those of the authors alone and donot necessarily reflect HSE policy.
HSE BOOKS

ii
© Crown copyright 2005
First published 2005
ISBN 0 7176 2946 5
All rights reserved. No part of this publication may bereproduced, stored in a retrieval system, or transmitted inany form or by any means (electronic, mechanical,photocopying, recording or otherwise) without the priorwritten permission of the copyright owner.
Applications for reproduction should be made in writing to: Licensing Division, Her Majesty's Stationery Office, St Clements House, 2-16 Colegate, Norwich NR3 1BQ or by e-mail to [email protected]

ACKNOWLEDGEMENTS The research team wishes to thank Dana Spicer Axle, their Health and Safety team, Production & Human Resources manager, Technical staff and in particular the Machine operators who participated in different phases of the project. Without the continuous support, interest and commitment of Dana Spice Axle this project would not have been possible. Special thanks go to Elpiniki Laiou who played an important role in the use of the instrumentation for the collection of field data. Finally thanks to the HSE project leads namely, Dr Roger Rawbone and Dr Richard Rycroft for their detailed attention to the project, and their constructive comments.
iii

iv

CONTENTS CHAPTER 1: BACKGROUND 1 1.1 Study aims 1 CHAPTER 2: FACTORY, STUDY POPULATION AND 2
SELECTION OF INSTRUMENTATION 2.1 Factory and study population 2
2.1.1 Processes and chemical used 2.1.2 Skin protection on site 2.1.3 Testing room in factory and testing environment 2.2 Selection of bioengineering instruments 2
and visual score techniques 2.2.1 Instrument type, calibration and use 2.2.2 Instrument order of use and number of readings CHAPTER 3: BASELINE MEASUREMENT (PHASE I) 5 3.1 Introduction 5 3.2 Measurements 5 3.2.1 Individuals tested and testing duration 3.2.2 Test sites on forearms 3.2.3 Measurement schedule 3.2.4 Test procedure 3.3 Results 8 3.3.1 TEWL 3.3.2 Corneometer 3.3.3 Chromameter 3.4 Summary of findings 27 CHAPTER 4: SHORT TERM OCCLUSION TESTING (PHASE II) 29 4.1 Aims and Objectives 29 4.2 Methodology 29 4.2.1 Individuals Tested 4.2.2 Forearm test site 4.2.3 Barrier Cream and chemicals tested 4.2.4 Test procedure – preparations and application of chemicals 4.2.5 Test Schedule 4.2.6 Measurements 4.2.7 Visual Scoring 4.3 Results 34 4.3.1 Demographics of volunteers 4.3.2 TEWL 4.3.3 Chromameter 4.3.4 Corneometer 4.3.5 Laser Doppler 4.4 Summary of findings 56
v
CHAPTER 5: QUESTIONNAIRE SURVEY 58 5.1 Introduction 58 5.2 Methodology 58 5.3 Results 58 5.3.1 Descriptive details of baseline respondents 5.3.2 Use of barrier creams, gloves and hand cleansers 5.3.3 Skin irritation 5.4 Summary of findings 65 CHAPTER 6: CONCLUSIONS AND RECOMMENDATIONS 66 REFERENCES 70 APPENDICES Appendix 1 Plots of visual scores and Chromameter and TEWL reading for
selected individuals who produced visible reactions to SLS during the two-week occlusion period.
vi

EXECUTIVE SUMMARY The aims of the study were to select and evaluate appropriate skin bioengineering techniques and to assess their performance (reliability) in a typical workplace setting. Factors affecting the instrument readings were investigated in order to develop a test protocol for assessing the effectiveness of barrier creams (BCs) in protecting against common oils and workplace substances. Baseline measurements were taken from 15 randomly selected production worker volunteers. Measurements were taken at four points (A-D, wrist to elbow) on both forearms using four different instruments (Laser Doppler, Chromameter, DermaLab and Corneometer). The measurements were repeated at three different time points (7, 15, and 30 minutes) after sitting comfortably at the test location with arms resting on a table (Laser Doppler measurements were only taken twice, at the 7 and 30 minute time points). A questionnaire was developed to gain information about individual workers regarding their daily activities, chemical types handled and skin protection used which was distributed to 196 shop floor workers. Of the four arm areas measured, area A (wrist area) was the least consistent, producing significantly higher readings than the other areas with widely dispersed standard deviations on most of the instruments. Thus the test area closest to the wrist was excluded from further analysis. The four instruments evaluated showed sufficient reliability for their use in the development of a field test method to assess the effectiveness of BCs. To assess the effectiveness of a BC an optimum test protocol was developed for testing repeated exposure to two oils (Oil 1 and Oil 2) used on site. The chemicals were tested under occlusion, mimicking “worst case” occupational dermal exposure over two consecutive weeks. A well-known skin irritant, SLS was also tested. The main aim was to establish the severity of effects of chemicals on instrument values and the protective effect of a barrier cream used on site. The SLS site had significantly higher TEWL and Chromameter values than those recorded at the control sites. The Chromameter values for Oil 1 were also significantly elevated over the control site. This indicated that Chromameter was most sensitive in recognising changes in skin produced by chemicals followed by TEWL. The Corneometer produced varying results possibly due to the fact that this instrument measured the moisture content of the skin, which is likely to be increased by the addition of a barrier cream to the test site or as a result of a weeping skin reaction as in the case of SLS. TEWL and Chromameter were able to demonstrate the effectiveness of the BC for both SLS and Oil2 but not for Oil1.
When comparing visual skin irritation score readings with instrument readings the data recorded showed that TEWL and Chromameter were good indicators of skin irritation especially for the stronger irritants such as SLS. Both instruments showed increased readings with SLS occlusion over time.
For further validation the field method developed for assessing the effectiveness of BCs needs to be used to assess the effective range of different types of barrier creams and chemical irritants used in different occupational settings.
vii

viii

CHAPTER 1: BACKGROUND The aim of this research project was to develop a methodology to measure the effectiveness of barriers creams (BCs) in workplace conditions. The effectiveness of BCs was evaluated by measuring various skin parameters using bioengineering techniques. An important element of the work was the assessment of the reliability of bioengineering techniques and development of a practical test methodology. The research project has three main phases (listed below) to be conducted in a workplace setting where individuals are exposed to known chemical irritants. The 15-month research project commenced in December 2002. The research team applied for ethical approval from the South Birmingham Health in December 2002, which was granted on 11th March 2003 (Appendix 1). 1.1 Study aims The main aims of the study were to develop a field method to evaluate the effectiveness of BCs. The following study objectives were defined by the Health and Safety Executive:
1. To develop a methodology to measure the effectiveness of BCs in real workplace conditions.
2. To identify suitable techniques for quantifying the effectiveness of BCs by measuring various physiological and physiochemical properties of the skin.
3. To assess the reliability and validity of the bioengineering techniques developed.
4. To ensure that the methods are practical, relatively simple to perform and capable of facilitating comparisons of different types of BCs.
In order to meet the above aims the follow three study phases were designed: Phase I -Selection and field evaluation of selected skin bioengineering techniques -
assessment of instrument performance (reliability); determination of factors, which affect reading, and development of test protocol for subsequent phases (Baseline measurements)
Phase II- Effectiveness of BC using repeat short-term occlusion irritation testing
(ROIT) with chemicals used in the workplace i.e. mimicking typical workplace exposure patterns (Occlusion testing)
Phase III- Develop a questionnaire to gain information about individual workers
regarding their daily activities, extent of dermal exposure, skin protection and skin disorders.
1

CHAPTER 2: FACTORY, STUDY POPULATION AND SELECTION OF INSTRUMENTS
2.1 Factory and study population The study was conducted in an engineering factory in Birmingham that manufactures and assembles vehicle gearboxes and axles. The plant employs a total of 185 workers in two adjacent sites, east and west works. The majority of the manufacturing (predominantly wet work) takes place at the east site and assembly work (predominantly dry work) on the west site. Employees work one of four different shifts; day shift (8 hour shifts either permanent morning or permanent afternoons) or a double day shift (one week of 8 hour morning shifts followed by a week of 8 hour afternoon shifts), continental (12 hour shift from 6am –6pm for 4 days followed by 4 days off) and permanent 8-hour night shifts. 2.1.1Processes and chemicals used A number of engineering processes are conducted on site (turning, gear cutting, grinding, lapping, assembly, washing) that involve the use Metal Working Fluids (MWFs) including coolants, lubricating oils, hydraulic oils and cutting oils. The main oils and coolants used include Hocut 809 (lubricating), Cutmax 600 (cutting oil) and Houghton-Lube 32 (hydraulic /lubricating oil), aquasolve, aquaquench 365 (coolant). Other chemicals used include mineral acids, sealants, cleaning agents and antispatter chemicals used in welding. 2.1.2 Skin protection available on site Cotton, nitrile (standard and gauntlet type) and general purpose welding gloves are available on site. Glove mates are also provided to be worn underneath gloves. In addition to gloves, barrier creams are available at a central wash station in west works and in toilets on both west and east work sites. Creams provided include Deb Protect, Rozalex Dry Guard and an after-work cream, Deb Restore. 2.1.3 Testing room in factory and testing environment Two adjacent rooms located in the west wing, a surgery (3.8m x 4.5m) and the surgery office (4m x 4.5m) were used for the testing. These rooms are on the ground floor and lead directly onto the factory shop floor via a waiting room (7.5m x 3m). The surgery office is located next to the surgery but is further away from the shop floor. All measurements were conducted in the surgery office, whilst the surgery was used for storing instruments and preparation of chemicals and Finn chambers for testing (Phase II). During the testing phases the use of the rooms were restricted to two researchers and the individual volunteer being tested. Phase I was conducted in May and Phase II in June and December. During testing, the rooms were at ambient temperature with no artificial heating. Windows and doors remained closed throughout in order to minimise the ambient air movement. Temperature and humidity were recorded prior to each individual’s measurements being taken. 2. 2 Selection of bioengineering instruments and visual scoring techniques Skin irritation has frequently been assessed using non-invasive bioengineering methods such as Trans Epidermal Water Loss (TEWL), skin colour, Laser-Doppler Imaging, capacitance and visual scoring (Fluhr et al. 2001).
2
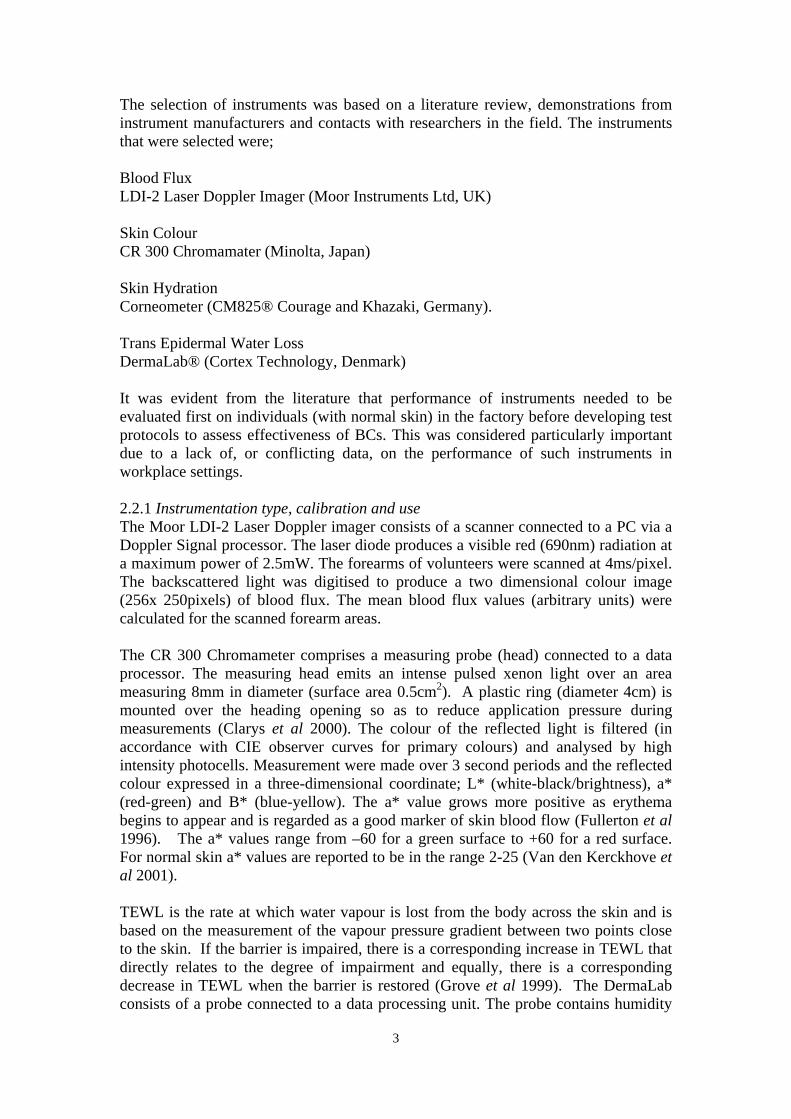
The selection of instruments was based on a literature review, demonstrations from instrument manufacturers and contacts with researchers in the field. The instruments that were selected were; Blood Flux LDI-2 Laser Doppler Imager (Moor Instruments Ltd, UK) Skin Colour CR 300 Chromamater (Minolta, Japan) Skin Hydration Corneometer (CM825® Courage and Khazaki, Germany). Trans Epidermal Water Loss DermaLab® (Cortex Technology, Denmark) It was evident from the literature that performance of instruments needed to be evaluated first on individuals (with normal skin) in the factory before developing test protocols to assess effectiveness of BCs. This was considered particularly important due to a lack of, or conflicting data, on the performance of such instruments in workplace settings. 2.2.1 Instrumentation type, calibration and use The Moor LDI-2 Laser Doppler imager consists of a scanner connected to a PC via a Doppler Signal processor. The laser diode produces a visible red (690nm) radiation at a maximum power of 2.5mW. The forearms of volunteers were scanned at 4ms/pixel. The backscattered light was digitised to produce a two dimensional colour image (256x 250pixels) of blood flux. The mean blood flux values (arbitrary units) were calculated for the scanned forearm areas. The CR 300 Chromameter comprises a measuring probe (head) connected to a data processor. The measuring head emits an intense pulsed xenon light over an area measuring 8mm in diameter (surface area 0.5cm2). A plastic ring (diameter 4cm) is mounted over the heading opening so as to reduce application pressure during measurements (Clarys et al 2000). The colour of the reflected light is filtered (in accordance with CIE observer curves for primary colours) and analysed by high intensity photocells. Measurement were made over 3 second periods and the reflected colour expressed in a three-dimensional coordinate; L* (white-black/brightness), a* (red-green) and B* (blue-yellow). The a* value grows more positive as erythema begins to appear and is regarded as a good marker of skin blood flow (Fullerton et al 1996). The a* values range from –60 for a green surface to +60 for a red surface. For normal skin a* values are reported to be in the range 2-25 (Van den Kerckhove et al 2001). TEWL is the rate at which water vapour is lost from the body across the skin and is based on the measurement of the vapour pressure gradient between two points close to the skin. If the barrier is impaired, there is a corresponding increase in TEWL that directly relates to the degree of impairment and equally, there is a corresponding decrease in TEWL when the barrier is restored (Grove et al 1999). The DermaLab consists of a probe connected to a data processing unit. The probe contains humidity
3

(%) and temperature (°C) sensors mounted in a diffuse chamber. During measurements the probe was placed parallel onto the skin surface with the open chamber pointing towards the skin covering a measuring area of 10mm in diameter. The mean TEWL value was displayed when a standard deviation of 0.2 is reached or after a sampling time of 60 seconds. The TEWL reading is expressed as the difference in g/m2/hr with a range 0-250. The CM825 Corneometer was used to measure skin hydration i.e. moisture content of the stratum corneum. The principle of measurement is based on determining the electrical capacitance (dielectricity) of skin. The Corneometer probe was connected to a PC via a multi-purpose adaptor. The probe was placed vertically on the skin covering a measuring area of approximately 50mm2 and exerting a constant reproducible pressure by means of an inbuilt spring. The measuring time is one-second (arbitrary unit from 0 to 120AU), the mean and standard deviation values calculated and stored electronically. All instruments were used according to the manufacturers’ manuals and published guidelines for specific instrument types (Berardesca et al.1997, Bircher et al. 1994, Fullerton et al. 1996, Pinnagoda et al. 1990). The manufacturers calibrated all instruments one month before use. In the absence of information on suitable warm up times for each instrument, the instruments were set up and waited in stand by mode for 30 minutes before taking readings. Experience and practice was gained on the use of instruments and dermal readings at the IOH (clinical suite) prior to testing on site. 2.2.2 Instruments – Order of use and number of readings A set order of taking measurements was chosen to reduce the possibility of any instrument readings being affected by any previous measurements obtained from the use of other instruments. The order of reading was broadly based on the pressure exerted by probes and their skin contact time for each reading i.e. those exerting least or no pressure (Laser Doppler) were used first and those exerting most pressure last (Corneometer). The order of instrument use was as follows: Laser Doppler, Chromamater, DermaLab and Corneometer. For hydration (Corneometer) and colour measurements (Chromameter) three consecutive readings were taken at each test point on the selected forearm test area. The mean of the three readings were recorded for these instruments. For the DermaLab the TEWL probe was set at the lowest SD of 0.2 i.e. mean value was displayed when a SD of 0.2 was obtained between consecutive cycles of readings. A default recording time of 60 seconds was set in case this SD was not achieved. The LDI scanning was performed at the first and third round of measurements as described in section 3.1.4.
4

CHAPTER 3: BASELINE MEASUREMENTS (PHASE 1) 3.1 Introduction Baseline measurements for individuals at the factory were conducted to assess: (i) the performance of instruments in a typical occupational setting, (ii) to determine any factors which may affect readings, and (iii) to develop a test protocol for assessing effectiveness of BCs. The baseline measurement protocol was designed to assess the following objectives: the reliability and validity of the four selected bioengineering techniques. • Variation in readings along the four test areas on forearms • Variation in readings between arms • Variation in readings over three consecutive days • Optimum time required for the body to reach stabilisation of readings • Natural variability in readings within individuals • Effects of room temperature and humidity Completion of the above objectives would enable the selection of the most suitable instrumentation, test sites and acclimatisation periods for subsequent testing with chemicals and BCs. 3.2 Methodology 3.2.1 Individuals tested and testing duration Baseline measurements were conducted on a total of 15 workers randomly selected by the research team and shift managers. The selection of workers was limited to those working on a particular shift so that measurements could be conducted at the same time on three consecutive days. Volunteers sat in the surgery office (test room) with their forearm resting on a desk. Measurements were taken at four points on both forearms using four different instruments (Laser Doppler, Chromameter, DermaLab and Corneometer). The measurements were repeated at three different time points. 3.2.2 Test sites on forearms All skin measurements were taken on the volar aspect of forearms. The forearms were rested on a desk covered in a black cloth to avoid light reflection from surfaces, which could interfere with instrument readings. A black cloth template was placed over the forearm with four exposed circular areas each 3cm in diameter and 2 cm apart Fig 1. Individuals were asked to keep still for the 45 minutes duration of testing (see 3.1.4)
5

Figure 3.1- Testing on site using forearm template
3.2.3 Measurements Schedule
The time scale for the baseline measurements can be seen in Fig 2. Time T= entering
room and sitting comfortably at the test station with forearms resting on a table and
covered with a measurement template (as described in section 3.1.4).
Fig 3.2 Time Scale for Baseline Measurements Right forearm Left forearm L. Doppler Chromameter DermaLab Corneometer T 5 10 15 20 25 30 35 40 45 (Minutes)
Measurements for colorimetry, TEWL and corneometry were taken on both the left
and right arm. For the right forearm reading for colorimetry, TEWL and corneometry
were recorded at T+ 7, T+15 and T+ 36. For the left forearm these reading were only
taken at T+40. The Laser Doppler scan was performed only on the right forearm at
times T+1 and T+30. The total test time for each individual was 45 minutes.
Individual measurements were performed at the same time on each of the three
consecutive days.
6

3.2.4 Procedure for Conducting Baseline Measurements:
1. Volunteers entered into the surgery office, removed any jewellery, watches,
sweatbands or overalls with long sleeves and anything else that may cause any
difficulties in gaining access to the forearms.
2. Forearms were placed facing upwards onto the black cover on the desk in
front of volunteers. Markings on the cover were used as a guide to ensure the
forearm was in the correct position for the laser to scan the whole of the right
forearm.
3. The templates were placed over the right forearm; making sure that the base of
the template was directly in line with the base of the palm.
4. Once the volunteer was in the correct position and comfortable, initial
measurements were taken in the following sequence:
a. Blood Flux – Moor Laser Doppler Imager (LDI-2)
b. Skin Colour - Chromamater® (Minolta CR300)
c. Skin Hydration – Corneometer (CM825® Courage and Khazaka).
d. Trans Epidermal Water Loss – DermaLab® (Cortex Technology)
5. With the exception of the laser, which measured the whole forearm in a
continuous scanning movement, the other measurements were taken starting
with the wrist area (A) and moving up the forearm towards area (D).
6. The second sets of measurements were repeated after 15 minutes but did not
include the Laser Doppler.
7. On completion of these 3 sets of measurements, at 10, 18 and 39 minutes, one
set of measurements was then taken on the left forearm. Volunteers then left
the surgery and were asked to return at the same time the following day.
7

3.3 Results
Baseline data was collected from right forearms over three consecutive days (D1, D2,
and D3), at four areas (A, B, C and D), each location being measured at three time
points (T1, T2, and T3). Additionally, measurements of the left arm were also made
over three consecutive days (D1, D2, and D3), at four arm areas (A, B, C and D), but
with each location only being measured at time period 3. Analysis was conducted to
meet the objectives listed in section 3.0
Although fifteen workers had volunteered to participate in the Baseline
Measurements, only thirteen volunteers were used for analysis. Two were excluded
due to pre-existing skin conditions; One volunteer had a four-year history of hand and
forearm dermatitis on his hands for which he used a prescribed topical ointment. The
other volunteer had a long history of psoriasis including hands and forearms. A
prescribed ointment was used when the psoriasis flared up.
3.3.1 TEWL Data
TEWL data was collected using DermaLab (CM825) and the readings are expressed
as the difference in g/m2/hr within a range 0-250. Data obtained for 13 volunteers
over the three days were normally distributed, possessing a kurtosis of value 0.26.
TEWL – mean values for volunteers by day and test points.
Tables 3.1 - 3.4 show the mean TEWL readings for each area of the right arm only,
for each time period, on each of the three days. Table 3.5 shows a summary of the
TEWL values over the four areas for the three days.
Table 3.1: TEWL values for Area A, right arm only, (n=13) Area A TEWL values
Time 1 2 3
Total
1 20.8 (18.9)
16.0 (17.7)
14.2 (7.7)
17.0 (14.7)
2 22.2 (20.4)
14.8 (12.4)
18.8 (19.5)
18.6 (17.4)
Day
3 11.4 (4.1)
11.4 (7.0)
11.0 (3.8)
11.2 (4.9)
Total (SD)
18.1 (14.4)
14.0 (12.3)
14.6 (10.3)
15.6 (12.3)
Time 1= T+7, Time 2= T+15, Time 3=T+36 T= Time when sitting comfortably at the test station with forearm resting on table.
8

Table 3.2: TEWL values for Area B, right arm only, n=13 Area B TEWL values
Time 1 2 3
Total
1 7.1 4.0
9.9 11.8
7.6 4.7
8.2 6.8
2 11.0 9.5
10.9 9.6
8.2 6.3
10.0 8.4
Day
3 5.9 1.7
6.0 1.5
6.0 1.9
5.9 1.7
Total (SD)
8.0 5.0
8.9 7.6
7.2 4.3
8.0 5.6
Table 3.3: TEWL values for Area C, right arm only, n=13
Area C TEWL values Time 1 2 3
Total
1 9.6 16.9
7.4 6.9
4.7 1.7
7.2 8.5
2 6.0 3.7
8.6 10.7
7.1 7.1
7.2 7.1
Day
3 4.6 1.9
5.3 2.5
4.8 1.5
4.9 1.9
Total (SD)
6.7 7.5
7.1 6.7
5.5 3.4
6.4 5.8
Table 3.4: TEWL values for Area D, right arm only, n=13
Area D TEWL values Time 1 2 3
Total
1 8.2 12.2
5.9 2.9
4.6 1.6
6.2 5.5
2 5.4 3.0
6.3 4.9
5.5 2.3
5.7 3.4
Day
3 4.7 1.6
4.9 1.7
5.0 1.8
4.8 1.7
Total (SD)
6.1 5.6
5.7 3.1
5.0 1.9
5.5 3.5
9

Table 3.5: Mean TEWL values for right arm only, for all four sites and three days.
Area Time Mean SD N A Time 1 17.96 15.88 39 Time 2 14.26 12.41 39 Time 3 14.69 12.01 39 Total 15.65 13.54 117 B Time 1 8.81 6.63 39 Time 2 9.74 8.97 39 Time 3 8.20 5.52 39 Total 8.92 7.17 117 C Time 1 7.62 10.11 39 Time 2 8.07 8.07 39 Time 3 6.69 5.77 39 Total 7.46 8.15 117 D Time 1 6.92 7.62 39 Time 2 6.71 4.85 39 Time 3 6.18 4.37 39 Total 6.61 5.76 117 Total Time 1 10.33 11.49 156 Time 2 9.69 9.35 156 Time 3 8.94 8.20 156 Total 9.66 9.78 468
TEWL -Variation in readings along the four test areas on forearms
TEWL values for the four areas of the right arm are shown in Table 3.6. A general
linear model comparison was made, adjusting for the time of measurement (T1, T2, or
T3) and the day of measurement (D1, D2, or D3), and the results are shown in Table
3.7. This suggests that there was significant variability in TEWL scores between the
four areas, even after adjusting for day and time of measurement. When removing the
measurements from area A, and then repeating the general linear model, adjusting for
time and day of measurement, no significant differences were found in TEWL values
between areas B, C, and D, as shown in Table 3.8. Due to the increased variability in
TEWL values at Area A, data obtained from Area A were therefore omitted from any
subsequent analyses from this point. Table 3.6:TEWL values for the four areas of the right arm Area TEWL SD N A 15.65 13.54 117 B 8.92 7.17 117 C 7.46 8.15 117 D 6.61 5.76 117 Total 9.66 9.78 468
10

Table 3.7: General Linear Model of TEWL values for each Area, adjusting for Time and Day of measurement (right arm only, all Areas) Model Mean square F P Corrected Model 1283.83 15.50 0.000 Time 141.83 1.71 0.19 Day 408.23 4.93 0.02 Area 1954.23 23.60 0.000
Table 3.8: General Linear Model of TEWL values for each Area, adjusting for Time and Day of measurement (right arm only, excluding Area A) Model Mean square F P Corrected Model 114.59 2.28 0.06 Time 31.30 0.62 0.43 Day 107.62 2.14 0.14 Area 158.94 3.16 0.04
TEWL -Variation in readings between arms
TEWL measurements were only taken on the left arm once (T+40, immediately after
TEWL measurements of the right arm were made at time period 3) and these were
directly compared with the right arm measurements. TEWL values from areas B-D of
both left and right arms were compared for each participant, and the results appear in
Table 3.9, which shows significantly greater TEWL values were obtained from the
left arm.
Table 3.9: TEWL values for both arms, matched for areas (B-D) and day of measurement.
Arm N Mean TEWL Min Max SD F P Left 114 9.32 3 71 10.98 4.10 0.04 Right 114 7.02 2 29 5.28 Total 228 8.17 2 71 8.67
When comparing TEWL values for the left arm with the TEWL values from the right
arm taken first at Time 1 (before any other subsequent measures were taken at Time 2
or 3), there was no significant difference in the values, as shown in Table 3.10.
11

Table 3.10: TEWL values for both arms, matched for areas (B-D) and day of measurement – with comparison made with right arm measurements at Time 1.
Arm N Mean TEWL Min Max SD F P Left 117 9.18 3 71 10.87 1.22 0.27 Right 117 7.78 2 63 8.22 Total 294 8.60 2 71 9.16
TEWL- Variation in readings over three days
Table 3.11 shows the mean TEWL readings for areas B-D, for the right arm only,
over the three days. The data shows that as the days progressed, TEWL SDs
consistently decreased. Scheffe’ Post Hoc analysis revealed that the significant
difference in TEWL occurring over the three days was due to differences in TEWL
values between day 2 and day 3 (P=0.03).
Table 3.11: TEWL values for right arm, areas B-D over three days.
Day N Mean TEWL Min Max SD F P 1 114 7.77 2 63 8.43 3.34 0.03 2 117 8.81 2 42 7.79 3 117 6.41 2 25 4.41 Total 348 7.66 2 63 7.14
After adjusting for Time of measurement and Area, there still remained a significant
difference in TEWL values obtained over the three days, as shown by General Linear
Modelling, in Table 3.12.
Table 3.12: General Linear Model of TEWL values for each Day, adjusting for Time and Area of measurement (right arm only, excluding Area A) Model Mean square F P Corrected Model 170.05 3.42 0.00 Time 32.60 0.65 0.41 Day 168.19 3.39 0.03 Area 310.97 6.26 0.01
12

TEWL- Optimum time required for the body to reach stabilisation of readings
Tables 3.13 – 3.14 show the mean TEWL readings for Areas B-D, over the three days
of measurements, for each of the three time periods. Irrespective of day, the lowest
standard deviation of Total TEWL values consistently occurred at Time 3 for Areas
B-D. The mean TEWL values were also lowest at Time 3 for Areas B-D. There was a
clearly observable trend of decreasing mean TEWL values and standard deviations
with increasing time point measurements. Table 3.13 shows the mean TEWL values
for right arm only, excluding area A, over the three time points. Table 3.14 shows the
results of a General Linear Model, comparing mean TEWL values over the three
measurement points, adjusting for Day (1-3) and Area (B-D).
Table 3.13: TEWL values for three time points, for right arm only, areas B-D
Time point N Mean TEWL SD F P 1 117 7.78 8.22 0.76 0.46 2 117 8.17 7.55 3 114 7.02 5.28
Table 3.14: General Linear Model of TEWL values for each Time, adjusting for Day and Area of measurement (right arm only, Areas B-D). Area Mean square F P Corrected Model 123.98 2.47 0.04 Day (1-3) 106.56 2.12 0.14 Area (B-D) 310.97 6.20 0.01 Time (1-3) 37.90 0.75 0.47
13

TEWL- Natural variability in readings within individuals
Cronbach’s Alpha Coefficient was calculated for TEWL readings to examine the
reliability and consistency of measurements within volunteers, and this is shown in
Table 3.15.
Table 3.15: Cronbach Alpha values for TEWL measurements within individuals over all Days (Areas B-D). Area Day1 Day2 Day3 Combined
Alpha N
B 0.77 0.91 0.87 0.85 11 C 0.37 0.72 0.76 0.61 11 D 0.37 0.75 0.74 0.62 11 Combined Alpha 0.61 0.79 0.79 0.73 N 11 12 12
TEWL- Effects of room temperature and humidity
Measurements of Temperature and Relative Humidity were recorded when each
individual set of TEWL measurements were produced. Readings were recorded on
all test days. The mean temperature and relative humidity over the reading days was
24C and 39%. The correlation between temperature and TEWL reading was
moderate (r=0.5) but poor (r=0.29) between TEWL and relative humidity readings.
14

Summary of TEWL Baseline Results Variation in readings along the four test areas (A-D) on forearms a) Of the four Areas investigated on the right arm, TEWL readings were repeatedly
significantly higher and standard deviations more widely dispersed at Area A than at areas B, C and D. Area A was excluded from any further analysis.
b) Analysis of TEWL values did not differ significantly between areas B-D when
adjusting for Day or Time of measurement, after excluding readings from Area A. c) A consistent trend was observed that TEWL readings were lower with less
variability, the further up the arm (towards the elbow) the measures were taken. Variation in readings between arms a) TEWL values taken from the left arm, when matched with values from opposite
arms of the same individuals, were significantly higher than right arm values. b) TEWL readings taken from left arms were only taken once, with no previous
measurements. When compared with readings taken for the right arm for the third time, left arm readings were significantly higher.
c) When TEWL readings from the left arm were compared with those from the right
arm taken first at Time 1 (before any other subsequent measures were taken at Time 2 or 3) there was no significant difference in the values.
d) The possibility exists that previous measurement taken from right arm areas B-D at
Time 1 & 2 could play a part in reducing TEWL values taken at Time 3. It is therefore possible that in the process of measuring TEWL values, a genuine decrease in TEWL scores is caused by taking those measurements.
Variation in readings over three days a) Significant differences existed in the TEWL values between Day 2 and Day 3,
even after adjusting for the Time of measurement and Area of measurement. There was no linearity of trend in the changes of TEWL values over the three days.
The optimum time required for the body to reach stabilisation of readings a) Measurements from Time 3 consistently yielded the lowest mean TEWL values, for Areas B-D. b) When adjusting for Day and Area of measurement, a significant difference in TEWL values were observed, with lowest values at Time 3.
15

c) When analysing TEWL measures for each Area, Day and Time, decreasing TEWL values could be observed as measurements were repeated. d) Longer stabilisation times produced lower mean TEWL values with smaller standard deviations. Natural variability in readings within individuals a) Cronbach Alpha coefficients for TEWL readings showed an above-acceptable
level of consistency of measurements within individuals, except on Day 1, when some measurements on Areas C & D resulted in a less-than acceptable level of internal consistency of measurement.
b) This poor level of internal consistency of measurement was not repeated on Days
2 or 3, and it is anticipated that this was due to equipment or operator issues in the early stages of the data collection process.
c) TEWL measures appear consistent across Days and Areas of measurement Effects of room temperature and humidity a) There were moderate correlations between TEWL values and temperature,
ranging from 0.32 to 0.73 b) There were poor correlations between TEWL values and relative humidity,
ranging from –0.05 to 0.52. c) Temperature and Relative Humidity values will need to continue to be recorded in
subsequent data collection phases of the study.
16
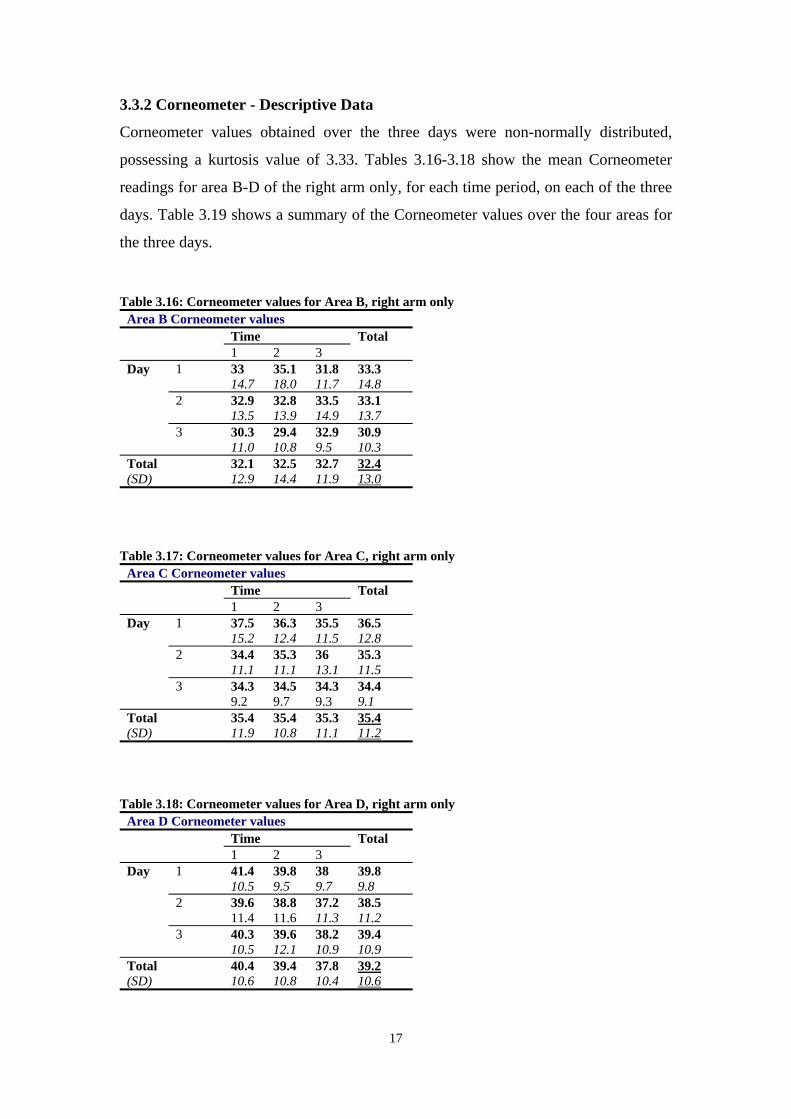
3.3.2 Corneometer - Descriptive Data
Corneometer values obtained over the three days were non-normally distributed,
possessing a kurtosis value of 3.33. Tables 3.16-3.18 show the mean Corneometer
readings for area B-D of the right arm only, for each time period, on each of the three
days. Table 3.19 shows a summary of the Corneometer values over the four areas for
the three days. Table 3.16: Corneometer values for Area B, right arm only
Area B Corneometer values Time 1 2 3
Total
1 33 14.7
35.1 18.0
31.8 11.7
33.3 14.8
2 32.9 13.5
32.8 13.9
33.5 14.9
33.1 13.7
Day
3 30.3 11.0
29.4 10.8
32.9 9.5
30.9 10.3
Total (SD)
32.1 12.9
32.5 14.4
32.7 11.9
32.4 13.0
Table 3.17: Corneometer values for Area C, right arm only
Area C Corneometer values Time 1 2 3
Total
1 37.5 15.2
36.3 12.4
35.5 11.5
36.5 12.8
2 34.4 11.1
35.3 11.1
36 13.1
35.3 11.5
Day
3 34.3 9.2
34.5 9.7
34.3 9.3
34.4 9.1
Total (SD)
35.4 11.9
35.4 10.8
35.3 11.1
35.4 11.2
Table 3.18: Corneometer values for Area D, right arm only
Area D Corneometer values Time 1 2 3
Total
1 41.4 10.5
39.8 9.5
38 9.7
39.8 9.8
2 39.6 11.4
38.8 11.6
37.2 11.3
38.5 11.2
Day
3 40.3 10.5
39.6 12.1
38.2 10.9
39.4 10.9
Total (SD)
40.4 10.6
39.4 10.8
37.8 10.4
39.2 10.6
17
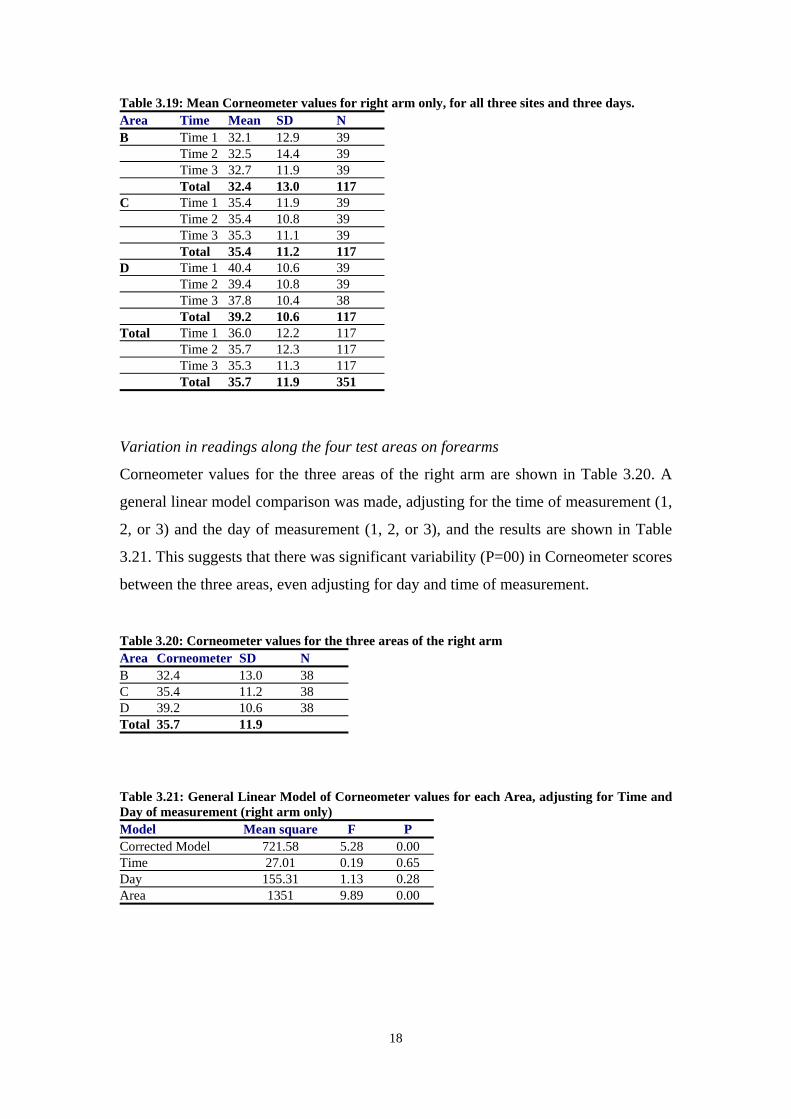
Table 3.19: Mean Corneometer values for right arm only, for all three sites and three days. Area Time Mean SD N B Time 1 32.1 12.9 39 Time 2 32.5 14.4 39 Time 3 32.7 11.9 39 Total 32.4 13.0 117 C Time 1 35.4 11.9 39 Time 2 35.4 10.8 39 Time 3 35.3 11.1 39 Total 35.4 11.2 117 D Time 1 40.4 10.6 39 Time 2 39.4 10.8 39 Time 3 37.8 10.4 38 Total 39.2 10.6 117 Total Time 1 36.0 12.2 117 Time 2 35.7 12.3 117 Time 3 35.3 11.3 117 Total 35.7 11.9 351
Variation in readings along the four test areas on forearms
Corneometer values for the three areas of the right arm are shown in Table 3.20. A
general linear model comparison was made, adjusting for the time of measurement (1,
2, or 3) and the day of measurement (1, 2, or 3), and the results are shown in Table
3.21. This suggests that there was significant variability (P=00) in Corneometer scores
between the three areas, even adjusting for day and time of measurement. Table 3.20: Corneometer values for the three areas of the right arm Area Corneometer SD N B 32.4 13.0 38 C 35.4 11.2 38 D 39.2 10.6 38 Total 35.7 11.9
Table 3.21: General Linear Model of Corneometer values for each Area, adjusting for Time and Day of measurement (right arm only) Model Mean square F P Corrected Model 721.58 5.28 0.00 Time 27.01 0.19 0.65 Day 155.31 1.13 0.28 Area 1351 9.89 0.00
18

Variation in readings over three days
Table 3.22 shows the mean Corneometer readings for areas B-D, for the right arm
only, over the three days. The data shows that as the days progressed, Corneometer
SDs consistently, but non-significantly decreased (P=0.57). Scheffe’ Post Hoc
analysis revealed that there were no significant differences in Corneometer values
between the three days of testing.
Table 3.22: Corneometer values for right arm, areas B-D over three days.
Day N Mean Corneometer Min Max SD F P 1 114 36.5 9 86 12.8 0.54 0.57 2 117 35.6 5 73 12.3 3 117 34.9 8 59 34.9 Total 348 35.7 5 86 11.9
Table 3.23 shows general linear modelling analysis adjusting for Time of
measurement and Area.
Table 3.23: General Linear Model of Corneometer values for each Day, adjusting for Time and Area of measurement (right arm only) Model Mean square F P Corrected Model 717.58 5.25 0.00 Time 26.96 0.19 0.00 Day 77.87 0.57 0.56 Area 2685.86 19.66 0.00
Optimum time required for the body to reach stabilisation of readings
Tables 3.24-3.25 show the mean Corneometer readings for Areas B-D, on each of the
three days, for each of the three time periods. Irrespective of day, the lowest mean and
standard deviation of Total Corneometer values consistently occurred at Time 3 for
Areas B-D. There was a clearly observable trend of decreasing mean Corneometer
values with increasing time point measurements although this was not statistically
significant (P=0.90). Table 3.24 shows the mean Corneometer values for right arm
only, over the three time points. Table 3.25 shows the results of a General Linear
Model, comparing mean Corneometer values over the three measurement points,
adjusting for Day (1-3) and Area (B-D).
19

Table 3.24: Corneometer values for three time points, for right arm only, areas B-D
Time point N Mean Corneometer SD F P 1 117 36.0 12.2 0.10 0.90 2 117 35.7 12.3 3 114 35.3 11.3
Table 3.25: General Linear Model of Corneometer values for each Time, adjusting for Day and Area of measurement (right arm only, Areas B-D). Area Mean square F P Corrected Model 717.70 5.25 0.00 Day (1-3) 155.13 1.13 0.28 Area (B-D) 2685.86 19.66 0.00 Time (1-3) 13.94 0.10 0.90
Effects of room temperature and humidity
Measurements of air Temperature and Relative Humidity were recorded when each
individual set of Corneometer measurements were produced. Readings were recorded
on all test days. The mean temperature and relative humidity over the reading days
was 24C and 39%. The correlation between both temperature (r=0.15) and relative
humidity (0.17) with Corneometer reading was poor.
Corneometer - Summary of Baseline Results Variation in readings along the four test areas on forearms a) Analysis of Corneometer values did differ significantly between areas B-D when
adjusting for Day or Time of measurement, with higher values observed at areas further along the arm.
b) A consistent trend was observed that Corneometer readings were higher but with
lower standard deviation the further along the arm (towards the elbow) the measurements were taken.
Variation in readings over three days a) Significant differences existed in the Corneometer values between days after
adjustment was made for area and time of measurement. b) Overall Corneometer values decreased linearly over the three days of
measurement, but this decrease was not significant unless adjustment was made for time and area of measurement.
20

The optimum time required for the body to reach stabilisation of readings a) Overall Corneometer measurements from Time 3 consistently yielded the lowest
mean values for Areas B-D. b) When adjusting for Day and Area of measurement, a significant difference in
Corneometer values was observed, with lowest values observed at Time 3. c) Longer stabilisation times appeared to produce lower mean Corneometer values
with smaller standard deviations. Effects of room temperature and humidity a) There were only poor correlations between Corneometer values from all Areas
and room temperature. b) There were only poor correlations between Corneometer values from all Areas
and relative humidity. c) Temperature and Humidity values will need to continue to be recorded and
statistically adjusted for in subsequent data collection phases of the study.
21

3.3.3 Chromameter - Descriptive Data Chromameter values obtained over the three days were not normally distributed,
possessing a kurtosis of value 1.45. Tables 3.26-3.28 show the mean Chromameter
readings for area B-D of the right arm only, for each time period, on each of the three
days. Table 3.29 shows a summary of the Chromameter values over the four areas for
the three days. Table 3.26: Chromameter values for Area B, right arm only
Area B Chromameter values Time 1 2 3
Total
1 9.6 2.2
9.4 1.9
9.3 2.1
9.5 2.0
2 9.7 2.1
9.6 1.5
9.7 1.6
9.7 1.7
Day
3 9.9 1.9
10.0 1.9
10.4 1.9
10.0 1.9
Total (SD)
9.7 2.0
9.7 1.8
9.7 1.8
9.7 1.8
Table 3.27: Chromameter values for Area C, right arm only
Area C Chromameter values Time 1 2 3
Total
1 10.1 1.4
9.6 1.3
9.7 1.5
9.8 1.4
2 9.6 1.7
9.6 1.6
9.7 1.8
9.6 1.7
Day
3 10.0 1.7
9.8 2.0
9.7 1.7
9.8 1.7
Total (SD)
9.9 1.6
9.7 1.6
9.7 1.6
9.8 1.6
Table 3.28: Chromameter values for Area D, right arm only
Area D Chromameter values Time 1 2 3
Total
1 9.9 2.5
9.6 2.2
10.2 1.1
9.9 2.0
2 10.2 1.9
10.0 2.2
9.8 1.6
10.0 1.9
Day
3 10.7 2.5
10.7 2.5
9.6 3.4
10.4 2.8
Total (SD)
10.3 2.3
10.1 2.3
9.9 2.2
10.1 2.2
22

Table 3.29: Mean Chromameter values for right arm only, for all three sites and three days. Area Time Mean SD N B Time 1 9.7 2.0 39 Time 2 9.7 1.8 39 Time 3 9.7 1.8 39 Total 9.7 1.8 117 C Time 1 9.9 1.6 39 Time 2 9.7 1.6 39 Time 3 9.7 1.6 39 Total 9.8 1.6 117 D Time 1 10.3 2.3 39 Time 2 10.1 2.3 39 Time 3 9.9 2.2 39 Total 10.1 2.2 117 Total Time 1 10.0 2.0 117 Time 2 9.8 1.9 117 Time 3 9.8 1.9 117 Total 9.8 1.9 351
Variation in readings along the three test areas on forearms
Chromameter values for the three areas of the right arm are shown in Table 3.30. A
general linear model comparison was made, adjusting for the time of measurement (1,
2, or 3) and the day of measurement (1, 2, or 3), and the results are shown in Table
3.31. This suggests that there was no significant variability in Chromameter scores
between the three areas, after adjusting for day and time of measurement. . Table 3.30: Chromameter values for the three areas of the right arm Area Chromameter SD N B 9.7 1.8 39 C 9.8 1.6 39 D 10.1 2.2 39 Total 9.8 1.8 117
Table 3.31: General Linear Model of Chromameter values for each Area, adjusting for Time and Day of measurement (right arm only) Model Mean square F P Corrected Model 4.44 1.15 0.33 Time 2.14 0.55 0.45 Day 6.19 1.60 0.20 Area 4.77 1.23 0.29
23

Variation in readings over three days
Table 3.32 shows the mean Chromameter readings for areas B-D, for the right arm
only, over the three days. The data shows that as the days progressed, Chromameter
values increased slightly (but non-significantly).
Table 3.32: Chromameter values for right arm, areas B-D over three days.
Day N Mean Chromameter Min Max SD F P 1 114 9.77 6 15 1.85 0.92 0.39 2 117 9.82 5 15 1.79 3 117 10.09 1 16 2.22 Total 348 9.89 1 16 1.96
After adjusting for Time of measurement and Area, there was still no significant
difference in Chromameter values to be observed obtained over the three days, as
shown by General Linear Modelling, in Table 3.33.
Table 3.33: General Linear Model of Chromameter values for each Day, adjusting for Time and Area of measurement (right arm only) Model Mean square F P Corrected Model 4.33 1.14 0.33 Time 2.12 0.55 0.45 Day 3.59 0.93 0.39 Area 8.35 2.16 0.14
The optimum time required for the body to reach stabilisation of readings
Tables 3.34-3.35 show the mean Chromameter readings for Areas B-D, on each of the
three days, for each of the three time periods. Irrespective of day, the lowest overall
Chromameter value and standard deviation consistently occurred at Time 3 for Areas
B-D, although not being statistically significant. Table 3.34 shows the mean
Chromameter values for right arm only, over the three time points, and Table 3.35
shows the results of a General Linear Model, comparing mean Chromameter values
over the three measurement points, adjusting for Day (1-3) and Area (B-D).
Table 3.34: Chromameter values for three time points, for right arm only, areas B-D
Time point N Mean Chromameter SD F P 1 117 10.00 2.02 0.27 0.76 2 117 9.88 1.94 3 117 9.81 1.93
24

Table 3.35: General Linear Model of Chromameter values for each Time, adjusting for Day and Area of measurement (right arm only, Areas B-D). Area Mean square F P Corrected Model 4.16 1.07 0.36 Day (1-3) 6.18 1.60 0.20 Area (B-D) 8.35 2.16 0.14 Time (1-3) 1.09 0.28 0.75
Natural variability in readings within individuals
Cronbach’s Alpha Coefficient was calculated for Chromameter readings to examine
the reliability and consistency of measurements within volunteers, and this is shown
in Table 3.36.
Table 3.36: Cronbach Alpha values for TEWL measurements within individuals over all Days (Areas B-D). Area Day1 Day2 Day3 Combined
Alpha N
B .97 .93 .96 .93 12 C .89 .93 .93 .87 12 D .82 .93 .88 .82 12 Combined Alpha .94 .87 .93 N 12 12 12
Effects of room temperature and humidity
Measurements of air Temperature and Relative Humidity were recorded when each
individual set of Chromameter measurements were produced. Readings were recorded
on all test days. Correlations between temperature (-0.17), relative humidity (0.17)
and the Chromameter readings for Areas (B-D) on the right arm were poor. The mean
temperature and relative humidity over the reading days was 24C and 39%.
25

Chromameter - Summary of Baseline Results Variation in readings along the four test areas on forearms a) Analysis of Chromameter values did not differ significantly between areas B-D
when adjusting for Day or Time of measurement, although Chromameter values were higher, the further up the arm (towards the elbow) the measures were taken.
Variation in readings over three days a) Significant differences did not exist between Chromameter values across any of
the days, even after adjusting for the Time of measurement and Area of measurement.
b) Although not significant, Chromameter values were greatest on the third day and
lowest on the first day. The optimum time required for the body to reach stabilisation of readings a) When adjusting for Day and Area of measurement, no significant difference in
Chromameter values was observed across the three measurement times. b) Chromameter values were lowest at time point three, and greatest at time point
one, but such linearity of values were not significant. Natural variability in readings within individuals a) Cronbach Alpha coefficients for Chromameter readings showed an above-
acceptable level of consistency of measurements within individuals, for all days and all areas.
b) Chromameter measures appear highly consistent across all Days and Areas of
measurement. Effects of room temperature and humidity a) There were only poor correlations between Chromameter values from all Areas
and room temperature. b) There were only poor correlations between Chromameter values from all Areas
and relative humidity. c) Temperature and Humidity values will need to continue to be recorded and
statistically adjusted for in subsequent data collection phases of the study.
26

3.4 SUMMARY – INSTRUMENT BASELINE DATA (PHASE 1) Variation in readings along the four test areas (A-D) on forearms a) Of the four Areas investigated on the right arm, TEWL readings were repeatedly
significantly higher and standard deviations more widely dispersed at Area A than at areas B, C and D. Area A was excluded from any further analysis for all three instruments.
b) Analysis of TEWL and Chromameter values did not differ significantly between
areas B-D when adjusting for Day or Time of measurement (See tables 1.6 and 1.32 respectively). However the Corneometer values differed significantly between areas B-D (adjusting for Day or Time of measurement), with higher values but lower standard deviations observed at areas further along the arm (towards the elbow).
c) A consistent trend was observed that TEWL readings were lower with less
variability, the further up the arm (towards the elbow) the measures were taken. For the Chromameter the trend was in the opposite direction with lower readings closer to the wrist.
Variation in readings between arms a) TEWL values taken from the left arm, when matched with values from the
opposite arm of the same individual, were significantly higher than right arm values.
b) When TEWL readings from the left arm were compared with those from the right
arm taken first at Time 1 (before any other subsequent measures were taken at Time 2 or 3) there was no significant difference in the values.
c) The possibility exists that previous measurement taken from right arm areas B-D
at Time 1 & 2 could play a part in reducing TEWL values taken at Time 3. It is therefore possible that in the process of measuring TEWL values, a genuine decrease in TEWL scores is caused by taking those measurements.
Variation in readings over three days a) Significant differences existed in the TEWL and Corneometer values between
days, even after adjusting for the Time of measurement and Area of measurement. b) There was no linearity of trend in the changes of TEWL values over the three
days. The Corneometer values decreased linearly over the three days of measurement, but this decrease was not significant unless adjustment was made for Time and Area of measurement.
c) Significant differences did not exist between Chromameter values across any of
the days, even after adjusting for the Time of measurement and Area of measurement.
27

The optimum time required for the body to reach stabilisation of readings a) For Areas B-D, TEWL and Corneometer measurements consistently yielded the
lowest mean at Time 3. Chromameter values were lowest at time point three, and greatest at time point one, but such linearity of values were not significant.
b) Longer stabilisation times appeared to produce lower mean TEWL and
Corneometer values with smaller standard deviations, however for the Chromameter no significant difference was observed across the three measurement times.
Natural variability in readings within individuals a) Cronbach Alpha coefficients for TEWL readings showed an above-acceptable
level of consistency of measurements within individuals for Days 2 and 3. However, a poor level of internal consistency was observed on Day 1.
b) Cronbach Alpha coefficients for Chromameter readings showed an above-
acceptable level of consistency of measurements within individuals, for all days and all areas. When comparing the three instruments the Chromameter readings were the most consistent across all Days and Areas of measurements.
Effects of room temperature and humidity a) There were poor correlations for both Corneometer and Chromameter values from
all Areas and room temperature. There were moderate correlations between TEWL values, ranging from 0.32 to 0.73. Of the three instruments the TEWL was most dependent on room temperature.
b) All three instruments produced readings at the time of measurement, which were
not affected by relative humidity. Of the three instruments the TEWL was most dependent on relative humidity values ranging from 0.05 to0.52.
28

CHAPTER 4: SHORT TERM OCCLUSION TESTING WITH A BC, OILS AND SLS (PHASE II)
4.1 Introduction
From the findings of the baseline measurements – phase 1 (section 3.0) an optimum
test protocol was developed for testing repeated exposure to chemicals under
occlusion, mimicking “worst-case” occupational exposure. Each of the thirteen
volunteers used for analysis in the baseline measurements, were invited to participate
in Phase II of the study.
Aims and Objectives for each instrument
1. Establishing severity of effects of chemicals on instrument values
2. Establishing protective effects of BC
3. Establishing severity of effects of chemicals compared with BC as baseline
4. Correlation of instrument and Visual Analysis values for test site
4.2 Methodology
On considering the shift patterns of the workers and time taken to carry out the skin
measurements on each individual, a timetable was drawn up to test volunteers at the
same time each day (Appendix 3). Research has shown that skin barrier function
varies throughout the day (Yosipovitch et al 1997) and so in order to maintain
consistency, it is important to test volunteers at the same time every day.
The method used for the occlusion phase was the Repetitive Occlusion Irritation Test
(ROIT) used by a number of researchers in this field (Frosch et al 1993c, and
Schluter-Wigger and Elsner 1996).
4.2.1 Individuals tested
Eleven of the thirteen initial volunteers agreed to be involved in further testing on
their forearms using the same measurement template as used for recording baseline
measurements. Ten further volunteers were also asked to participate in Phase II.
29

4.2.2 Forearm test site
The three sites on the forearm (B, C and D) were either treated with a BC or a
chemical (one of two soluble metal working fluids used by the workers or SLS 5%).
A control site adjacent to site C was also used. The BC and chemicals tested are
described below in section 4.2.3. Volar aspects of both forearms were tested for all
individuals. Chemicals tested, test sites and control sites are shown in figure 4
(section 4.2.6).
4.2.3 BC and chemicals tested
The Deb Protect BC was tested along with two different soluble oils (Houghto-Grind
590 and Hocut 809) and SLS on all volunteers. The Deb Protect BC and the oils
tested are used on site within the workplace.
Deb Protect (pale yellow unperfumed cream, pH 6. at 25°C) is a multi- purpose BC
which according to the manufacture will provides protection against both water based
and non-water based soilings e.g. oils, grease, detergents, solvents, dry powders and
adhesives. One application of a small quantity is claimed to provide 2-3 hours of
protection. The BC protect contains a mixture of emulsifiable waxes, white oils,
kaolin and wheat germ extract. It is recommended that the cream be applied to clean
dry skin before commencing work (Debs Ltd, 2003).
SLS is a known irritant and used widely in skin irritation testing (Tupker et al. 1997)
and was tested at a 5% concentration.
Houghto-Grind 590 and Hocut 809 are both soluble oils (manufactured by Houghton
Vaughan plc) referred to in this study as oil 1 and oil 2 respectively. Both products
were used as metal working lubricants/coolants. Oil 1 was a synthetic oil based on
soaps, free of mineral oils and used mainly as a coolant. Oil 2 was a water-based
semi-synthetic oil containing up to 40% mineral oils and thus provides more
lubrication than synthetic oils. Both oils have the potential to irritate skin because of
their alkaline pH and high composition of emulsifiers and solvents. Both oils were
tested without dilution on volunteers in order to emulate worse case exposures.
30

4.2.4 Test procedure - Preparation and application of chemicals
The procedure used for the preparation and occlusion of chemicals was as follows:
1. A small amount of each chemical and BC were placed into separate galley pots.
2. Backing tape was removed from the Finn Chambers® which were then placed on a
work surface in the order they were to be placed on the forearm.
3. Using tweezers, filter discs were individually dipped into the appropriate oil and
then placed into the appropriate Finn Chamber®.
4. On entering the surgery, volunteers were asked to remove all jewellery, watches and
overalls with any long sleeves. They were seated with their forearms facing
upwards, resting on the arm of their chair
5. The cloth template was placed over the forearm and a skin pen was used to mark out
the appropriate testing areas.
6. A wooden dipstick was used to dose BC, which yielded approximately 1mg of BC,
and placed it in the centre of each required area. The BC was spread evenly across
the testing area but not rubbed into the skin.
7. Corresponding Finn Chambers were then placed onto appropriate areas of the
forearm.
8. Finn Chambers, which did not contain any chemical, were placed directly onto the skin as empty chambers.
9. Once this procedure had been carried out, volunteers returned to work.
10. After one hour of occlusion, the volunteer returns to the surgery office and the Finn
Chambers® were removed from the forearms, which were wiped clean.
4.2.5 Testing schedule
The occlusion procedure described in section 1.2.4 took place on Monday to Friday
for two weeks for each volunteer. Measurements using bioengineering instruments
were taken on Monday, Wednesday and Friday of each week as shown in Figure 4.1.
On Tuesdays and Thursdays, following the removal of Finn Chambers®, volunteers
were asked to return to work as normal. A timetable provided for workers for the
duration of their testing period can be seen in Appendix 1.
31

Figure 4.1 - Phase II – Chemical occlusion and measurements days for individuals tested
Week 1 Week 2
Mon Tues Wed Thurs Fri Mon Tues Wed Thurs Fri
Occlusion of chemicals Measurements and
visual scoring
4.2.6 Measurements
The following relates to the procedure for volunteers on Monday, Wednesday and
Friday when measurements using bioengineering instruments were conducted:
1. Volunteers were asked to lie down on a medical bed situated in the surgery office
where baseline measurements took place.
2. Volunteers were asked to lie with their right arm outstretched onto a stool of the
same height with their forearm facing upwards. The forearm at this point was also
directly below the laser beam. At this point, it was ensured that the forearm was in
exactly the correct position by marking out the area using the Moor-LDI software.
3. The volunteers’ left arms were laid alongside their body.
4. Volunteers’ comfort was checked to ensure they could remain still for 30 minutes
5. After the 30 minutes acclimatisation period, the measurements were taken in the
same way as previously described in the baseline measurements (section 1.2.4).
6. A visual score of each area was also noted in accordance with the Visual Scoring
Technique described below (in section 1.2.7).
7. Once all measurements were taken, volunteers returned to work, and they were
asked to come back to the surgery at the same time every day for the following
two weeks.
Fig 4.2 shows how the forearms were prepared for phase II of the study when
chemicals were occluded onto the skin. However, baseline measurements were
previously taken from exactly the same areas of the forearm, (areas A to D) in the
phase 1 of the study, without any chemicals being occluded.
32

Figure 4.2 Diagram of forearms showing test areas and chemicals tested
Right Volar Forearm Left Volar Forearm
Antecubital Fossa region Antecubital Fossa region
Wrist Area
Area C BC +
SLS 5%
Area D SLS 5%
3cm Area DOil 1
Area BBC
Area CBC + Oil1
Control
Area A
BC - Deb protect barrier SLS - Sodium lauryl sulpOil 1 = Synthetic Oil (HOil 2 = Semi-synthetic o
2cm
2cm
Wrist Area
Area A
Area B BC + Oil 2
cream (1mg) hate (5%) oughto-Grind 590) – neat il (Hocut 809) –neat
33

4.2.7 Visual scoring
The following visual scoring technique was used to assess any skin damage suffered
by volunteers (Frosch et al 1993)
0 = No reaction
0.5 = Barely perceptible, very weak, spotty erythema
1 = Slight erythema, either spotty or diffuse
2 = Moderate erythema
3 = Intense erythema, infiltration, possible vesicles.
The visual scoring technique was carried out along with the bioengineering
measurements following the 30 minutes acclimatisation period. If a reaction of 0.5 or
1 was noted, then occlusion of chemicals was continued with the consent of the
volunteer. However, if a visual score of 2 or more was observed the occlusion was
ceased, as the reaction was sufficient to be clearly noted.
4.3 Results
4.3.1 Demographics of Volunteers
The age range of the volunteers was 34-60 years. (Mean 45 years). Twelve were non-
smokers. The group was culturally diverse as 76.5% (13) were white, 5.9% (1) Indian
and 17.6% (3) African-Caribbean. All of the volunteers were right-handed.
All of the volunteers were aware of how to protect their skin in the workplace but the
group was split in terms of whether they thought they were provided with sufficient
information about substances they work with. 88.2% (15) of the group wore gloves
and only 35.3% (6) of the volunteers used barrier cream. The volunteers who used
barrier creams also used gloves and so no volunteers relied solely on barrier creams
for skin protection. Of the volunteers who used barrier creams, all of them used Deb
Protect.
34

4.3.2 Results of TEWL measurements
The mean TEWL readings for each site on both forearms can be seen in Fig 4.3
Figure 4.3
Right Volar Forearm Left Volar Forearm
Antecubital Fossa region Antecubital Fossa region
Area C SLS 5% + BC
17.4 ± 10.1
Area D SLS 5%
40.4 ± 22.9
Area D Oil 1
9.7 ± 5.9
Area C BC+ Oil 1 10.2 ± 7.2
Area B BC
12.5 ± 4.9
3cm
Control
10.4 ± 7.6
Area A
Wrist Area
2cm
2cm
Area A
Area B BC+ Oil 2 17.4 ± 8.8
Wrist Area
35
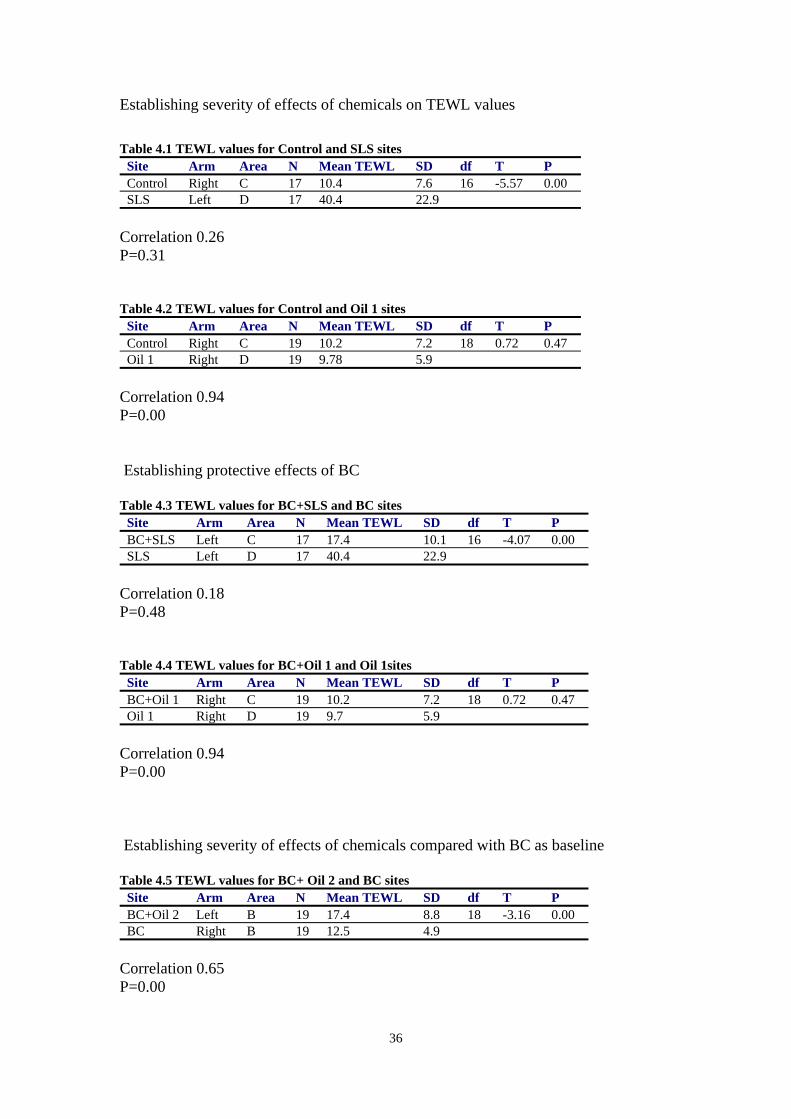
Establishing severity of effects of chemicals on TEWL values
Table 4.1 TEWL values for Control and SLS sites
Site Arm Area N Mean TEWL SD df T P Control Right C 17 10.4 7.6 16 -5.57 0.00 SLS Left D 17 40.4 22.9
Correlation 0.26 P=0.31 Table 4.2 TEWL values for Control and Oil 1 sites
Site Arm Area N Mean TEWL SD df T P Control Right C 19 10.2 7.2 18 0.72 0.47 Oil 1 Right D 19 9.78 5.9
Correlation 0.94 P=0.00 Establishing protective effects of BC Table 4.3 TEWL values for BC+SLS and BC sites
Site Arm Area N Mean TEWL SD df T P BC+SLS Left C 17 17.4 10.1 16 -4.07 0.00 SLS Left D 17 40.4 22.9
Correlation 0.18 P=0.48 Table 4.4 TEWL values for BC+Oil 1 and Oil 1sites
Site Arm Area N Mean TEWL SD df T P BC+Oil 1 Right C 19 10.2 7.2 18 0.72 0.47 Oil 1 Right D 19 9.7 5.9
Correlation 0.94 P=0.00 Establishing severity of effects of chemicals compared with BC as baseline Table 4.5 TEWL values for BC+ Oil 2 and BC sites
Site Arm Area N Mean TEWL SD df T P BC+Oil 2 Left B 19 17.4 8.8 18 -3.16 0.00 BC Right B 19 12.5 4.9
Correlation 0.65 P=0.00
36

Table 4.6 TEWL values for BC+Oil 1 and BC sites Site Arm Area N Mean TEWL SD df T P BC+Oil 1 Right C 19 10.2 7.2 18 1.86 0.07 BC Right B 19 12.5 4.9
Correlation 0.64 P=0.00 Table 4.7 TEWL values for BC+SLS and BC sites
Site Arm Area N Mean TEWL SD df T P BC+SLS Left C 18 18.5 10.8 17 -2.9 0.01 BC Right B 18 12.6 5.0
Correlation 0.64 P=0.00 Table 4.8 TEWL values for BC+Oil 1 and BC+Oil 2 sites
Site Arm Area N Mean TEWL SD df T P BC+Oil 1 Right C 19 10.2 7.2 18 -3.46 0.00 BC+Oil 2 Left B 19 17.4 8.8
Correlation 0.36 P=0.12
37

Fig 4.4 Mean TEWL readings and visual scores (Right arm)
TEWL (Right Arm) Over Time
4
6
8
10
12
14
Day 1 Day 3 Day 5 Day 8 Day 10 Day 12
Day
TEW
L Va
lue Area B TEWL
Area C TEWLArea D TEWLControl TEWL
Fig 4.5 Mean TEWL readings and visual scores (Left Arm)
TEWL (Left Arm) Over Time
1.125
1.41.1
1.211.25
1.4
1.71.5
51015202530354045
Day 1 Day 3 Day 5 Day 8 Day 10 Day 12
Day
TEW
L Va
lue
Area B TEWL (Left)Area C TEWL (Left)Area D TEWL (Left)Control TEWL (Left)
TEWL values and visual scores recorded for select individuals who produce an irritant reaction to SLS (area D) over the occlusion days are shown in the Appendix 1.
38
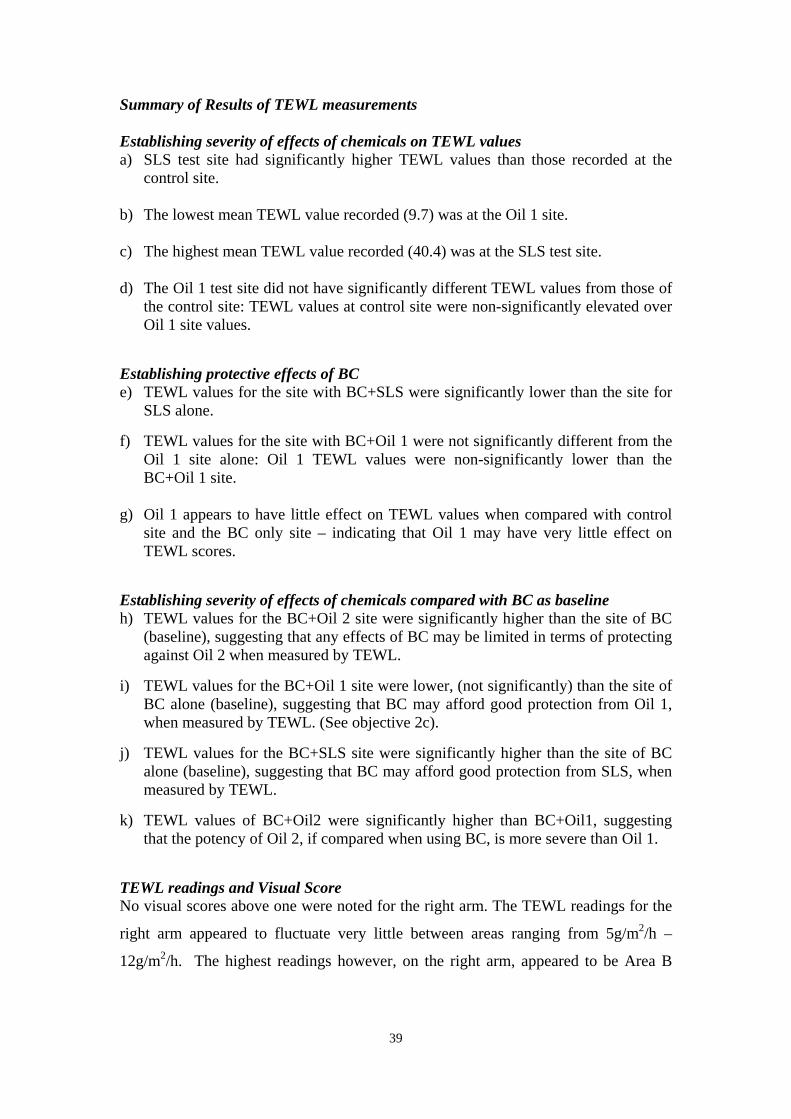
Summary of Results of TEWL measurements Establishing severity of effects of chemicals on TEWL values a) SLS test site had significantly higher TEWL values than those recorded at the
control site. b) The lowest mean TEWL value recorded (9.7) was at the Oil 1 site. c) The highest mean TEWL value recorded (40.4) was at the SLS test site. d) The Oil 1 test site did not have significantly different TEWL values from those of
the control site: TEWL values at control site were non-significantly elevated over Oil 1 site values.
Establishing protective effects of BC e) TEWL values for the site with BC+SLS were significantly lower than the site for
SLS alone. f) TEWL values for the site with BC+Oil 1 were not significantly different from the
Oil 1 site alone: Oil 1 TEWL values were non-significantly lower than the BC+Oil 1 site.
g) Oil 1 appears to have little effect on TEWL values when compared with control
site and the BC only site – indicating that Oil 1 may have very little effect on TEWL scores.
Establishing severity of effects of chemicals compared with BC as baseline h) TEWL values for the BC+Oil 2 site were significantly higher than the site of BC
(baseline), suggesting that any effects of BC may be limited in terms of protecting against Oil 2 when measured by TEWL.
i) TEWL values for the BC+Oil 1 site were lower, (not significantly) than the site of
BC alone (baseline), suggesting that BC may afford good protection from Oil 1, when measured by TEWL. (See objective 2c).
j) TEWL values for the BC+SLS site were significantly higher than the site of BC
alone (baseline), suggesting that BC may afford good protection from SLS, when measured by TEWL.
k) TEWL values of BC+Oil2 were significantly higher than BC+Oil1, suggesting
that the potency of Oil 2, if compared when using BC, is more severe than Oil 1. TEWL readings and Visual Score No visual scores above one were noted for the right arm. The TEWL readings for the
right arm appeared to fluctuate very little between areas ranging from 5g/m2/h –
12g/m2/h. The highest readings however, on the right arm, appeared to be Area B
39

(Barrier Cream alone), indicating that a moisturising substance on the skin enhances
TEWL readings when compared with the Control areas.
On the left forearm, TEWL readings for Area D increased over time. Visual scores of
above one were noted at each reading from Day 5 to Day 12 where TEWL readings
ranged from 20.1g/m2/h – 40.40g/m2/h. This indicates that TEWL is an effective
indicator of skin irritation when used with SLS alone. Although Area B+C on the left
arm displayed visual scores from Day 10, TEWL readings remained relatively low,
indicating again that TEWL readings may be affected when moisturising substances
such as BC is placed on the skin.
40

4. 3.3 Chromameter
The mean Chromameter readings for each site on both forearms can be seen in Fig 6.
Figure 4.6
Right Volar Forearm Left Volar Forearm
Antecubital Fossa region Antecubital Fossa region
Area C SLS 5% + BC
12.7 ± 2.0
Area D SLS 5%
17.0 ± 3.1
Area D Oil 1
11.7 ± 1.5
Area C BC+ Oil 1 11.1 ± 1.8
Area B BC
10.4 ± 1.5
3cm
Control
10.5 ± 1.6
Area A
Wrist Area
2cm
2cm
Area A
Area B BC+ Oil 2 12.3 ± 2.0
Wrist Area
41

Establishing severity of effects of chemicals on Chromameter values
Table 4.9 Chromameter values for Control and SLS sites
Site Arm Area N Mean Chromameter SD df T P Control Right C 17 11.4 1.8 16 -6.95 0.00 SLS Left D 17 17.0 3.1
Correlation 0.20 P=0.43 Table 4.10 Chromameter values for Control and Oil 1 sites
Site Arm Area N Mean Chromameter SD df T P Control Right C 19 10.5 1.6 18 2.95 0.00 Oil 1 Right D 19 11.7 1.5
Correlation 0.36 P=0.12 Establishing the protective effects of BC Table 4.11 Chromameter values for BC+SLS and SLS sites
Site Arm Area N Mean Chromameter SD df T P BC+SLS Left C 17 12.7 2.0 16 -6.54 0.00 SLS Left D 17 17.0 3.1
Correlation 0.55 P=0.02 Table 4.12 Chromameter values for BC+Oil 1 and Oil 1sites
Site Arm Area N Mean Chromameter SD df T P BC+ Oil 1 Right C 19 11.1 1.8 18 -1.95 0.06 Oil 1 Right D 19 11.7 1.5
Correlation 0.69 P=0.00
42

Establishing the severity of effects of chemicals compared with BC as baseline Table 4.13 Chromameter values for BC+ Oil 2 and BC sites
Site Arm Area N Mean Chromameter SD df T P BC+ Oil 2 Left B 19 12.3 2.0 18 -4.38 0.00 BC Right B 19 10.4 1.5
Correlation 0.53 P=0.01 Table 4.14 Chromameter values for BC+ Oil 1 and BC sites
Site Arm Area N Mean Chromameter SD df T P BC+Oil 1 Right C 19 11.1 1.8 18 -1.9 0.00 BC Right B 19 10.4 1.5
Correlation 0.56 P=0.01 Table 4.15 Chromameter values for BC+SLS and BC sites
Site Arm Area N Mean Chromameter SD df T P BC+SLS Left C 18 12.9 2.1 17 -4.84 0.00 BC Right B 18 10.5 1.5
Correlation 0.36 P=0.13 Table 4.16 Chromameter values for BC+Oil 1 and BC+Oil 2 sites
Site Arm Area N Mean Chromameter SD df T P BC+Oil 1 Right C 19 11.1 1.8 18 -2.30 0.03 BC+Oil 2 Left B 19 12.3 2.0
Correlation 0.42 P=0.06
43
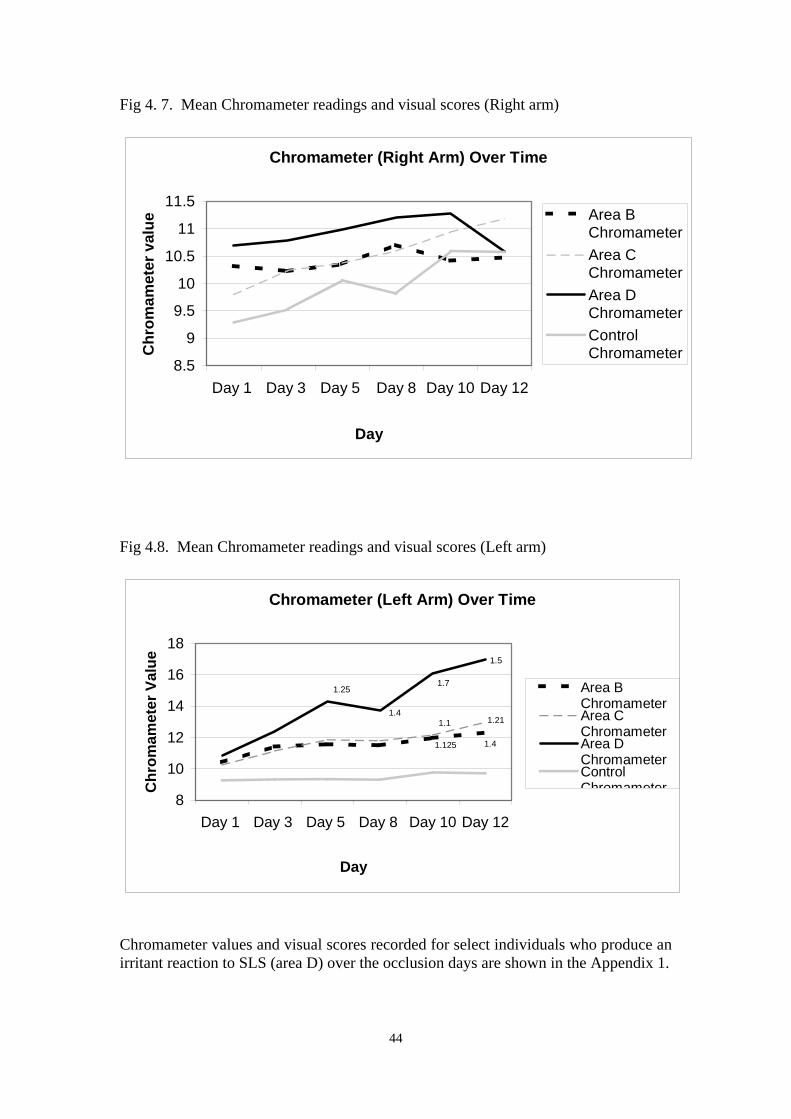
Fig 4. 7. Mean Chromameter readings and visual scores (Right arm)
Chromameter (Right Arm) Over Time
8.5
9
9.5
10
10.5
11
11.5
Day 1 Day 3 Day 5 Day 8 Day 10 Day 12
Day
Chr
omam
eter
val
ue
Area BChromameterArea CChromameterArea DChromameterControlChromameter
Fig 4.8. Mean Chromameter readings and visual scores (Left arm)
Chromameter (Left Arm) Over Time
1.41.125
1.1 1.21
1.5
1.7
1.4
1.25
8
10
12
14
16
18
Day 1 Day 3 Day 5 Day 8 Day 10 Day 12
Day
Chr
omam
eter
Val
ue
Area BChromameterArea CChromameterArea DChromameterControlChromameter
Chromameter values and visual scores recorded for select individuals who produce an irritant reaction to SLS (area D) over the occlusion days are shown in the Appendix 1.
44

Summary of Results of Chromameter measurements Establishing severity of effects of chemicals on Chromameter values a) SLS test site had significantly higher Chromameter values than those recorded at
the control site. b) The lowest mean Chromameter value recorded (10.5) was at the BC test site. c) The highest mean Chromameter value recorded (17.0) was at the SLS test site. d) The Oil 1 test site had significantly different Chromameter values from those of
the control site: Chromameter values at Oil 1 site were significantly elevated over control site values.
Establishing protective effects of BC e) Chromameter values for the SLS site were significantly higher than the site of
BC+SLS alone, suggesting that BC may afford good protection from SLS, when measured by Chromameter.
f) Chromameter values for the site with BC+Oil 1 were not significantly different
from the Oil 1 site alone: Oil 1 Chromameter values were non-significantly higher than the BC+Oil 1 site – indicating that BC may have very little effect on Chromameter scores.
g) Chromameter values for Oil 1 site were significantly different when compared to
control site and BC site alone. Establishing severity of effects of chemicals compared with BC as baseline h) Chromameter values for the BC+Oil 2 site were significantly higher than the
site of BC alone, suggesting that any effects of BC may be limited in terms of protecting against Oil 2 when measured by Chromameter.
i) Chromameter values for the BC+Oil 1 site were significantly higher than the
site of BC alone, suggesting that BC may be limited in terms of protecting against Oil 1 when measured by the Chromameter (See objective 2c).
j) Chromameter values of BC+SLS were shown to be significantly lower than
SLS alone (Table 1.11). However, BC+SLS Chromameter values were shown to be significantly higher than BC alone. This indicates that BC provides only an element of protection against SLS.
k) Chromameter values of BC+ Oil 2 were significantly higher than BC+ Oil 1,
suggesting that the potency of Oil 2, if compared when using BC, is more severe than Oil 1.
Chromameter Readings and Visual Score No visual scores for the right arm were noted. Chromameter values appeared to
fluctuate very little over time and so in considering this, it would not be anticipated
that any visual irritation would be displayed.
45

On the left arm, Chromameter values for Area D increased over time. Visual scores
of above one were noted at each reading from Day 5 to Day 12 where Chromameter
readings ranged from 13.7-17.01. This indicates that the Chromameter is an effective
indicator of skin irritation when used with SLS alone. Chromameter values for Areas
B+C were also elevated when compared to the control area suggesting that the
Chromameter is an effective when measuring skin colour and skin irritation.
46

4 .3.4 Results of Corneometer measurements
The mean Corneometer readings for each site on both forearms can be seen in Fig 4.9
Figure 4.9
Right Volar Forearm Left Volar Forearm
Antecubital Fossa region Antecubital Fossa region
Area C SLS 5% + BC
38.0 ± 11.4
Area D SLS 5%
40.3 ± 15.7
Area D Oil 1
71.8 ± 12.2
Area C BC+ Oil 1 66.0 ± 15.4
Area B BC
42.6 ± 10.4
3cm
Control
50.4 ± 11.9
Area A
Wrist Area
2cm
2cm
Area A
Area B BC+ Oil 2 41.1 ± 10.8
Wrist Area
47

Establishing severity of effects of chemicals on Corneometer values
Table 4.17 Corneometer values for Control and SLS sites
Site Arm Area N Mean Corneometer
SD df T P
Control Right C 17 51.5 11.6 16 2.51 0.02 SLS Left D 17 40.3 15.7
Correlation 0.13 P=0.61 Table 4.18 Corneometer values for Control and Oil 1 sites
Site Arm Area N Mean Corneometer
SD df T P
Control Right C 19 50.4 11.9 18 9.27 0.00 Oil 1 Right D 19 71.8 12.2
Correlation 0.65 P=0.00 Establishing protective effects of BC Table 4.19 Corneometer values for BC+SLS and BC sites
Site Arm Area N Mean Corneometer
SD df T P
BC+SLS Left C 17 38.5 11.5 16 -0.43 0.67 SLS Left D 17 40.3 15.7
Correlation 0.26 P=0.30 Table 4.20 Corneometer values for BC+Oil 1 and Oil 1sites
Site Arm Area N Mean Corneometer
SD df T P
BC+Oil 1 Right C 19 63.1 15.0 18 -3.5 0.00 Oil 1 Right D 19 71.8 12.2
Correlation 0.70 P=0.00
48
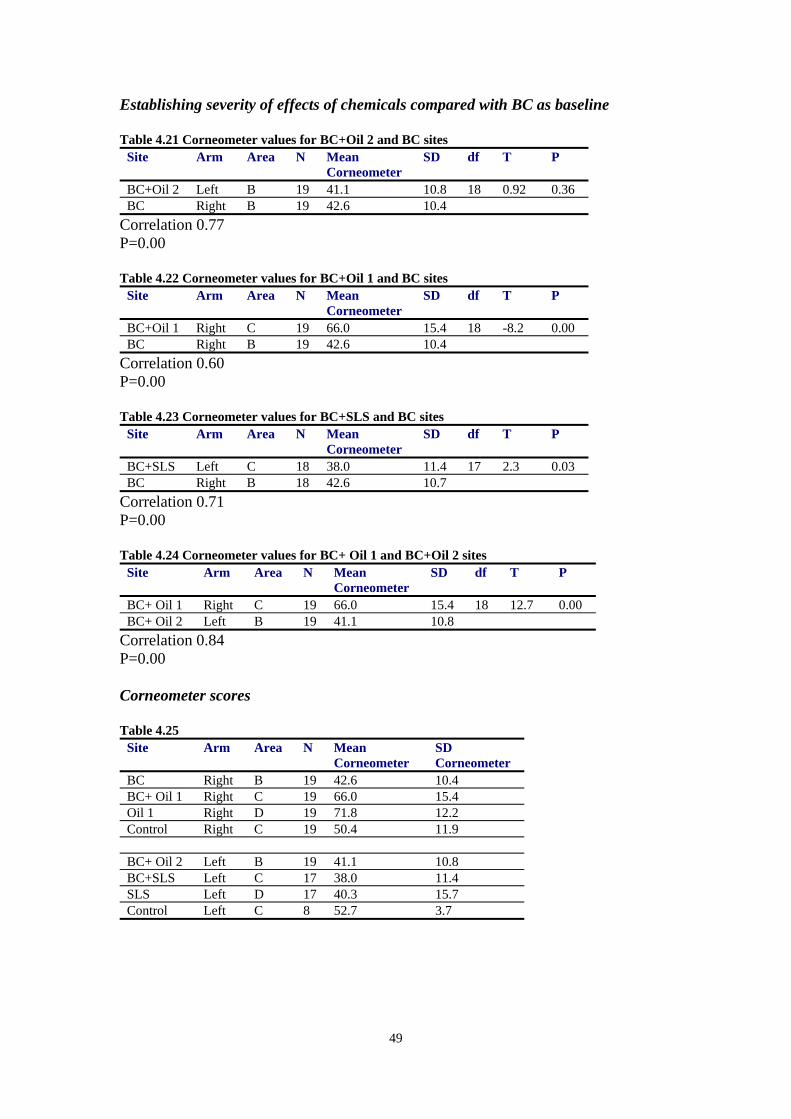
Establishing severity of effects of chemicals compared with BC as baseline Table 4.21 Corneometer values for BC+Oil 2 and BC sites
Site Arm Area N Mean Corneometer
SD df T P
BC+Oil 2 Left B 19 41.1 10.8 18 0.92 0.36 BC Right B 19 42.6 10.4
Correlation 0.77 P=0.00 Table 4.22 Corneometer values for BC+Oil 1 and BC sites
Site Arm Area N Mean Corneometer
SD df T P
BC+Oil 1 Right C 19 66.0 15.4 18 -8.2 0.00 BC Right B 19 42.6 10.4
Correlation 0.60 P=0.00 Table 4.23 Corneometer values for BC+SLS and BC sites
Site Arm Area N Mean Corneometer
SD df T P
BC+SLS Left C 18 38.0 11.4 17 2.3 0.03 BC Right B 18 42.6 10.7
Correlation 0.71 P=0.00 Table 4.24 Corneometer values for BC+ Oil 1 and BC+Oil 2 sites
Site Arm Area N Mean Corneometer
SD df T P
BC+ Oil 1 Right C 19 66.0 15.4 18 12.7 0.00 BC+ Oil 2 Left B 19 41.1 10.8
Correlation 0.84 P=0.00 Corneometer scores Table 4.25
Site Arm Area N Mean Corneometer
SD Corneometer
BC Right B 19 42.6 10.4 BC+ Oil 1 Right C 19 66.0 15.4 Oil 1 Right D 19 71.8 12.2 Control Right C 19 50.4 11.9 BC+ Oil 2 Left B 19 41.1 10.8 BC+SLS Left C 17 38.0 11.4 SLS Left D 17 40.3 15.7 Control Left C 8 52.7 3.7
49

Fig 4. 10. Mean Corneometer readings and visual scores (Right arm)
Corneometer (Right Arm) Over Time
30
40
50
60
70
80
Day 1 Day 3 Day 5 Day 8 Day10
Day12
Day
Cor
neom
eter
Val
ue
Area B CorneometerArea C CorneometerArea D CorneometerControl Corneometer
Fig 4.11. Mean Corneometer readings and visual scores (Left arm)
Corneometer (Left Arm) Over Time
1.125 1.4
1.211.1
1.25
1.4
1.7
1.5
30
35
40
45
50
55
Day 1 Day 3 Day 5 Day 8 Day10
Day12
Day
Cor
neom
eter
Val
ue
Area B Corneometer
Area C Corneometer
Area D Corneometer
ControlCorneometer
Corneometer values and visual scores recorded for select individuals who produce an irritant reaction to SLS (area D) over the occlusion days are shown in the Appendices.
50

Summary of Results of Corneometer measurements Establishing severity of effects of chemicals on Corneometer values a) SLS test site had significantly lower mean Corneometer values than those
recorded at the control site. b) The lowest mean Corneometer value recorded (38) was at the site of BC+SLS. c) The highest mean Corneometer value recorded (71.8) was at the Oil 1test site. d) The Oil 1 test site had highly significantly different Corneometer values from
those of the control site: Corneometer values at Oil 1 site were significantly elevated over Control site values.
Establishing protective effects of BC e) Corneometer values for the site with BC+SLS were not significantly different
from the site for SLS alone. f) Corneometer values for the site with BC+Oil 1 were significantly different from
the Oil 1 site alone: Oil 1 Corneometer values were significantly higher than the BC+Oil 1 site.
g) Corneometer values for the site of Oil 1 were significantly different from the
Control and BC site, this significantly higher value indicates that Oil 1 site is more sufficiently moisturised than either the control site or BC alone.
Establishing severity of effects of chemicals compared with BC as baseline h) Corneometer values for the BC+Oil 2 site were not significantly different from the
site of BC (baseline), suggesting either Oil2 is a low potency oil or that BC is effective in protecting the skin against Oil 2 when measured by Corneometry.
i) Corneometer values for the BC+Oil 1 site were significantly higher than the site
of BC alone (baseline), suggesting that BC+Oil 1 site is more sufficiently moisturised than BC alone when measured by Corneometer.
j) Corneometer values of BC+Oil 1 were significantly higher than BC+Oil 2,
suggesting that moisture content of Oil 1, if compared when using BC, is higher than that of Oil 2.
k) Corneometer values for the BC+SLS site were significantly lower than the site of
BC alone (baseline), indicating that although according to Corneometry guidelines, both mean values would be categorised as ‘dry’ that BC alone is regarded as having a higher moisture content than BC+SLS site.
Corneometer Readings and Visual Score No visual scores more than one were noted on the right arm. All Corneometer
readings on the right arm, according to Corneometry guidelines, indicated that areas
were either classified as ‘dry’ (Area B) or sufficiently moisturised (Area C, D and
51

Control). In considering this, it would not be anticipated that any visual irritation
would be displayed.
In contrast to this, however, the mean left arm readings were classified as ‘dry’ with
the exception of two readings. This indicates that there is little consistency between
visual scores and Corneometry readings.
52

4.3.5 Results of Doppler measurements
The mean Doppler readings for each site on both forearms can be seen in Fig 4.12.
Figure 4.12.
Right Volar Forearm
Antecubital Fossa region
Area D Oil 1
210 + 97
Area C BC+ Oil 1 223 + 100
Area B BC
202 + 88
3cm
Control 225 + 115
Area A
Wrist Area
2cm
2cm
53
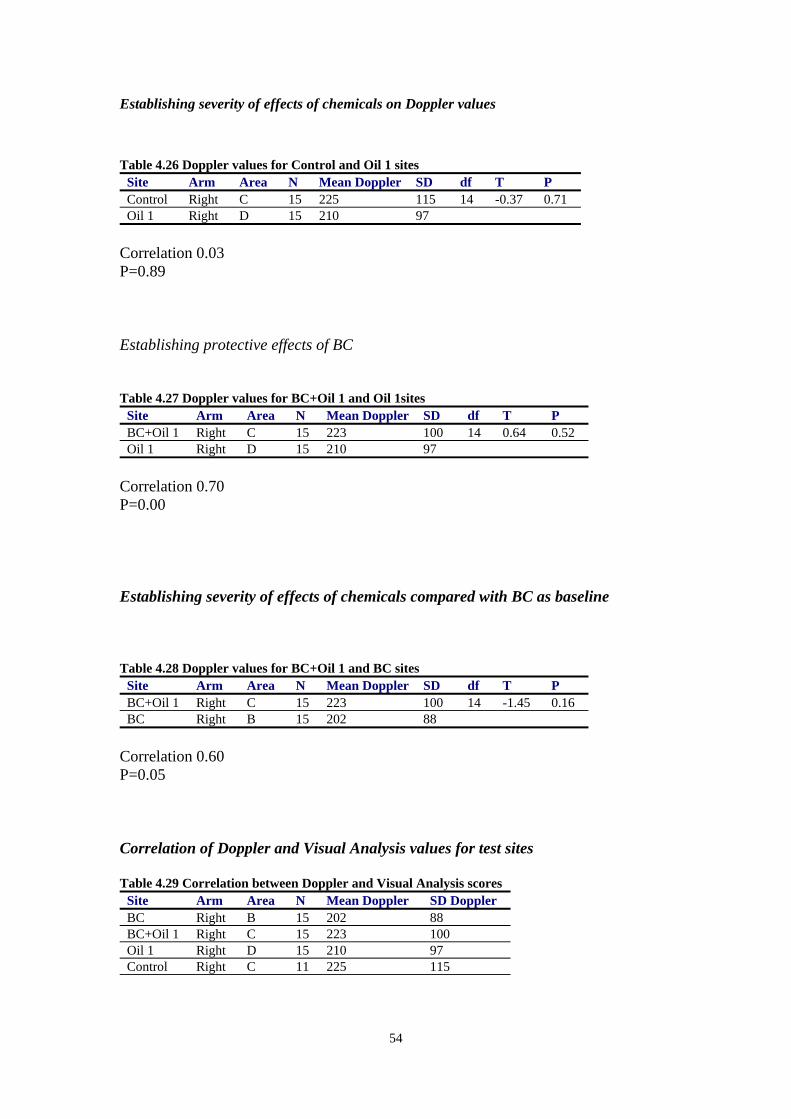
Establishing severity of effects of chemicals on Doppler values
Table 4.26 Doppler values for Control and Oil 1 sites
Site Arm Area N Mean Doppler SD df T P Control Right C 15 225 115 14 -0.37 0.71 Oil 1 Right D 15 210 97
Correlation 0.03 P=0.89 Establishing protective effects of BC Table 4.27 Doppler values for BC+Oil 1 and Oil 1sites
Site Arm Area N Mean Doppler SD df T P BC+Oil 1 Right C 15 223 100 14 0.64 0.52 Oil 1 Right D 15 210 97
Correlation 0.70 P=0.00 Establishing severity of effects of chemicals compared with BC as baseline Table 4.28 Doppler values for BC+Oil 1 and BC sites
Site Arm Area N Mean Doppler SD df T P BC+Oil 1 Right C 15 223 100 14 -1.45 0.16 BC Right B 15 202 88
Correlation 0.60 P=0.05 Correlation of Doppler and Visual Analysis values for test sites Table 4.29 Correlation between Doppler and Visual Analysis scores
Site Arm Area N Mean Doppler SD Doppler BC Right B 15 202 88 BC+Oil 1 Right C 15 223 100 Oil 1 Right D 15 210 97 Control Right C 11 225 115
54

Summary of Results of Laser Doppler Measurements Establishing Severity of the effects of chemicals on Laser Doppler Values a) The lowest mean Laser Doppler value (202) was recorded at the BC site b) The highest mean Laser Doppler value (225) was recorded at the control site c) The Oil 1 test site did not have a significantly different Doppler value from that of
the control site: Doppler values at control site were non-significantly elevated over Oil 1 site values.
Establishing the protective effects of BC d) Laser Doppler values for the site with BC+Oil 1 was not significantly different
from the Oil 1 site alone: Oil 1 Doppler values were non-significantly lower than the BC+Oil 1 site.
e) Oil 1 appears to have little effect on Doppler values when compared with control
site and the BC site only. This indicates that Oil 1 may have very little effect on Doppler values and therefore on blood flux.
Establishing severity of effects of chemicals compared with BC as baseline f) Laser Doppler values for the BC+Oil 1 site were higher (not significantly) than
the site of BC alone suggesting that BC may afford good protection from Oil 1, when measured by Laser Doppler.
55

4.4 Summary of findings - Occlusion Testing Establishing the severity of effects of chemicals a. SLS test site had significantly higher TEWL and Chromameter values than those
recorded at the control site. b. SLS test site had a significantly lower Corneometer value than that recorded at
the control site. c. The Oil 1 test site did not have significantly different TEWL or Laser Doppler
values from those of the control site. However, the Chromameter and Corneometer values for the Oil 1 test site were significantly elevated over the control site.
Establishing protective effects of BC a. TEWL and Chromameter values for the site with BC+SLS were significantly
lower than for the site of SLS alone. There was no significant difference between the two sites when by measured by the Corneometer.
b. TEWL, Chromameter and Laser Doppler values for the site with BC+Oil 1 were
not significantly different from the Oil 1 site alone. There was a significant difference between the two sites when measured by the Corneometer.
c. Oil 1 appears to have little effect on TEWL and Laser Doppler values when
compared with Control site and BC only site. However, when measured by Chromameter and Corneometer, a significant difference was noted between Oil 1 site and the Control and BC site.
Establishing severity of effects of chemicals compared with BC as baseline. a. TEWL and Chromameter values for the BC+Oil 2 site were significantly higher
than the site of BC, suggesting that any effects of BC may be limited in terms of protecting the skin against Oil 2. Corneometry values for the two sites were not significantly different.
b. Laser Doppler and TEWL values for the BC+Oil 1 site were not significantly
different from the site of BC alone, suggesting that BC may afford good protection from Oil 1 when measured by Laser Doppler and TEWL. Corneometer and Chromameter values for the BC+Oil 1 site were significantly different from the BC alone site suggesting that BC may be limited in terms of protecting against Oil 1.
c. TEWL, Chromameter and Corneometer values for the BC+SLS were
significantly different from the site of BC alone, suggesting that BC may afford good protection from SLS when measured by TEWL, Corneometer and Chromameter.
56

d. TEWL and Chromameter values of Oil 2 were significantly higher than BC+Oil 1, suggesting that the potency of Oil 2, if compared when using BC, is more severe than Oil 1. Corneometer values for BC+Oil 1 were significantly higher than BC+Oil 2, suggesting that moisture content of Oil 1, if compared when using BC, is higher than that of Oil 2.
57

CHAPTER 5: QUESTIONNAIRE SURVEY 5.1 Introduction A questionnaire was developed in order to establish: (i) the types of chemicals handled by the workforce, (ii) the extent of dermal exposure, (iii) hand protection methods used (gloves and BCs), their frequency of use and (iv) the prevalence and frequency of any existing skin disorders 5.2 Methodology Ten workers volunteered to complete a pilot questionnaire as part of a validation exercise. In considering pilot volunteers comments, the format of the questionnaire was altered slightly so as to make clearer which question number to go to following particular responses. Some questions where considered to be too detailed with regard to occupational history and existing skin condition, which were deleted. The revised version of the questionnaire was distributed to 196 shop floor workers by Production manager responsible for different engineering activities. The completed questionnaire were collected by the company and returned to the Research team. 5. 3 Results 5.3.1 Descriptive details of baseline respondents Age, smoking and ethnic group Of the 196 workers given questionnaires, 140 (71%) completed and returned the questionnaires. All of the respondents were working full-time and were all male. The mean age of those who completed questionnaire data was 44 years (± 8.9 years, minimum 25, maximum 62. The kurtosis of the age distribution was –1.0, which suggests the age distribution was not normally distributed, as shown in figure 5.1. Of the questionnaire respondents, 36 (25.7%) were currently smoking.
58

Figure 5.1 Age distribution of questionnaire respondents
Age in years
626057555351494745434139373533312925
N
12
10
8
6
4
2
0
Providers of the questionnaire data came from a wide variety of ethnic groups, as shown in table 5.1.
Table 5.1 Ethnic groups of questionnaire respondents
Ethnic group N Percentage
White 113 80.7
African / Caribbean 12 8.6
Indian / Bangladeshi / Pakistani 9 6.4
Asian Other 6 4.3
Total 140 100
Number of years in organisation and current job Of the total number of agreed participants, the mean duration of working for the organisation was 13.4 years (± 6.7 years, minimum1, maximum 32). The kurtosis of the distribution of duration of employment was 0.48, which suggests the employment duration was normally distributed as shown in figure 5.2.
59
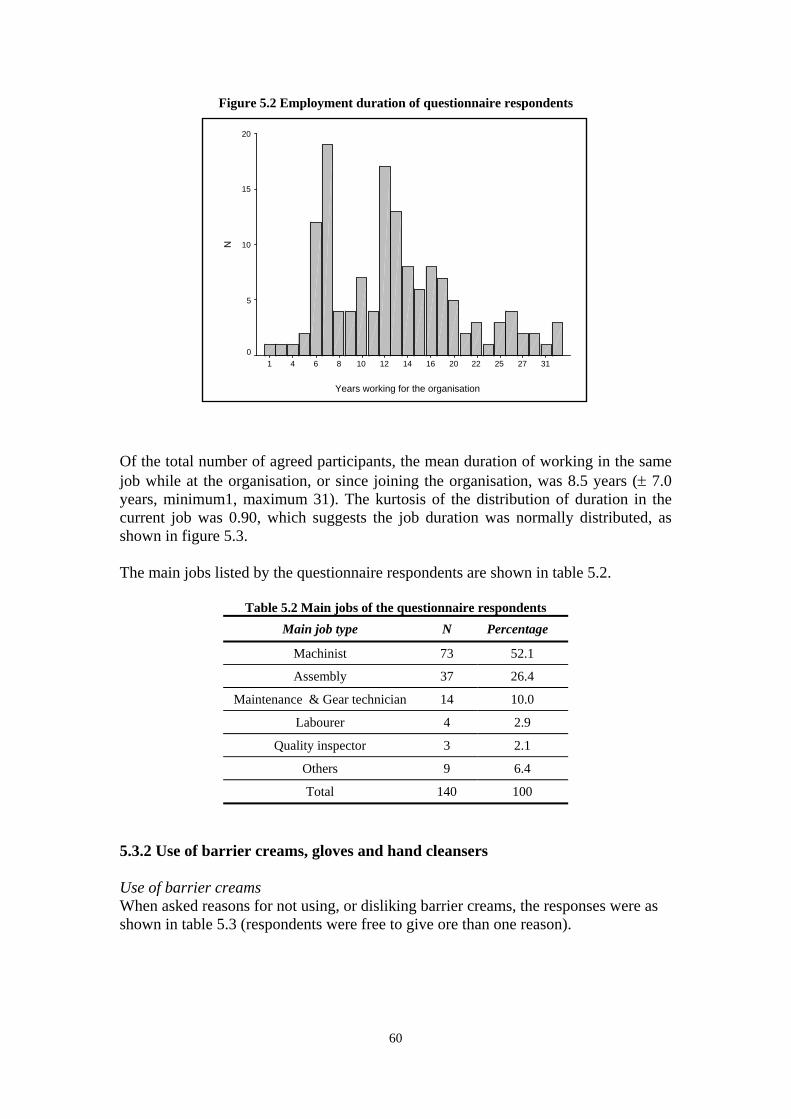
Figure 5.2 Employment duration of questionnaire respondents
Years working for the organisation
3127252220161412108641
N
20
15
10
5
0
Of the total number of agreed participants, the mean duration of working in the same job while at the organisation, or since joining the organisation, was 8.5 years (± 7.0 years, minimum1, maximum 31). The kurtosis of the distribution of duration in the current job was 0.90, which suggests the job duration was normally distributed, as shown in figure 5.3. The main jobs listed by the questionnaire respondents are shown in table 5.2.
Table 5.2 Main jobs of the questionnaire respondents Main job type N Percentage
Machinist 73 52.1
Assembly 37 26.4
Maintenance & Gear technician 14 10.0
Labourer 4 2.9
Quality inspector 3 2.1
Others 9 6.4
Total 140 100
5.3.2 Use of barrier creams, gloves and hand cleansers Use of barrier creams When asked reasons for not using, or disliking barrier creams, the responses were as shown in table 5.3 (respondents were free to give ore than one reason).
60

Table 5.3 Reasons for not using barrier creams
Reason N Percentage of entire sample
Prefer using gloves instead 71 50.7
Makes working difficult 11 7.9
Previously made skin worse 8 5.7
Fail to protect from chemical damage 3 2.1
Other unspecified reason 3 2.1
Unsure when to use them 2 1.4
When asked if they used barrier creams in their daily working practice, 64 respondents (45.7%) claimed that they did use barrier creams on a regular daily basis, with 76 respondents (54.3%) claiming they did not. The respondents who applied barrier creams on a regular daily basis were asked how many times in a typical day they would ordinarily apply, and this is shown in table 5.4. Ten respondents who used barrier creams did not state their application frequency. The median number of applications was 2 per day.
Table 5.4 Frequency of barrier cream application (per day)
Frequency N Percentage of barrier cream users
Percentage of entire sample
1 17 26.5 12
2 23 36 16
3 6 9 4
4 7 11 5
5 1 1.5 1
Not stated 10 16 7
Total 64 100 45
Glove use When asked if they used gloves in their daily working practice, 130 respondents (93%) claimed that they did, with 10 respondents (7%) claiming they did not. The types of gloves worn by respondents were as shown in table 5.5 (respondents were free to report as many glove-types as they wore).
61

Table 5.5 Types of gloves worn by respondents
Glove type N Percentage of glove wearers
Percentage of entire sample
Cotton gloves 68 51.9 48.6
Glove mates 15 11.4 10.7
Marigold gloves 18 13.7 12.9
Nitrile gloves 5 3.8 3.5
Gauntlets 57 43.5 40.7
Welding gloves 6 4.5 4.3
Other gloves 1 0.8 0.7
The combined and simultaneous use of gloves and barrier creams among the respondents was as shown in figure 5.3.
Figure 5.3 Breakdown of uses of gloves and barrier creams
56 / 40%
8 / 6%
74 / 53%
2 / 1%
B.cream & Goves
Barrier cream only
Goves only
None
Hand cleansers and other creams When asked if they used hand cleansers in their daily working practice, 126 respondents (90%) claimed that they did, with 10 respondents (7%) claiming they did not, with a remaining 4 (3%) not providing an answer to the question. The mean number of cleanser applications during a typical working day was 3.5 (± 1.8), with a minimum of 1 and maximum of 10.
62

Use of after work creams When asked if they used after work creams after a typical working day, 51 respondents (36.5%) claimed that they did, with 86 respondents (61.5%) claiming they did not, with a remaining 4 (2.5%) not providing an answer to the question. The mean number of cream applications after a typical working day was 1.6 (± 1.2), with a minimum of 1 and maximum of 6. When asked if their particular type of working (either no protection, barrier cream, gloves, or barrier cream combined with gloves) protected them from skin irritation, 104 (74.3%) claimed it did; 17 (12.1%) claimed it did not, with 19 (13.6%) not answering the question. The breakdown of protection between the four types of working is shown in table 5.6.
Table 5.6 Protection afforded by each type of working
Protection / Type of working Protective effects
Not protective
None 1 (50%) 1 (50%)
Gloves only 50 (85%) 9 (15%)
Barrier cream only 6 (86%) 1 (14%)
Gloves and Barrier cream together 47 (89%) 6 (11%)
5.3.3 Skin irritation When asked if they worked with any chemicals which irritated the skin 46 respondents (32.9%) claimed that they did, with 94 respondents (67.1%) claiming they did not. Of the 46 respondents reporting skin irritation, the substances they believed to cause their irritation are listed in table 5.7.
Table 5.7 Irritating substances reported by questionnaire respondents
Irritating substance N Percentage of those reporting irritation
Percentage of entire sample
Oils 24 52 17.1
Coolants 8 17 5.9
Contaminated suds 6 13 4.3
Cleaners 3 7 2.1
Marking pastes 3 7 2.1
Adhesives 1 2 0.7
Magnesium Phosphate 1 2 0.7
Total 46 100 32.9
When respondents were asked if they had suffered from any type of skin irritation in the last 12 months, 25 (18%) claimed they had; 110 (79%) claimed they had not, with 5 (3%) not answering the question. The breakdown of the occurrence of skin irritation in the past twelve months between the four types of working is shown in table 5.8.
63

Table 5.8 Skin irritation associated with each type of working Of the 25
respondents who claimed to have skin irritation in the last twelve months, the areas of the body affected are shown in table 5.9.
Protection / Type of working Skin irritation
Not irritation
None 1 (50%) 1 (50%)
Gloves only 13 (19%) 57 (81%)
Barrier cream only 2 (29%) 5 (71%)
Gloves and Barrier cream together 9 (16%) 47 (84%)
Table 5.9 Skin irritation associated reported by respondents
Area Skin irritation % of group reporting skin irritation
% Of entire sample
Arms 12 48 8.5
Hands 9 36 6.4
Face 5 20 3.5
Legs 4 16 2.8
Feet 3 12 2.1
Stomach 1 4 0.7
64
5.4 Summary of questionnaire findings The sample of the workforce was primarily of white origin (80%) with a mean age of 44 years, with 75% being non-smokers, having worked for the company for a mean duration of thirteen years. The largest occupational group represented in the sample were machinists (52%), followed by assembly workers (26%). The remainder was comprised of unspecified workers, maintenance technicians, gear technicians, labourers, quality inspectors and a heat treatment worker. Sixty-seven percent of respondents believed they worked with substances that irritated their skin; of these substances, the most frequently reported were: Oils (50%), Contaminated suds (15%), Coolants (13%) and Cleaners (6%). Barrier creams were on a daily basis by 46% of the sample, and of those users, the average number of applications of cream was two per day Reasons for not using barrier creams included that workers simply “preferred” using gloves (50%); that barrier creams made working difficult (8%) or that they had previously made a skin condition worse (6%). Use of gloves was widespread, with 93% of workers using them. Cotton gloves and Gauntlets were used widely (48% and 40% respectively), as well as additional Glove mates / liners worn by 10% of the sample. Only 2 workers (1%) used no protection; 74 (53%) used gloves only; 8 (6%) used barrier creams only; and 56 (40%) used gloves and barrier creams together. Of the three types of protection, the number of workers who believed their method afforded them protection against skin irritation was as follows: gloves only (85%), barrier creams only (86%), and gloves with barrier creams (89%). Twenty-five (18%) participants had suffered from skin irritation in the previous 12 months. Of the three types of protection, the number of workers who suffered from skin irritation in the previous 12 months was as follows: gloves only (19%), barrier creams only (29%), and gloves with barrier creams (16%). Of the 25 (18%) who reported skin irritation in the previous 12 months, the most common areas of irritation were arms (N=12, 48%), hands (N=9, 36%), face (N=5, 20%), legs (N=4, 16%) and feet (N=3, 12%) and stomach (N=1, 4%). Unaffected areas included the back, chest and neck. Eleven (44%) of those with skin irritation in the previous 12 months reported the problem to their company.
65

CHAPTER 6: CONCLUSIONS AND RECOMMENDATIONS A practical method for assessing the effectiveness of Barrier Creams (BCs) has been developed and suitable bioengineering techniques identified for measuring various physiological and physiochemical properties of the skin. The reliability of different techniques has been evaluated. The proposed method is capable of facilitating comparison of different BCs however; further testing is recommended using different BCs. The following recommendations are based on findings and experience of developing the test method. Questionnaire Survey In developing a method to assess the effectiveness of barrier creams it is important to establish the actual use of barriers creams on site by the workforce and the reasons for its use as well as the perceived protection provided. A questionnaire was developed and distributed to 196 shop-floor workers. This phase of the project was seen to be particularly important to the company as the use of hand protection available was partly driven by individual choice. The machinists and assembly workers accounted for 78% of those who completed the questionnaire. Only 2 workers (1%) used no hand protection; 74 (53%) used gloves only; 8 (6%) used barrier creams only; and 56 (40%) used gloves and barrier creams together. Of those who used BCs the mean number of applications of cream was two per day. It is interesting to note that eight percent of the respondents stated that BCs made working difficult and 6% believed that BCs had previously made a skin condition worse. This preliminary data suggests the need to consider the practical aspects of work, the nature of substances handled, individual health status, as well as theoretical protection when recommending the use of barrier creams. Selection and use of instruments and variables effecting readings It is important to select bioengineering instruments, which are least likely to be affected by local environmental conditions such as temperature, relative humidity and air velocity. This is particularly important when selecting instruments for measuring TEWL. In order to improve the reliability of the data from the instruments used, the test environment needs to be controlled and standardised and measured as far as possible, such as the number of individuals in any test room, the test location, as well as heating and lighting conditions. In this study the test room was at ambient temperature with no artificial heating, with windows and doors remaining closed throughout to minimise air movement. Temperature and humidity were recorded for each set of readings taken for each individual. Access to the test room was limited to the volunteer being tested and the two researchers tasking measurements. Instruments selected for testing need to calibrated before use and their order of use needs to be considered carefully, as one measurement may affect subsequent readings (for instance, pressure exerted on the surface of the skin). The order of instruments used this study was as follows: Laser Doppler, Chromameter, DermaLab and Corneometer.
66
Test and control sites on the forearm need to be selected carefully since these may influence readings, especially those taken close to the wrist area. Furthermore, due to within and between individual variability, a control site needs to be selected for each individual and for each set of tests. In the absence of field data, the behaviour of instruments and the factors likely to effect readings need to be evaluated before performing any tests with occluded chemicals and barrier creams. In this investigation baseline measurements were conducted at the same time each day over three consecutive days for each individual. This data was used to develop a test protocol for subsequent occlusion testing for the evaluation of barrier creams. The important variables being the test site, the optimum time required for the body to reach stabilisation, variability between individuals and variation within individuals over consecutive days. Baseline measurements A baseline test protocol was developed for individuals at the factory to assess the performance of instruments in a typical occupational setting and to determine the factors, which affect readings. It is recommended that a similar test protocol is adapted for other industrial environments. The most reliable forearm test areas were points B, C and D. Area A close to the wrist produced significantly higher readings particularly for TEWL measurements. Measurements at areas B-D are recommended since no significant difference in readings was found when adjusting for day or time of measurements. No significant differences were found between measurements on arms, however this was only the case when comparing the first set of readings taken on both arms. Data suggests that readings taken may have been affected by previous readings recently taken on the same arm. In the baseline measurement phase a number of repeat measurements were made at different points on the forearm over a relatively short period which may have introduced some uncertainty particularly for TEWL readings. Hence the number of measurements taken on the same arm over a short duration should be kept to a minimum. Measurements between days were found to vary significantly for the TEWL and Corneometer even after adjusting for Time and Area of measurement. This implies that it is difficult to compare data for individuals over time unless suitable control sites are included on each occasion when test substances are evaluated. Longer individual stabilisation periods produced lower mean instrument readings. A stabilisation period of 30 minutes is recommended i.e. measurements to be conducted 30 minutes after the individual has been seated in the correct position, with arms resting on a table at a suitable height. The readings from instruments (TEWL, Chromameter and Corneometer) were not affected by the temperature and humidity. This is an important finding as measurement of TEWL using other instruments has been reported to unreliable due to sensitivity of instruments to changes in ambient temperature and humidity. The data shows that recent improvement in the design of TEWL instruments enables their use
67
in controlled workplace settings. However, further improvements in design (the shielding effect) would be beneficial, as TEWL readings appeared to be most dependent on both temperature and humidity. Overall the baseline measurements for individuals at the factory showed that the TEWL and Chromameter readings were above an acceptable level of consistency (within individuals) enabling their use for evaluating the effectiveness of barrier creams in workplace settings The Laser Doppler proved to be a difficult instrument to use in the chosen setting. The instrument is made of heavy components, which need to assembled and manoeuvred during testing, which restricted the available space. Furthermore, only one arm could be scanned without moving the individual and the scanning time per arm was approximately seven minutes. Although the Laser Dopler in principle can provide useful information on blood flux changes due to irritant chemical reactions, its use was not fully evaluated in this study. Further evaluations need to carefully consider the practical constraints, costs and applicability for field-testing use. Occlusion testing An optimum test protocol was developed for testing repeated exposure to chemicals under occlusion, mimicking ‘worst case occupational dermal exposure. The occlusion procedure was conducted over two consecutive weeks. The main aim was to establish the severity of effects of chemicals on instrument values and the protective effect of a barrier cream used on site. The number of substances that could be tested was limited by the size of the probe heads placed on the skin during measurements and the potential for chemical cross-reactivity between test sites. The SLS site had significantly higher TEWL and Chromameter values than those recorded at the control sites. The Chromameter values for Oil 1 were also significantly elevated over the control site. This indicates that Chromameter is most sensitive in recognising changes in skin produced by chemicals followed by TEWL. The Corneometer produced varying results possibly due to the fact that this instrument measures the moisture content of the skin, which is likely to be increased by the presence of a BC or skin inflammation as in the case for SLS. TEWL and Chromameter were able to demonstrate the effectiveness of BC for both SLS and Oil 2 but not for Oil 1. The differing results for the two oil types were supported by readings obtained from other oils and barrier cream test areas, which suggested that Oil 2 was more potent as a skin irritant than Oil 1. When comparing visual skin irritation score readings with instrument readings the data shows that TEWL and Chromameter are good indicators of skin irritation especially for the stronger irritants such as SLS. Both instruments showed a marked increase in reading with SLS when skin reactions were visible.
68

Further Work A method for measuring the effectiveness of BCs in real workplace conditions has been developed but only tested for a single barrier cream and three different substances. Further testing needs to be conducted to evaluate the relative effectiveness of different BCs for different chemical irritants used in industrial settings. The occlusion test regime should reflect typical and “worst-case” dermal exposure scenarios. The bioengineering techniques used in this study could be validated further by recording different skin parameters at the positive skin irritant sites on individuals in dermatological patch test centres. For instance Chromameter and TEWL reading could be recorded at patch test sites pre and post application of test material. Data concerning skin reactions of varying severity may provide useful information on the ability of instruments to differentiate between normal and damaged skin. In the absence of any suitable health surveillance techniques for occupational skin irritation, the use of TEWL and Chromamater together with an assessment of dermal exposure needs to be explored. The proposed methodology could be developed further as a tool for identifying individuals who are more likely to develop irritant contact dermatitis.
69

REFERENCES Berardesca E and EEMCO (1997) EEMCO guidelines for the assessment of stratum corneum hydration: electrical methods. Skin Research and Technology Vol 3 pp126-132. Bircher A, De Boer E M, Agner T, Wahlberg J E and Serup J (1994) Guidelines for the measurement of cutaneous blood flow by laser Doppler flowmetry. Contact Dermatitis Vol.30 pp65-72. Clarys P, Alewaeters K, Lambrecht R and Barel A O (2000) Skin colour measurements: comparison between three instruments: the Chromameter, the DermaSpectrometer and the Mexameter, Skin Research and Technology Vol. 6 pp230-238. Deb Ltd (2003) Safety Data Sheet Deb Protect. Deb Ltd UK. Revised No 2. Fluhr J W, Kuss O, Diepgen T, Lazzerini S, Pelosi A, Gloor M and Berardesca E (2001) Testing for irritation with a multifactorial approach: comparison of eight non-invasive measuring techniques on five different irritation types. British Journal of Dermatology. Vol.145 p696. Frosch P J, Schulze-Dirks A, Hoffmann M and Axthelm I (1993) Efficacy of skin barrier creams (II) Ineffectiveness of a popular ‘skin protector’ against various irritants in the repetitive irritant test in the guinea pig. Contact Dermatitis. Vol.29. No2 pp74-77. Frosch P J, Schulze-Dirks A, Hoffmann M, Axthelm I and Kurte A (1993) Efficacy of skin barrier creams (I) The repetitive irritation test (RIT) in the guinea pig. Contact Dermatitis. Vol.28. No.2. Pp94-100. Fullerton A, Fischer T, Lahti A, Wilhelm K P, Takiwaki H and Serup J (1996) Guidelines for measurement of skin colour and Erythema. Contact Dermatitis Vol 35 pp1-10. Grove G L, Grove M J, Zerweck C and Pierce E (1999) Comparative metrology of the evaporimeter and the DermaLab TEWL probe. Skin Research and Technology Vol.5 pp1-8 Pinnagoda J, Tupker R A, Agner T and Serup J (1990) Guidelines for transepidermal water loss (TEWL) measurement. Contact Dermatitis Vol.22 pp164-178. Schluter-Wigger W and Elsner P (1996) Efficacy of 4 commercially available protective creams in the repetitive irritation test (RIT). Contact Dermatitis. Vol.34. No4 pp278-283. Tupker R A, Willis C, Berardesca E, Lee C H, Fartasch M, Agner T and Serup J (1997) Guidelines on sodium lauryl sulphate (SLS) exposure tests. A report from the Standardisation Group of the European Society of Contact Dermatitis. Contact Dermatitis Vol 37 pp53-69.
70

Van den Kerckhove E, Staes F, Flour M, Stappaerts K and Boeckx W (2001) Reproducibility of repeated measures on healthy skin with Minolta Chromameter CR-300. Skin Research and Technology Vol.7 pp56-59. Yosipovitch G, Xiong G L, Haus E, Sackett-Lundeen L, Ashkenazi I and Maibach H I (1997) Time-Dependent Variations of the Skin Barrier Function in Humans: Transepidermal Water Loss, Stratum Corneum Hydration, Skin Surface pH and Skin Temperature. The Journal of Investigative Dermatology Vol.110 No1. Pp20-23. Bibliography Courage and Khazaka (2002) Information and Operating Instructions for the Multi-Probe Adaptor MPA and its probes. CK electronic GmbH UK. Cortex Technology (2001) DermaLab® Users Manual. Cortex Technology UK Minolta UK Ltd (1991) Chroma Meter CR-300/CR-310/CR331. ISBN 9222-1848-11 Moor Instruments Limited (1996/1997) MoorLDI-2 User Guide and Reference. Software version RESEARCH 3.08. MoorLDI UK Issue 10.
71
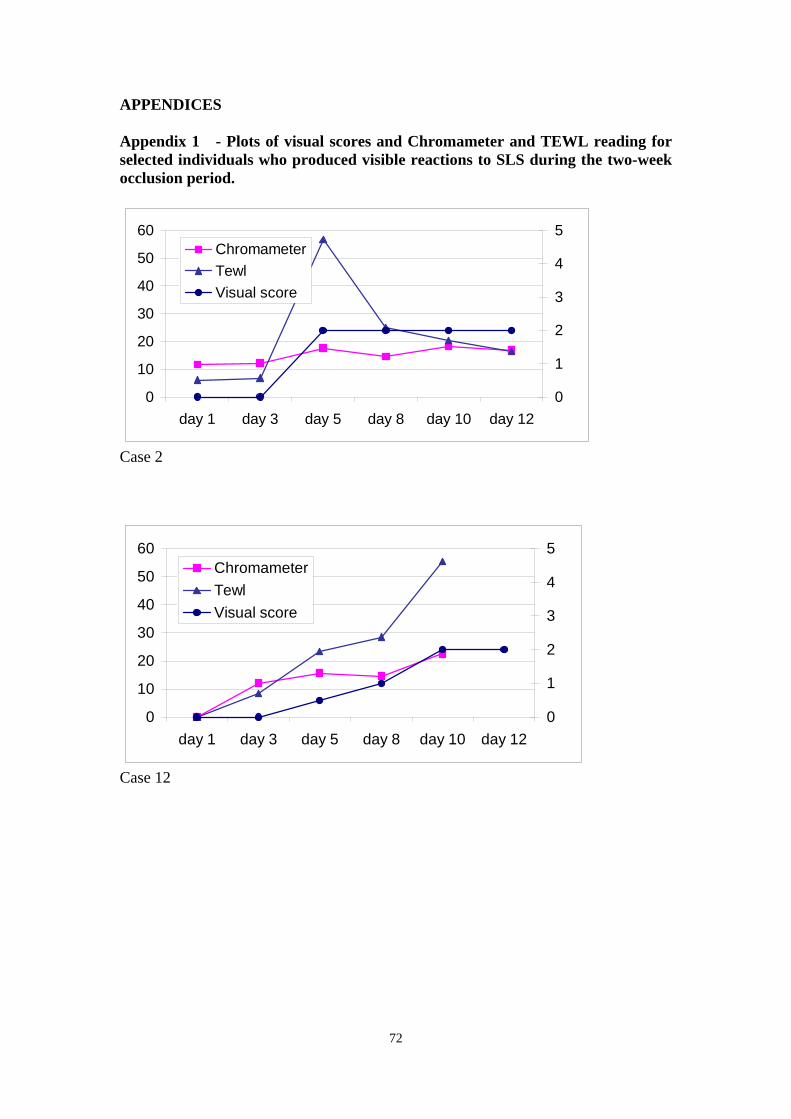
APPENDICES Appendix 1 - Plots of visual scores and Chromameter and TEWL reading for selected individuals who produced visible reactions to SLS during the two-week occlusion period.
0
10
20
30
40
50
60
day 1 day 3 day 5 day 8 day 10 day 120
1
2
3
4
5ChromameterTewlVisual score
Case 2
0
10
20
30
40
50
60
day 1 day 3 day 5 day 8 day 10 day 120
1
2
3
4
5ChromameterTewlVisual score
Case 12
72

0
10
20
30
40
50
day 1 day 3 day 5 day 8 day 10 day 120
1
2
3
4
5ChromameterTewlVisual score
Case 13
0
20
40
60
80
100
day 1 day 3 day 5 day 8 day 10 day 120
1
2
3
4
5ChromameterTewlVisual score
Case 14
73

01020304050607080
day 1 day 3 day 5 day 8 day 10 day 120
1
2
3
4
5ChromameterTewlVisual score
Case 15
0
1020
3040
5060
70
day 1 day 3 day 5 day 8 day 10 day 120
1
2
3
4
5ChromameterTewlVisual score
Case 18
01020304050607080
day 1 day 3 day 5 day 8 day 10 day 120
1
2
3
4
5ChromameterTewlVisual score
Case 21
74

Printed and published by the Health and Safety ExecutiveC30 1/98
Printed and published by the Health and Safety ExecutiveC1.10 02/05

RR 300
£20.00 9 78071 7 629466
ISBN 0-7176-2946-5

Deve
lop
ment o
f a fie
ld m
eth
od
for th
e a
ssessm
ent o
f the e
ffective
ness o
f barrie
r cream
s in p
reve
ntin
g sk
in irrita
tion re
actio
ns
HS
E BO
OK
S