Collision Between Platform Deck and Service Vessel Wheelhouse

Vessel collision threat detection for offshore oil and gas installations
Prepared by Liverpool John Moores University for the Health and Safety Executive
RR1153 Research Report

2
© Crown copyright 2019
Prepared 2018
First published 2019
You may reuse this information (not including logos) free of charge in
any format or medium, under the terms of the Open Government Licence. To view the licence visit
ww w.nationalarchives.gov.uk/doc/open-government-licence/, write to the Information Policy Team, The National Archives, Kew, London TW9 4DU, or email [email protected].
Some images and illustrations may not be owned by the Crown so
can not be reproduced without permission of the copyright owner. Enquiries should be sent to [email protected].
This report and the work it describes were funded by the Health and
Safety Executive (HSE). Its contents, including any opinions and/or
conclusions expressed, are those of the authors a lone and do not
necessarily reflect HSE policy.
There is a potential for major structural damage to offshore installations leading to fatalities and serious injuries in the
event of collision by either a passing or an in-field seagoing vessel. Both categories of collision have occurred on the UK Continental Shelf (UKCS) although to date only significant,
rather than catastrophic, consequences have occurred. Internationally, collisions have occurred that have caused both loss of life and environmental damage. This report considers collision threat detection and updates Research
Report RR514 (2006). RR1154 considers the Ship/Platform Collision Incident Database which was previously described in Research Report RR053 (2001).
Collision threat detection via radar and visual watch keeping is one of the major duties that the Emergency Response and Rescue Vessel (ERRV) crew needs to conduct
for monitoring and appraisal of risks to UKCS installations. Detection tools are subject to a number of limitations and this report investigates technological advancements including: (1) deployment of automated radar detection
and tracking devices to supplement the work of ERRV crews and assist in the overall collision risk management strategy; and (2) the implementation of Automatic Identification
System (AIS) equipment in the global marine regulatory system which has also had an impact on vessel identification and the processes through which an errant vessel can be warned off. Results are discussed in terms of
both how they may affect current operations and how they may be adopted in future to enhance offshore safety.

3
Lorem ipsum dolor sit amet
consectetuer adipiscing elit
Alan Wall, Sean Loughney, Feng Ma and Jin Wang Liverpool John Moores University James Parsons Building Liverpool L3 3AF
Vessel collision threat detection for offshore oil and gas installations

4
EXECUTIVE SUMMARY
Many areas of the United Kingdom Continental Shelf (UKCS) are subject to risks associated with a wide range of ships, such as, fishing vessels, transiting merchant vessels and regular scheduled ferries. In some areas, principally in the southern North Sea and Irish Sea, navigational constraints and routing schemes lead to high traffic densities in close proximity with installations. There has been increasing development of Offshore Renewable Energy Systems built in the UK waters in addition to the large number of oil/gas systems. Combining these factors increases the risk of a vessel/installation collision. A review of past collision incidents reveals that such events, which can lead to catastrophic collapse of the installation or foundering of the vessel, have largely been the result of either mechanical failure or human error (e.g. inadequate watch keeping on the vessel).
Those on-board offshore installations cannot rely solely on passing vessels to realise their responsibilities and avoid collision. Instead, Duty Holders have developed systems to provide early warning of collision risk as part of an overall collision risk management strategy. For many years the stand-by vessel’s watch keeping officers and radar were the cornerstone of an installation’s early warning system and in many fields this is still the case. Civil Marine Radar (CMR) systems, located on stand-by vessels, meet International Maritime Organization (IMO) radar performance standards on minimum accuracies with respect to the vessel the radar system is on and not for third parties, such as, the offshore installation. Such shortcomings are compounded when the ‘blind’ and ‘shadow’ sectors of a vessel-based radar are considered as well as the degradation of performance caused by intervening obstructions in certain directions.
A number of technological advances have opened up a more integrated and holistic solution where unmanned and automated radar systems can provide an early indication of an approaching collision risk, pass information to slave displays at remote locations and assist in the location of in-water casualties. Such systems offer the potential to overcome some of the drawbacks of vessel based radar because they can be sited to best advantage. Moreover, their use can backup stand-by vessels in completing the tedious and mundane tasks that collision risk monitoring from a static structure usually entails.
Technology and the marine industry regulatory regime are constantly moving forward. Since the introduction of the Automatic Identification System (AIS), by IMO, the possibility to uniquely identify vessels in the vicinity has become a reality, albeit with some gaps, such as, whether the type or size of a vessel falls outside the scope of the carriage requirements. The manner and extent to which those concerned with collision risk warning and management utilise the AIS technology remains to be fully proven, though early experience has highlighted a number of issues. Foremost among these is the reliance that AIS has been properly set up on potential target vessels as it is a ‘cooperative’ system requiring accurate inputs by the target vessel. Otherwise it may transmit erroneous data that could lead to greater problems.
The report highlights how collision detection on the UKCS can be conducted using civil marine radar and AIS in detail. At the end of each section the results are discussed for their relevance. The report concludes with an overall discussion on the state of collision risk warning and management on the UKCS.
5
CONTENTS
EXECUTIVE SUMMARY............................................................................................................. 4
CONTENTS ............................................................................................................................... 5
LIST OF FIGURES ..................................................................................................................... 8
LIST OF TABLES ....................................................................................................................... 8
ABBREVIATIONS ....................................................................................................................... 9
1 INTRODUCTION............................................................................................................. 11
2 CIVIL MARINE RADAR ................................................................................................... 13
2.1 BACKGROUND......................................................................................................... 13
2.2 EQUIPMENT OVERVIEW .......................................................................................... 15
2.3 PERFORMANCE STANDARDS.................................................................................. 16
2.4 DESIGN CONSIDERATIONS AFFECTING PERFORMANCE ...................................... 18
2.5 PHYSICAL CONDITIONS AFFECTING PERFORMANCE............................................ 19
2.5.1 Scanner Height ............................................................................................. 19
2.5.2 Blind and Shadow Sectors ............................................................................. 20
2.5.3 Target Reflective Properties ........................................................................... 21
2.5.4 False or Spurious Echoes .............................................................................. 21
2.6 METEOROLOGICAL CONDITIONS AFFECTING PERFORMANCE ............................. 22
2.7 COHERENT RADAR ................................................................................................. 23
2.8 SUMMARY AND DISCUSSION .................................................................................. 24
3 AUTOMATIC IDENTIFICATION SYSTEM (AIS) ................................................................ 26
3.1 OVERVIEW............................................................................................................... 26
3.2 USE OF AIS .............................................................................................................. 27
3.2.1 Ship-to-Ship Data Exchange .......................................................................... 27
3.2.2 Coastal Surveillance ...................................................................................... 27
3.2.3 Vessel Traffic Systems................................................................................... 27
3.2.4 Potential Benefits of AIS to the Offshore Industry ............................................. 28
3.2.5 Satellite Surveillance of AIS Signals ............................................................... 28
3.3 AIS COMMUNICATIONS SCHEME ............................................................................ 28
3.4 AIS MESSAGES ........................................................................................................ 29
6
3.5 AIS SHIPBOARD EQUIPMENT .................................................................................. 31
3.6 AIS BASE STATION EQUIPMENT.............................................................................. 32
3.7 SHIPBOARD CARRIAGE REQUIREMENTS ............................................................... 32
3.8 AIS STANDARDS...................................................................................................... 33
3.9 IMPLEMENTATION AND USE OF AIS IN THE UK ...................................................... 33
3.10 SUMMARY AND DISCUSSION ................................................................................ 33
3.10.1 Integrating AIS with Radar ........................................................................... 34
3.10.2 Limitations of AIS......................................................................................... 34
3.10.3 Conclusion .................................................................................................. 35
4 HYBRID DETECTION AND MONITORING SYSTEMS ...................................................... 36
4.1 PURPOSE ................................................................................................................ 36
4.2 SCOPE ..................................................................................................................... 36
4.3 OPERATING PARAMETERS ..................................................................................... 37
4.4 OPERATING CONSIDERATIONS FOLLOWING SYSTEM MALFUNCTION ................. 37
4.5 SYSTEM MAINTENANCE.......................................................................................... 37
4.6 TRAINING................................................................................................................. 37
4.7 RELIEF VESSELS ..................................................................................................... 37
4.8 MOBILE INSTALLATIONS ......................................................................................... 37
4.9 INSTALLATION ISSUES............................................................................................ 37
5 ALTERNATIVE TECHNOLOGIES .................................................................................... 39
5.1 Laser Systems........................................................................................................... 39
5.2 Sonic Systems........................................................................................................... 39
5.3 Visual Target Detection .............................................................................................. 39
6 DISCUSSION ................................................................................................................. 40
BIBLIOGRAPHY ....................................................................................................................... 43
APPENDIX 1: COMPARISON OF REWS AND ERRV GATHERED DATA ................................... 44
PART 1 OVERVIEW ........................................................................................ 45
PART 2 NOTES ON DATA COMPARISON ....................................................... 46
PART 3 DATA COMPARISON METHODOLOGY .............................................. 47
PART 4 TRAFFIC ROUTES AROUND RAVENSPURN BRAVO ......................... 55
PART 5 DATA COMPARISON DISCUSSION.................................................... 56
APPENDIX 2: REPORT ON THE PERFORMANCE DEGRADATION OF CIVILIAN MARINE RADAR DUE TO CLOSE BY OBSTACLES ................................................................................... 58
SUMMARY ..................................................................................................................... 58
7
PART 1 INTRODUCTION ................................................................................................ 60
PART 2 A BRIEF OVERVIEW OF CIVILIAN MARINE RADAR (CMR) ................................ 60
PART 3 THE BLOCKAGE EFFECT.................................................................................. 61
PART 4 BLOCKAGE EFFECT OF RADAR ANTENNAS .................................................... 62
PART 5 FIRST-HAND EXPERIENCE ON A LARGE TANKER SUFFERING A 50% REDUCTION OF ALL TARGET DETECTIONS IN A SWELL PERIOD ...................... 69
PART 6 CMRS DIFFERENT TYPES AND EXPECTED PERFORMANCE UNDER A SELECTION OF SCENARIOS................................................................................ 69
PART 7 CONCLUSIONS AND “THE NEXT MOVE” ........................................................... 70
ACKNOWLEDGEMENTS ................................................................................................ 70
REFERENCES ............................................................................................................... 71
ANNEX 1 Regulations ..................................................................................................... 72
ANNEX 2 GLOSSARY OF RADAR TERMS ...................................................................... 75
APPENDIX 3: MCA SHIPPING NOTES AND MARINE GUIDANCE FOR AIS ............................... 79
PART 1: MSN 1795 (M) Revised Carriage Requirements Automatic System (AIS), November 2005 Identification.................................................................................................. 80
PART 2: MGN 324 (M+F) Navigation: Watch keeping safety – Use of VHF Radio and an Operational Guidance for Automatic Identification and AIS, October 2017 ................. 87
8
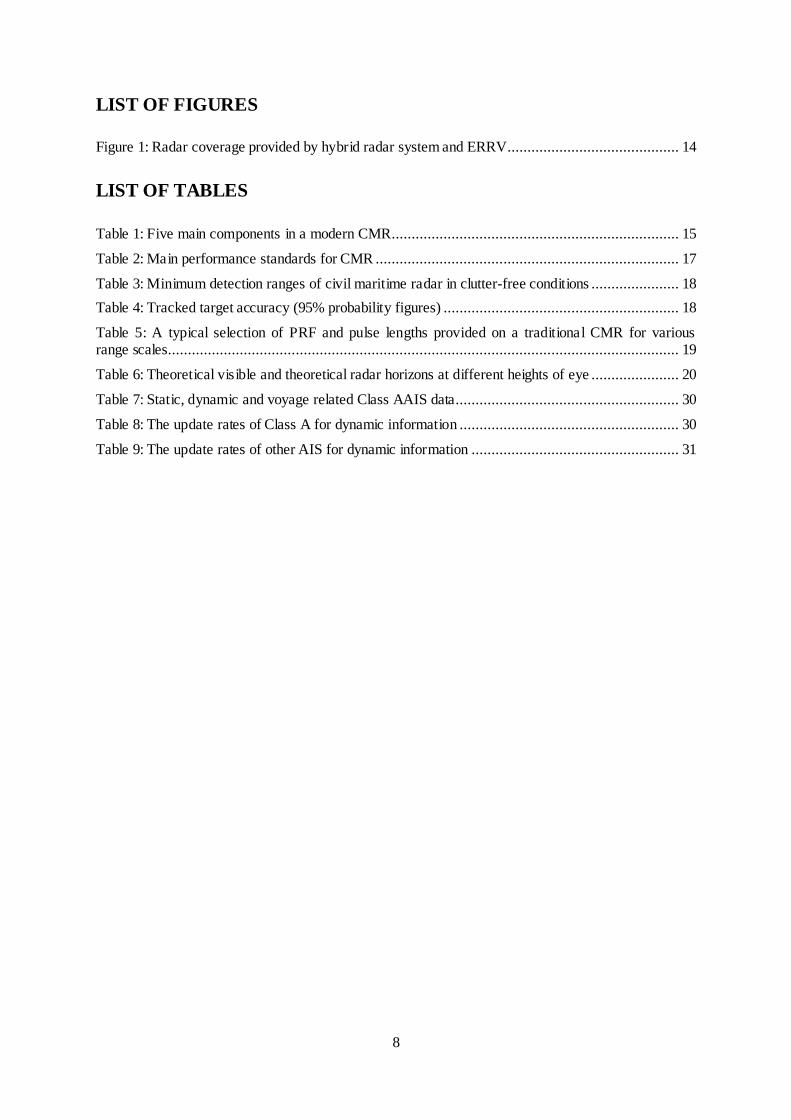
LIST OF FIGURES
Figure 1: Radar coverage provided by hybrid radar system and ERRV ........................................... 14
LIST OF TABLES
Table 1: Five main components in a modern CMR........................................................................ 15
Table 2: Main performance standards for CMR ............................................................................ 17
Table 3: Minimum detection ranges of civil maritime radar in clutter-free conditions ...................... 18
Table 4: Tracked target accuracy (95% probability figures) ........................................................... 18
Table 5: A typical selection of PRF and pulse lengths provided on a traditional CMR for various range scales ................................................................................................................................ 19
Table 6: Theoretical visible and theoretical radar horizons at different heights of eye ...................... 20
Table 7: Static, dynamic and voyage related Class AAIS data ........................................................ 30
Table 8: The update rates of Class A for dynamic information ....................................................... 30
Table 9: The update rates of other AIS for dynamic information .................................................... 31

9
ABBREVIATIONS
AIS Automatic Identification System
ARPA Automatic Radar Plotting Aid
AtoN Aids to Navigation
CCTV Closed Circuit Television
CMR Civil Marine Radar
COG Course Over Ground
CPA Closest Point of Approach
CSTDMA Carrier Sense Time Dependant Multiple Access
DGNSS Differential Global Navigation Satellite Service
DNV Det Norske Veritas
DSC Digital Selective Calling
ECDIS Electronic Chart Display and Information System
ERRV Escape Response and Rescue Vessel
FM Frequency Modulation
FPSO Floating Production, Storage and Offloading platform
GISIS Global Integrated Shipping Information System
GMSK Gaussian Minimum Shift Keying
GNSS Global Navigation Satellite System
GPS Global Positioning System
GRP Glass Reinforced Plastic
HSE Health and Safety Executive
IEC International Electrotechnical Commission
ITU International Telecommunications Union
IMO International Maritime Organization
LAN Local Area Network
MAIB Marine Accident Investigation Branch
MCA Maritime and Coastguard Agency
MGN Marine Guidance Notice
MMSI Maritime Mobile Service Identity
MODU Mobile Offshore Drilling Unit
MSN Merchant Shipping Notice
MSC Maritime Safety Committee
NUI Normally Unattended Installations
OOW Officer Of the Watch
OWE Offshore Wind Energy

10
PC Personal Computer
PLB Personal Location Beacon
PRF Pulse Repetition Frequency
PSV Platform Supply Vessel
REWS Radar Early Warning System
RIDDOR Reporting of Injuries, Diseases and Dangerous Occurrence Regulations
ROT Rate Of Turn
SAR Search and Rescue
SART Search and Rescue Transponder
SOG Speed Over Ground
SOLAS Safety of Life At Sea (convention)
SOTDMA Self Organising Time Dependent Multiple Access
TCPA Time to Closest Point of Approach
TDMA Time Division Multiple Access
UKCS United Kingdom Continental Shelf
VDR Voyage Data Recorder
VHF Very High Frequency (radio)
VTS Vessel Traffic System
WOAD Worldwide Offshore Accident Databank
WREC World Energy Related Casualties

11
1 INTRODUCTION
In this report, collision is defined as any contact between an offshore oil and gas installation and another vessel and it is a major hazard associated with both fixed and floating installations. The inherent energy transfer to a stationary installation from a vessel, even at low speed, can quite easily cause deformation of structural members or possibly catastrophic failure.
Experience of offshore oil and gas extraction in both the UKCS, the North Sea and other areas of the world has demonstrated that collisions are not an abstract events. There have been a consistent number of collisions between moving vessels and offshore platforms over the past 15 years across the North Sea. A number of these incidents have resulted in severe consequences, some of these include: The West Venture platform (semi-sub) collision on 07/03/2004, causing severe damage; the Ekofisk platform and Big Orange well stimulation vessel collision on 08/06/2009, resulting in a total platform loss and the Songa Dee (Semi-sub) collision, 18/01/2010, causing severe damage. There have also been Offshore Wind Energy (OWE) system accidents due to collisions with moving vessels. Examples with serious consequences include accidents at Scroby Sands Offshore Wind Farm on 29/09/2006, North Hoyle Windfarm on 15/03/2012, and Walney Windfarm on 14/08/2014. The demand for service visits to transfer personnel and equipment to offshore wind turbines is also increasing. All of the stated incidents have been identified from HSE’s RIDDOR database and the WOAD database.
The Ship/Platform Collision Incident Database (2015) contains details of 176 collision incidents recorded between 1996 and 2015. Of these, 174 (98.6%) were assessed as being collisions between an installation and an ‘attendant vessel’ and the remainder with a ‘passing vessel’. In the context of the database, attendant vessels are usually categorised as those craft that approach an installation for a bona fide reason and after having first sought permission from the installation to do so. Examples of these are offshore vessels and tankers working at a Floating Production, Storage and Offloading units (FPSO). Offshore vessels are defined as those used for oil exploitation and drilling, offshore support, offshore production, construction and other purposes. They also include Platform Supply Vessels (PSVs) and Emergency Response and Rescue Vessels (ERRVs).
Whilst it is most likely that any collision is caused by vessels which are associated with the offshore installation, a passing vessel, which may inadvertently approach an offshore structure, will normally be at its full operational speed. Similarly, a passing vessel may potentially have a larger displacement than an attendant vessel and thus the potential consequence from a collision, with a passing vessel, is therefore much greater. This, coupled with the difficulties caused by the oil and gas industry’s inability to control events beyond the 500 metres ‘safety zone’, has meant that traditionally more attention has been focused on monitoring the activities of approaching vessels and giving early warning where it appears the installation’s safety may be impinged. 176 collisions with offshore structures on the UKCS were recorded utilising 5 databases (HSE’s RIDDOR, WOAD, WREC, GISIS and MAIB) between 1996 and 2015, of which only two involved passing vessels. However, these two were the only two incidents were the damage was seen as “significant”. The statistics in the previous paragraph indicate that a system which is able to monitor both types of vessels is necessary and not just the passing vessels.
An overview of the operation and practical limitations of the standard radar equipment commonly is use by ERRV is discussed in Section 2 of this report. This is the traditional method of electronic monitoring of traffic. It should also be noted that the radar heads (the aerial and transceiver) from this standard marine equipment are also used in more sophisticated automated monitoring equipment covered in Section 4.
The development of an AIS means that there is a mandatory requirement for virtually all commercial vessels to be fitted with AIS and the system can be used to monitor static and dynamic information about their vessel at other stations. The introduction of AIS increases the probability of detection of merchant vessels and has a significant impact on the way collision risk management can be carried out on all marine traffic on the UKCS. Section 3 deals with this in detail.

12
The past two decades have seen the development of intelligent radar systems, which can be used as an integral part of a larger emergency response plan. Moreover, rather than being seen as an alternative to and in competition with traditional radar watch-keeping, such systems ought to be considered as supplementary to it and as a tool through which early warning of collision risk can be disseminated. The philosophy and practical operation of radar systems currently in use on the UKCS is detailed in Section 4.
Section 5 looks at alternative technologies for collision detection and monitoring and the report concludes in Section 6 with a discussion on a number of observations made during this study.

13
2 CIVIL MARINE RADAR
2.1 BACKGROUND
Commercial shipborne radar has been commonplace for many years and their installation is mandatory on vessels under the provisions of the International Convention for the Safety of Life at Sea (SOLAS). The IMO first made recommendations for minimum performance standards for the equipment on vessels (Resolution A. 221(VII) – adopted on 12 October 1971 – Performance Standards for Navigational Radar Equipment) to ensure that it met the stated aim of:
“Provide an indication in relation to the ship of the position of other surface craft and obstructions and of buoys, shorelines and navigational aids in a manner which will assist in avoiding collision and in navigation.”
Subsequently, the IMO has made a number of further resolutions relating to marine radar to encompass developments and enhancements in technology of newer equipment. The latest of these resolutions are as follows:
Resolution MSC.191 (79) Annex 34 -adopted 6 December 2004- Performance Standards for the Presentation of Navigation-related Information on Shipborne Navigational Displays
Resolution MSC.192 (79) Annex 34 -adopted 6 December 2004- Adoption of the Revised Performance Standards for Radar Equipment.
Throughout the various resolutions the stated aim of the radar equipment has endured and therein lies a possible problem when using shipborne radar for providing collision risk warning for an installation or any other third party. Specifically, the performance standards relate to the minimum expectation for range/bearing accuracy and discrimination of targets detected by the shipborne unit in the vicinity of itself rather than being able to predict their movement in relation to another location, such as, the installation it guards.
The majority of modern CMR systems far exceed the performance standards laid down by the IMO and manufacturers are left to add features or redesign their equipment to make them more user friendly or to better integrate with other bridge systems.
The same aerials and transceivers which make up shipboard systems are also used for hybrid systems with a fixed location (as discussed in Section 4) so many of the strengths and limitations also will apply for these hybrid systems. However, these hybrid displays are designed with a greater degree of automation in monitoring the equipment so that training is simplified and continuous manual observation is not intended. The IMO performance standards are based around the accuracy of information of objects in the vicinity of ‘own ship’ rather than predicting the course, speed and closest approach to a distant point. Furthermore, the radar training and competence of deck officers is based on the use of radar to assist their own vessel and the assessment of the risks posed to it rather than to a third party, although the equipment and training will be of some use in such circumstances.
On some fields, the offshore facility is not totally dependent on the ERRV and have appropriately located radar systems to provide safety, security and private surveillance of the surrounding sea area. These radar systems range from assisting in the location of personnel who may have entered the water following helicopter ditching or over the side work to the detection and tracking of vessels that have the potential to collide with an installation. Examples of such systems have been developed by Kelvin Hughes, Klein Marine and Denbridge Marine. The most advantageous location for the equipment, in these systems, can be selected to optimise radar performance in respect of vessel detection and tracking.
While it is likely that an ERRV mounted radar system ought to be able to detect the majority of targets in its vicinity at an adequate range to warn of risk of collision, in a number of cases on the UKCS, particularly in the southern North Sea, one vessel may have responsibility for a number of installations. In these circumstances it is possible for an ERRV to be at one extreme of its operational

14
area while an errant vessel is approaching from the other. Depending on the size of the area covered and disposition of installations within it, the limitations of a CMR may lead to a reduction in the detection and warning time for an errant vessel. Figure 1 highlights the possible effect on early radar detection of an ERRV patrolling a field of multiple installations.
Figure 1 depicts a seven installation field and the radar coverage area of a hybrid radar system with 25 nautical mile range fitted at installation ‘B’ with an ERRV using the 12 miles range to the south of installation ‘G’. The early warning provided by the ERRV of vessels approaching the field from the west is likely to be impaired (even if radar watch keepers used the 24 miles range) and will require an extra degree of vigilance from those involved.
It is quite likely that some of the installations depicted in the field in Figure 1 are Normally Unattended Installations (NUIs) and therefore it is unlikely that the ERRV will not be called upon to provide close standby as a matter of routine. However, even in such circumstances, continuous collision risk monitoring for all installations will still need to be provided. In some cases daughter craft have taken on the support role of NUI during manned periods and these, too, are fitted with a
Figure 1: Radar coverage provided by hybrid radar system and ERRV
15
radar. For anything other than rudimentary navigation and target detection the ‘fitness for purpose’ of their radar is a matter for conjecture.
Moreover, where groups of installations are covered there could be some degradation of radar performance caused by intervening structures. This results in the possibility of ‘blind’ or ‘shadow’ sectors in the installations. The magnitude of this phenomenon is largely dependent on the size and type of the installation and the ERRV’s proximity to it. For instance, radar performance is less likely to be affected by small tubular structures than by large solid jackets whereas the performance of an ERRV radar that is close to an installation will be subjected to bigger ‘blind’ and ‘shadow’ sectors than one that is further away. The largest of these effects will probably occur if an ERRV is close to an FPSO or similar; these are essentially ship shaped structures which that are likely to produce large ‘blind’ or ‘shadow’ sectors for the ERRV’s radar when close.
The utilisation of a single ERRV to cover several jackets increases the complexity of the task by more than a multiple of the number of jackets involved. The need to detect, assess and monitor targets as they approach and pass several geographically separate installations, while at the same time factoring in different ‘blind’ and ‘shadow’ sectors, increases the workload on ERRV Officers Of the Watch (OOWs) considerably.
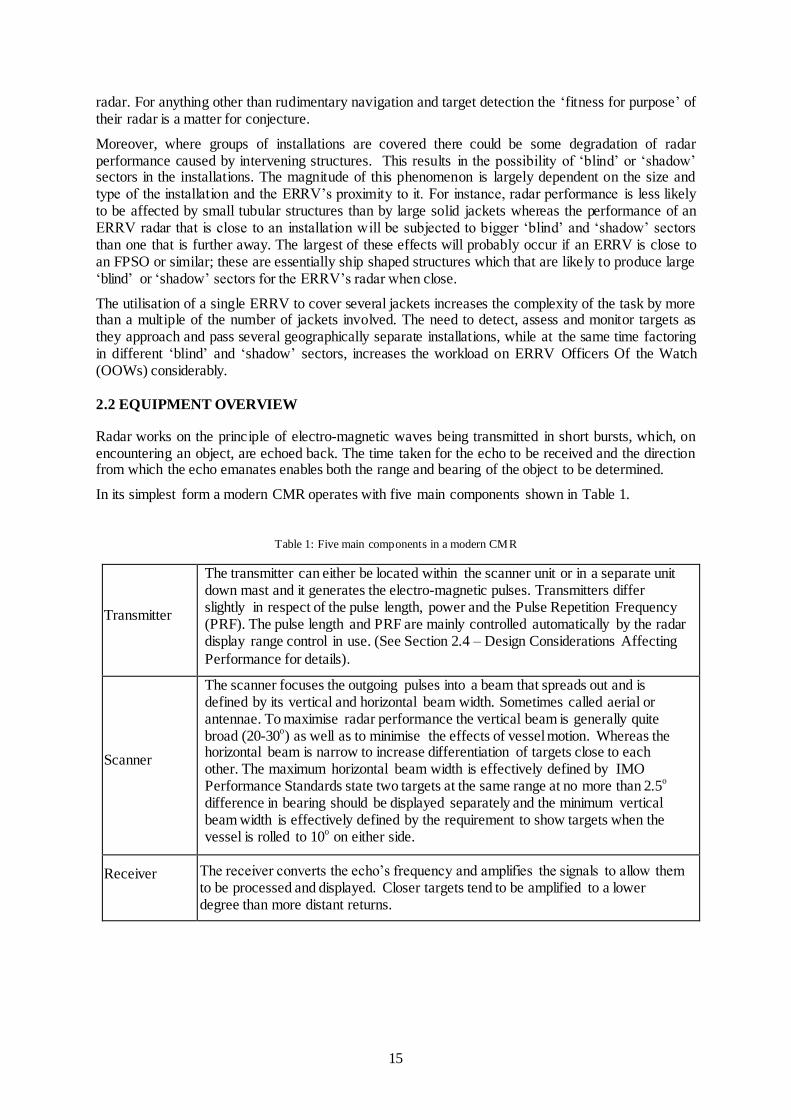
2.2 EQUIPMENT OVERVIEW
Radar works on the principle of electro-magnetic waves being transmitted in short bursts, which, on encountering an object, are echoed back. The time taken for the echo to be received and the direction from which the echo emanates enables both the range and bearing of the object to be determined.
In its simplest form a modern CMR operates with five main components shown in Table 1.
Table 1: Five main components in a modern CMR
Transmitter
The transmitter can either be located within the scanner unit or in a separate unit down mast and it generates the electro-magnetic pulses. Transmitters differ slightly in respect of the pulse length, power and the Pulse Repetition Frequency (PRF). The pulse length and PRF are mainly controlled automatically by the radar display range control in use. (See Section 2.4 – Design Considerations Affecting
Performance for details).
Scanner
The scanner focuses the outgoing pulses into a beam that spreads out and is defined by its vertical and horizontal beam width. Sometimes called aerial or antennae. To maximise radar performance the vertical beam is generally quite broad (20-30
o) as well as to minimise the effects of vessel motion. Whereas the
horizontal beam is narrow to increase differentiation of targets close to each other. The maximum horizontal beam width is effectively defined by IMO Performance Standards state two targets at the same range at no more than 2.5
o
difference in bearing should be displayed separately and the minimum vertical beam width is effectively defined by the requirement to show targets when the vessel is rolled to 10
o on either side.
Receiver
The receiver converts the echo’s frequency and amplifies the signals to allow them to be processed and displayed. Closer targets tend to be amplified to a lower degree than more distant returns.
16
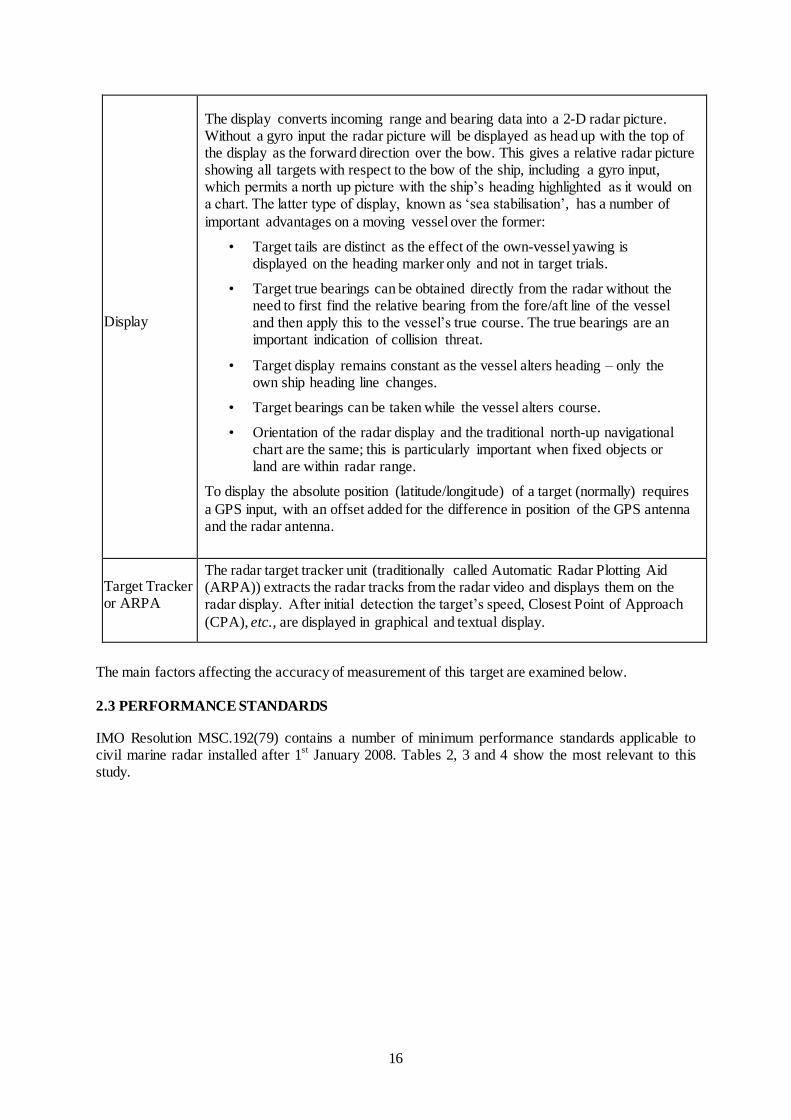
Display
The display converts incoming range and bearing data into a 2-D radar picture. Without a gyro input the radar picture will be displayed as head up with the top of the display as the forward direction over the bow. This gives a relative radar picture showing all targets with respect to the bow of the ship, including a gyro input, which permits a north up picture with the ship’s heading highlighted as it would on a chart. The latter type of display, known as ‘sea stabilisation’, has a number of
important advantages on a moving vessel over the former:
• Target tails are distinct as the effect of the own-vessel yawing is displayed on the heading marker only and not in target trials.
• Target true bearings can be obtained directly from the radar without the need to first find the relative bearing from the fore/aft line of the vessel and then apply this to the vessel’s true course. The true bearings are an important indication of collision threat.
• Target display remains constant as the vessel alters heading – only the own ship heading line changes.
• Target bearings can be taken while the vessel alters course.
• Orientation of the radar display and the traditional north-up navigational chart are the same; this is particularly important when fixed objects or land are within radar range.
To display the absolute position (latitude/longitude) of a target (normally) requires
a GPS input, with an offset added for the difference in position of the GPS antenna and the radar antenna.
Target Tracker or ARPA
The radar target tracker unit (traditionally called Automatic Radar Plotting Aid (ARPA)) extracts the radar tracks from the radar video and displays them on the radar display. After initial detection the target’s speed, Closest Point of Approach
(CPA), etc., are displayed in graphical and textual display.
The main factors affecting the accuracy of measurement of this target are examined below.
2.3 PERFORMANCE STANDARDS
IMO Resolution MSC.192(79) contains a number of minimum performance standards applicable to civil marine radar installed after 1
st January 2008. Tables 2, 3 and 4 show the most relevant to this
study.
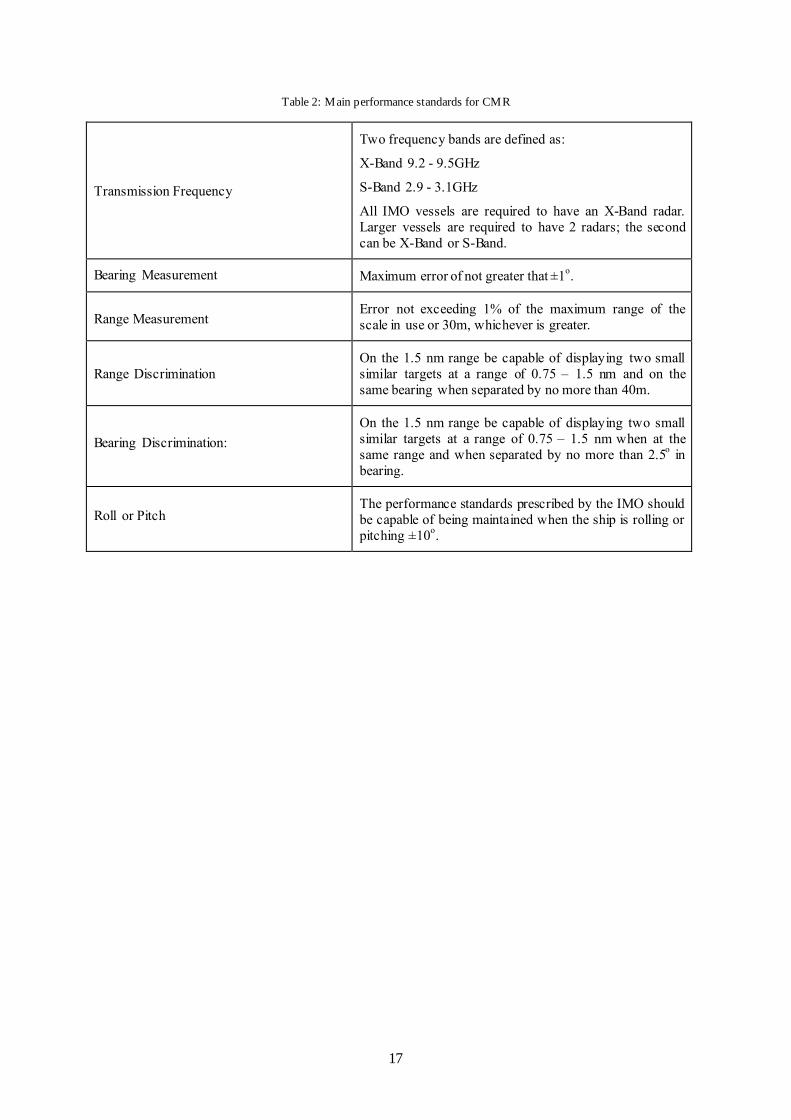
17
Table 2: Main performance standards for CMR
Transmission Frequency
Two frequency bands are defined as:
X-Band 9.2 - 9.5GHz
S-Band 2.9 - 3.1GHz
All IMO vessels are required to have an X-Band radar.
Larger vessels are required to have 2 radars; the second
can be X-Band or S-Band.
Bearing Measurement Maximum error of not greater that ±1o.
Range Measurement Error not exceeding 1% of the maximum range of the
scale in use or 30m, whichever is greater.
Range Discrimination
On the 1.5 nm range be capable of displaying two small
similar targets at a range of 0.75 – 1.5 nm and on the
same bearing when separated by no more than 40m.
Bearing Discrimination:
On the 1.5 nm range be capable of displaying two small
similar targets at a range of 0.75 – 1.5 nm when at the
same range and when separated by no more than 2.5o in
bearing.
Roll or Pitch The performance standards prescribed by the IMO should
be capable of being maintained when the ship is rolling or
pitching ±10o.

18
Table 3: Minimum detection ranges of civil maritime radar in clutter-free conditions
Target description
Target feature Detection range (nm)
Height above sea
level (m)
X-Band (nm) S-Band (nm)
Shorelines Rising to 60 20 20
Shorelines Rising to 6 8 8
Shorelines Rising to 3 6 6
SOLAS ships (>5000 gross tonnage) 10 11 11
SOLAS ships (>500 gross tonnage) 5.0 8 8
Small vessel with radar reflector
meeting IMO Performance Standards
4.0 5.0 3.7
Navigation buoy with comer
reflector
3.5 4.9 3.6
Typical Navigation buoy 3.5 4.6 3.0
Small vessel of length 10m with no
radar reflector
2.0 3.4 3.0
Table 4: Tracked target accuracy (95% probability figures)
Time of
steady-
state
Relative
course
(degrees)
Relative
speed
(knots)
Closest
point of
approach
(CPA) (nm)
Time to
CPA
(TCPA)
(minutes)
True
Course
(degrees)
True Speed
(knots)
(the trend)
1 minute
11 1.5 or 10%
whichever is
greater
1.0 -------- --------- -------
(the
motion)
3 minutes
3 0.8 or 1%
whichever is
greater
0.3 0.5 5 0.5 or 1%
whichever is
greater
It can be seen that target tracker (or ARPA) bases its calculations on the last 3 minutes of tracker data only. Therefore if a target vessel alters its course and/or speed it will take up to 3 minutes after the target vessel has finished its alteration before the full accuracy of the new course/speed is clear to the observer. However, there will be an indication that there has been an alteration much earlier.
2.4 DESIGN CONSIDERATIONS AFFECTING PERFORMANCE
The main factors that can affect the performance of a CMR at the design stage are the power of the transmitter, the length of the electro-magnetic pulses that it emits and the frequency by which it does so. These factors do not apply in isolation and the setting chosen to optimise one may have an adverse

19
effect on one and compromise another.
Transmitter power - Transmitter power influences the radar’s range and how well it detects smaller targets. While it is true that increasing the power leads to a greater range, it also should be realized that radar electro-magnetic waves travel like light electro-magnetic waves but with a small extra amount of bending (refraction) so that typically the radar horizon is 10% more than the visible horizon, depending on frequency and weather. Freak conditions when the bending matches the curvature of the earth can occur but this would be very unlikely on the UKCS. However ship targets are usually detected beyond the radar horizon because the radio energy is reflected off their higher parts. The power also has an effect on radar accuracy insofar as the better a target is illuminated by radar the better it is for an ARPA to determine its shape and centre.
Pulse length - The length of the electro-magnetic pulse affects the range of the radar and the discrimination between targets. Long pulse lengths have more energy than short pulse lengths and therefore can be used at a greater range. Unfortunately, the longer the pulse the worse the ability to discriminate two targets on same bearing and very similar range as two targets not one target. So there is a compromise to be made between resolution of targets and maximum radar range and it is why radar pulses vary with the range scale in use.
Pulse Repetition Frequency (PRF) - PRF is the number of transmitted pulses per second. Changing the pulse length affects the PRF which is usually faster for short pulse lengths and slower for longer lengths. This is necessary because a longer pulse travels a greater distance and therefore requires a greater time to reach and be reflected back from the target before the next pulse is emitted. In general, the larger the PRF the better the chance of a weak target returning a pulse and being detected. The target is also better defined, has a more accurate centre and therefore is better for an ARPA to determine bearing accuracy.
Changing a radar’s range setting automatically changes the pulse length and PRF to produce optimum conditions for the selected range shown in Table 5.
Table 5: A typical selection of PRF and pulse lengths provided on a traditional CMR for various range scales
Range
scale (nm) PRF
Pulse
length
0.25 2000 0.05
0.5 2000 0.05
0.75 2000 0.05
1.5 2000 0.05
3 1000 0.25
6 1000 0.25
12 1000 0.25
24 500 1
48 500 1
2.5 PHYSICAL CONDITIONS AFFECTING PERFORMANCE
2.5.1 Scanner Height
The height of the radar scanner defines the theoretical radar horizon as, in general, radar wave’s travel with only small bending when being transmitted from and reflected back to the scanner.
Similarly, targets with a greater height ought to be detected before lower ones as they will become

20
visible to the radar earlier. Table 6 highlights the distance of the visible horizon at various heights of eye and contrasts this with the maximum theoretical radar horizon. The differences are due to the slight refraction of radar waves as they pass through the atmosphere.
Siting radar scanners at the highest available point is generally sought after although there is still a balance to be struck to minimise target loss as they approach the scanner. The range at which close targets are ‘lost’ by a radar will depend on the vertical beam width coupled with scanner height. If the scanner is too high and the vertical beam width too narrow then a target will be ‘lost under the radar’ at a greater range than if the scanner was lower and the beam width was wider. Angling the scanner downwards can have effect on this but will also reduce the radar horizon range.
Table 6: Theoretical visible and theoretical radar horizons at different heights of eye
Height of eye (m) Visible horizon
(nm)
Theoretical radar horizon
(nm)
10 6.1 7.0
15 7.5 8.6
20 8.6 9.9
30 10.5 12.1
50 13.6 15.6
100 19.2 22.1
Although scanner height is the major factor in the radar’s theoretical maximum range, the further refraction of radar waves due to non-standard atmospheric conditions can occur and this has the effect of diminishing or extending detection ranges (see Section 2.6).
2.5.2 Blind and Shadow Sectors
All radar, regardless of being platform based or a conventional system fitted on an ERRV, are subject to ‘blind’ and ‘shadow’ sectors caused by intervening non-radar transparent obstructions. Such sectors may result from part of the structure, upon which the radar antenna is located, being in the way of the area swept by the radar beam, for example masts on the ERRV, legs of a jack-up, or cranes on a fixed or floating installation. Similarly, ‘blind’ and ‘shadow’ sectors may be caused by temporary obstructions such as, another vessel or the installation itself. Partial obstruction of the pulses, either in the vertical or horizontal plane, results in a shadow sector wherein the radar suffers reduced detection ranges. Blind sectors can also occur where radar detection is totally obscured. The number and angular extent of these sectors is dependent on the relative locations of the scanner, any obstructions and possibly also the trim of the vessel.
Certain ‘blind’ and ‘shadow’ sectors, primarily those caused by permanent parts of the structure, can be readily ascertained and steps can be taken to minimise their effects or at least to make allowances for them. The magnitude and direction of the temporary ‘blind’ and ‘shadow’ sectors is related to a number of factors, such as, the height of the radar antenna in relation to the temporary obstructions and also its proximity. Antennas at low height tend to suffer the effects more, although not exclusively as on rare occasions they may be able to ‘see’ under the obstruction (in the case of a jacket). The presence of FPSOs, shuttle tankers, etc., in the field has the potential to create very large blind and shadow sectors in the right circumstances.
Furthermore, even though an ERRV may be moving, the blind or shadow sectors caused by a
21
temporary obstruction may remain, albeit on a changing bearing, if the relative bearings between the ERRV, the temporary obstruction and the approaching vessel do not change.
The report reproduced in Appendix 2 explains and quantifies the causes and effects of blind and shadow sectors in more detail than is presented here.
2.5.3 Target Reflective Properties
Each target has a number of properties that will have an effect on the echo returned from it:
Material – Targets constructed of electrically conductive materials generate the best radar returns. Metals are better in this respect than wood whereas man-made materials such as fibreglass, polythene, nylon, etc., are the worst. In many cases man-made materials offer very poor radar reflections, if not being almost transparent. It is also likely that fibreglass coated with an anti-fouling coating will provide better radar returns than a wooden hull with the same coating.
Size – Up to a point, the echo strength of smaller targets varies directly with their projected area. However, because the horizontal beam width is narrow, targets easily fill it. Any further increase in vessel size has only a limited effect on displayed echo size. The vertical beam width is much wider to take into account of the dynamic effects of a vessel in a seaway and is composed of a number of lobes, the more of the lobes that are cut the better the radar return will be. In general this effect leads to better echo strength when the height of the scanner is increased.
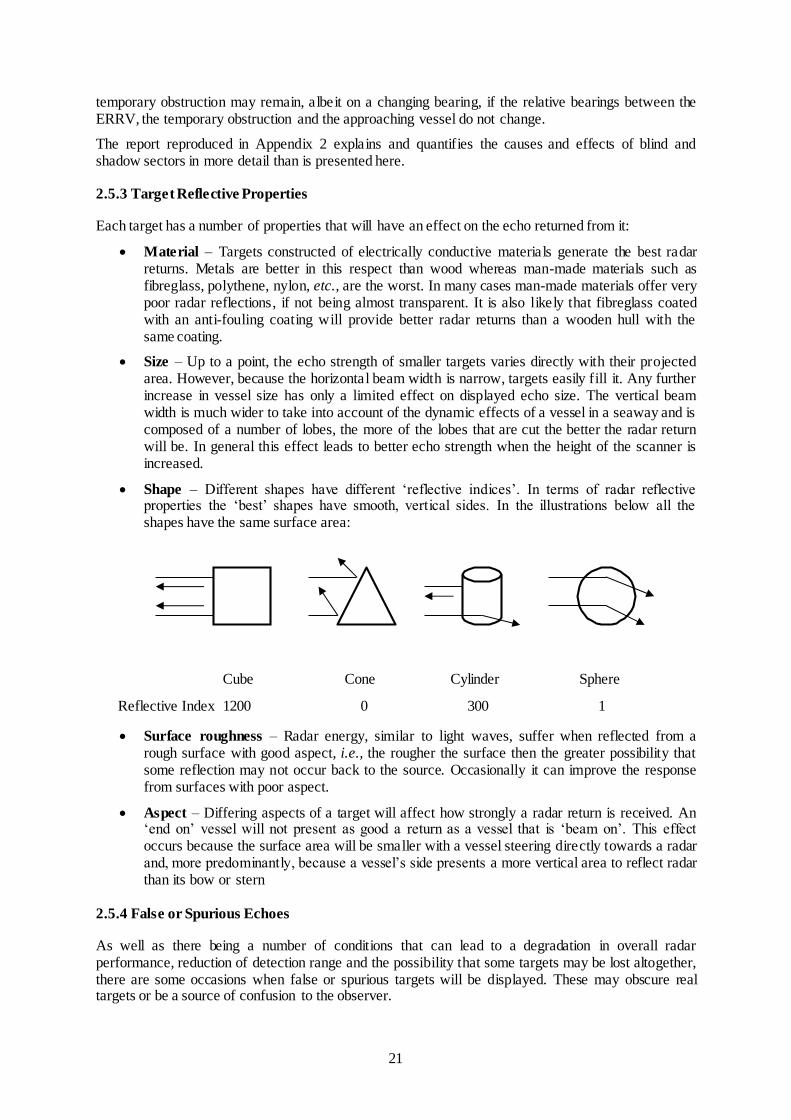
Shape – Different shapes have different ‘reflective indices’. In terms of radar reflective properties the ‘best’ shapes have smooth, vertical sides. In the illustrations below all the shapes have the same surface area:
Cube Cone Cylinder Sphere
Reflective Index 1200 0 300 1
Surface roughness – Radar energy, similar to light waves, suffer when reflected from a rough surface with good aspect, i.e., the rougher the surface then the greater possibility that some reflection may not occur back to the source. Occasionally it can improve the response from surfaces with poor aspect.
Aspect – Differing aspects of a target will affect how strongly a radar return is received. An ‘end on’ vessel will not present as good a return as a vessel that is ‘beam on’. This effect occurs because the surface area will be smaller with a vessel steering directly towards a radar and, more predominantly, because a vessel’s side presents a more vertical area to reflect radar than its bow or stern
2.5.4 False or Spurious Echoes
As well as there being a number of conditions that can lead to a degradation in overall radar performance, reduction of detection range and the possibility that some targets may be lost altogether, there are some occasions when false or spurious targets will be displayed. These may obscure real targets or be a source of confusion to the observer.

22
Second trace returns – These are caused by the echo from one pulse being returned to the display after the next pulse has been transmitted, i.e., an echo returned from a target beyond the maximum theoretical range. A second trace return is not displayed by its own trace but by the following one. As an example, if a PRF is 1000, the maximum theoretical range will be 81 miles whereas if a target is 90 miles away it will be displayed at a range of 9 miles. Second trace returns are particularly prevalent under super-refraction or radar ducting conditions. A change of PRF will indicate whether the return is true or a second trace, as it will endure even with a different PRF. Modern radars should be continuously varying their PRF very slightly for each pulse so that second trace echoes are eliminated.
Indirect reflected echoes – If outgoing pulses are obstructed but then reflected in such a way as to reach a target before following the same path back to the radar, it is possible for them to be displayed at approximately the correct range but on the bearing of the obstruction instead of their correct bearing. If the obstruction is on board the ERRV it is often the case that reflected echoes appear to be in the ‘blind’ or ‘shadow’ sector as well as the true bearing. If the reflection occurs off another source; a cliff, a quay or an installation very close to an ERRV, it is likely that both the bearing and range of the indirect echo will be in error.
Multiple echoes – This effect is particularly relevant on shipborne radars when the target is large, in close proximity and at the optimum (‘beam on’) aspect for returns. Radar energy is transmitted and reflected back and forth between the target and ERRV. Echoes are displayed on the correct bearing but on multiples of the closest (correct) range. They become progressively weaker with increased range.
Radar to radar interference – All CMRs operate within a predefined frequency range and therefore it is possible that other radars in the vicinity may be operating on the same frequency. When transmitted pulses from the other set is picked up by the ERRV (rather than its own reflected returns) it can be displayed as ‘spoking’. Good signal processing software can eliminate this interference on the display.
Side lobes – Due to imperfections or inefficient scanner design it is usual for small lobes of energy to exist on each side of the main lobe. Especially with large targets at close range there may be sufficient energy within the side lobes for a return to be displayed. Such echoes will be at the correct range but wrong bearing. The resultant picture is the target appearing as a very large arc on the user display.
2.6 METEOROLOGICAL CONDITIONS AFFECTING PERFORMANCE
Certain meteorological conditions can affect radar performance markedly and unexpectedly. Some effects, such as heavy rain in the vicinity or increased winds causing radar returns from the sea surface, are apparent from the radar display whereas other meteorological phenomena can lead to a degradation in radar performance without necessarily manifesting themselves to a radar observer. This latter category affects the propagation of radar waves through the atmosphere.
Sea conditions – In any sea state, other than smooth water, radar returns are received from the water to be displayed as ‘sea clutter’. This usually occurs when there is a breaking sea state resulting in radar energy being reflected back to the vessel from the near vertical face of the wave. The effect of clutter can make it difficult to display small targets in the area due to a lack of contrast between it and the background sea returns. An antenna mounted high will suffer more sea-clutter than an antenna mounted low. Another implication of the sea condition is the effect it has on a vessel’s movement. To a greater, or lesser extent, as a vessel rolls and/or pitches in a seaway, the centre of the radar beam may alternately be directed towards the sea or above the horizon. Obviously, smaller vessels are likely to be more susceptible to sea induced movement than larger ones.
Precipitation – Rain can cause a scattering of radar energy so that the pulse is weakened and the detection ranges of targets in and beyond the rain is reduced. In many instances the rain reflects sufficient energy back to radar and this is displayed as rain clutter. The effect of this
23
is to further reduce target detection and definition within the rain area due to lack of contrast between the echo and background. Echoes from a targets situation beyond a rain cloud also suffer from reduced responses as the pulse is weakened as it passes through the rain portion of its path. Different types of precipitation, i.e., rain, hail, sleet and snow, exhibit broadly similar characteristics on radar although clutter caused by rain tends to be worse because of the greater water content.
Fog, Mist, Dust and Sand – Fog and mist do not generally produce echoes although detection ranges may be slightly reduced in dense fog. Although dust or sand laden atmospheres are not a common occurrence on the UKCS, they can lead to small reductions in detection ranges and occasionally sand storms can give rise to a speckled effect on the radar display.
Propagation – Radar waves suffer refraction or bending in the atmosphere in a similar way to light waves, the amount of refraction depending on the prevailing atmospheric conditions. In standard conditions (pressure = 1013mb sea level – decreasing at 36mb/300m; temperature = 15◦C sea level – lapse rate of 2
oC/300m; relative humidity = 60% - constant) the radar wave
is bent in such a way that the radar horizon can be approximately 15% further than the visible horizon for similar heights of eye/scanner, for 3cm wavelength radars. When atmospheric conditions are non-standard then anomalous propagation can occur; these are classed as either ‘sub-refraction’, ‘super refraction’ or ‘ducting’, and are outlined below. The extent to which these conditions occur is very variable and almost impossible to predict with accuracy.
o Sub-refraction – A shortening of the radar horizon caused by the radar wave being refracted in such a way that the energy lobe leaves the earth’s surface sooner than it would under normal atmospheric conditions. The effect of sub-refraction is a reduction in detection ranges. Conditions under which it can occur includes, an increase in the lapse rate or relative humidity increasing with height, for example , cold air moving over a relatively warm sea surface.
o Super-refraction – An increase to the radar horizon from the radar wave being refracted forcing the energy lobe to follow the earth’s curvature further than it would under normal atmospheric conditions. Super-refraction increases radar detection ranges and occurs when the lapse rate is less than normal or the relative humidity decreases with height, such as in areas where warm air moves over a cooler sea surface.
o Radar ducting – It is possible, at some height, that the temperature ceases to fall and begins to rise with increased altitude. Up to this point, known as the inversion level, a duct occurs and radar pulses are trapped and can travel large distances over the earth’s surface leading to ‘second trace returns’ (see Section 2.5.4).
2.7 COHERENT RADAR
CMR technology development took an important step forward in the 2000’s with the introduction of coherent radar, developed from military applications. Traditional radar should now be termed incoherent radar. The essential differences are:
Power - The radar power is significantly reduced from 10-50kW to less than 200W (microwatt systems are feasible). The reduced power means that the radar transmissions are produced by solid state technology and the high power cavity magnetron is no longer required. The cavity magnetron has a finite life (typically 2 years) while solid state technology should not require this regular replacement. This all facilitates a compact, low voltage design which means that transceiver can now be in the same unit as the aerial ‘upmast’ with further benefits in reducing radar signal loss between the aerial and transceiver.
Solid State Transmitter- This means that the radar transmissions are carefully controlled by frequency, phase and magnitude to produce a coded transmission. The coherent radar receiver

24
not only detects the magnitude of the received echo, but also phase and frequency changes caused by the reflection of the echo from the target and clutter responses. It is to expect that different Doppler shifts in frequency will occur from different types of target or clutter as they will have different vertical and horizontal movement. Different echoing surfaces also cause different phase shifts when reflecting the radar energy, which can further aid detection and identification of these different responses. Thus at any particular spot the radar should theoretically be able to identify and differentiate between static and moving targets, vessels and rain/sea clutter. In summary, this feature overcomes the major incoherent radar limitation that a target response must be stronger than the surrounding clutter to be detected. Coherent radar means that targets weaker than the surrounding clutter can now be detected.
Variable Pulse Lengths - Coherent radar also overcomes a limitation of incoherent radar in that radar pulse lengths affect the minimum radar range as the receiver cannot receive while the transmitter is transmitting. Pulse length also has an effect on radar discrimination between two targets that are close together. The delicate coherent radar transmissions do not have this problem and can receive signals at the same time as transmission. This means that far longer pulses can be transmitted which increases the chances of detecting weak targets. The processing of these longer pulses in the receiver does require computer intensive digital pulse compression techniques to keep range discrimination low.
Static Aerials - This technology should eventually allow the replacement of the mechanical rotating aerial systems with static panels producing a controllable directional beam. This will enable a more intelligent beam which can spend some of its ‘duty’ time searching areas of interest as opposed to spending its time searching equally in all directions.
The ability of coherent radar to detect weak targets is particularly striking in heavy clutter conditions. These systems are therefore ideal as a basis for unmanned and fully automatic systems proposed for hybrid systems discussed in Section 4. There is no practical requirement for any operator controls to adjust the radar signal performance for specific conditions. This eliminates tuning, gain, pulse length, sea clutter and rain clutter controls, which makes it ideal for equipment not intended for a continuous human radar watch.
An example is the Kelvin Hughes SharpEye™ coherent radar technology. The introduction of this technology onto merchant vessels generally has been very slow, due to the extra initial costs of such systems however it has been used more extensively in static surveillance systems.
2.8 SUMMARY AND DISCUSSION
CMR is invaluable in providing early warning collision risk monitoring of the sea area around itself, be it on a vessel or on an installation, and it is difficult to see it being replaced in the medium term with alternative technologies. Indeed, it is more likely that radar will be supplemented by other emerging technologies rather than being superseded by them. This is mainly because it is not reliant on information and equipment located on the potential vessel targets.
Throughout its existence CMR has been continually improved in terms of performance, reliability and the uses/ease to which it can be put. Much of the responsibility for ensuring proper tuning and the plotting of targets, to determine collision risk, has largely been taken out of the radar observer’s hands. However, with almost all shipborne radar the need for a well-trained and diligent watch keeper endures to this day to understand and minimise the potential dangers that may stem from some of the limitations described above.
In respect of CMR on the UKCS the scope has expanded through the development of platform based systems, so called ‘hybrid radar’ either as an integral part of a wider emergency response system or as a supplement to a conventional ERRV based system for collision risk warning and management. There are a number of advantages and disadvantages to each system and these are discussed further in Section 4.
The main problem is that there is some uncertainty in the outputs from radar sensors. Hence, all of the

25
target recognition, information fusion and situation awareness traditionally relies on the experience of operators. Due to the limited manpower on the assets, it is impossible to investigate radar blips manually one by one. In other applications of consumer electronics, such as SIRI (In an iPhone or an iPad) and Google maps, this problem has been addressed by historical data analysis and artificial intelligence. Thus, much manual work of radar interpretation can also be accomplished by artificial intelligence using appropriate methodologies and sufficient historical data. Much information on vessels and abundant historical records have been accumulated over the years. The only thing lacking is the applicable methodologies which are capable of making reasonable inference under uncertainties. Currently, Bayesian Networks, Neural Networks and other intelligent methodologies have been considered for use into this area. The alternative approach is the further development of coherent radar as this reduces reliance on the human operator as discussed in Section 2.7.

26
3 AUTOMATIC IDENTIFICATION SYSTEM (AIS)
3.1 OVERVIEW
AIS was first introduced in 2002 for the marine industry and in theory, provides the potential to increase maritime safety by providing a means for ships to autonomously exchange information on their identity, position, course, speed and other data with other nearby ships, close-orbit satellites and shore stations. The situational awareness of OOWs on board vessels fitted with the equipment should be increased as a result. Initially the first system was introduced in 2002 for vessels covered by the IMO SOLAS convention, which covers merchant vessels of 300 gross tonnage trading internationally. Later it was introduced to non-SOLAS vessels in a simplified form in 2006. These two systems have been termed Class A and Class B respectively.
AIS is a standardised shipboard broadcast transponder system in which vessels continually transmit and receive information. The system uses two dedicated VHF radio channels (161.975MHZ and 162.025MHZ) for spontaneous and autonomous communication. This permits hundreds of transmitters to send data bursts over two narrowband radio channels by synchronising their data transmissions to a very precise timing standard controlled by the Global Navigation Satellite System (GNSS). This Time Division Multiple Access (TDMA) system allows for data exchange which is totally automatic and transparent to the users.
AIS is designed to operate in the following modes:
In a ship-to-ship mode for collision avoidance.
As a means for coastal states to obtain information about a ship and its cargo.
As a traffic management tool when integrated with a Vessel Traffic System (VTS) or hybrid radar system of the type used on some offshore installation on the UKCS.
As a transmission node that can be used to deliver emergency or binary short messages.
As a personal distress device that can be used to broadcast positions to the vessels nearby and local maritime search and rescue centres.
The International Telecommunication Union (ITU) has developed the “Technical characteristics for AIS using time division multiple access in the VHF maritime mobile frequency band” (ITU-R Recommendation M.1371-5). This document defines in detail how AIS and self-organisation, or SO-TDMA technology works. The latest AIS standard was published in 2010 (ITU-R M.1371-4), where carrier-sense TDMA, or CSTDMA and 5 new AIS messages have been introduced for Class B vessels.
In respect of fixed offshore oil and gas installations and mobile drilling units while on station the ITU document does not recommend mandatory fitment of AIS equipment but, where it is carried, it should act as the ‘base station’. In this context it is important to note that when mobile units are in transit they are covered by the requirements of SOLAS Chapter V just as any other ship would be and therefore should be fitted with operational shipboard AIS. When mobile drilling units reach their station they should cease AIS transmissions and may become a base station.
There are potential benefits to using the AIS equipment. These are discussed in more detail in the following sub-sections.
In areas under UK jurisdiction the Maritime & Coastguard Agency (MCA) Technical Services Branch is the lead agency for AIS. Operators of fixed and mobile drilling units should refer to them when considering whether to install base station equipment as there may be implications for the broader network. Some constraints on the network may mean that the MCA may decide that making a particular offshore installation into an AIS base station would not be appropriate. In Norway some offshore installations are being fitted as AIS base stations and integrated into their national network.

27
3.2 USE OF AIS
3.2.1 Ship-to-Ship Data Exchange
An important use of AIS is autonomous ship-to-ship reporting whereby each ship transmits its data to all other AIS-equipped ships within VHF range, which might be 25+ nm in fine weather. The communications scheme permits these data transmissions to take place independently without the need for a master control station.
Position and other navigational data is fed automatically from the ship’s sensors into the AIS system where it is formatted and transmitted in a short data burst on two dedicated VHF channels. When received by other ships the data is decoded and can be displayed in graphical and text format. It is also possible for AIS data to be fed to an integrated navigation system or ARPA to provide AIS ‘tags’ for radar targets. AIS data can also be logged to a Voyage Data Recorder (VDR) on vessels for playback and future analysis in the event of an incident.
Updated AIS messages are transmitted automatically without any action required by the watch officer on either ship. The frequency between transmissions varies between every few seconds and every few minutes depending on the vessel’s status and the type of information being broadcast. This is detailed in Section 3.4.
3.2.2 Coastal Surveillance
In coastal waters the authorities may establish automated AIS stations to monitor the movement of vessels through an area. These stations may simply monitor AIS transmissions from passing ships, but may actively poll vessels via the AIS channels, requesting data such as identification, destination, ETA, type of cargo and other information. Coast stations can also use the AIS channels for shore-to-ship transmissions, to send information on tides, Notices to Mariners and local weather forecasts. Multiple AIS coast stations and repeaters may be tied together into Wide Area Networks (WAN) for extended coverage. However, the transmission reliability of AIS is not always very satisfactory. AIS messages can be lost when the corresponding transmission distances are larger than 10 km. The successful rate of AIS transmissions being received will reduce with range. Generally, when the transmitting distance is about 15 km, the success rate of the AIS transmission will be approximately 30 % to 50 %.
Coastal nations may use AIS to monitor the movement of hazardous cargoes and control commercial fishing operations in their territorial waters. AIS data can be logged automatically for playback in investigating an accident, oil spill or other event. AIS can also be a useful tool in Search And Rescue (SAR) operations, allowing SAR co-ordinators to monitor the movements of all surface ships, aircraft and helicopters involved in the rescue effort.
3.2.3 Vessel Traffic Systems
When integrated with a shore-based Vessel Traffic System (VTS), AIS can facilitate monitoring and controlling the movement of vessels through restricted harbours and waterways. AIS can augment traditional radar-based VTS installations and provide an AIS “overlay” on the radar picture. It can also provide a cost-effective solution in areas where it is not feasible to establish radar-based systems, possibly on offshore oil and gas installations that are not covered by a hybrid radar system. When integrated with radar, AIS can help ensure a more continuous coverage, even when the radar picture is degraded by heavy precipitation or other interference.
A VTS can be an AIS control station and can assume control over the assignment of timeslots for AIS messages to ensure optimum data exchange within the coverage area. Dedicated channels may be designated for local-area AIS operations and shipboard AIS equipment has the ability to shift to different channels automatically when directed by a VTS controller.

28
3.2.4 Potential Benefits of AIS to the Offshore Industry
For ERRV watch keepers:
Improved situational awareness
Unambiguous identification of many radar targets
Not affected by problems of “target swapping” when two contacts pass close together on the radar screen
Ability to “see” behind an intervening structure to detect and identify other ships
Detect a change in another ship’s heading almost in real time without waiting for ARPA calculations
Detect vessels that might otherwise be hidden in another vessel’s or installation’s radar shadow
Real time information about other ship’s movements (e.g., accelerating or decelerating, rate of turn)
For installations:
Automatic identification of many radar targets
A more constant coverage, even when a radar picture is degraded by weather and interference
Automatic logging of all data
Limitations:
Currently, not all vessels have to be AIS equipped, although all larger vessels are mandated and therefore expected to be transmitting AIS messages
AIS vessels can turn off their AIS transmissions. This presents a problem in a number of situations, such as, unregulated fishing which occurs when fishing vessels turn their AIS off.
3.2.5 Satellite Surveillance of AIS Signals
A small number of organisations monitor AIS signals from low earth orbit satellites. AIS signals were never designed to be satellite based systems and a number of technological challenges needed to be overcome. In particular, even a low earth orbit satellite has instantaneous coverage over several hundred miles and therefore the satellite almost certainly receives multiple transmissions in the same slots, which can interfere with each other. However these challenges have been overcome, and it does mean that only a very small proportion of AIS messages are processed by satellites and the surveillance of satellites can only provide a position update of minutes or even hours depending on the system. This timescale means that satellite systems are therefore currently unsuitable for the purposes required in this report, although they have clear benefits for other purposes AIS tracking of vessels across oceans out of the range of coastal listening stations.
3.3 AIS COMMUNICATIONS SCHEME
AIS messages are updated and retransmitted continuously to maintain the contemporaneous and usefulness of the data. To achieve this, in normal operation, Class A AIS utilises a Self-Organising Time-Division Multiple Access (SOTDMA) data communications scheme. This uses the precise timing data in the Global Positing System (GPS) signals to synchronise multiple data transmissions from many users on two narrowband channels.
Each AIS unit broadcasts its messages and receives messages from all other units within VHF radio

29
range. The area in which AIS messages can be received is called the unit’s ‘cell’ with the unit at the centre of its own communication cell.
The practical size of the cell can vary according to the traffic density on the AIS channel. If the number of AIS messages begins to overload the network, a unit’s system can automatically shrink its cell by reducing the power it transmits from 12.5W to 2W (which reduces effective range by 50%).
Under the SOTDMA protocol each minute of time is divided into 2,250 timeslots on each of the two VHF channels. An individual AIS message fits into one or several of these 4,500 timeslots, which are selected automatically based on data link traffic and projections of future actions by other stations currently on the network. When a unit first enters the cell of another unit, it takes an unoccupied timeslot. All AIS stations continually synchronise their slot selections with each other.
Timeslots and timeout periods are selected on a randomised basis. Each station continually updates its internal “slot map” to reflect changes in occupied slots and timeouts. Special provisions are made for automatic conflict resolution in the event two stations end up in the same timeslot to ensure that stations always choose unoccupied slots. In situations of high traffic density it may be necessary to reduce the number of ships in a communication cell, as described above. The AIS system applies very specific rules on how this reoccupation of timeslots is done.
The key to the SOTDMA scheme is the availability of a highly accurate standard time reference, to which all of the stations can synchronise their timeslot assignments, in order to avoid overlap. This time reference is supplied by the precise timing signal by a GNSS - usually GPS. The time can be provided by an internal or an external GNSS receiver. Thus, GNSS plays a critical role in AIS, providing the universal time reference as well as positioning data for each unit.
AIS data transmissions utilise a 9.6 kbps FM/GMSK (Gaussian Minimum Shift Keying) modulation technique, as specified in ITU Recommendation M.1371.1. The ITU has designated two dedicated frequencies for AIS; 161.975 MHz (marine band channel 87B) and 162.025 MHz (channel 88B).
An AIS station has two independent VHF receivers that are normally tuned to the two AIS frequencies, as well as one transmitter, which alternates its transmissions back and forth between the two. The shipborne system can also transmit on other frequencies, as for instance when operating under the control of a shore-based VTS. The available frequencies are from 156.025MHZ to 162.025MHZ. This can be done either manually or remotely by the AIS shore station.
Class B AIS is very similar in principle to Class A AIS, however, its data communications scheme is called Carrier Sense Time Division Multiple Access (CSTDMA). This is because if a Class B transceiver detects another transmission at the start of the time slot, it will cease transmission to prevent congestion and interference.
3.4 AIS MESSAGES
AIS is designed to work autonomously and continuously in a ship-to-ship mode but the specifications provide for switchover to an “assigned mode” for operation in an area subject to a competent authority responsible for traffic monitoring. In the latter case the data transmission intervals and timeslots are set remotely by the coastal authority. Alternatively, the AIS can work in a “polling mode” in which the data transfer occurs in response to interrogation from another ship or shore station. In practice, there are seven kinds of AIS terminals, which are Class A, Class B, AIS base stations, Aids to Navigation (AtoN) AIS, SAR-plane AIS and AIS-SART.
Class A is for IMO ships which are greater than 300 gross tonnage and trading internationally. IMO has provided the regulations for Class B ships which are non-IMO vessels so the AIS system will work for all vessels. AIS base stations are usually set up on shore, but may be on offshore structures. AtoN AIS are typically used on buoy, with SAR-plane AIS designed for search and rescue aircraft. AIS-SART is a portable device used only in a distress, which is capable of sending distress and position information to other AIS units within range. All these AIS devices use different messages and follow different transmission rules. The bulk of transmissions at sea are therefore Class A and Class B messages.

30
Class A (and to a certain extent Class B) AIS generated information falls into several categories termed ‘static’ (details of the ship), ‘dynamic’ (ship’s position, course/speed, etc.) and ‘voyage related’ as shown in Table 7. Safety and other messages can also be transmitted/received.
Table 7: Static, dynamic and voyage related Class AAIS data
Static information is programmed into the unit at commissioning whereas most dynamic information is derived from interfaces with a GNSS and other sensors. Some navigational status and voyage-related data is entered manually by the ship’s officers and safety messages can be broadcast at any time by the ship or shore station.
The static and voyage-related data are transmitted every six minutes, when amended or on request (for instance, when interrogated by a Vessel Traffic System operator), and safety messages are sent as needed. The update rates of Class A for dynamic information will depend on the ship’s status and speed, according to the schedule shown in Table 8.
Table 8: The update rates of Class A for dynamic information
Class A, speed/status Information update rate
At anchor 3 minutes
0-14 knots 10 seconds
0-14 knots and changing course 3⅓ seconds
14-23 knots 6 seconds
14-23 knots and changing course 2 seconds
23+ knots 2 seconds
23+ knots and changing course 2 seconds
Static data Dynamic data Voyage related data
IMO number (where available) Ship’s position with accuracy indication and integrity status
Destination and ETA (at Master’s discretion)
Call sign and name Time in UTC Hazardous cargo (type)
Length and beam Course over ground Ship’s draft
Type of ship Speed over ground
Location of position-fixing antenna on the ship (aft of bow and port or starboard of centre- line)
Navigational status (e.g., “at anchor,” “not under command,” manually entered)
Heading
Rate of turn (where available)

31
The update rates of other AIS for dynamic information will depend on the corresponding status, according to the schedule shown in Table 9.
Table 9: The update rates of other AIS for dynamic information
Other AIS types, status and speed Information update
rate
SOTDMA Class B, speed < 2 knots 3 minutes
SOTDMA Class B, 2 knots ≤ speed <14 knots 30 seconds
SOTDMA Class B, 14 knots ≤ speed < 23 knots 15 seconds
SOTDMA Class B, speed ≥ 23 knots 5 seconds
Carrier Sense (CSTDMA Class B, speed < 2 knots) 3 minutes
CSTDMA Class B, speed ≥ 2 knots 30 seconds
Aircraft AIS 15 seconds
AtoN AIS 3 minutes
AIS base stations 1 second
The dynamic data transmitted only contains the ship MMSI number for identification. The ship’s name and other particulars are in the longer message transmitted every 6 minutes. AIS units are programmed to store the longer message details so that both dynamic information and static/voyage data can be interrogated and displayed all together. It therefore follows that often target vessels first appear on observing displays as MMSI numbers and it is only later, when the long message is received, that full details are made available to observers. It also means that it is essential that all vessels have their unique MMSI programmed correctly into their unit.
The AIS specifications also allow for insertion of brief binary messages from ship or shore stations. Such messages might include notices to mariners, navigational warnings, tides and currents, weather forecasts, SAR communications and ship-specific instructions from a VTS operator. The AIS standard also includes formats for transmission of differential GPS error correction data. This can provide valuable redundancy to existing beacon GPS systems in critical navigation areas.
3.5 AIS SHIPBOARD EQUIPMENT
IMO Resolution MSC.74(69), Annex 3 states that an approved shipboard AIS system shall be able to perform the following functions:
Automatically provide information on the ship’s identity, type, position, course, speed, navigational status and other safety-related matters to appropriately equipped shore stations, other ships and aircraft.
Automatically receive such information from similarly fitted ships.
Monitor and track ships.
Exchange data with shore-based facilities.
32
A shipboard AIS system consists of the following elements:
An SOTDMA radio transponder with two VHF receivers and one transmitter (it is also possible that the transponder has a Digital Selective Calling (DSC) receiver tuned to Channel 70).
A control and display unit, which includes the communications processor and interfaces for taking inputs from the ship’s navigation sensors and sending outputs to external systems, such as ECDIS, ARPA, VDR or Inmarsat terminal.
One or more GNSS receivers that provide position information as well as the precise time base needed to synchronise the SOTDMA data transmissions.
A ship’s position and precise timing data are derived from the GNSS receiver, augmented by differential corrections when available. In particular, such differential correction information can be exchanged through No. 17 AIS messages. Other data is fed into the AIS from shipboard sensors, such as gyrocompass and speed log. Static and voyage-related data are operator-entered through a keyboard. The AIS communications processor organises the data for transmission and handles all SOTDMA communication functions. The shipboard transponder system receives AIS reports from other ships and shore stations and displays the AIS data for each target in text or graphic format. AIS data output is often best viewed on the display on an external device such as ECDIS, ARPA or remote PC.
3.6 AIS BASE STATION EQUIPMENT
The main function of an AIS base station is to receive, monitor and record AIS traffic within the VHF coverage area of that unit and to send this information to the AIS Operator Station. A fixed base station can also monitor other AIS base stations, local AtoN stations and forward AIS data and status messages to the AIS Operator System. They can be remotely operated via a Local Area Network (LAN) or other dedicated line enabling minimum maintenance.
An AIS base station can be used for transmitting AIS text messages to AIS transponders on individual vessels or as broadcast messages to all vessels within the VHF coverage area and to transmit Differential Global Navigation Satellite Service (DGNSS) corrections generated from an internal reference station or those from an external third party DGNSS service provider.
However, because of the potentially far reaching consequences for the managed AIS network it is unlikely that Duty Holders will be able to unilaterally make the decision for their installations to act as a base station. Overall responsibility for the operation of the AIS network on the UKCS rests with the MCA and it is to them that Duty Holders should approach prior to fitting AIS equipment.
3.7 SHIPBOARD CARRIAGE REQUIREMENTS
The IMO has established mandatory carriage requirements for approved AIS equipment under the SOLAS Convention, Chapter V. The AIS carriage requirements apply to:
All ships of 300 gross tonnage and upwards engaged on international voyages.
Cargo ships of 500 gross tonnage and upwards not engaged on international voyages.
All passenger ships irrespective of size.
IMO moved forward the deadline for fitting of AIS on ships engaged in international voyages so that all such ships over 300 tons were fitted AIS by 31 December 2004. The deadline for ships not engaged in international voyages was 1 July 2008.
Certain ships are exempt from AIS carriage although most (e.g. military vessels) will carry AIS in normal peace time operation as it is considered that not transmitting AIS may be a cause for confusion. It is also legal for a ship’s master to turn off the AIS if security of the vessel is threatened. This happens routinely in known piracy waters and further underlines the fact that AIS transmission
33
cannot be completely relied upon. Class B carriage requirements vary according to the national state.
3.8 AIS STANDARDS
There are three primary international standards for AIS equipment. They were developed jointly by the IMO, ITU and International Electrotechnical Commission (IEC). Shipboard AIS equipment must meet the provisions of all three bodies.
IMO Resolution MSC.74 (69), Annex 3, “Recommendations on Performance Standards for a Universal Shipborne Automatic Identification System (AIS)”.
This document establishes carriage requirements for AIS and performance requirements for the shipboard equipment. The IMO standard was used by the ITU and IEC in developing technical and testing standards. It was approved by the IMO Subcommittee on Safety of Navigation at its 45th session in late 2000.
ITU-R Recommendation M.1371-1. “Technical characteristics for a universal shipborne automatic identification system using time division multiple access in the VHF maritime mobile band”. This is the first global AIS standard, which specifies the framework of AIS.
IEC Standard 61993-2, “Universal Shipborne Automatic Identification System (AIS)”. This standard specifies the minimum operational and performance requirements, methods of testing and required test results conforming to the performance standards contained in IMO Resolution MSC.74(69), Annex 3. It incorporates the technical characteristics contained in ITU-R M.1371-1 and takes into account the ITU Radio Regulations where appropriate.
ITU-R Recommendation M.1371-4, 2010.
ITU-R Recommendation M.1371-5. “Technical characteristics for an automatic identification system using time division multiple access in the VHF maritime mobile frequency band”. This is the latest standard of AIS, which was published in 2014.
3.9 IMPLEMENTATION AND USE OF AIS IN THE UK
In the UK the MCA has issued several Merchant Shipping Notices (MSN) and Marine Guidance Notices (MGN) concerning the use and implementation of AIS:
MSN 1795 (M) - Revised Carriage Requirements For Automatic Identification Systems (AIS), November 2005 (see Appendix 2)
MGN 324 (M+F) – Radio: Operational Guidance on the use of VHF radio and Automatic Identification Systems (AIS) at sea, July 2006.(see Appendix 2)
MGN 465 (M+F) annual testing of Automatic Identification Systems (AIS), February, 2013.
MSN 321 (M) AIS on double ended passenger ferries
They have also required UK fishing boats of 15m or more in length to have Class A AIS by May 2014.
3.10 SUMMARY AND DISCUSSION
Since first being used on commercial vessels radar has become increasingly digital in recent years. The original analogue radar that displayed an overview of radar targets around a vessel still remains but over the years it has been enhanced with more and more digital information. With the introduction of ARPA the ability to automatically calculate and show vectors indicating the target course, target speed, CPA and the Time to Closest Point of Approach (TCPA), without any manual calculations by the observer. When GPS was connected to radar the traffic situation in absolute, rather than relative , terms could be displayed by calculating a target’s true Course Over Ground (COG) and Speed Over Ground (SOG). More recently, the introduction of digital charts made it possible for the echoes of

34
radar features to be enhanced by overlaying them with an electronic chart.
3.10.1 Integrating AIS with Radar
In its simplest form AIS is a unit fitted to comply with regulation, essentially out of sight and out of mind. While most manufacturers provide a basic unit to address this need, this can be connected to a radar system, or electronic chart, or both. Since 2008 it has been a requirement on SOLAS ships for radar displays to include AIS data.
Instead of having to derive a target’s COG and SOG from own ship’s GNSS data and then the range and bearing to a target by radar, a target sends its own GNSS information. This can be done even when the target is obscured from own ship by an intervening obstruction, such as an offshore installation.
AIS enhances detection in the following areas:
Identifying targets beyond a radar obstruction.
Translating targets to names.
Prediction of target track.
Extend detection range.
Clarification of a target’s intentions.
Although using an AIS input to a radar system may lead to the benefits described above, there are several limitations that could cause uncertainties in the displayed information:
Accuracy of AIS positions - If an AIS target is no longer sending position updates its icon on a radar display will be crossed-off with a flashing line. However, if a target sends out erroneous AIS position updates because of a GNSS problem the other users can only find this out by comparing AIS and radar positions (assuming it is clear which radar and AIS icons are associated with each other).
Target icon consolidation - If a nearby vessel has both an AIS and a radar icon on the screen and the two do not overlap then the radar or ECDIS software will try to decide whether the two separate icons should be replaced with a single consolidated icon and where to place that icon on the screen. The software bases this decision on a comparison of each icon’s range, bearing, relative course and relative speed. If this test is passed then the target’s icons are merged.
Incorporating Rate Of Turn (ROT) - Although there are benefits to making predictions for CPA and TCPA taking into account an approaching vessel’s ROT, the algorithms necessary to resolve the data are not readily available. Until an appropriate algorithm has been developed, once per second re-calculation of ROT-corrected CPA/TCPA of all selected AIS targets will remain impractical. The practical effect of this is that if a target vessel or own vessel is altering course, the vessel must be steady on her new course before reliable CPA and TCPA information is shown to the observer. However this effect is less than the delay in the case of ARPA radar plotted predictions.
3.10.2 Limitations of AIS
Perhaps because of its recent development it is felt there are a number of potential limitations to the use of AIS. It is fair to say that these tend to be connected with both the man/machine interface as well as with technology itself and may culminate with the possibility of OOWs becoming over reliant on the outputs:
AIS is a 'cooperative' system needing proper installation, maintenance and operation whereas radar is 'non-cooperative', i.e., it does not require actions or activities on another vessel to enable detection to take place.

35
AIS does not enable the integrity of the information provided by the transmitting vessel to be verified by the recipient. AIS plots are based on 'real time' information derived from sensors of the transmitting vessel whereas radar plots are based on historical information with verifiable accuracy.
AIS equipment failure on a transmitting vessel would prevent the display of information on the recipient vessel.
Not all vessels are, or will be, required to be fitted with AIS and so will not be 'visible' to the system.
There is the potential for a mismatch between the AIS and radar information if the latter is being operated in ‘sea stabilised’ relative motion; a display and operating mode still favoured by a large number of mariners.
The accuracy of the AIS output information is dependent on the accuracy of the underlying sub-systems such as GNSS. Sensor incompatibility can also result in AIS data being inaccurate and VHF interference or other radio frequency interference can attenuate AIS signals.
AIS uses GNSS time for the regulation of the message time slots and not just for positional information. Should GNSS become inoperable then the system will cease to function.
Manually input data, some permanently stored and other periodically updated by ship’s personnel, can provide erroneous information through errors either while be ing manually input or by the failure to update voyage information as necessary. ETA, draught, port and cargo information usually suffers from a relatively high error rate, for example.
Vessels that are disabled or not under command may not transmit a signal and debris or other floating objects would be invisible to the AIS.
Existing AIS systems have a finite number of time slots, and hence reduces the number of messages that can be handled simultaneously, and in busy areas it may be necessary to selectively curtail certain messages.
Since AIS reports can be often lost or missing, the matching of AIS and ARPA targets can sometimes be very difficult for radar operators in crowded waters. From the view of coastal surveillance, missing AIS messages will make the collision assessment invalid as missing or lost data can reduce the accuracy of the trajectory restored. Reliance on AIS data can therefore be an issue.
3.10.3 Conclusion
Overall, AIS is still an emerging technology. It enhances collision avoidance and traffic management and has potential for further enhancement of maritime safety. Though it has been mandatory for most shipping for over a decade further development of technology and practices of seaman will be required for all the potential benefits, outlined in Section 3.10.1, to become readily available
AIS should ideally be seen as a compliment to radar for anti-collision operations, both radar/ARPA and AIS have strengths and deficiencies and together they have the potential to significantly improve an OOWs ability to anticipate and avoid potential collisions. In terms of ERRV on the UKCS there will undoubtedly be benefits from the introduction of AIS; anticipation will be improved primarily by AIS’ extended range, its capability to see beyond an obstruction and by improving target’s path predictions. Early warning of possible encroachment of safety zones and improvements to intervention strategies will be possible by being clearly able to identify targets for communication purposes via VHF or instant messaging.

36
4 HYBRID DETECTION AND MONITORING SYSTEMS
These hybrid radar systems provide a PC-based display for radar and ARPA that can be an integral part of a PC-based bridge and provide a networked display and control capability. It comprises of a radar interface unit, scan converter card and management processor that can be distributed to multiple displays via a network server and control and operation of the radar and ARPA is available at each display. Generally, there are two kinds of information provided by a hybrid radar system. One is radar images, and the other is ARPA messages with information on the tracked targets. ARPA messages are obtained from radar images in accordance with specific algorithms. In most radar systems, such algorithms are based on a so-called αβ filter, which is a simplified form of the Kalman filter. ARPA messages are encoded in text form for transmission to other displays.
Presently, more and more radar systems are capable of providing such hybrid service as discussed previously. Hybrid radar systems provide radar images and ARPA texts through networks to ECDIS or PCs. However, all these hybrid radar services are encrypted to ensure that radar images can only be obtained by the terminals from the same manufactures or authorised software programs, since the IMO has never published any regulations regarding the exchanging of radar images through networks.
The information of these displays can be now be supplemented by AIS information (see Section 3) and can be integrated with visual Closed Circuit Television (CCTV) systems. CCTV systems are not currently reliably useful in a seagoing environment as they rely on motion senses, but they can be integrated with the radar/AIS based detection so they are pointed and focussed on any object that has alarmed the system, potentially enabling a faster and more accurate assessment of the situation. The state of imaging technology is reviewed in Section 5.
4.1 PURPOSE
These systems were first introduced in 1997 to facilitate ERRV sharing between installations and as a means of improving the time it takes to detect personnel in the water. These systems enable an ERRV to be located further from a manned installation or elsewhere in the field and still meet the rescue and recovery performance standards.
4.2 SCOPE
The systems typically comprise several elements, with the main systems located on the offshore assets and track/record the movement of all vessels within a specified radius of the installations. Radar track data is transmitted via a network to screens on the installation, ERRV, its daughter craft and any other vessels dedicated to offshore installation. The information displayed on these screens is superimposed on to electronic charts to give a composite view of all marine activities. On receipt of a signal from an activated Personal Locator Beacon (PLB), information on course to steer, estimated arrival time, man overboard drift and estimated pick-up point are displayed. The system is also used for collision warning purposes, tracking all vessels within radar range; course, speed, CPA and TCPA of a vessel are displayed on the screen. AIS derived information can also be added to the display.
Transponder units are located on each platform to provide a signal to the ERRV for activities being carried out on, or within 500m of these installations. It raises an audible alarm in the installation control room and transmits the signal to the main system and the ERRV. This provides a common target identification number or letters between ERRV and the installation. These units are generally permanently fitted on the installation. However, portable transponders should be available should the fixed unit fail.
A homing direction finder is located on each daughter craft and ERRVs. This listens for the PLB alarm signal and, should one be received, the direction finder locks onto and homes in on the activated PLB or strongest signal with multiple alarms. The rescue craft can then be directed to the alarm location.
37
Personnel are issued with PLBs in situations where it is conceivable that they may require rescue from the water such as, during NUI operations, helicopter operations and over- the-side work. PLB alarm test modules are fitted at the heliport and main complexes to test PLBs before they are issued.
4.3 OPERATING PARAMETERS
For the system to work as designed, all components must be functioning. The main systems on installations, NUI transponders and ERRV are switched on at all times. NUI transponders can be switched into and out of 'Guard Mode' remotely when a NUI is not manned, but are switched into Guard prior to the arrival of a helicopter in order to detect a helicopter ditching in the vicinity of an installation.
PLBs are armed at all times when worn i.e., during over-the-side work, helicopter travel and all satellite operations. They are disarmed when stored or transported by helicopter under the responsibility of the Helicopter Landing Office.
4.4 OPERATING CONSIDERATIONS FOLLOWING SYSTEM MALFUNCTION
A number of conditions have been identified that may lead to system performance degradation. The nature of these conditions and the actions to mitigate their impact have been defined.
4.5 SYSTEM MAINTENANCE
A maintenance contract with the equipment manufacturer is in place to ensure the reliability and availability of the system and its components. There is the facility for remote interrogation of the system to determine its status and this is carried out weekly by the manufacturer and a report is made to the Duty Holder. Faults are rectified as soon as practicable and operating restrictions are put in place until the system is functioning correctly. Faults on the ERRV are reported and arrangements made for their repair by the manufacturer when the vessel is in port.
4.6 TRAINING
All persons using the equipment are suitably trained. This includes personnel with access to screens on the installations, persons who may have cause to make adjustments to the platform based equipment and persons using the equipment on vessels.
4.7 RELIEF VESSELS
If a relief vessel is deployed without the equipment it may have to operate with a reduced guard zone and may not be able to detect errant vessels as effectively.
4.8 MOBILE INSTALLATIONS
Any mobile unit in the area can also be fitted with a transponder to allow the system to work at optimum efficiency. The co-ordinates of drilling rigs and other mobile units employed by the Duty Holder in areas covered by the system are entered once it is on location to enable early warning of potentially errant vessels.
4.9 INSTALLATION ISSUES
Ergonomically it is important that equipment for such systems is appropriately sited on an ERRV’s bridge. In many cases bulkhead and shelf space is at a premium and, particularly with retrofit equipment, all the best vantage points have already been allocated to other pieces of equipment. The changing nature of maritime regulations ensures equipment is fitted intermittently over the years with speed and ease of installation being the prime mover in siting decisions rather than positioning so that operator performance is enhanced rather than diminished. There is also the possibility of poorly sited

38
equipment causing or receiving interference to other equipment.
There also can be issues in the location of radar aerials on offshore installations. As on ships they should be installed with a 360 degree field of view, accessible for maintenance and away from wires and ropes which could impede the rotation. They must also be situated away from sites where human personnel might work as there is a radiation hazard and because of the high voltages in traditional marine voltages, it must also be kept away from hazardous substances such as gas and oil. On many offshore installations this can be difficult to achieve with just one aerial, so two aerials on one installation are not unusual. If the potential for contact with oil and gas is high then the aerials can be located in Glass Reinforced Plastic (GRP) domes that are pressurised by compressed air. If the air pressure fails, the electrical supply to the aerial is automatically turned off.

39
5 ALTERNATIVE TECHNOLOGIES
There are other technologies that can already, or could in the future, be utilised for the purposes of detecting and monitoring collision threats to platforms.
5.1 Laser Systems
These systems are often referred to as LIDAR and they have been fitted to many forms of transport including the autonomous cars. The principle is the same as traditional radar with the analysis of the returns from a radar beam, but the radio frequency used is in the visible light range. The laser energy is able to penetrate water up to about 30metres which in the marine world makes it suitable for high speed, low cost chart surveying (usually from aircraft) and similar applications such detecting mines underwater and even oil spills. However collision from floating objects is the concern of this paper and there are effective systems available for detecting surface craft. Like radar it can be affected by fog and rain, but it may be less affected. Coherent LIDAR technology (using the same principles as in radar, see Section 2.7) can be employed to provide additional information on the target. There is no technological reason why this might not supplement or replace radar systems in the future. Researchers into unmanned ships are currently investigating the technology.
5.2 Sonic Systems
Marine vessels have been using echo sounders to detect depth of water and fish for many decades. Sonar was first developed in WW1 for detecting submarines. This still is the system for detecting underwater hazards but the technology is inherently less effective above the water for detecting targets than systems such as LIDAR and RADAR, because sound waves have a low frequency and low velocity and are therefore more prone to irregular paths through the atmosphere.
5.3 Visual Target Detection
The original method of target detection is the human eyeball and this will still be available on the ERRV. This can be now be aided by image intensifiers and thermal imaging. These three methods do not give an accurate assessment of the range of the target only bearing so they are good for detection but less so for monitoring and a thorough automatic assessment of the collision threat. The two technologies can be adapted for unmanned watch keeping with an alarm system, but again the lack of availability of a precise range would be a limitation.
Image Intensifiers:
This technology magnifies the received available light so that objects can be detected. Claims of 40,000 times light intensification are made, so that objects can be observed in very low light conditions. This was the first optical technology developed for night time use and it is the cheapest.
Thermal Imaging:
Thermal imaging is a superior technology than image intensification which detects infra-red emissions from targets. Even small objects like floating logs emit different infra-red signatures and the technology works over a surprisingly long range, with the added advantage that it works when there is no visible light at all. In better quality models the results can appear like a good black and white photograph. The thermal image can however be blocked or degraded by rain or fog between target and observer.
In summary, alternative technologies for the automatic detection of targets are likely to become available. Interestingly all have some kind of performance reduction in rain and fog.

40
6 DISCUSSION
During this research, a number of points became apparent. The following is a list of topics that is deemed worthy of note; some make comparisons between issues to do with the performance of different radar systems whereas others comment on how new technology may be used in the future and the possibility of amending operating procedures to minimise the risk of ship/platform collisions.
Recent statistics show that the threat is not just from non-field but also from vessels associated with work of the offshore field.
Shipborne radar developed around the concept of providing a positional overview around the vessel carrying the radar and IMO performance standards still refer to this. Providing collision risk warning for installations on the UKCS based on ERRV radar extends this premise beyond the current performance standards. Given the possibility of ‘shadow’ areas the extent to which the ERRV can provide warning of potential collision for the offshore installations is likely to be less accurate and reliable than if the installation was fitted with similar radar(s) itself and was keeping its own watch. Not all shipborne radar has the ability to set alarms around installation as opposed to the vessel itself. Where multiple installations are being guarded by one ERRV the level of watch keeping required on the ERRV is compounded.
With a slight enhancement due to atmospheric refraction the radar horizon is approximately proportional to the height of the scanner. It follows, therefore, that scanners sited at a greater height above sea level, such as is possible when they are placed on an installation, will be able to detect approaching targets at a greater range than if the aerials can be sited at a higher height than an ERRV. This hypothesis assumes at other conditions such as the size, shape and material of the target lend themselves to detection at such ranges.
As well as being able to maximise the height of eye, platform based radar can also be sited to minimise the occurrence of ‘blind’ and/or ‘shadow’ sectors caused by intervening obstructions. This consideration is important not just on the installation where the radar is fitted but, where there are multiple installations in a field, each can be sited on the optimum installation to minimise radar obstructions. Also’ if using multiple aerials’ any ‘blind’ areas from one aerial can be usually be remedied in the siting of another.
The positions recorded by an automated system can self-validate insofar as the previous position confirms the current one and this itself is confirmed by the next one. However, while this is true in theory the results of the data comparison carried out in Appendix 1 indicate that some degree of such validation was occurring for targets that would subsequently be ‘lost’ a short time later. To minimise the tracking of spurious targets it is important to ensure there are no errors in the algorithms for removing false targets.
Despite their best intentions and a high degree of vigilance, ERRV crews have a number of other duties to attend to while on bridge watch and this may mean that the movements of approaching vessels are not fully recorded. The primary activity of ERRV crews is one of safety:
o To minimise the threat to offshore oil and gas installations from approaching vessels.
o To provide close support during periods of overside working.
o To offer a place of safety should evacuation/escape from the installation be required.
Assuming continuous radar observations are being kept on an ERRV it is possible for a watch keeper to monitor a developing situation and the movement of the vessels involved, as well as being aware of operational factors on the threatened installation. This overview position, supplemented by other background information as appropriate, will assist the decision making process and lead to quicker and better informed initiation of intervention strategies. On a purely automated system the radar alarm would need to be activated, personnel summoned and contact with the errant vessel attempted all

41
before the seriousness of the incident could be assessed and possibly escalated. However, with the best will in the world it is extremely unlikely that ERRV watch keepers will be able to devote their entire attention to radar monitoring duties. At best it is more like ly that an ERRV’s radar will be inspected no more frequently than every few minutes, at least until an approaching collision risk becomes apparent. Radar detection is likely to be impaired by the ERRV’s close proximity to an installation leading to increased or modified blind/shadow sectors (refer also to the report included in Appendix 2).
It is suggested that a manned radar watch will be less likely to lead to false alarms because in many cases a visual lookout can confirm whether a threatening target is a bona fide vessel and, if it is, what the nature of the threat may be. For instance, a fishing vessel that has been working in the area for several hours and has already been in contact with the ERRV to discuss intentions, may temporarily breach a radar’s guard zone (but not the 500m safety zone) but ideally it should not be triggering an alarm. Conversely, in an automated system, the ability to downgrade a threat because of ‘background’ information is more difficult to achieve with any degree of safeguards – a guard zone breached is a guard zone breached and results in an alarm. Thereafter, a decision needs to be made about the appropriate response. Visual lookout becomes less of a benefit in certain environmental conditions; fog or possibly other adverse weather conditions, such as, snow, mist or haze all diminish visibility while leaving radar visibility relatively unaffected. Rain, especially when heavy, affects both visual and radar visibility and under these conditions a radar watch may become more difficult, requiring particularly close attention. While algorithms may be developed to minimise the effect of all environmental phenomena it is felt that it is difficult to produce a ‘one size fits all’ approach without eroding some of the safeguards.
Given the remoteness of hybrid radar system equipment, both far from shore and in largely inaccessible areas of an installation, and the harsh environmental conditions in which it operates, may mean that service and maintenance considerations are particularly important, although less than older times. Automation in tuning and other radar settings means the benefit from having a manual radar observer is less now than previous, but there still will be spurious targets and alarms (see Appendix 1). There is also the need for an offshore installation’s maintenance regime to take account of the logistics of fitting and maintenance strategy of a hybrid radar system, especially as it is a safety critical item. Automated data acquisition and recording permits archiving and, if circumstances warrant it, interrogation and reconstruction of events. Such a facility may prove to be useful if an errant vessel incident occurs and a contemporaneous and comprehensive data set is required for investigation.
Effective detection, plotting and collision risk assessment using conventional ERRV based radar requires a high degree of diligence from watch keeping officers both to detect an approaching vessel, or vessels, initially and to monitor their movements until finally past and clear of the installation. From a human factors perspective a great deal of work has already been done into ‘task overload’, which in terms of this study would be the effects of the ERRV OOW having to monitor and control several conflicting duties simultaneously. Areas that may merit further study in terms of human factors are the choices of radar display available to radar watch keepers, i.e., true or relative motion, sea or ground stabilised, etc., and what may prompt the choice of one display over another.
Based on this work, it is suggested that an installation sited hybrid radar system be used as a complementary and integrated tool for both ERRV crews and an installation. They can provide an automated early warning of vessels approaching multiple installat ions in a field while at the same time helping crews with the decision making and prioritisation process. The adoption of such a ‘hybrid’ systems already occurs at several fields on the UKCS.
Radar has been improved significantly over the past decade and automatic systems can be developed which can detect targets as reliably as a human operator, but further work is required so that smaller and weaker targets can be detected. Further work (perhaps using artificial intelligence techniques) is also required so that vessels which are part of the offshore assets can also be identified and monitored for potentially dangerous behaviour in addition to the usual alarms for passing non field traffic. Coherent radar techniques offers more potential for further development on this issue than traditional

42
incoherent radar.
The Hybrid systems which have multiple sensors will have more efficiency and reliability of detection and monitoring off vessels associated with field and non-field vessels. The inclusion of AIS and visual aids such as CCTV offer additional functionality and information to assist both ERRV and the installation when incidents occur. Other technologies such as thermal imaging and LIDAR may also be of benefit, in cost-effective terms, in the future as technologies advance. Modern computing power combined with artificial intelligence techniques should allow a degree of automation of the monitoring of multiple sensor types to reduce the number of false alarms and increase the reliability of detecting a real threat, from both the field associated vessels as well as passing traffic.
Many government departments/agencies (harbour or port authorities) have established VTS that typically use radars, closed-circuit television systems, VHF radiotelephony and AIS to keep track of vessel movements, providing navigational messages to vessels in limited geographical areas. In fact, VTS centres are also information exchanging centres between ships and the shore. The key responsibilities of a VTS centre mainly include traffic flow optimisation and situation awareness for ship operators. This may be to advantage to offshore assets which are in the coverage of a VTS area.

43
BIBLIOGRAPHY
1 Bole A., Wall A.D., Norris A., Radar & ARPA manual, Elsevier, December 2013 (ISBN 978-0-08-097752-2).
2 Dai L., Ehlers S, Rausand M and Utne IB., “Safety indicators for the marine operations in the installation and operating phase of an offshore wind farm”, Reliability Engineering & System Safety, Vol.109, 2013, 18-31.
3 Denbridge Marine, https://www.denbridgemarine.com/, 2018.
4 DNV GL, The Worldwide Offshore Accident Databank (WOAD), http://www.offshore-technology.com/, Oslo, Norway, Det Norske Veritas - Germainscher Lloyd, 2017.
5 HSE, Ship/Platform Collision Incident Database (2001), RR 053, JK Robson – MaTSU, 2003.
6 HSE, Ship/Platform Collision incident Database (2015), RR1154, S. Loughney, J. Wang, A. Wall – Liverpool John Moores university, 2018.
7 HSE, Overview of collision detection in the UKCS, RR514, HSE Books, 2006.
8 HSE, Reporting of Injuries, Diseases and Dangerous Occurrences Regulations (RIDDOR) Database 2001/02-2014/15, UK, Dec. 2016.
9 IMO, Performance Standards for Shipborne Radio communications and Navigational Equipment, Fourth Edition, page II/3.1(a)/1, 2002, International Maritime Organization, ISBN 92-801-5139-8.
10 Kelvin Hughes, Offshore radar, https://www.kelvinhughes.com/maritime/offshore-radar, 2018.
11 Klein Marine systems, http://kleinmarinesystems.com/products/maritime/, 2018
12 Ma, F., Chen, Y. W., Huang, Z. C., Yan, X. P., Wang, J., “A novel approach of collision assessment for coastal radar surveillance”, Reliability Engineering & System Safety, Vol.155, 2016, 179-195.
13 Sang L.Z., Wall A., Mao Z., Yan X.P., Wang J., “A novel method for restoring inland ship’s trajectory by using AIS data”, Ocean Engineering, Vol.1110, 2015, 183-194.
14 Sang L.Z., Yan X.P., Wall A., Wang J., Mao Z., “CPA Calculation Method based on AIS Position Prediction”, Journal of Navigation, Vol.69, 2016, 1409–1426.
15 Transas, Offshore Solutions, Offshore Monitoring Solution: Monitoring and surveillance of offshore platforms and subsea installations. (2017) Date Accessed: 28/02/2018 [URL: http://www.transas.com/products/vtms/offshore-monitoring-solutions/TOMS].

44
APPENDIX 1: COMPARISON OF REWS AND ERRV GATHERED DATA
CONTENTS
Part 1 Overview
Part 2 Notes on Data Comparison
Part 3 Data Comparison Methodology
Part 3.1 REWS Data Confidence
Part 3.2 Positional Comparison
Part 4 Traffic Routes Around Ravenspurn Bravo
Part 5 Data Comparison Discussion

45
PART 1 OVERVIEW
As a prelude to this study HSE commissioned a project to collect and compare two data sets that purported to refer to the same events. Over a period of approximately one month in early 2000 a Safe Marine Ltd.’s (now SML Technologies Ltd.) REWS automatically collected radar data of vesse ls in the vicinity of the Ravenspurn Bravo platform in the SNS. Simultaneously, OOWs on the ERRV “Putford Worker” manually recorded date/time, radar bearing, range and CPA information, together with a number of other parameters, from passing vessels at the time they were first detected on the vessel’s radar.
Both data sets were analysed by BOMEL Limited on behalf of the HSE and a final report (C828\01\169R REV A – June 2001) was produced. The report contained a number of conclusions highlighting the difficulty of reconciling the two data sets because of an apparent shift of approximately 20 minutes between positions recorded by the two sources.
At HSE’s request we reassessed the raw data from first principles for both sources to attempt to clarify whether there was a consistent time shift between data sources and, if one was found to exist, why this may be so.

46
PART 2 NOTES ON DATA COMPARISON
Before explaining how the data were analysed and what the outcomes were it is considered prudent to note a number of observations:
The ERRV data records both the vessel’s and target’s position (latitude/longitude) at the time when first detected. Simultaneously, the ERRV’s range/bearing to Ravenspurn Bravo was also recorded as was the target’s course, speed and CPA. However, it is not clear from the data we had access to whether the CPA referred to the target’s minimum distance away from Ravenspurn Bravo or the installation named in the record sheet, which in many cases was different (only 7 of 340 records referred to Ravenspurn Bravo).
The processed REWS data records details of each target detected with respect only to the Ravenspurn Bravo, i.e., the range/bearing/heading of the target at CPA, the range from the installation when it was first detected and lost.
The different bases upon which the data were recorded makes simple positional comparison at a fixed time impossible unless the CPA occurred at the same time as the ERRV recorded the position.
Over the whole period for which data were collected there were a total of 593 vessels recorded by the ERRV (between 00:00 on 14 February and 20:00 on 11 March 2000) although it appears data recording was interrupted between 11:45 on 27 February and 06:25 on 29 February 2000.
REWS data recording occurred between 00:00 on 15 February and 23:57 on 14 March 2000 although there appeared to be interruptions between:
o 23:58 on 25 February and 14:21 on 26 February 2000,
o 23:59 on 4 March and 16:26 on 5 March 2000,
o 23:58 on 12 March and 18:18 on 13 March 2000.
Processing of the REWS data recorded as above yielded a total of 6002 records, of which 3218 had a CPA of 12 nm or less.
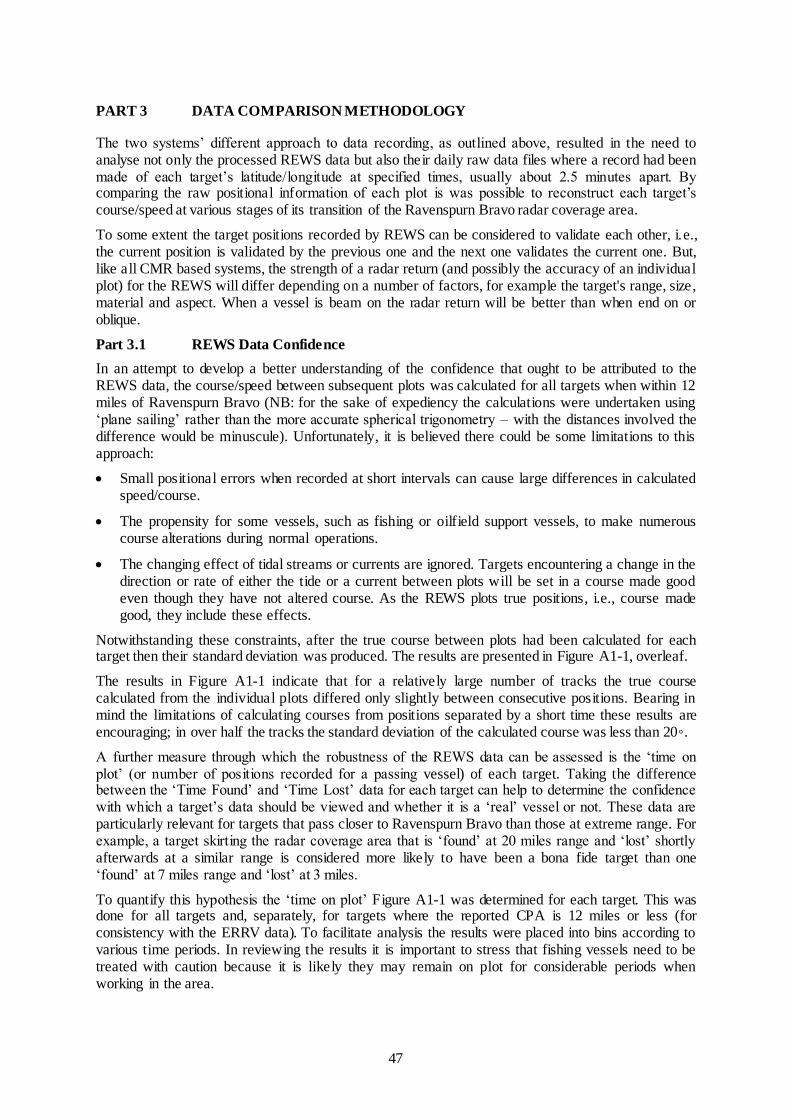
47
PART 3 DATA COMPARISON METHODOLOGY
The two systems’ different approach to data recording, as outlined above, resulted in the need to analyse not only the processed REWS data but also their daily raw data files where a record had been made of each target’s latitude/longitude at specified times, usually about 2.5 minutes apart. By comparing the raw positional information of each plot is was possible to reconstruct each target’s course/speed at various stages of its transition of the Ravenspurn Bravo radar coverage area.
To some extent the target positions recorded by REWS can be considered to validate each other, i.e., the current position is validated by the previous one and the next one validates the current one. But, like all CMR based systems, the strength of a radar return (and possibly the accuracy of an individual plot) for the REWS will differ depending on a number of factors, for example the target's range, size, material and aspect. When a vessel is beam on the radar return will be better than when end on or oblique.
Part 3.1 REWS Data Confidence
In an attempt to develop a better understanding of the confidence that ought to be attributed to the REWS data, the course/speed between subsequent plots was calculated for all targets when within 12 miles of Ravenspurn Bravo (NB: for the sake of expediency the calculations were undertaken using ‘plane sailing’ rather than the more accurate spherical trigonometry – with the distances involved the difference would be minuscule). Unfortunately, it is believed there could be some limitations to this approach:
Small positional errors when recorded at short intervals can cause large differences in calculated speed/course.
The propensity for some vessels, such as fishing or oilfield support vessels, to make numerous course alterations during normal operations.
The changing effect of tidal streams or currents are ignored. Targets encountering a change in the direction or rate of either the tide or a current between plots will be set in a course made good even though they have not altered course. As the REWS plots true positions, i.e., course made good, they include these effects.
Notwithstanding these constraints, after the true course between plots had been calculated for each target then their standard deviation was produced. The results are presented in Figure A1-1, overleaf.
The results in Figure A1-1 indicate that for a relatively large number of tracks the true course calculated from the individual plots differed only slightly between consecutive positions. Bearing in mind the limitations of calculating courses from positions separated by a short time these results are encouraging; in over half the tracks the standard deviation of the calculated course was less than 20◦.
A further measure through which the robustness of the REWS data can be assessed is the ‘time on plot’ (or number of positions recorded for a passing vessel) of each target. Taking the difference between the ‘Time Found’ and ‘Time Lost’ data for each target can help to determine the confidence with which a target’s data should be viewed and whether it is a ‘real’ vessel or not. These data are particularly relevant for targets that pass closer to Ravenspurn Bravo than those at extreme range. For example, a target skirting the radar coverage area that is ‘found’ at 20 miles range and ‘lost’ shortly afterwards at a similar range is considered more likely to have been a bona fide target than one ‘found’ at 7 miles range and ‘lost’ at 3 miles.
To quantify this hypothesis the ‘time on plot’ Figure A1-1 was determined for each target. This was done for all targets and, separately, for targets where the reported CPA is 12 miles or less (for consistency with the ERRV data). To facilitate analysis the results were placed into bins according to various time periods. In reviewing the results it is important to stress that fishing vessels need to be treated with caution because it is likely they may remain on plot for considerable periods when working in the area.
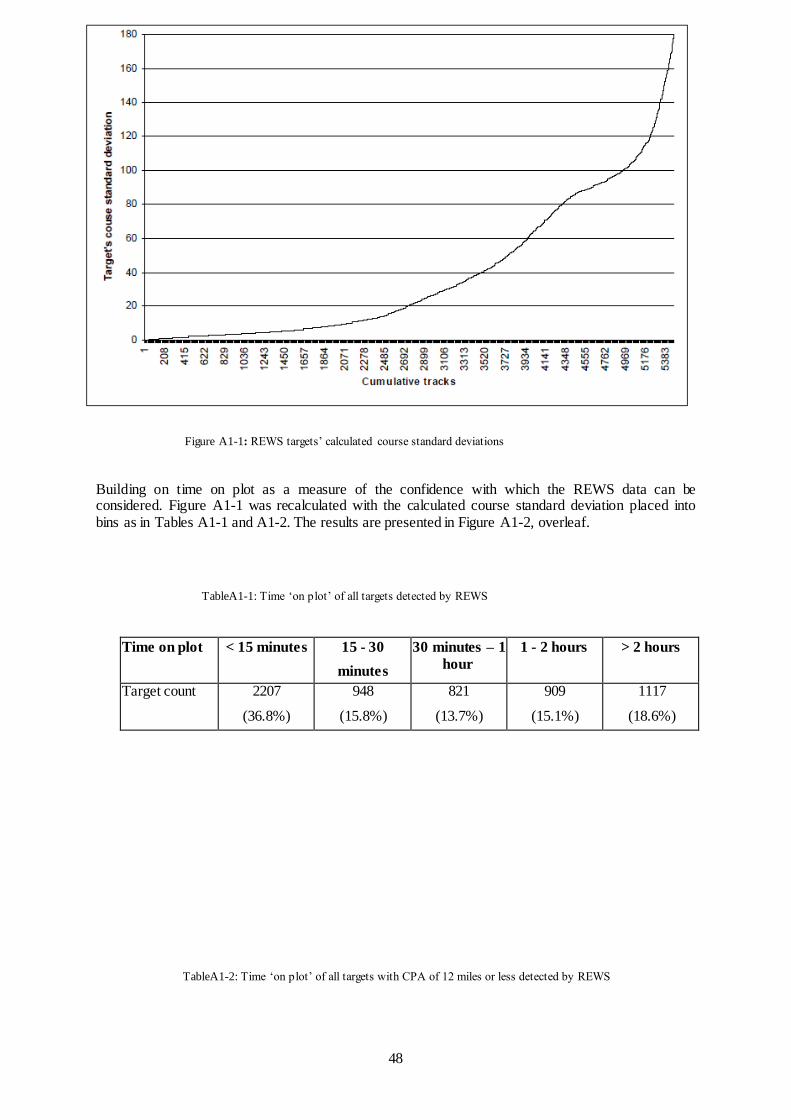
48
Figure A1-1: REWS targets’ calculated course standard deviations
Building on time on plot as a measure of the confidence with which the REWS data can be considered. Figure A1-1 was recalculated with the calculated course standard deviation placed into bins as in Tables A1-1 and A1-2. The results are presented in Figure A1-2, overleaf.
TableA1-1: Time ‘on plot’ of all targets detected by REWS
Time on plot < 15 minutes 15 - 30
minutes
30 minutes – 1
hour
1 - 2 hours > 2 hours
Target count 2207
(36.8%)
948
(15.8%)
821
(13.7%)
909
(15.1%)
1117
(18.6%)
TableA1-2: Time ‘on plot’ of all targets with CPA of 12 miles or less detected by REWS

49
CPA less than Cumulative Time on plot (cumulative)
(miles) target count < 15 minutes 15 - 30
minutes
30 minutes –
1 hour
1 - 2 hours > 2 hours
1 29 19 3 2 0 5
65.5% 10.3% 6.9% 0.0% 17.2%
2 110 69 5 7 7 22
62.7% 4.5% 6.4% 6.4% 20.0%
3 319 169 33 28 22 67
53.0% 10.3% 8.8% 6.9% 21.0%
4 647 292 90 62 65 138
45.1% 13.9% 9.6% 10.0% 21.3%
5 1114 415 183 139 131 248
37.3% 16.4% 12.5% 11.8% 22.3%
6 1879 641 346 262 245 391
34.1% 18.4% 13.9% 13.0% 20.8%
7 2242 744 424 317 289 475
33.2% 18.9% 14.1% 12.9% 21.2%
8 2414 785 436 328 315 557
32.5% 18.1% 13.6% 13.0% 23.1%
9 2592 819 453 349 353 626
31.6% 17.5% 13.5% 13.6% 24.2%
10 2773 841 471 379 407 684
30.3% 17.0% 13.7% 14.7% 24.7%
11 2980 878 494 412 447 758
29.5% 16.6% 13.8% 15.0% 25.4%
12 3218 935 536 459 476 812
29.1% 16.7% 14.3% 14.8% 25.2%
Figure A1-2: REWS targets’ calculated course standard deviations for ‘time on plot’ bins

50
The results of Figure A1-2 are less encouraging insofar as a large proportion of the tracks where the calculated course standard deviation was small occurred for targets with a ‘time on plot’ of less than 15 minutes. Perhaps this is to be expected because there are fewer plots and therefore less likelihood of the calculated courses being very different.
In explanation of Table A1-2, the REWS data indicates that 319 recorded targets had a CPA of less than 3 miles yet, of these, 169 (53.0%) were tracked for less than 15 minutes. This is considered to be unlikely for bona fide vessels because in that time a vessel steaming at 15 knots would cover 3.75 miles; if half this distance is covered before CPA and half after it would mean the range found would be only 3.5 miles. The performance and target acquisition of most CMR could be expected to exceed this in the majority of cases.
It is noteworthy that for each CPA listed in Table A1-2 the largest proportion of targets were ‘on plot’ for less than 15 minutes and up to 3 miles CPA these were in the majority. Also of note is that for each CPA the second largest proportion of targets were recorded for over 2 hours, possibly indicating them to be either slow moving fishing vessels operating close to Ravenspurn Bravo or larger merchant vessels transiting the area.
To place Table A1-2 in context, for a vessel to have a CPA of 12 miles would require it to have been within the area of radar coverage (25 miles radius of Ravenspurn Bravo) for least 2 hours 56 minutes assuming it:
Was detected immediately on entering the coverage area and remained on plot until clearing the area.
Had an average speed of 15 knots.
Maintained a steady course.
Obviously, vessels detected and lost at ranges of less than 12 miles will have shorter times on plot, as will those steaming at a higher speed, but the data in Table A1-2 begs the question of why there are apparently large numbers of vessels that passed relatively close to the installation yet very few were recorded by the ERRV.
A slightly worrying interpretation of the data and a possible explanation for the results of Table A1-2 is the large number of targets with a small CPA yet a short time between acquisition and loss. This
51
indicates either they were not detected until relatively close to Ravenspurn Bravo or, more likely, they were false or spurious targets. Although a difficult and somewhat imprecise exercise, from our analysis of the data it is suggested that as many as 1300 (21.7%) recorded targets were not bona fide vessels.
Part 3.2 Positional Comparison
Bearing in mind the contents of Part 3.1 and the confidence with which some of the REWS data should be viewed, a comparison was made between the target’s position recorded by the ERRV and those recorded by REWS.
From the early stages of this activity it became apparent that it would not result in ‘absolute’ data matches. Both the ERRV and REWS equipment is subject to permitted tolerances in performance standards and any errors in external sensory input, for example GPS or time keeping differences, could compound any discrepancies between data recorded by the two sources.
To minimise the effects of the equipment’s shortcomings and produce the best attempt at data
of the 593 positions reported by the ERRV (NB: 1 minute difference of longitude at 54o latitude =0.59
nm, therefore the ‘box’ was rectangular having sides of 2 nm and ends of approximately 1.2 nm; an area of 2.4 nm). The whole area within the box was then compared with positions recorded by the
the time reported by the ERRV were used1.
As the REWS data comprises a series of positions that when combined make up a track for each target, using this method it was possible to identify which REWS targets were closest to the position reported by the ERRV at a similar time.
A total of 2365 target positions were recorded by REWS that fell within the ‘box’ around the position
for 419 ERRV records, i.e., 174 ERRV target reports could not be verified by their proximity and timing with a corresponding REWS target. Also of note is that the 419 ERRV records matched with a total of 560 REWS tracks, meaning that in some cases there were multiple tracks being recorded by REWS where a vessel’s position fell within the ‘box’ and time window:
58 occurrences of 2 tracks
14 occurrences of 3 tracks
5 occurrences of 4 tracks
2 occurrences of 5 tracks
5 occurrences of 6 tracks
1 occurrence of 8 tracks
1 Departure = Difference of longitude x Cosine latitude
52
Although multiple tracks makes systematic positional comparison more difficult and could lead to errors in interpretation, by further comparing the target’s course/speed as recorded by the ERRV with that calculated from the REWS data it was possible to remove much of the ambiguity.
o also increased the number of multiple REWS targets identified and made comparison less accurate so was not pursued.
To check the consistency of the ‘matched’ ERRV and REWS positions (albeit with a difference in the time of the positions in many cases) all matched REWS positions were plotted on a scatter chart along with the ERRV’s recorded target position. The scatter graph is based on the target’s position reported by the ERRV being at the origin and the point on the chart being the position recorded by REWS. This methodology applies to all the 417 targets that a match could be obtained for.
There are very few apparent trends in the results of Figure A1-3, perhaps there are slightly more targets in the south-west quadrant although the data are generally inconclusive. This indicates there was no bias or consistent errors in the positional differences as perhaps may have been the case if either the REWS, or ERRV, or both sets of equipment had defects that manifested itself in one range of azimuth.
As explained, the points represented in Figure A1-3 indicate the relative positions recorded by the
Further analysis was then carried out to compare the timing of the records. The results in Figure A1-4 compare the time reported by the ERRV with that recorded by REWS at the time of the match for each of the 417 targets where a match was possible.
Points beneath the x axis, of which there are 65, indicate that the time of the matching position was recorded by the REWS before that of the ERRV whereas the points above the axis indicate the reverse. The data indicate that in the majority of cases the ERRV’s position was recorded between 10 and 30 minutes before that of the REWS with a preponderance of these suffering an approximate 20 minutes time shift. No explanation for the time difference could be found; whether it was due an error in the ship’s time being kept by the ERRV, an error in the internal clock mechanism of the REWS or some other unexplained reason.
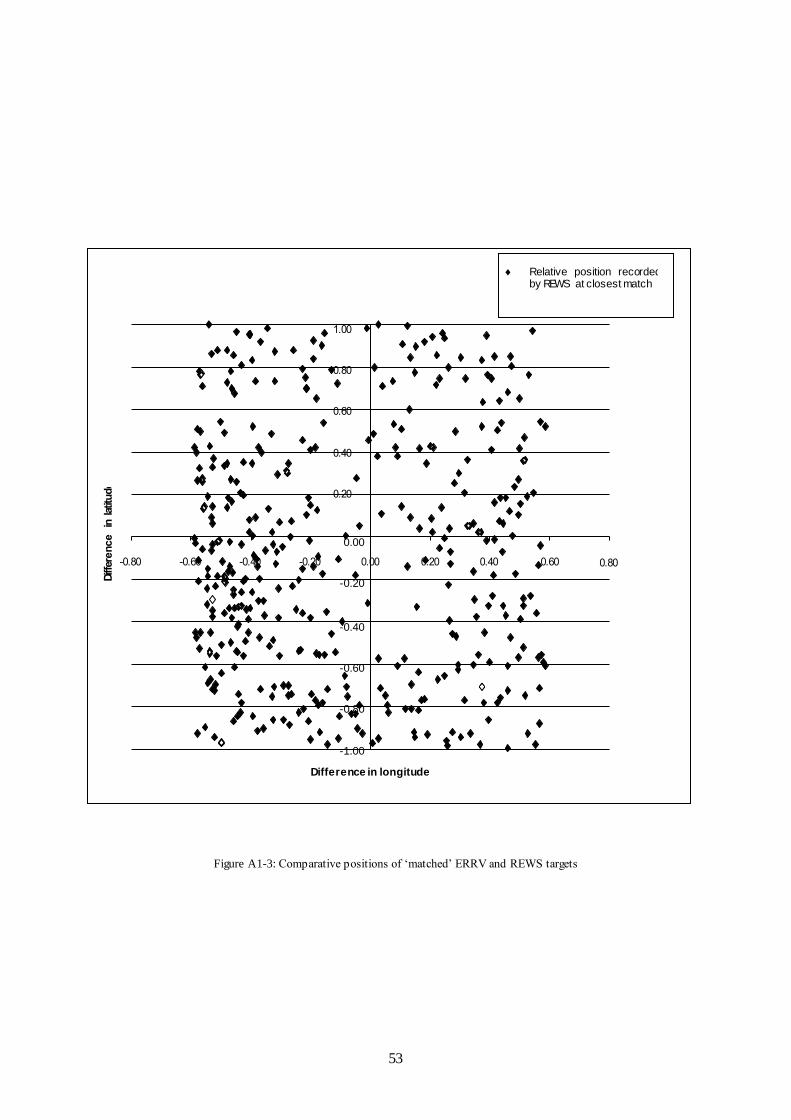
53
Figure A1-3: Comparative positions of ‘matched’ ERRV and REWS targets
Relative position recorded by REWS at closest match
0.00
-0.20
-0.40
-0.60
-0.80
-1.00
Difference in longitude

54
Figure A1-4: Time difference between ERRV and REWS records at position match
Figure A1-4 does not indicate whether the REWS or ERRV first detected the target before the other, simply the time of the closest position match there was a difference in the time recorded. However, having identified those REWS tracks that match vessels reported by the ERRV in 417 instances it was possible to calculate how many, and by how much, were first recorded by the REWS. The ‘time found’ information was compared with the time recorded by the ERRV to produce Figure A1-5, overleaf. To place the chart in context it is important to bear the following in mind:
Under any circumstances a ‘time shift’ between the REWS and ERRV positions is acknowledged – this could have an influence on the data used to produce Figure A1-5 and may cause a number of targets to classified in columns to the left of where they should be.
The REWS system has a greater height of eye and therefore could normally be expected to detect targets earlier than a radar placed on an ERRV.
REWS is an automatic system rather than one relying on a human observer who, for much of the time, has other duties to attend to. The effect of this is that the records kept by the ERRV refer to the time when a target was first noticed by the radar observer rather than when it was first detected by the equipment. Depending on the frequency with which the observer is able to visit the radar the delay will be both indeterminate and inconsistent.

55
Figure A1-5: Time difference between ERRV record and ‘time found’ by REWS
Bearing in mind the limitations and constraints outlined above, i.e., some of the records in the left hand column (‘Detected by ERRV first’) should probably be moved to the right with a consequent knock-on of some records in columns two and three also being shifted to the right, Figure A1-5 demonstrates that, in general, the REWS detected targets before the ERRV. This is only to be expected for the reasons stated.
PART 4 TRAFFIC ROUTES AROUND RAVENSPURN BRAVO
By utilising the CPA range and bearing recorded by the REWS is possible to determine whether any traffic routes exist in the vicinity of Ravenspurn Bravo. Converting the CPA data from polar to rectangular co-ordinates permits them to be plotted on a scatter graph as in Figure A1-6, overleaf.
The results indicate the existence of frequently travelled routes to the west-north-west (vessels making good north-north-east/south-south-west tracks) and west-south-west (vessels making good north-north-west/south-south-east tracks) of the installation at a range of about twelve miles. Also, less frequented routes possibly exist to the west and south-east of the installation at ranges of 18 and 12 miles, respectively.
Apart from the possible routes mentioned above the remainder of the traffic appears to be much more randomly scattered with no clearly defined routes apparent. However, some of the random scattering may be due to any false or spurious targets recorded by the REWS.
140
120
100
80
60

56
Figure A1-6: Position of REWS targets’ CPA relative to Ravenspurn Bravo
PART 5 DATA COMPARISON DISCUSSION
During the course of our comparison of the REWS and ERRV gathered data a number of observations were made. In and of themselves these possibly have a limited significance though they are considered worthy of note. To place them in context an attempt has been made to explain how or why they have occurred and they affect they may have.
A number of targets reported by the ERRV have a ‘time of first detection’ that is similar to the next or previous report. This is more likely to indicate the time when the radar observer first noticed it rather than the time the target was first acquired by the ERRV’s radar. This is very easy to explain inasmuch as the OOW’s were very probably engaged in other activities and only when they returned to the radar did he notice a new target and record its details from the ARPA.
Within the REWS data the ‘Heading at CPA’ and ‘Bearing at CPA’ information is somewhat unexpected as they are rarely 90 apart, as would normally be the case. As the REWS equipment is on a fixed object the data collected is ‘true’ data as there is no ‘relative’ component caused by a vessel’s movement. The ‘heading’ reported by REWS is not actually the vessel’s heading but rather its true course made good. Tidal stream influences, which cause a difference between a vessel’s course made good (of which the ‘Bearing at CPA’ is a perpendicular) and course steered (which is the heading) can be discounted as the REWS equipment is stationary. If the heading at CPA is not perpendicular to the bearing at CPA then it should be possible to extend or backfit the heading
Bearing and range at CPA
20.00
10.00
-30.00 -20.00 -10.00 0.00
10.00 20.00 30.00
-10.00
-20.00
-30.00
30.00

57
through the reported CPA to determine the correct CPA at some other point along the vessel’s track. Figure A1-7 demonstrates the effect of non-perpendicular ‘heading at CPA’ and ‘bearing at CPA’
Figure A1-7: Effect of non-perpendicular ‘heading at CPA’ and ‘bearing at CPA’
In their report (C828\01\169R REV A – June 2001) Bomel highlighted the apparent ‘spike’ in the number of targets detected at the start of each day and subsequent drop off to more stable levels
shortly afterwards. This, together with our belief that a relatively large percentage of REWS recorded vessels at other times of the day could be attributed to false or spurious targets, leads to the suggestion that proper set up and tuning is very important. This should ensure that all bona fide targets are detected at an adequate range to enable a robust collision risk management strategy to be implemented as well as to minimise the possibility of false alarms from scanty or inaccurate information.
Target ‘range at CPA’ recorded by REWS
Target ‘bearing at CPA’ recorded by REWS
Target ‘heading at CPA’ recorded by REWS
Projected heading
Actual CPA
58
APPENDIX 2: REPORT ON THE PERFORMANCE DEGRADATION OF CIVILIAN MARINE RADAR DUE TO CLOSE BY OBSTACLES
Professor A.K. Brown, Professor P.D.L. Williams
University of Manchester
SUMMARY
The performance of individual Civil Marine Radars (CMR) is usually dependent on the choice
of available Commercial-Off-The-Shelf (COTS) equipment adequate to fulfil its Operational
Requirement (OR), followed by satisfactory installation and inspection with written test results
of how the contractor certifies that the equipment will fulfil the OR. In practice however radar
performance may be degraded by close by obstacles, be they on the ship itself (such as masts)
or close to the ship such as dockside or an object such as an oil rig. In these cases the radar
performance will always be degraded to some extent. This report reviews some of the salient
effects of blockage on fundamental marine radar performance.
59
Contents
1 Introduction
2 A Brief Overview of Civilian Marine Radar
(CMR)
3 The Blockage effect
4 Blockage effect of radar antennas
5 First-hand experience on a large tanker suffering
a 50% reduction of all target detections in a swell period
6 CMRs different types and expected performance
under a selection of scenarios
7 Conclusions and the "The Next Move"
8 Acknowledgements
References
ANNEX 1 Regulations
ANNEX 2 Glossary of Radar Terms

60
PART 1 INTRODUCTION
This report examines the degradation of a CMR by poor sighting of an antenna both in terms of on a particular vessel, coupled to that vessel with respect to a large structure adjacent to it.
A second section touches on further degradation of performance due to both any particular CMR and its non-optimum operation at any one time.
PART 2 A BRIEF OVERVIEW OF CIVILIAN MARINE RADAR (CMR)
Marine radar has two main types, X-band (approximately 3cm operating wavelength) and S-band (approximately 10cm operating wavelength). We note the radar angular resolution from the scanner (that is the ability to distinguish between two targets close in angle) is given approximately by the -3dB beam width from the radar antenna(or aerial)
1. The beam width is directly related to the inverse
of the length of the antenna in terms of wavelength. Modern X-band units have antennas between 7 and 9 ft. giving a beam width of 1 to 0.9 degrees, whereas S-band has an antenna length of 12ft and a beam width of 1.9 degrees. Ships will normally fit both types, while small vessels are limited to the smaller X-band units. X-band radar offers greater resolution and detection of smaller targets, but is more susceptible to interference from rain and sea clutter. CMR S-band ship radar has less interference from rain and sea clutter, normally provides longer range, but has less sensitivity for small targets.
A ship will typically use her X-band unit near to shore or navigational hazards, due to its higher resolution and ability to detect smaller targets. In practice in offshore waters ships will often depend entirely on the S-band unit set to a 24-mile scale. The advantage of S- band in this situation is longer range, less interference from rain, and reduced interference from sea clutter (a factor of about 2½, or -4 dB is commonly quoted)
Another issue is the increasing reliance upon ARPA (Automatic Radar Plotting Aid) aboard ships. These systems automatically capture and track radar targets, and provide a warning to the watch when a close approach is predicted. An ARPA system will only work with targets that are visible on the radar, typically a minimum of three consecutive "hits" is required on the ship’s radar before a blip is acquired as a target. This puts a premium not only on the strength of the return, but also its consistency.
In general no matter how good the radar display electronics, detection is of paramount importance to the radar performance. In practice, the radar ‘view’ is invariably affected by the position of the radar on the ship or by large close objects. This blockage effect and is discussed below.
1 A measure of the width, in angular terms, of the radar beam at the point where the beam is radiating half the
power compared to its peak value

61
PART 3 THE BLOCKAGE EFFECT
When a radar antenna does not have line of sight its performance and ability to “see” a target is diminished. Just how much blockage occurs is a function of how far away the obstruction is and its size (both width and height) with respect to the radar. This is discussed more fully in Section 4.
We note there are a number of issues which need to be considered in the radar siting problem.
A simple ‘line of sight’ approximation gives a crude indication of difficulties, where shadowing from structures might occur, etc. However, the problem in depth is a subtle one. The electromagnetic waves transmitted by the antenna will diffract around obstacles to some degree. Small objects (in wavelength, λ, terms) may be hardly seen by the radar especially when close in. Conversely large objects will produce close to ‘optical’ shadowing effects.
The effects on the radar is not just limited to loss of detection in a shadow sector (although this might be the most serious effect). For example poor sidelobes in a certain angular sector region may also be produced by blocking just part of the antenna aperture - this degrades the resolution of the radar and may be accompanied by loss of gain degrading detection performance.
The radar ‘beam’ is radiated by the antenna and changes with distance from the antenna until it is fully formed then, in free space, it maintains the same angular shape for any more distant range. This fully formed beam is known as the far field radiation pattern of the antenna.
Conventionally, as a good approximation, the far field is given by 2D2/λ where D is the
antenna length. For a 9ft X-band scanner
This equates to a range of 450m, for a 12ft S-band antenna about 250 m. We note that the main beam is essentially formed by about half that distances, with the sidelobes remaining
somewhat high until the 2D2/λ Distance. Blockage has a somewhat different effect in the
antenna near field and far field, with the intermediate range something of a ‘gray area’.
A real siting problem is not just the blockage or otherwise of the antenna. Reflections of large complex metallic objects can be re-reflected off other structures producing false or ‘ghost’ targets. This problem is well known in complex port scenarios and has, for example, been reported as a problem with offshore wind farms.
For these reasons, the detailed computation of blockage and siting effects is complex and tends to be specific to the situation modelled. Modern computational techniques do allow us to look at this problem for specific scenarios. However insight can be gained more generally by looking at published measurements of the problem. The remainder of this current work, therefore, draws on measurements of these effects based on a wide range of siting scenarios

62
PART 4 BLOCKAGE EFFECT OF RADAR ANTENNAS
The earliest known publication to the authors on the subject of radar siting was in 1952 “The use of radar at Sea” (Captain F.J. Wylie, the Royal Institution of Navigation). The last edition was in
1978 and is now out of print. At that time there were few CMRs about and the Decca Type 159
was the foremost.
All these radars had somewhat smaller apertures than today’s radar scanners - either 4ft aperture
or 6ft antennas were typical. Transmitters used 10kW or 20kW peak power; similar to modern
radar, but by today’s standard had poor receivers with noise factors of 20dB or worse. These improvements in the modern radar principally effect the maximum detection range for targets,
with azimuth resolution also somewhat improved. Nonetheless the improved performance of modern radars does not significantly alter the basic effects of blockage introduced by nearby
structures, although quantitatively this is effected by the antenna aperture length so that data must
be used with care. Nonetheless, trends and basic performance problems can be identified from this raw radar information. Basic information, abridged from Reference 1 (with kind permission
of The Royal Institution of Navigation) still gives an extremely useful insight into the blockage
problem.
i) Effects from the Ship’s Superstructure .
Metal objects are opaque to radio waves as noted above, according to their shape and the angle at which the radar beam strikes them the waves will suffer scattering (dispersion), diffraction or reflection but, except for very small objects, the area directly beyond the obstruction will be in shadow. The horizontal width of the shadow depends largely upon the angle which the obstructing object subtends at the radar antenna in the horizontal plane, that is to say, the width of the obstruction and its distance.
The word “shadow” is used deliberately to suggest that is the area beyond the obstruction there will be a reduction in the intensity of the beam but not necessarily a complete cut off. If the angle subtended at the radar is more than a degree or so (depending on the antenna length) there will generally be a completely blind sector. The majority of obstructions met within a ship – masts, Samson posts funnels etc. affect the whole of the useful vertical beam width of the antenna, but an object such as the cross-trees, limited in vertical dimension, may not. The radar will therefore “look” over or under it, and the shadow area will not then extend the whole way to the horizon. In the vast majority of modern fittings the scanners are placed above every obstruction except perhaps a light topmast.
In an average type of cargo vessel, say with the scanner mounted above the bridge structure, the shadow sector due to the foremast would usually be 1 to 3 degrees, whereas those due to the Samson posts may be 5 to 10 degrees. In the case of the foremast there may be no blind sector but only a reduction of intensity and hence range of detection. It should be remembered that there may not be sufficient intensity to obtain an echo from a very small target even at close range, despite the fact that a large vessel may be detected while considerably further away. The wider shadow sectors due to
Samson posts may have a blind “core”. The funnel will usually cause a blind sector of from 10
degrees to 45 degrees or more depending on its distance from the radar. This sector will be large enough to obscure a ship of almost any size, however close.
Various experiments have been carried out to determine the shadow effect of obstructions to the
radar beam. The results of these experiments have been combined in Figure A2-1, Figure A2-2
and Figure A2-3 to show effect of a variety of obstructions on the shadow areas caused.

63
Figure A2-1: Detection ranges for various targets as affected by the obstruction of a 3ft diameter mast 20ft from the radar
(from Ref 1)
Figure A2-1 shows the detection ranges of vessels of three different sizes as affected by the
obstruction of a 3 ft. diameter mast placed 20 ft. from the radar, subtending an angle of 8
degrees. It will be seen that in the case of the 10,000-ton ship no shadow is caused until the
range of 5 miles is reached; from that point the shadow sector gradually increases until it is
about 24 wide at the normal maximum range of detection. It will also be seen that in the cases
of the smaller vessels the shadow sector begins closer to the radar aerial. This is due to the
lesser echoing areas of the smaller targets.
Figure A2-2 shows the effect of varying the diameter of the obstruction while keeping the radar
at the same distance from it; while Figure A2-3 shows the effect of varying the distance
between the obstruction and the radar while keeping the size of the obstruction constant. In
both these illustrations the target was a 1000-ton ship.

64
Figure A2-2: Detection ranges as affected by the obstruction of masts of different diameters (from Ref 1)

65
Figure A2-3: Detection ranges as affected by the obstruction of a mast at different distances from the radar (from Ref
1)

66
The differences between these practical results and the geometrical treatment are mainly that the angular width of the shadow sector does not remain constant and that it does not begin at the obstruction. These are both due to the fact that the radar beam does not start from a point but from an aperture, which may be 6 ft. wide (i.e. width of the aerial).
Figure A2-4: Shadow Sectors: The foremast, funnel and Samson posts obscure the picture when sea clutter and land
echoes are present (ref 1)
In order to better understand the shadow effects, the radar output is displayed on a simple PPI (Plan Position Indicator) that is the raw, unprocessed, radar signal is displayed. The shadow sectors thrown by masts, Samson posts and funnels are usually clearly discernible as dark sectors when sea clutter is visible on the PPI (Figure A2-4).
MEASURING SHADOW SECTORS
Calculation of the probable size of the shadow sector from a knowledge of the width of the obstruction and its distance and angle from the centre of the radar antenna gives a useful guide to
its position on the PPI, but may be difficult if the shape of the object is irregular, as with cross -
trees or steel ladders on a mast. There are two practical methods which may be used at sea: (1) observation of the blind sector against a background of light sea clutter, (2) observation of the
bearings at which the echo of a small object, such as a buoy, disappears and reappears when the
ship is turned. Obviously when the obstruction is caused by an object not mounted on the ship itself (such as an oil rig) then only method 1 is appropriate. Using this method, that is
estimating the sector against sea clutter, the gain or sea-clutter control should be adjusted until the clutter is weak. Otherwise the sector may be narrowed due to clutter echoes penetrating into
it from the sides.

67
False or indirect echoes
It has been shown that metal obstructions in the path of the radar beam may tend either to scatter it or to reflect from it. Some structures such as funnels or cross-trees are good reflectors and, a considerable portion of the energy in the radio beam may be sent off at an angle which will depend on the character of the obstruction. It is necessary to recall that the ship radar beam has considerable vertical width - typically 20 degrees or more and objects which do not obstruct the horizontal view from the scanner may give rise to reflections in the same way as those which do.
The echo caused by a reflected portion of the beam will return to the scanner by the same path and, whatever the actual bearing of the target may be, the echo will appear on the bearing of the obstruction. It will appear at the true range of the target if the additional distance between the scanner and the reflecting object is negligible. Such echoes are known as false or indirect echoes. The direct echo from the target will also appear at its proper bearing and distance unless it is in a blind sector.
In practice, objects in the ship which lie in or near the horizontal path of the beam are the most frequent causes of reflections, and false echoes are, therefore, more likely to appear within shadow sectors. As has been seen, however, they may also appear on bearings where no shadow sector is apparent. Although false echoes may be caused by Samson posts and less conspicuous structures the objects most commonly associated with these echoes are funnels and cross-trees. As only a small portion of the energy from the beam will contribute to the production of false echoes, it will require a target with a strong response to cause them.
As an example, assuming that the radar antenna is on the centre line, forward of the funnel, a false echo due to the funnel will appear to be astern of the ship or nearly so. Owing to the curvature of the funnel the false echo will be so distorted as to bear little resemblance to the shape of the original target. When the ship is passing close to land, oil rigs, wind farms etc., or moving in a river, false
echoes from the structures may appear to be following the ship (Figure A2-5).
Figure A2-5: False echoes: Land near Sutherland is seen to the south east due to reflections from the funnel (3 mile range
scale)

68
False echoes may cause a certain amount of confusion and may be mistaken for true echoes. It is possible to eliminate some of the sources of false echoes when these occur due to ship structure. In the case of cross-trees, for example, deflecting material of some kind (corrugated steel, for example) may be arranged either to scatter the beam or to deflect it upwards and so away from possible targets. Radar absorbent material (RAM) has also been found to be effective.
When the ship is very close to structures such as buildings, bridges, offshore structures etc., these may cause false echoes in exactly the same way as has been described for the ship’s structure. When the ship is in dock there may be such a confusion of false echoes due to buildings and the ship herself that it is virtually impossible to identify any particular echoes.

69
PART 5 FIRST-HAND EXPERIENCE ON A LARGE TANKER SUFFERING A 50%
REDUCTION OF ALL TARGET DETECTIONS IN A SWELL PERIOD
Whilst with Decca Radar one of the author’s (PDLW) and colleague were called to go across to Cherbourg to investigate a complaint that the Decca Radar was failing to provide consistent video and other radar data to an early ARPA system. So we went aboard in dock and all seemed fine. We put to sea in a large tanker in ballast, trimmed to the stern with the bow well out of the water. All was well till we were clear of the harbour & pitching head into an Atlantic swell. Due to the trim of the vessel & the swell, the ARPA tracker lost track on the selected target ship ahead. The resulting tracking loss arising from the change in the scanner alignment with the sea surface & the blockage of the bow. Some ships carry additional radar on the bow partly to reduce the perceived sea clutter and also reduce the blind zone caused by the bow as above.
PART 6 CMRS DIFFERENT TYPES AND EXPECTED PERFORMANCE UNDER A
SELECTION OF SCENARIOS
The antenna horizontal sizes start at 2ft 5” going to 9ft on X band or 9 or 12ft at S band for CMRs. VTS and other rig or shore based sets make use of 9, 18, 25ft on X band or large aperture dual band antennas.
Blockage is either partial when a small antenna boresight is directed at the centre of a metal obstruction or complete with a small aperture and large obstruction.
The situation is now more complex to analyse, but in all cases will degrade radar performance.
In the case of an offshore rig structure multiple reflections will make the situation worse with both missed targets due to sector shadowing and the occurrences of false targets at wrong bearings, all of which will produce an ambiguous radar picture on the screen and potentially cause confusion and errors.
On an ARPA both missed and false targets make them dangerous to rely on exclusively in complex scenarios and the radar is certainly not to be used without a dedicated operator.
Shipping includes fast CATs, powerboats and RIB types. Some have small RCS. Tankers and VLCCs are larger and have larger RCS. All of this needs radar receivers with greater dynamic range to cope with a greater range of target RCS and antennas with better sidelobes as well. Also newer types of radar such as FM/CW and pulse compression sets can generate range sidelobes, which with a few exceptions have never been experienced in civil marine service.

70
PART 7 CONCLUSIONS AND “THE NEXT MOVE”
1 The report has shown the significant degradation of using a CMR in close proximity to any offshore rig or other large structure.
2 Performance degradation includes but is not limited to: loss of detection performance, generation of false targets, high side lobe production, etc.
3 The degree of degradation can only be judged by the fall in performance from the required standard to comply with its fitness for purpose. We note that the state of any equipment to fulfil its Task or Operational Requirement depends on the choice of a CMR, its performance every day and how much spare or excess performance there will be at any time. Without an adequate margin of say 20dB one is in without a chance. Also it cannot be too strongly stated that a well-trained radar observer must always be on duty. To clarify this, Chapter 18 of the Reference 13 (Williams 2000) is included here as Annex 1 by kind permission of the author.
The report has shown that the effect of close by obstacles on radar can be significant. A more comprehensive study is needed to examine the use of supplementary systems such as AIS within the offshore blockage environment. A paper has been submitted to the Journal of Navigation (Williams 2004.) This will provide a framework for owners and operators to examine their needs which should lead to a review of all sensors in use now and for the future to fulfil the growing risks both for safety and security (intruder detection) perspectives.
ACKNOWLEDGEMENTS
The authors wishes to thank the Royal Institute of Navigation for their permission to use extracts
from the book commissioned in 1952 “The Use of Radar at Sea” edited by the late Captain F.J.
Wylie and help in many ways, also from friends and colleagues over many years.
71
REFERENCES
1) Wylie F.J. Editor. “The Use of Radar at Sea” RIN. Out of print
2) Briggs R.J. (2004) “Target Detection by Marine Radar”, IEE, October 2004.
3) Brown, A.K. and R. Aitmedhi. (1992) Shore-based antennas – a guide to their selection
for port, river, coastal and security surveillance. ESAT Antennas, 1992.
4) McGeoch I. (2004) AIS and Radar. SEAWAYS. The Nautical Institute. August.
5) Morchin W. (1993). Engineers Source Book. ARTEC HOUSE.
6) Norris A. (2004). The Future of Marine Radar. SEAWAYS The Nautical Institute July.
7) Skolnik M.I. (1970). Radar Handbook. McGraw Hill (Later editions no longer carry the
chapter on CMR).
8) Sperry Marine (2000) Bridge House E Radar User Guide.
9) Stiff I. P. A. 2002 The COLREGS-Time for a rewrite. J of Nav 55 419-430.
10) Stiff I. P. A. (2004) AIS and Collision Avoidance – A Sense of Déjà Vu. J of Nav 57 167
– 180.
11) Williams P.D.L., (2004) Sensors for our senses. Submitted to J of Nav – Sept 29 2004.
12) Williams P.D.L. (1999), Civil Marine Radar. A Personal Record of History and
Development over half a century with a focus on small target detection. Vol. 1. ISBN No
0 9536148 0 8. Also vol. 2 in 2000 ISBN 0 9536148 13.
13) Williams P.D.L. (2002) Civil Marine Radar – A Fresh Look at Transmitter Spectral
Control and Diversity Operation. Journal of Navigation Vol. 55 3 pp 405-418.

72
ANNEX 1 Regulations
(Drawn from Chapter 18 of Reference 13 with kind permission of the author)
Regulations
Introduction
Historically the first formal requirements written for CMR followed the many operational requirements or ORs, specifications and technical specifications written for military use in the period 1930 to 1946. The draft specification for CMR first appeared as a discussion document in the UK and was modified at a meeting in May 1946 in London of the International Meeting on Radio Aids to Marine Navigation (IMRAMN). Croney (1970.)
Then followed a series of updates of this original specification as well as national ones around the world. Later further specifications were introduced for both ARPA and ATA equipment as well as ones for ship’s gyros and speed and distance measurement equipment or logs. So as of December 1998 the position of specifications in Europe is that there are now a number of specifications for several items in the UK and other European countries which are gradually being harmonised and may be listed as follows:-
Shipborne radar BS 7168: until 1989, then IEC 60936: 1988, (1991 on the way) then EN 60936:
1993
Marine Automatic Radar Plotting Aids (ARPA) EN 60872: 1993 Marine Gyrocompass complying with IEC Standard BS EN ISO 8728
Marine Devices to Measure Speed and Distance complying with BS EN 61023
Marine Navigation and Radio Communication Support Systems IEC 60936-2 1998 note 1 General Requirements for Marine Navigational Equipment Standard No BS EN 60945 note 2 Marine Automatic Radar Tracking Aid ( ATA ) its number is IEC 60936-2 1998 note 3 Radar reflectors BS EN ISO 8729 note 4
Note 1. At the time of writing some UK and other national standards like the German DIN and French ones are being raised from scratch when the IEC catalogue system can be invoked from the beginning and such is the case for radar for high speed ships. So the omnibus new title on the note 1 line has already been bought into place and there is a subtitle “Shipborne radar for high speed vessels which has jumped in front of the current version of the original 1946 CMR requirements specification.
Note 2. This has been in place sometime but is still a national standard, to eventually have an IEC number.
Note 3. This is a variation of the ARPA specification with some changes to minimum scanner speed.

73
Note 4. This is by way of a guide to the construction of the single corner and there are many more available.
Discussion
The above represent the major specifications but there are many more either implied or called up. We note that IEC stands for International Electrotechnical Commission. But some countries may
have supplementary requirements perhaps not readily available so contractors may face hidden specifications and regulations particularly with regard to unwanted Tx spectral residues in bands
adjacent to the marine radar bands (and guard bands). Other problems occur when CMR types of
equipment are used ashore and often fresh frequency allocations are mandatory so the extra expense can be out of proportion to the initial cost of the mass produced CMR modules. But the
pressure on radio spectrum space is becoming greater and greater.
Back in the 1946 era CMR was in its infancy and the operating bands were partly chosen for their suitability for marine radar, partly due to the availability of microwave components like X and S
band magnetrons, mixers, duplexors, TR cells and local oscillators and partly due to the fact that
S band did not suffer from precipitation problems, nor significant attenuation through 5 to 10 nm of non-tropical rainfall but needed a large 12 ft. ( 5.2 m ) aperture to produce a 2 degree beam
with enough power taper across its horizontal aperture to meet the specified near and far side lobe level required.
Modern magnetrons in general need to transmit lower modest peak and mean power levels than
fifty years ago as receiver noise factors have improved from something around the 15 dB then to 3 to 5 dB today so where 75 kW S band transmitters were commonplace 20 years ago they are
rarely found as we enter the millennium. Magnetrons when suitably driven and matched now can
produce clean spectra particularly on long pulse and are environmentally friendly but radio frequency congestion is like road traffic getting worse.
The frequency allocation at the time of writing are in three bands as follows and polarisation is also listed:-
Band Frequency (GHz) Polarisation notes
S band 3 to 3.1 choice of HH or VV frequencies not stated now
C band to choice of HH or VV “
X band 9.33 to 9.5 to be capable of HP for racon / ramark use
Note 1. The frequencies no longer appear in the CMR specs and may change.
Note 2. C band is occasionally used, powerful equipment came out in the late 1980s for use on ocean trawlers to detect feeding tuna when on the surface (possibly detecting water splashes and birds), enabling detections from 5 to 10 nm to be made.
Potential new frequency allocations are very much more open but of course subject to a horrendous
minefield of national regulations and potential interference to established users. By way of
illustration we now list the bands theoretically open for negotiat ion. As a preamble we note that at periods of several years the World Administrative Radio Conference meet in Geneva so there
have recently been WARC 1979, WARC 1990 and others, there is now a delay before the deliberations and stream of resolutions from each WARC meeting and the International Radio
Union or ITU publish their reports, but these contain caveats to the effect that much of the
detailed technical discussions which take place at the actual meetings may be omitted from the 3 or more volume reports and fresh resolutions issued from these meetings. In general Radio

74
navigation bands operate in all of the three regions as are needed for ships plying the high seas
world-wide.
We accept that a 12 ft. antenna is as big as most merchant navy ships wish to carry so to meet the two degree horizontal beam requirement there is little point in going to longer wavelengths.
Old Band Name Frequency Range
(GHz) ITU RRS No. Notes/Bandwidth
S 2.7-2.9 109
S 2.9-3.1 109
S 3.1-3.3 109
C 5.460-5470 115 only 10 MHz
C 5.470-5.650 119 90 MHz
5.70-8.850 125
9.20-9.30 125
X 9.3-9.5 125 existing band
9.5-9.8 125 300 MHz
J 14-14.25 133 250 MHz
14.25-14.3 133 only 50 MHz
24.05-25.25 142 200 MHz
24.25-25.25 144 1 GHz
At mm wavelengths water and gas absorption limits the working range particularly over the sea where water vapour is always present so above 15 GHz few equipment's are at sea except perhaps on research vessels.
The problem is not only meeting the above regulation as amended but overriding national ones as well. Also, there may be others which at first sight may not to be relevant but one can find out too late. Finally the “Health and Safety” aspects need to be covered wherever sales are proposed and made.
Also, the eye safety aspects close to a microwave radiator, without being sure it seems that people falling on a deck or having a big scanner start up and bang someone's head come high on the list of accidents that have occurred. The only microwave accident cost a firm a new shirt as the service engineer had some flash bulbs in his pocket which went off and burnt his shirt, he might have had a burn from the shirt catching fire, but do take care.

75
ANNEX 2 GLOSSARY OF RADAR TERMS
2D Two-Dimensional
3D Three-Dimensional
APA Antenna Physical Aperture
Ae Effective Aperture
AC Alternating Current
A/D Analogue to Digital (ADC)
AFC Automatic Frequency Control
ADT Automatic Detection and Tracking
AGC Automatic Gain Control
AIC Adaptive Interference Canceller
AM Amplitude Modulation
ARDS Range Amplitude Display Scope
ASL Above Sea Level
ATA Automatic Tracking Aid
ATC Air Traffic Control
FB Frequency Bandwidth
Bn Receiver noise bandwidth
BPF Band Pass Filter
B Scope Range Azimuth Display
c velocity of EM waves in vacuum
CA Cell Averaging
CAA Civil Aviation Authority UK term
CAGO Cell Averaging Greatest Of
CCD Charge-Coupled Device
CFAR Constant False Alarm Rate
cm Centimetre
CMR Civil Marine Radar
COTS Commercial-Off-The Shelf
CP Circular Polarisation
CRT Cathode Ray Tube
CW Continuous Wave
D/A Digital-to-Analog
dB Decibel
dBm Decibel wrt to 1 mw
dBW Decibel wrt 1 watt
DERA Defence Evaluation and Research Agency UK
deg Degree
DF Direction Finding
DIC Digital Integrated Circuit
DTI Department of Trade and Industry
DST Display Storage Tube
ECCM Electronic Counter Counter Measures
ECM Electronic Counter Measures
EM Electromagnetic

76
EMC Electromagnetic Compatibility
EMI UK firm [Defence part now taken over by Racal itself now Thales part of Thompson]
EMI Electromagnetic Interference
ERP Effective Radiated Power
F Noise Factor
FAA Federal Aviation Authority
FD Frequency Diversity
FET Field-Effect Transistor
FFT Fast Fourier Transform
FM Frequency Modulation
FM/CW Frequency Modulated Continuous Wave type of active radar
FTC Fast Time Constant
fc Carrier Frequency
FN Noise Figure or NF
G Gain (power)
GHz Gigahertz
GRT Gross Registered Tonnage
HF High Frequency
HH Horizontal Transmit and Horizontal Receive Polarisation
HP Horizontal Polarisation
HPF High Pass Filter
HV Horizontal Transmit and Vertical Receive Polarisation
Hz Hertz
IAGC Instantaneous Automatic Gain Control
IC Integrated Circuit
IF Intermediate Frequency
IFF Identification Friend or Foe ( old WW l term )
IFM Instantaneous Frequency Measurement
I/Q In-phase/Quadrature
IR Infrared
k Planks Constant
KF Kalman Filter
km Kilometre
kW Kilowatt
LCD Liquid Crystal Display
LNA Low Noise Amplifier
LO Local Oscillator
log amp Logarithmic Amplifier
LOS Line Of Sight
LP Linear Polarisation
LPF Low Pass Filter
LSB Least Significant Bit
m Metre
MDS Minimum Detectable Signal
Mhz Megahertz
MIC Microwave Integrated Circuit

77
mm Millimetre
MoT Ministry of Transport
mW Milliwatt
MW Megawatt
MTBF Mean Time Between Failures
MTD Moving Target Detector
MTI Moving Target Indicator
NF Noise Factor
nm Nautical Mile
NRL Naval Research Laboratory USA
OR (1) Operating Range, (2) Operational Requirement
OSC Oscillator
Pd Probability of Detection
Pfa Probability of False Alarm
pdf Probability Density Function
PLD Pulse Length Discriminator
PLO Phase Locked Oscillator
PM Phase Modulation
PN Pseudo Noise
PPI Plan Position Indicator
PPM (1) Pulse Position Modulation, or (2) Parts per Million
PRF Pulse Repetition Frequency
PRI Pulse Repetition Interval
PSD Phase Sensitive Detector
PW Pulse Width
Q Quality factor of tuned circuit
R&D Research and Development
RAM (1) Radar Absorbent Material (2) Random Access Memory
RCS Radar Cross Section
RF Radio Frequency
ROM Read Only Memory
Rx Receiver
SAR (1) Search and Rescue (2) Synthetic Aperture Radar
SCV Sub Clutter Visibility
SLC Side Lobe Cancellation
SNR Signal to Noise Ratio S/N
SSR Secondary Surveillance Radar
STC Sensitivity Time Control or Swept Gain
TCR Target to Clutter Ratio S/C
T/R Transmitter/Receiver
Tx Transmitter
UHF Ultra High Frequency
VCO Voltage Controlled Oscillator
VH Vertical Transmit and Horizontal Receive Polarisation
VHF Very High Frequency
VLSIC Very Large Scale Integrated Circuit

78
VDU Visual Display Unit, TV raster type.
VH Vertical Transmit and Horizontal Receive Polarisation
VP Vertical Polarisation
VTMS Vessel Traffic Management System
VV Vertical Transmit and Vertical Receive Polarisation
X-POL Cross Polarisation
XPD Cross Polarisation Discrimination
XTAL Crystal, usually quartz.
Z Impedance

79
APPENDIX 3: MCA SHIPPING NOTES AND MARINE GUIDANCE FOR AIS
CONTENTS
MSN 1795 (M)
Revised Carriage Requirements Automatic System (AIS), November 2005 Identification
MGN 324
(M+F)
Navigation: Watch keeping safety – Use of VHF Radio and an
Operational Guidance for Automatic Identification and AIS, October 2017

80
PART 1: MSN 1795 (M) Revised Carriage Requirements Automatic System (AIS), November
2005 Identification

81
MERCHANT SHIPPING NOTICE
MSN 1795 (M)
REVISED CARRIAGE
REQUIREMENTS FOR AUTOMATIC
IDENTIFICATION SYSTEMS (AIS)
Notice to all ship-owners, builders, masters and
ship’s officers, shore based maintenance
providers, equipment manufacturers,
classification societies, and all other parties
concerned. This notice should be read in conjunction with the Merchant Shipping (Safety of Navigation) Regulations 2002 and the MCA publication Safety of Navigation, Implementing SOLAS Chapter V, 2002.
This notice supersedes MSN1780 and MSN 1780 Corrigendum.
1. Decisions made by IMO and EC modified the implementation timetable for the
Summary
Key Notes:
The timetable for the carriage of AIS has been revised. As a consequence, the majority
of ships should have been equipped with AIS by 31 December 2004.

82
carriage of Automatic Identification Systems (AIS) from that agreed for the revised Chapter V (Safety of Navigation) of the International Convention for the Safety of Life at Sea (SOLAS) which entered into force on 1 July 2002. The revised Chapter V was given effect by The Merchant Shipping (Safety of Navigation) Regulations 2002 (SI 2002 No. 1473) which is supported by the MCA publication “Safety of navigation, Implementing SOLAS Chapter V, 2002.”
2. Discussions in IMO’s Maritime Safety Committee and its Maritime Security Working Group on a review of procedures to prevent acts of terrorism which threaten the security of passengers and crews and the safety of ships resulted in a Conference of Contracting Governments in December 2002.
3. This Conference adopted the International Ship & Port Facility Security (ISPS) Code together with amendments to the SOLAS Convention. These amendments were subsequently accepted on 1 January 2004 to enter into force 1 July 2004.
4. The amendments to Chapter V of SOLAS involve Regulation 19 as follows:
1. The existing subparagraphs .4, .5 and .6 of paragraph 2.4.2 are replaced by the following:
“4. in the case of ships, other than passenger ships and tankers, of 300 gross tonnage and upwards but less than 50,000 gross tonnage, not later than the first safety equipment survey after 1 July 2004 or by 31 December 2004, whichever occurs earlier: and”
2. The following new sentence is added at the end of the existing subparagraph .7 of paragraph 2.4:
“Ships fitted with AIS shall maintain AIS in operation at all times except where international agreements, rules or standards provide for the protection of navigational information.”
5. In practice these changes mean that all ships on international voyages of 300 gross tonnage and upwards should fit AIS by 31 December 2004 at the latest.
6. Agreement in the European Union concerning long term aims to improve the monitoring of traffic in European Community waters resulted, in 2002, in Directive 2002/59/EC of the European Parliament and Council establishing a Community Vessel Traffic Monitoring and Information System. Article 6 and annex II (1) of this Directive lay down carriage requirements for AIS which are based on the SOLAS requirements but differ in the following respects:
They apply to any ship calling at port of a Member State
The definition of “ship” is extended to include any sea – going vessel or craft.
7. In practice, this results in the dates for fitting AIS to ships on domestic voyages

83
being brought forward from the SOLAS date of 1 July 2008. It further results in the size of cargo ships on domestic voyages required to fit AIS being reduced from the SOLAS 500 gross tonnage to 300 gross tonnage. It also extends the carriage requirement to include High Speed Craft.
Revised Timetable for AIS Carriage Requirements
8. The revised timetable for the carriage of AIS is given in the attached Appendix for the information of shipowners. This table now replaces that in Annex 17 of Safety of Navigation, Implementing SOLAS Chapter V, 2002. Advance notification of the revised requirements was given in the update to the above document dated June 2003.
Domestic Passenger Ships
9. It should be noted that AIS is now an immediate carriage requirement for passenger ships of 300 gross tonnage or more of Class IIA, III, VI, VIA and Class A, B, C and D. The MCA will contact the owners of such vessels to discuss implementation arrangements.
Operation of AIS
10. The changes to Chapter V of SOLAS introduce a new requirement to maintain AIS in operation at all times, although the requirement is largely a reinforcement of the existing requirements to automatically provide and receive AIS information. The requirement is bound by the exception of “where international agreements, rules or standards provide for the protection of navigational information.” These agreements, rules or standards refer to the IMO Guidelines for the Onboard Operational Use of Shipborne Automatic Identification Systems (Resolution A.917(22)). Paragraph 21 of these guidelines was modified by the 23
rd Assembly in December
2003 to introduce concepts for security incidents and mandatory reporting systems. The complete text of paragraph 21 is now:
“AIS should always be in operation when ships are underway or at anchor. If the master believes that the continual operation of AIS might compromise the safety or security of his / her ship or where security incidents are imminent, the AIS may be switched off. Unless it would further comprise the safety or security, if the ship is operating in a mandatory reporting system, the master should report this action and the reason for doing so to the competent authority. Actions of this nature should always be recorded in the ship’s logbook together with the reason for doing so. The master should however restart the AIS as soon as the source of danger has disappeared. If the AIS unit is shut-down, static data and voyage related information remains stored. Restart is done by switching on the power to the AIS unit. Ship’s own data will be transmitted after a two minute initialisation period. In ports AIS operation should be in accordance with port requirements.”
Installation of Shipborne AIS
11. AIS should be installed according to the guidance given in SN / Circ.227 (Guidelines for the Installation of a Shipborne Automatic Identification System). Particular care should be taken to ensure that the ship’s data; MMSI, IMO number, Call Sign, Name, Type and Dimensions are correctly programmed. SN / Circ.227 is reproduced in Annex 17 of Safety of Navigation, Implementing SOLAS Chapter V, 2002 as updated June 2003.

84
Safety of Navigation, Implementing SOLAS Chapter V, 2002
12. Safety of Navigation, Implementing SOLAS Chapter V, 2002 is published as ISBN 0 110552575 0 by The Stationary Office and may also be accessed (incorporating amendments) through the MCA website on
www.mcga.gov.uk/c4mca/mcga-regs/safetyofnavigation/index.htm
It is also available free of charge on CD-ROM by contacting Mrs Anne Sutherland at the address below.
Merchant Shipping (Safety of Navigation) Regulations
13. SI No. 1473, 2002, ISBN no. 0 11042349 6, is available from The Stationary Office. It can be viewed on Her Majesty’s Stationary Office web site.
www.legislation.hmso.gov.uk/stat.htm

85
Further Information
Further information on the contents of this Notice can be obtained from:
Navigation Safety Branch
Maritime and Coastguard Agency
Spring Place
105 Commercial Road
Southampton
SO15 1EG
Tel : +44 (0) 23 8032 9146
Fax : +44 (0) 23 8032 9204
e-mail: [email protected]
General Inquiries: 24 Hour Infoline
[email protected] 0870 600 6505
MCA Website Address: www.mcga.gov.uk
File Ref: MNA 139/002/45
Published: November 2005
© Crown Copyright 2005
Safer Lives, Safer Ships, Cleaner Seas
Printed on material containing minimum 75% post-con
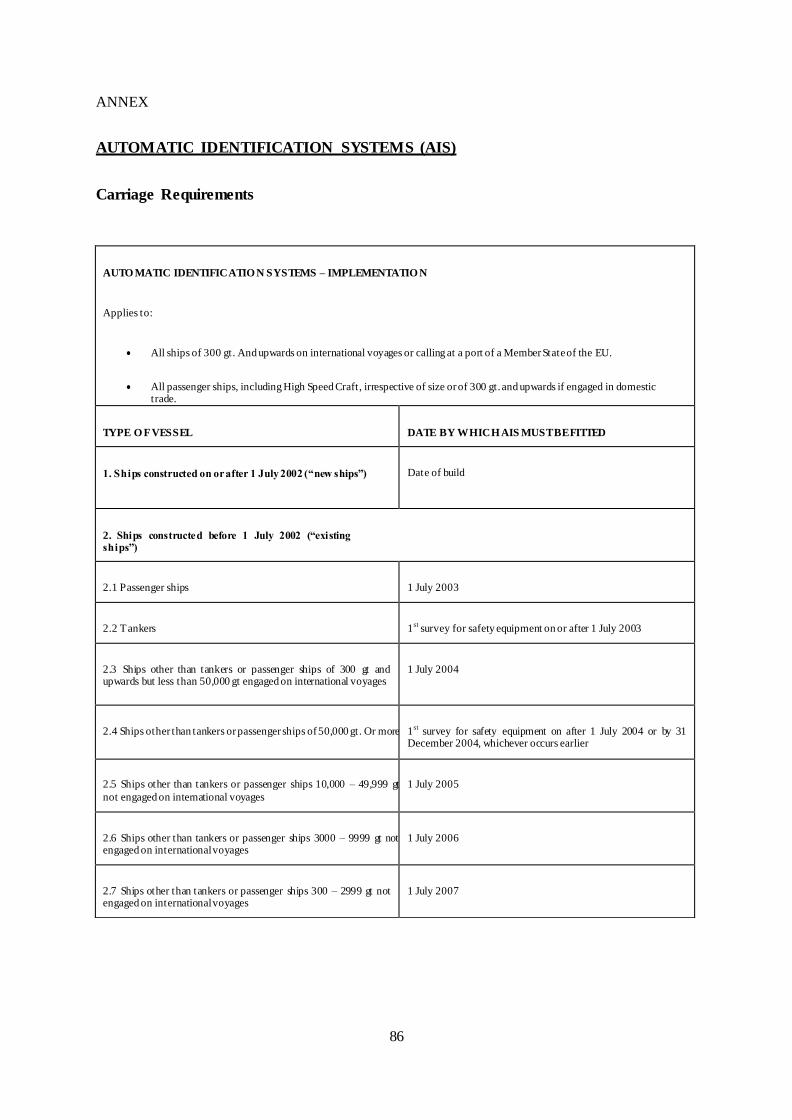
86
ANNEX
AUTOMATIC IDENTIFICATION SYSTEMS (AIS)
Carriage Requirements
AUTO MATIC IDENTIFICATIO N SYSTEMS – IMPLEMENTATIO N
Applies to:
All ships of 300 gt. And upwards on international voyages or calling at a port of a Member State of the EU.
All passenger ships, including High Speed Craft, irrespective of size or of 300 gt. and upwards if engaged in domestic trade.
TYPE O F VESSEL
DATE BY WHICH AIS MUST BE FITTED
1. Ships constructed on or after 1 July 2002 (“new ships”)
Date of build
2. Ships constructed before 1 July 2002 (“existing ships”)
2.1 Passenger ships
1 July 2003
2.2 Tankers
1st survey for safety equipment on or after 1 July 2003
2.3 Ships other than tankers or passenger ships of 300 gt and upwards but less than 50,000 gt engaged on international voyages
1 July 2004
2.4 Ships other than tankers or passenger ships of 50,000 gt. Or more
1st survey for safety equipment on after 1 July 2004 or by 31
December 2004, whichever occurs earlier
2.5 Ships other than tankers or passenger ships 10,000 – 49,999 gt
not engaged on international voyages
1 July 2005
2.6 Ships other than tankers or passenger ships 3000 – 9999 gt not engaged on international voyages
1 July 2006
2.7 Ships other than tankers or passenger ships 300 – 2999 gt not engaged on international voyages
1 July 2007

87
PART 2: MGN 324 (M+F) Navigation: Watch keeping safety – Use of VHF Radio and an
Operational Guidance for Automatic Identification and AIS, October 2017

88
MARINE GUIDANCE
NOTE
MGN 324 (M+F)
Amendment 1
Navigation: Watch keeping Safety – Use of VHF Radio
and AIS
Notice to all Owners, Masters, Officers and Pilots of Merchant
Ships; Nautical Training Institutions; Owners and Skippers of
Fishing Vessels, and Owners of Yachts and Pleasure Craft.
This Note replaces Marine Guidance Notes MGN 324 (M+F) (Correction) and MGN
324 (M+F) (Corrected)
Summary
Given the continuing number of casualties where the misuse of very high frequency marine radio has been established as a contributory factor, it has been decided to re-issue the MCA guidance on the use of Very High Frequency radio (VHF). Additionally, appropriate use of the Automatic Identification System (AIS), especially with regard to collision avoidance, has been highlighted in conformance with the IMO guidelines which have been revised in December 2015.
Key Points
Although the use of Very High Frequency (VHF) radio transciever may be justified on occasion as a collision avoidance aid, the provisions of the International Regulations for Preventing Collisions at Sea, 1972 (COLREG) should remain uppermost.
The use of marine VHF equipment must be in accordance with the International Telecommunication Union (ITU) Radio Regulations.
There is currently no explicit provision in the COLREG for the use of AIS information, however, the potential of AIS to improve situation awareness is recognised and AIS may be included as such in the future.
89
The navigation safety related functions of AIS are to help identify ships, assist in target tracking and provide additional information to assist situation awareness.
Limitations of AIS with respect to mandatory carriage based on vessel types and sizes have also been highlighted.
1. Introduction/ Background
1.1 The International Maritime Organization (IMO) and wider maritime community has noted with concern the widespread misuse of VHF channels at sea, especially the distress, safety and calling Channels 16 (156.8 MHz) and 70 (156.525 MHz), and channels used for port operations, ship movement services and reporting systems. Although at sea VHF makes an important contribution to navigation safety, its misuse causes serious interference and, in itself, becomes a danger to safety at sea. IMO Member Governments have unanimously agreed to ensure that VHF channels are used appropriately and correctly.
1.2 It should be borne in mind that not all ships or marine craft carry or are required to carry AIS. The officer of the watch (OOW) should always be aware that other ships, in particular leisure craft, fishing vessels and warships, and some coastal shore stations, including Vessel Traffic Service (VTS) centres, might not be fitted with AIS.
1.3 The OOW should always be aware that AIS fitted on other vessels as a mandatory carriage requirement might, under certain circumstances, be switched off on the master's discretion and professional judgement. Users are, therefore, cautioned always to bear in mind that information provided by AIS may not be giving a complete or correct "picture" of shipping traffic in their vicinity.
2. VHF Communications and usage
2.1 All users of marine VHF on United Kingdom vessels and all other vessels in UK territorial waters and harbours are reminded in conformance with international and national legislation, that marine VHF equipment may only be used in accordance with the ITU Radio Regulations. These Regulations specifically prescribe that:
a) Channel 16 may only be used for distress, urgency and very brief safety communications, and for calling to establish other communications which should then be concluded on a suitable working channel;
b) Channel 70 may only be used for Digital Selective Calling, not oral communication;
c) On VHF channels allocated to port operations or ship movement services, such as VTS, the only messages permitted are restricted to those relating to operational handling, the movement and the safety of ships and to the safety of persons;
d) All conversations must be preceded by an identification, for example the vessel’s name or call

90
sign; and
e) The service of every VHF radio telephone station must be controlled by an operator holding a certificate issued or recognised by the station’s controlling Administration. This is usually the country of registration, if the vessel is registered. Provided that the Station is so controlled, other persons besides the holder of the certificate may use the equipment.
2.2 Channels 6, 8, 72 and 77 have been made available, in UK waters, for routine ship-to-ship communications, Masters, Skippers and Owners are urged to ensure that all ship-to-ship communications working in these waters is confined to these channels, selecting the channel most appropriate in the local conditions at the time.Channel 13 is designated for use on a worldwide basis as a navigation safety communication channel, primarily for inter-ship navigation safety communications. It may also be used for the ship movement and port services.
2.3 IMO Resolution A.954(23), Proper use of VHF Channels at Sea, should be consulted. To get indicative information on typical VHF communication ranges, the section - “The Management of VHF” - within Admiralty List of Radio Signals Volume 5, published by the United Kingdom Hydrographic Office, may be consulted.
3. Use of VHF to Aid Collision Avoidance
3.1 There have been a significant number of collisions where subsequent investigations have found that at some stage before impact, one or both parties were using VHF radio in an attempt to avoid collision. The use of VHF radio in these circumstances is not always helpful and may even prove to be dangerous.
3.2 At night, in restricted visibility or when there are more than two vessels in the vicinity, the need for positive identification is essential but this can rarely be guaranteed. Uncertainties can arise over the identification of vessels, correlation and interpretation of messages received. Even where positive identification has been achieved there is still the possibility of a misunderstanding due to language difficulties however fluent the parties concerned might be in the language being used. An imprecise or ambiguously expressed message could have serious consequences.
3.3 Valuable time can be wasted whilst mariners on vessels approaching each other try to make contact on VHF radio instead of complying with the COLREG. There is the further danger that even if contact and identification are achieved and no difficulties over the language of communication or message content arise, a course of action might still be chosen that does not comply with the COLREG. This may lead to the collision it was intended to prevent.
3.4 In 1995, the judge in a collision case said -"It is very probable that the use of VHF radio for conversation between these ships was a contributory cause of this collision, if only because it distracted the officers on watch from paying careful attention to their radar. I must repeat, in the hope that it will achieve some publicity, what I have said on previous occasions that any attempt to use VHF to agree the manner of passing is fraught with the danger of misunderstanding. Marine Superintendents would be well advised to prohibit such use of VHF radio and to instruct their officers to comply with the Collision Regulations."

91
3.5 In a case published in 2002, one of two vessels, approaching each other in fog, used the VHF radio to call for a red to red (port to port) passing. The call was acknowledged by the other vessel but unfortunately, due to the command of English on the calling vessel, what the caller intended was a green to green (starboard to starboard) passing. The actions were not effectively monitored by either of the vessels and collision ensued.
3.6 Again, in a case published in 2006 one of two vessels, approaching one another involving a close quarter’s situation, agreed to a starboard to starboard passing arrangement with a person on board another, unidentified ship, but not the approaching vessel. Furthermore, the passing agreement required one of the vessels to make an alteration of course contrary to the requirements of the applicable Rule in the COLREG. Had the vessel agreed to a passing arrangement requiring her to manoeuvre in compliance with the COLREG, the ships would have passed clear, despite the misidentification of ships on the VHF radio. Unfortunately, by the time both vessels realised that the ships had turned towards each other the distance between them had further reduced to the extent that the last minute avoiding action taken by both ships was unable to prevent a collision.More recently, in 2014, inappropriate use of VHF radios was highlighted as a major factor in collision between a bulk carrier and container ship which occurred in open sea with very sparse traffic around the vessels. Navigating officers on both vessels relied solely on the VHF for collision avoidance decision to negotiate a manoeuvre that was contrary to the COLREG. To further complicate the matter, VHF radio communications were not conducted in English which was both of the ships’ working language, and which confused a relieving officer on one of the vessels who was not able to understand what had been tacitly agreed via the VHF communications.
3.7 Although the practice of using VHF radio as a collision avoidance aid may be resorted to on occasion, for example in pilotage waters, the risks described in this Note should be clearly understood and the COLREG complied with to their best possible extent.
4. Use of Automatic Identification System (AIS)
4.1 AIS operates primarily on two dedicated VHF channels (AIS1 – 161.975 MHz and AIS2 –162.025 MHz). Where these channels are not available regionally, the AIS is capable of automatically switching to alternate designated channels. AIS has now been installed on the majority of commercial vessels, and has the potential to make a significant contribution to safety. However, the mariner should treat the AIS information with caution, noting the following important points.
4.2 Mariners on craft fitted with AIS should be aware that the AIS will be transmitting own ship data to other vessels and shore stations.
To this end they are advised to:
f) initiate action to correct any known improper installation; g) ensure the correct information on the vessel’s identity, position, and movements (including
voyage-specific) is transmitted; and h) ensure that the AIS, if being off for any reason, is turned on, at least within 100 nautical
miles of the coastline of the United Kingdom.

92
4.3 The simplest means of checking whether ownship is transmitting correct information on identity, position and movements is by contacting other vessels or shore stations. Increasingly, UK maritime rescue coordination centres and port authorities are being equipped as AIS base stations. As more base stations are established ashore AIS may be used to provide a monitoring system in conjunction with Vessel Traffic Services and Ship Reporting (SOLAS Chapter V, Regulations 11 and 12 refer).
4.4 Many ship owners have opted for the least-cost AIS installation to meet the mandatory carriage requirement. By doing so many of the benefits offered by graphic display (especially AIS on radar) are not realised with the 3-line ‘Minimum Keyboard Display’ (MKD), although the unit may still be duly type approved.
4.5 It is becoming common practice for pilots to possess their own portable navigational equipment which they carry on board. Such devices can be connected to shipborne AIS equipment and display the targets they receive. This, so called, Pilot Connector Socket and suitable power outlet should be located somewhere of practical use to a marine pilot who may carry compatible AIS equipment. This should be somewhere close to the wheelhouse main conning position. Less accessible locations in chart rooms, e.g. at the after end of the wheelhouse are not recommended.
4.6 The routine updating of data into the AIS, at the start of the voyage and whenever changes occur, should be covered in the navigating officer’s checklist and should consist of:
ship’s draught;
hazardous cargo, if any;
destination and ETA;
route plan (way points); correct navigational status; and
short safety-related messages.
4.7 The quality and reliability of position data obtained from targets will vary depending on the accuracy of the transmitting vessel’s GNSS (Global Navigation Satellite System) receiver. It should be noted that older GNSS equipment (before 2003) may not produce Course Over Ground and Speed Over Ground (COG/SOG) data to the same accuracy as newer equipment.
4.8 IMO Resolution A.1106(29), Revised Guidelines for the Onboard Operational Use of shipborne Automatic Identification Systems (AIS), published December 2015, should be consulted for better understanding of the operational functions and limitations of the AIS.
5. Use of AIS to Support Safety of Navigation
5.1 Modern radar and ECDIS units (installed onboard on or after 1 July 2008) have provisions for AIS integration which is able to ‘overlay’ additional information on the radar and ECDIS displays. However, this also implies that there will be older AIS “stand alone” units without integration to other displays.
5.2 On the vessels with integrated AIS and radar, if the target data from AIS and radar tracking are
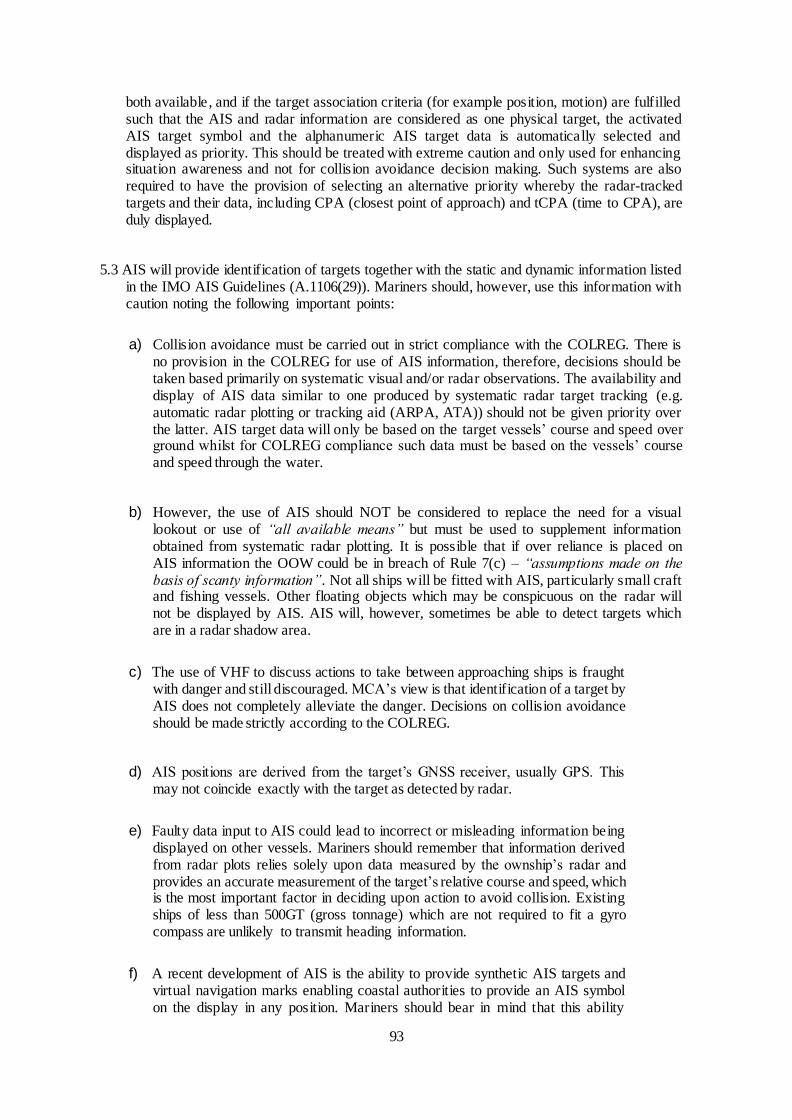
93
both available, and if the target association criteria (for example position, motion) are fulfilled such that the AIS and radar information are considered as one physical target, the activated AIS target symbol and the alphanumeric AIS target data is automatically selected and displayed as priority. This should be treated with extreme caution and only used for enhancing situation awareness and not for collision avoidance decision making. Such systems are also required to have the provision of selecting an alternative priority whereby the radar-tracked targets and their data, including CPA (closest point of approach) and tCPA (time to CPA), are duly displayed.
5.3 AIS will provide identification of targets together with the static and dynamic information listed in the IMO AIS Guidelines (A.1106(29)). Mariners should, however, use this information with caution noting the following important points:
a) Collision avoidance must be carried out in strict compliance with the COLREG. There is no provision in the COLREG for use of AIS information, therefore, decisions should be taken based primarily on systematic visual and/or radar observations. The availability and display of AIS data similar to one produced by systematic radar target tracking (e.g. automatic radar plotting or tracking aid (ARPA, ATA)) should not be given priority over the latter. AIS target data will only be based on the target vessels’ course and speed over ground whilst for COLREG compliance such data must be based on the vessels’ course and speed through the water.
b) However, the use of AIS should NOT be considered to replace the need for a visual lookout or use of “all available means” but must be used to supplement information obtained from systematic radar plotting. It is possible that if over reliance is placed on AIS information the OOW could be in breach of Rule 7(c) – “assumptions made on the basis of scanty information”. Not all ships will be fitted with AIS, particularly small craft and fishing vessels. Other floating objects which may be conspicuous on the radar will not be displayed by AIS. AIS will, however, sometimes be able to detect targets which are in a radar shadow area.
c) The use of VHF to discuss actions to take between approaching ships is fraught with danger and still discouraged. MCA’s view is that identification of a target by AIS does not completely alleviate the danger. Decisions on collision avoidance should be made strictly according to the COLREG.
d) AIS positions are derived from the target’s GNSS receiver, usually GPS. This may not coincide exactly with the target as detected by radar.
e) Faulty data input to AIS could lead to incorrect or misleading information being displayed on other vessels. Mariners should remember that information derived from radar plots relies solely upon data measured by the ownship’s radar and provides an accurate measurement of the target’s relative course and speed, which is the most important factor in deciding upon action to avoid collision. Existing ships of less than 500GT (gross tonnage) which are not required to fit a gyro compass are unlikely to transmit heading information.
f) A recent development of AIS is the ability to provide synthetic AIS targets and virtual navigation marks enabling coastal authorities to provide an AIS symbol on the display in any position. Mariners should bear in mind that this ability

94
could lead to the appearance of “virtual” AIS targets and therefore take particular care when an AIS target is not complemented by a radar target. IMO guidance as in MSC.1/Circ.147, Policy on Use of AIS Aids to Navigation, should be consulted.
More Information
Navigation Safety Branch
Maritime and Coastguard Agency
Bay 2/24
Spring Place
105 Commercial Road Southampton
SO15 1EG
Tel : +44 (0) 203 8172 432
email: [email protected]
Website Address: www.gov.uk/government/organisations/maritime-and-coastguard-agency
General Inquiries: [email protected]
File Ref: MNA 139/02/031 and MNA 5/50/294
Published: December 2016
Please note that all addresses and
telephone numbers are correct at time of publishing
© Crown Copyright 2016
Safer Lives, Safer Ships, Cleaner Seas
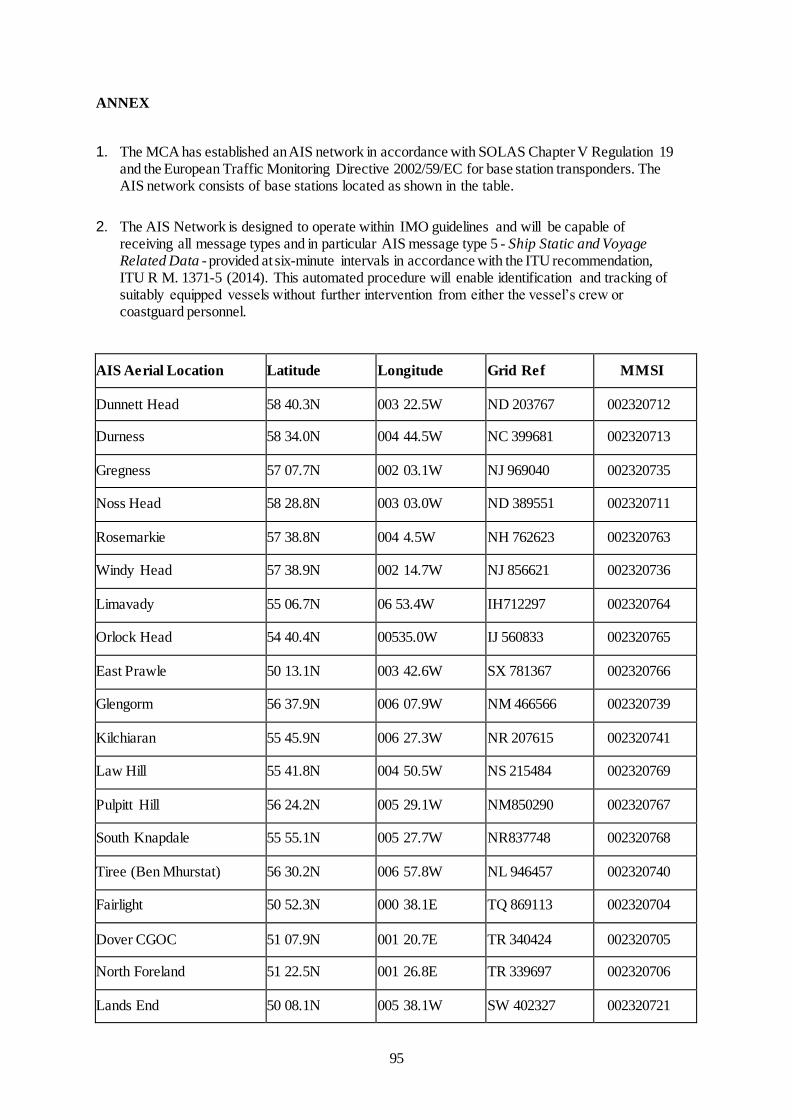
95
ANNEX
1. The MCA has established an AIS network in accordance with SOLAS Chapter V Regulation 19 and the European Traffic Monitoring Directive 2002/59/EC for base station transponders. The AIS network consists of base stations located as shown in the table.
2. The AIS Network is designed to operate within IMO guidelines and will be capable of receiving all message types and in particular AIS message type 5 - Ship Static and Voyage Related Data - provided at six-minute intervals in accordance with the ITU recommendation, ITU R M. 1371-5 (2014). This automated procedure will enable identification and tracking of suitably equipped vessels without further intervention from either the vessel’s crew or coastguard personnel.
AIS Aerial Location Latitude Longitude Grid Ref MMSI
Dunnett Head 58 40.3N 003 22.5W ND 203767 002320712
Durness 58 34.0N 004 44.5W NC 399681 002320713
Gregness 57 07.7N 002 03.1W NJ 969040 002320735
Noss Head 58 28.8N 003 03.0W ND 389551 002320711
Rosemarkie 57 38.8N 004 4.5W NH 762623 002320763
Windy Head 57 38.9N 002 14.7W NJ 856621 002320736
Limavady 55 06.7N 06 53.4W IH712297 002320764
Orlock Head 54 40.4N 00535.0W IJ 560833 002320765
East Prawle 50 13.1N 003 42.6W SX 781367 002320766
Glengorm 56 37.9N 006 07.9W NM 466566 002320739
Kilchiaran 55 45.9N 006 27.3W NR 207615 002320741
Law Hill 55 41.8N 004 50.5W NS 215484 002320769
Pulpitt Hill 56 24.2N 005 29.1W NM850290 002320767
South Knapdale 55 55.1N 005 27.7W NR837748 002320768
Tiree (Ben Mhurstat) 56 30.2N 006 57.8W NL 946457 002320740
Fairlight 50 52.3N 000 38.1E TQ 869113 002320704
Dover CGOC 51 07.9N 001 20.7E TR 340424 002320705
North Foreland 51 22.5N 001 26.8E TR 339697 002320706
Lands End 50 08.1N 005 38.1W SW 402327 002320721

96
Lizard 49 57.8N 005 12.5W SW 701121 002320720
Scillies 49 55.8N 006 18.2W SV 913121 002320723
Inverbervie 56 51.1N 002 15.7W NO 842734 002320770
Fife Ness 56 16.7N 002 35.2W NO 637097 002320734
St Abbs Crosslaw 55 54.5N 002 12.4W NT 873683 002320710
South Stack 53 18.5N 004 41.2W SH 212824 002320771
Cullercoats 55 04.3N 001 25.8W NZ344755 002320708
Flamborough Head 54 07.1N 000 05.2W TA 254708 002320709
Ravenscar 54 23.8N 000 30.3W NZ972012 002320780
MCA Liverpool 53 29.8N 003 03.5W SD 299006 002320772
Snaefell 54 15.8N 004 27.7W SC 398882 002320718
Dinas 52 00.2N 004 543.6W SN 012377 002320742
St Anns Head 51 41.0N 005 10.6W SN 807029 002320719
The Grove 50 36.1N 002 27.1W ST 368078 002320722
Collarfirth Hill 60 32.0N 001 23.4W HU 335835 002320737
Compass Head 59 52.0N 001 16.3W HU 408093 002320714
Saxa Vord 60 49.7N 000 50.4W HP 635154 002320774
Wideford Hill 58 59.3N 003 01.5W HY 412117 002320781
Needles 50 39.7N 001 34.6W SZ 298848 002320775
Newhaven 50 46.9N 000 03.0E TQ 446001 002320776
Selsey 50 43.8N 000 48.2W SZ 845930 002320744
Butt of Lewis 58 30.8N 006 15.7W NB 519663 002320715
Forsnaval 58 12.8N 007 00.4W NB 061359 002320738
Melvaig 57 50.6N 005 46.9W NG757900 002320717
Rodel 57 44.9N 006 57.5W NG 053839 002320716
Hartland Point 51 01.3N 004 31.3W SS 231275 002320778
Mumbles Hill 51 34.2N 003 59.1W SS 624875 002320743

97
Severn Bridge (2) 51 36.7N 002 38.8W ST554905 002320777
Bawdsey 51 59.6N 001 24.6E TM 341382 002320795
MCA Thames 51 51.2N 001 16.8E TM 259223 002320779
Langham 52 56.6N 000 57.2E TF985423 002320773
Caister 52 36.5N 001 43.3E TG 521077 002320733
Mablethorpe 53 18.6N 000 15.8E TF509816 002320732
Solent (Daedalus) 50 48.4N 001 12.2W SU561016 002320830

98

4
Published by the Health & Safety Executive 12/19

5
Vessel collision threat detection for offshore oil and gas installations
RR1153
www.hse.gov.uk
There is a potential for major structural damage to offshore installations leading to fatalities and serious injuries in the
event of collision by either a passing or an in-field seagoing vessel. Both categories of collision have occurred on the UK Continental Shelf (UKCS) although to date only significant, rather than catastrophic, consequences have occurred.
Internationally, collisions have occurred that have caused both loss of life and environmental damage. This report considers collision threat detection and updates Research Report RR514 (2006). RR1154 considers the Ship/Platform
Collision Incident Database which was previously described in Research Report RR053 (2001).
Collision threat detection via radar and visual watch keeping is one of the major duties that the Emergency Response and Rescue Vessel (ERRV) crew needs to conduct for monitoring and appraisal of risks to UKCS installations. Detection tools
are subject to a number of limitations and this report investigates technological advancements including: (1) deployment of automated radar detection and tracking
devices to supplement the work of ERRV crews and assist in the overall collision risk management strategy; and (2) the implementation of Automatic Identification System (AIS) equipment in the global marine regulatory system which has
also had an impact on vessel identification and the processes through which an errant vessel can be warned off. Results are discussed in terms of both how they may affect current operations and how they may be adopted in future
to enhance offshore safety.
This report and the work it describes were funded by the
Health and Safety Executive (HSE). Its contents, including any opinions and/or conclusions expressed, are those of the authors alone and do not necessarily reflect HSE policy.