RR 523 The effect of road roughness (and test speed) on ... · The effect of road roughness (and...
80
The effect of road roughness (and test speed) on GripTester measurements April 2013 DJ Wilson and W Chan, Department of Civil and Environmental Engineering, University of Auckland B Jacobsen, Clearway Consulting Ltd NZ Transport Agency research report 523
-
Upload
truongquynh -
Category
Documents
-
view
216 -
download
0
Transcript of RR 523 The effect of road roughness (and test speed) on ... · The effect of road roughness (and...

The effect of road roughness (and test speed) on GripTester measurements
April 2013
DJ Wilson and W Chan, Department of Civil and Environmental Engineering, University of Auckland
B Jacobsen, Clearway Consulting Ltd
NZ Transport Agency research report 523

ISBN 978-0-478-40748-8 (electronic)
ISSN 1173-3764 (electronic)
NZ Transport Agency
Private Bag 6995, Wellington 6141, New Zealand
Telephone 64 4 894 5400; facsimile 64 4 894 6100
www.nzta.govt.nz
Wilson, DJ1, B Jacobsen and W Chan (2013) The effect of road roughness (and test speed) on GripTester
measurements. NZ Transport Agency research report 523. 80pp.
1 Department of Civil and Environmental Engineering, UniServices Limited, University of Auckland, Private Bag 92019,
Auckland, New Zealand. email [email protected]
This publication is copyright © NZ Transport Agency 2013. Material in it may be reproduced for personal
or in-house use without formal permission or charge, provided suitable acknowledgement is made to this
publication and the NZ Transport Agency as the source. Requests and enquiries about the reproduction of
material in this publication for any other purpose should be made to the Research Programme Manager,
Programmes, Funding and Assessment, National Office, NZ Transport Agency, Private Bag 6995,
Wellington 6141.
Keywords: condition management; GripTester, road roughness, road safety, skid resistance, testing
speed, texture wavelengths.

An important note for the reader
The NZ Transport Agency is a Crown entity established under the Land Transport Management Act 2003.
The objective of the Agency is to undertake its functions in a way that contributes to an affordable,
integrated, safe, responsive and sustainable land transport system. Each year, the NZ Transport Agency
funds innovative and relevant research that contributes to this objective.
The views expressed in research reports are the outcomes of the independent research, and should not be
regarded as being the opinion or responsibility of the NZ Transport Agency. The material contained in the
reports should not be construed in any way as policy adopted by the NZ Transport Agency or indeed any
agency of the NZ Government. The reports may, however, be used by NZ Government agencies as a
reference in the development of policy.
While research reports are believed to be correct at the time of their preparation, the NZ Transport Agency
and agents involved in their preparation and publication do not accept any liability for use of the research.
People using the research, whether directly or indirectly, should apply and rely on their own skill and
judgement. They should not rely on the contents of the research reports in isolation from other sources of
advice and information. If necessary, they should seek appropriate legal or other expert advice.

Acknowledgements
The authors would like to thank the NZ Transport Agency for funding this research, Franklin District
Council and especially Dawn Inglis for their permission for testing on Franklin roads and Greg Morrow of
Opus Consultants Ltd who helped with RAMM data analysis to determine possible sites for testing and
arranged temporary traffic control. Special thanks are also given to Pavement Management Services for the
generous use of their laser profilograph to undertake road roughness and macrotexture measurements of
the test sites.
Acknowledgement is also given to Noel Perinpanayagam (University of Auckland Transportation
technician) for his help in undertaking the GripTester and Dynamic Friction Tester testing and general
advice and help with the University of Auckland Masters Student (Wendy Chan).

5
Contents
Executive summary ................................................................................................................................................................. 7 Abstract .......................................................................................................................................................................................... 9 1 Introduction ................................................................................................................................................................ 11
1.1 Background ................................................................................................................... 11 1.2 Need for research ......................................................................................................... 12 1.3 Research objectives ...................................................................................................... 13 1.4 Scope of the report ...................................................................................................... 13
2 Skid resistance literature ................................................................................................................................... 14 2.1 Road safety, risk and policy ......................................................................................... 14 2.2 The variability of skid resistance ................................................................................. 15 2.3 Terminology ................................................................................................................. 15 2.4 Wet skid resistance ...................................................................................................... 16 2.5 Measuring skid resistance ........................................................................................... 17 2.6 Skid resistance standards ............................................................................................ 18 2.7 Pavement surface texture ............................................................................................ 19
2.7.1 Microtexture .................................................................................................... 20 2.7.2 Macrotexture ................................................................................................... 21 2.7.3 Megatexture .................................................................................................... 22 2.7.4 Relationship between texture and speed ...................................................... 22 2.7.5 Macrotexture measurement ........................................................................... 23 2.7.6 Road roughness .............................................................................................. 23 2.7.7 International Roughness Index ...................................................................... 23 2.7.8 Roughness measuring devices ....................................................................... 24
2.8 Skid resistance measurement devices ......................................................................... 24 2.8.1 GripTester device ............................................................................................ 26 2.8.2 DF Tester ......................................................................................................... 27 2.8.3 Laser profilograph .......................................................................................... 27 2.8.4 Summary of previous research ....................................................................... 28
3 Experimental equipment .................................................................................................................................... 29 3.1 Introduction .................................................................................................................. 29 3.2 GripTester data collection ............................................................................................ 29
3.2.1 Standard test procedures ............................................................................... 29 3.2.2 Calibration procedures ................................................................................... 30
3.3 Sensotec accelerometer ............................................................................................... 31 3.3.1 Basic accelerometer theory ............................................................................ 31 3.3.2 Sensotec low frequency accelerometer .......................................................... 32
3.4 Dynamic Friction Tester ............................................................................................... 32 3.5 Laser profilograph ........................................................................................................ 32
4 Experimental methodology ............................................................................................................................... 34 4.1 Introduction .................................................................................................................. 34 4.2 Objectives of the research ........................................................................................... 34 4.3 Test site selection procedures ..................................................................................... 34

6
4.3.1 Data capture setup .......................................................................................... 35 4.3.2 Site locations ................................................................................................... 36 4.3.3 Site visit ........................................................................................................... 38
4.4 Procedures for testing with the GripTester ................................................................. 38 4.4.1 GripTester setup .............................................................................................. 38 4.4.2 Data output ..................................................................................................... 39 4.4.3 Testing procedures with the GripTester ........................................................ 40
4.5 Procedures for testing with the Dynamic Friction Tester ........................................... 40 4.5.1 Testing points ................................................................................................. 40 4.5.2 Setup of the DF Tester .................................................................................... 40 4.5.3 Traffic control .................................................................................................. 41 4.5.4 DF Tester procedures ...................................................................................... 41
5 Results and discussions ..................................................................................................................................... 42 5.1 Introduction .................................................................................................................. 42 5.2 Grip number variability – part 1 ................................................................................... 42
5.2.1 Data group division ......................................................................................... 42 5.2.2 Statistical analysis of the data ........................................................................ 43 5.2.3 Data transformations ...................................................................................... 48
5.3 Grip number variability – part 2 ................................................................................... 50 5.4 GripTester and Dynamic Friction Tester ...................................................................... 54
6 Conclusions and recommendations ............................................................................................................ 57 6.1 Conclusions................................................................................................................... 57 6.2 Recommendations ........................................................................................................ 57
7 References ................................................................................................................................................................... 58 Appendix A: GripTester device ..................................................................................................................................... 61 Appendix B: Dynamic Friction Tester device ....................................................................................................... 62 Appendix C: Accelerometer calibration ................................................................................................................... 64 Appendix D: Processing and analysing raw data .............................................................................................. 67 Appendix E: Processed test data results ................................................................................................................ 73 Appendix F: Output code from ‘R’ statistical package ................................................................................... 76 Appendix G: Glossary ......................................................................................................................................................... 78

7
Executive summary
It has been well proven that as the skid resistance of a road surfacing decreases, the number of loss-of-
control crashes in wet conditions increases, causing road death and injuries. However, the management of
skid resistance of road surfacing continues to be difficult due to the inherent variability involved in skid
resistance measurements and the interpretation of results. This research was an investigation and analysis of
just one of those variable factors; being the effect road roughness has on skid resistance measurement
undertaken using the GripTester device. There are a number of other continuous skid resistance
measurement devices used in New Zealand and internationally and the findings of this research do not
necessarily relate to those devices. The most commonly known is the SCRIM device that the New Zealand
Transport Agency (NZTA) has used to measure skid resistance annually on New Zealand state highways since
the development of a skid resistance policy to reduce wet skid resistance related crashes (T/10). Some local
territorial road authorities have used the SCRIM, ROAR or GripTester continuous measurement devices.
The data required for the research was collected by field testing on specially chosen sites in the Franklin
and Waipa districts that had varying road roughness. The methodological steps used to collect GripTester
skid resistance data from the chosen sites is outlined below:
1 Identify appropriate test sections
The identification of test sections required an initial desk study. The sites were mainly identified and
chosen from the Franklin District Council road asset and maintenance management (RAMM) database
although a few were undertaken in the Waipa district in the Waikato region. Test sections were selected
according to five levels of predefined National Association of Australian State Roads Authority (NAASRA)
roughness bands and three macrotexture levels.
2 Site validations
In order to determine whether the roughness and texture data of the selected sites obtained from the
RAMM database reflected present in-field conditions, a field survey was undertaken of each of the sites
using the Pavement Management Services laser profilograph. This field survey measured the actual road
roughness and the macrotexture of the sites prior to skid resistance testing with the GripTester.
3 Field tests
Each section underwent a series of GripTester runs at four varying speeds. Data collected at each test
section included the grip number (GN) measurements at both 1m and 10m averaged intervals. The 10m
averaged surveys reflected the normal operation of the GripTester as used in network and project surveys.
A Dynamic Friction Tester (DF Tester), a stationary skid resistance measurement device, was also used in
the field tests at specific locations to eliminate speed and road roughness effects that might have affected
the GripTester device. The results obtained from the DF Tester were used for correlating against the
GripTester results at various vehicle towing speeds.
4 Data analysis
The collected data resulted in a variety of skid resistance values in terms of GN for different speeds for
each test section. The relationship between the measured coefficient of friction and the test speed for
each of the test sections was then developed. Relationships between the skid resistance and the road
roughness as well as the surface textures were also determined during data analysis.

The effect of road roughness (and test speed) on GripTester measurements
8
5 Research summary and conclusions
The research results found that the DF Tester as a stationary device was highly repeatable with a coefficient
of variation ≤2.5%. It was also shown to be a very useful calibration device for continuous friction
measurement devices such as the GripTester. The GripTester can also be reasonably repeatable with a
coefficient of variation of typically ≤6.0% between multiple test runs when the test device and measuring tyre
have been appropriately conditioned. The coefficient of variation can increase up to approximately 11% on a
relatively short road section if the tyre is not conditioned prior to a test site survey.
The research using a GripTester found some unexpected results that did not concur with accepted theory
(eg that as measurement speed increases, skid resistance reduces and at a greater rate when the
macrotexture is high in comparison to sections with low macrotexture). This research has raised some
further questions about the behaviour of skid resistance and the various measurement devices used to
determine a measured coefficient of friction. The findings are however limited to the GripTester device
and some aspects do not apply to other skid resistance measurement devices (eg SCRIM and ROAR). In
summary, the following conclusions have been drawn from this research:
• There is a satisfactory linear model of the relationship of GN to the explanatory variables texture,
testing speed and road roughness. Test speed and texture would appear to have an impact on the
measurement of the GN but surprisingly road roughness does not appear to have an influence on the
GN as has been hypothesised. More needs to be done in this area to better model the factors
influencing the GripTester results.
• Generally, at lower test speeds (less than 75 km/h) the GN (on individual road sections) may not be
dependent on test speeds, but this depends on the nature and condition of the road surfaces being
tested.
• A relationship between the GN obtained from the GripTester and the coefficient of friction obtained
from the DF Tester was found to be independent of the test speed of the GripTester on the test site. A
good correlation was found between the GripTester and the DF Tester on this site.
• In view of these findings, it can be safely considered that the GN is influenced by the test speed and
that texture is also a minor factor (to be further investigated). However this research showed that the
GN as measured by the GripTester is not significantly influenced by road roughness up to 170
NAASRA counts per km and at testing speeds lower than 75km/h.
Further research is required with a greater sample population and site matrix with various skid resistance
measurement devices to determine whether some of the unexpected results found during the research
were primarily due to the small population size or alternatively due to the GripTester measurement device
alone.
Abstract
9
Abstract
This research investigated the effect of road roughness, macrotexture and testing speed on GripTester
measurements.
Field tests were conducted by the GripTester at various test speeds on sites with varying road roughness
in South Auckland. The variables – road roughness, texture and test speeds – were measured and plotted
against each other along with grip number (GN) as obtained from the GripTester. Tests with the DF Tester
were also carried out at one site and directly correlated with GripTester results at various towing speeds. It
was found the GN might not be dependent on test speeds while testing at speeds lower than 75km/h;
however, an inverse relationship occurred at higher speeds, on a limited number of test sites. Road
roughness was found to have no effect on GripTester measurements and texture appeared to be a minor
factor.
In conclusion, the explanatory variables on the GN are test speed and perhaps texture. However,
unaccounted factors that are specific to test sites proved to have some degree of effect. Future research
recommendations include searching for better controlled test sites and larger samples to clarify the effect
of texture on the GN and to expose unidentified factors that can influence GripTester output.

The effect of road roughness (and test speed) on GripTester measurements
10

1 Introduction
11
1 Introduction
The aim of this research project was was to develop a better understanding of the effect longitudinal road
roughness has on skid resistance measurement and more specifically on the GripTester measuring device.
The research also considered the effect of the GripTester testing speed on skid resistance measurements
using various levels of road roughness.
1.1 Background
Crash database statistics show that each year in New Zealand there are approximately 12,000 fatal and
injury reported crashes and 23% of these crashes occur in wet and/or misty weather. In wet weather
conditions, the presence of water on the pavement surface increases the risk of skidding with the result
that approximately 1.6 times more fatal and injury crashes occur in wet conditions than in dry conditions
on New Zealand state highways (Dunlop 2003).
Friction is defined as the resistance to motion between two surfaces in contact; in this case the vehicle tyre
and the road surface. Its magnitude is expressed by the coefficient of friction which is a ratio of two
forces, one parallel to the road surface and tyre contact area that is opposed to vehicle motion (the friction
force) and the other perpendicular to this surface of contact (the normal force generated from the vehicle
load). Water on the pavement surface acts as a lubricant that significantly reduces the coefficient of
friction between the tyres and the ‘texture’ of the aggregate surface. The term ‘wet skid resistance’ is
used to characterise the contribution the road surface makes to the available level of surface friction in
wet conditions.
To reduce the higher crash rates that occur in wet weather conditions, it is necessary to maintain differing
skid resistance levels for various traffic site categories based on an understanding of the relationship
between increasing crash rates (risk) and decreasing levels of skid resistance. In New Zealand, skid
resistance standards on state highways (NZTA T/10 specification 2010) are set out as a guide to highway
engineers for paving new road surfaces as well as to producing an efficient and effective pavement surface
maintenance routine. The standard of skid resistance levels varies between different road site categories
based upon equalising the crash risk across the road network. For road sections that are classified as high
risk, the standard intervention level (IL) of required skid resistance will be significantly higher than for low-
risk road sections. Pavement surfacing properties such as the textural wavelengths at the macro- and
micro-levels bear an important role in providing adequate skid resistance.
Surface texture that contributes to skid resistance is generally divided into two categories: microtexture
and macrotexture. Microtexture is defined as the harsh features of each individual aggregate chip that is
not generally visible to the naked eye, or features that can only be seen by a microscope. Texture on this
scale (less than or equal to 0.5mm) is provided by the crystalline structure of the aggregate particles and
how it is cemented into the particle matrix in the upper layer of the surfacing aggregate material.
Macrotexture refers to the wavelength features between 0.5 and 50mm and is determined by the size,
grade and spacing between the aggregates. It is the surface characteristic perceived by someone standing
on and looking at the road surface.
Road roughness is defined as the larger wavelength irregularities of the road surface: the sizes of
irregularity are between 0.5m to 50m. These wavelengths are usually less significant for the generation of
surface friction, except that the interaction between longer wavelength features and vehicle suspension (or
in this case the GripTester skid testing device) influences the contact between the road surface and vehicle
tyre.

The effect of road roughness (and test speed) on GripTester measurements
12
1.2 Need for research
This research project sought to quantify the effect that road roughness wavelengths had on the GripTester
(a device commonly used in New Zealand and internationally to measure the coefficient of friction
predominantly on airport runways and road pavement surfaces). It should be noted here that the NZTA
does not currently use the GripTester for network surveys on state highways although it has been used for
many research projects and project level surveys on both state highways and local roads.
Research studies conducted by Roe and Hartshorne (1998) and Wambald et al (1995) and others have
shown that vehicle speed affects the available skid resistance. The faster the vehicle is travelling the less
contacting force between the vehicle tyres and the pavement surface and hence, the measured coefficient
of friction will reduce significantly. The rate of reduction is dependent upon the macrotexture of the
pavement surface and the relationship between skid resistance levels and travelling speeds is typically a
negative exponential relationship with increasing speed.
A variety of measuring devices have been designed and are available to measure the friction of the road
surface. The ones most familiar in New Zealand include: the SCRIM machine (sideway-force coefficient
routine investigation machine), GripTester, RoAR, British Pendulum Tester and the Dynamic Friction Tester
(DF Tester) – refer to appendices A and B for descriptions of the GripTester and DF Tester used in this
research. Most of the devices have quite different design methodologies and measurement characteristics
and therefore the calculated output coefficient of friction will differ from one device to another. All the test
devices are similar in that they use rubber compound sliding to some degree either in-line or at an angle
to the vehicle direction to calculate the coefficient of friction. Therefore, all test devices provide an
indication of the level of skid resistance and in theory the output from one device can be correlated to
another device or to an International Friction Index (IFI) (Wambald et al 1995). However, the correlation
relationships have been proven to be largely unreliable for road surfaces in New Zealand and in many
other countries.
The GripTester is widely used around the world to obtain surface friction measurements on airport
runways, road pavements, pedestrian walkways and for research purposes. It is a three-wheeled trailer
(one test wheel and two bogey wheels) that can be towed behind a vehicle with a water delivery system.
The GripTester is a braked wheel method that measures the drag force and load force on a single
treadless American Society for Testing and Materials (ASTM)-specified rubber test tyre of 254mm diameter
during braked skidding at approximately 15% of the survey speed.
A previous research study in New Zealand conducted by Cenek et al in 2004, although limited in data,
reported on the sensitivity of the GripTester to various road texture wavelengths (microtexture and
macrotexture). This research extended those findings to consider the effect of increasing longitudinal
road roughness and testing speed on GripTester measurements. Furthermore, skid resistance
measurement testing with the GripTester appears to show that road surfaces with significant road
roughness or ‘bumps’ adversely affect the measured coefficient of friction (refer to figure 1.1 which clearly
shows the bumps from a change of seal). This research investigated whether these effects on skid
resistance measurement are due to the speed and suspension system of the GripTester device rather than
actual skid resistance changes.

1 Introduction
13
Figure 1.1 Effects of road roughness on GripTester measurements
1.3 Research objectives
The primary goal of this research was to understand whether skid resistance measurements obtained from
the GripTester device testing at various speeds were affected by increasing road roughness. The
GripTester is a relatively light device (85kg total weight) in comparison with the commonly known SCRIM
truck measurement device that hydraulically controls a 200kg load on each testing tyre.
The specific objectives of the research programme were to:
• quantify the effect of longitudinal road roughness on the GripTester device
• measure the effects of surface texture on the results produced by the GripTester in comparison with
the DF Tester
• measure the effects of travelling speeds on the results obtained by the GripTester, on various road
surfaces with various levels of road roughness.
The research outcomes would allow road controlling authorities (RCAs) and consultants to specify skid
resistance testing protocols to ensure measurements undertaken by the GripTester are least affected by
external variables (eg speed and road roughness). This in turn will provide RCAs with greater confidence
in the GripTester test measurements when the testing protocols have been followed.
1.4 Scope of the report
This report presents the results of research on the effect of road roughness and testing speed on
GripTester measurements. Chapter 2 discusses the relationship between crash risk and skid resistance,
the factors that affect skid resistance measurement and the textural wavelengths associated with skid
resistance including a summary of road roughness. Chapter 3 describes the equipment and chapter 4
describes the experimental design methodology used in the field testing. Chapter 5 describes the data
processing methods used to summarise the raw data results from field testing and chapter 6 discusses the
results of the analysis. Chapter 7 provides conclusions and recommendations from the research.
0.3
0.4
0.5
0.6
0.7
0.8
0.9
1
1.1
1.2
0 200 400 600 800 1000 1200 1400 1600 1800
Running Distance
Grip
Num
ber
0
10
20
30
40
50
60
Spee
d (k
ph)
GN run1
GN run2
GN run3
GN run4
SITEEXTENTSGN run5
AVE (-1) Inc
Speed run1
Speed run2
Speed run3
Speed run4
Speed run5
Effects of a
change of seal

The effect of road roughness (and test speed) on GripTester measurements
14
2 Skid resistance literature
2.1 Road safety, risk and policy
There is no doubt that as the skid resistance of a road surface decreases, the crash rate increases. This
significant road safety issue is amplified when the pavement is wet because the contact between the tyres
and the road is reduced and water acts as a lubricant. The resistance to skidding of a road surface is
therefore one of the fundamental requirements that highway engineers must consider in pavement design
to provide a safe travelled surface. Whether the surfacing is the wearing course of an asphalt mix or a
chipsealed surfacing, the skid resistance is governed by the properties of the aggregate.
Different sites present different risks, and consequently, in an attempt to obtain a relatively constant risk
of a wet skidding crash across a road network, road agencies (initially in the UK) attempted to align the
skid resistance of the site with the risk or need for heavy braking. From this, a number of site categories
describing the situations found on a road network and the minimum specified level of skid resistance for
each category, have been developed. Figure 2.1 demonstrates in an idealised form how the minimum
desirable standards of skid resistance for various road site categories have been established based upon
the risk of a skidding crash. A high minimum standard of skid resistance at ‘high-risk’ areas (eg the
approaches to traffic signals) is specified which is then progressively reduced to relatively low levels on
straight and event free locations (eg on a dual carriageway).
Figure 2.1 Crash risk, road site category and standard of skid resistance – idealised from Rogers and Gargett
(1991)
Note: * denotes the desirable minimum level of skid resistance standard for each road site category before the crash
risk significantly increases.
The state highway standard is specified in NZTA T/10 (2010) and was first implemented in earlier versions
in 1995. New Zealand has a high percentage of hilly to mountainous terrain and is geologically young.
Therefore, the roads are characterised by curvilinear geometrical alignments, poor local aggregates and
variable environmental/climatic conditions compared with many other countries. Consequently, loss-of-
control crashes are over represented.
Transportation engineering professionals must do better as current rates of road crashes and specifically
loss-of-control crashes that result in road fatalities in New Zealand (while comparable to other OECD
countries), are at levels that are politically and socially unacceptable. The Ministry of Transport road safety
targets to 2020 and 2040 are understandably challenging and will not be realised without significant
Skidding Crashes per 100MVKs
120
0
0.1 0.3 0.5 0.7Skid Resistance μ (MSSC)
80
Approaches to Traffic Signals
Approaches to Traffic SignalsMinor
JunctionsMinor Junctions
Dual CarriagewayDual CarriagewayDual Carriageway
****
**

2 Skid resistance literature
15
improvements/changes to current practices. The management of skid resistance sits within one of the
four pillars of the recently adopted ‘safe system’ approach. To do better in this one pillar, the factors that
vary the measured skid resistance over time must be better understood to enable appropriate risk
management practices to be incorporated into current policies. Road asset managers need to be able to
have confidence in the results from measurement devices so they can better predict when the skid
resistance of an existing surfacing is likely to fail and plan accordingly for future treatments.
2.2 The variability of skid resistance
The skid resistance available at any particular time, either to the road user or as tested dynamically by a
friction tester, depends upon many variables. It is not constant nor is it easily predictable over time. The
variables that can affect the level of skid resistance and their inter-relationships are many and complex.
They can be grouped under four main categories:
1 Surface aggregate factors (eg geological properties of the aggregate, surface microtexture and
macrotexture, chip size and shape and type of surfacing)
2 Load factors (eg surface age, traffic intensity, composition and flow conditions, and road geometry)
3 Environmental factors (eg water film thickness, surface contamination, temperature, seasonal and
short-term rainfall effects)
4 Vehicle or skid resistance measurement device factors (eg vehicle or test device measurement
speed, angle of tyres, wheel slip ratio, tyre characteristics, tread depth and patterns).
This research targeted a better understanding of the fourth category, the dynamics of a measurement
device (the GripTester) on its associated skid resistance output measurement data. The research
considered the GripTester measurement device as a ‘vehicle’ to determine whether the ‘vehicle’ device
itself (eg the device weight and suspension system) is affected by increasing road roughness and test
operating speed. Other effects are discussed in detail in Wilson (2006).
2.3 Terminology
Skid resistance refers to the extent that a surface contributes to friction and usually refers to wet skid
resistance. Skid resistance can be predicted by sliding some rubbery material over a section of wet surface
and measuring the force developed against the movement (O’Flaherty 2002).
Road ‘surface friction’ and ‘skid resistance’ are often used interchangeably by those involved with the
management and maintenance of road networks. Cenek et al (2003) state there is a subtle difference
between the two variables.
Road surface friction refers to the resistive force that is developed between a specific road surface under
particular conditions. As the frictional force provided by the tyre/road combination is proportional to the
load applied, it is normalised by the load to give a coefficient of friction (CoF).
The CoF is affected by a large number of variables as outlined above. In general terms, when a surface is
dry, the CoF is normally high and adequate for most normal vehicle manoeuvres. However, when the road
surface is wet, the CoF decreases significantly and becomes more dependent on the condition of the tyre
and the road surface.
‘Skid resistance’ is the term used to describe the contribution the road makes to the development of
tyre/road friction. It is essentially a measurement of the CoF obtained under standardised conditions in
which various variables are controlled so that the effects of the road surface characteristics can be

The effect of road roughness (and test speed) on GripTester measurements
16
isolated. Skid resistance, as with surface friction, is high in dry conditions and so the term skid resistance
is almost always used in the context of wet road surfaces.
‘Drag factor’ is a term that is often used in accident reconstruction work and exists when two surfaces are
in contact and move relative to each other. When gravity supplies the normal force, the term is
synonymous with the CoF if the two surfaces are horizontal. The drag factor will differ from the CoF when
measured on inclines as the drag factor alone measures the combined influence of the CoF and the slope
of the incline. By measuring on an incline, the results will reflect the effect of the incline in overcoming the
friction forces between the two surfaces. This could be important in crash reconstruction because it will
provide a direct measure of the actual drag factor at work, a slope compensated static or ‘dynamic drag
factor’. It is common practice in crash reconstructions for a CoF to be used in conjunction with a
‘correction grade drag factor’ in order to estimate the true drag factor (Pazzaglia and Nelson 1993).
2.4 Wet skid resistance
Wet skid resistance will increase the risk of skidding between the tyres and road surface. This is due to the
fact that water acts as a lubricant and will decrease contact between the tyre and the road surface,
therefore it is important for the tyre to break through the film layer of water to increase the contact
between the tyre and the road surface – even very thin water films can greatly reduce friction.
There are two components of rubber tyre friction; adhesion and hysteresis. Adhesion friction is when the
tyre rubber is locally bonded to the surface whereas hysteresis friction is caused from the surface
projections deforming the tyre. Normally in dry situations, adhesion friction is greater than hysteresis and
vice versa in wet situations (Wilson 2006).
Hydroplaning results when a vehicle travels across a wet surface at a speed which does not give the tyre
sufficient time to channel the moisture away from the centre. Consequently, the tyre loses contact and
therefore traction to the pavement surface (Davis 2006) (refer to figure 2.2).
Figure 2.2 Hydroplaning condition (Davis 2006)
As speed increases, the amount of water built up in the centre of the tyre increases also. Viscous
conditions can also be referred to as partial hydroplaning; this condition can also occur at low speeds
when the tyre begins to lose contact with the pavement surface. During dynamic conditions (full
hydroplaning), the vehicle is usually travelling at higher speeds and causes the tyre to lift off from the
pavement (refer to figure 2.3), leaving no contact with the surface. At this stage braking and cornering
have very limited control (Wilson 2006).

2 Skid resistance literature
17
Figure 2.3 Illustration of normal, partial and full hydroplaning (Davis 2006)
2.5 Measuring skid resistance
The measurement of skid resistance on the pavement surface enables highway engineers to predict safety-
related issues on wet pavements and helps in the setting of maintenance priorities for road systems. This
data is helpful for the effective management of road system budgets and the gathering of condition
information on the pavement properties for preparing appropriate standards. The primary purpose is to
reduce crash rates especially in wet conditions (Elsenaar et al 1977).
Each year, there are approximately 300–350 highway fatalities and more than 10,000 injury crashes in
New Zealand (MoT 2012) with approximately 20% – 25% of these due to wet weather loss-of-control
crashes. It is important to remember that incidents on the highway rarely have a single contributory factor
and are defined as being ‘rare, random and multifactor events where the driver has failed to cope with
their environment’ (Land Transport NZ 2004). Human, vehicle and other road environment factors and
their interactions need to be considered, meaning that no simple method exists for defining, in terms of
skid resistance, a ‘safe’ or a ‘hazardous’ surface, or a skid resistance value at which a site automatically
transforms from ‘safe’ to ‘hazardous’ (Austroads 2005).
The casual factors are therefore most commonly multi-factored and include not only road environment
factors such as skid resistance, but also the driver and to a lesser extent the vehicle. From previous
research studies, it is evident that the geological and material performance properties, the road geometry,
design speed and how this relates to the approach operating speeds, the pavement surfacing type,
construction quality, maintenance treatments, practices and strategies used, and the traffic volumes,
especially heavy commercial vehicle (HCV) volumes, all affect the rates of polishing (deterioration) of
measured skid resistance and are therefore key factors that need careful monitoring to prevent increasing
loss-of-control crash rates. For this reason, most countries now have risk-based skid resistance standards
for various sections of the highway environment for national or trunk roads. These standards focus mainly
on the choice of aggregates, HCV volumes and the geometric characteristics of the road section.
Regular maintenance, high-quality treatments and strict standards can offer the basis to maintain certain
levels of skid resistance. However, to achieve sufficient and affordable skid resistance, it is necessary to
make good use of local materials, the workmanship of contractors and the experience of the highway
engineers (Elsenaar et al 1977). Many researchers (eg Hosking 1976 and 1992; Roe and Hartshorne 1998;
Rogers and Gargett 1991; Henry 2000) reported that the reduction of skid resistance on a highway would

The effect of road roughness (and test speed) on GripTester measurements
18
lead to a significant increase in crash rates. Future research must consider how what is termed ‘marginal’
aggregate can be modified to perform adequately in-field to resist aggregate ‘polishing’. Setting and
maintaining appropriate levels of skid resistance based on crash risk on the road network will allow the
appropriate prioritisation and optimisation of road funds and the management of maintenance treatments
and activities to enable a safer and more efficient and effective transport system. To effectively manage
this system requires a good understanding of the factors that cause change in skid resistance and regular
continuous skid resistance condition testing of road sections. These tasks require professional experience
and expertise to routinely monitor the condition of the roads, identify the deficient elements of the
network, prioritise and programme the deficient elements for treatment and select appropriate warning or
interim measures when deficiencies cannot be corrected immediately.
2.6 Skid resistance standards
A relationship has consistently been found between skid resistance and wet road condition crash rates and
this is clearly demonstrated by crash rates falling following treatments to improve skid resistance. This
established relationship can create a desire to provide a uniformly high level of skid resistance across an
entire road network. However, this would prove to be prohibitively expensive, unsustainable in terms of
resource usage, largely unnecessary and would not generate the cost benefits associated with a better and
more targeted strategy. Accordingly, Austroads (2005) states:
A common theme of historical, and many current, strategies for managing skid resistance is
the equalisation of crash risk across a road network by maintaining appropriate levels of skid
resistance at all locations, based on site characteristics. These can be grouped into nominal
site categories. This approach assists in ensuring that the provision of high friction surface
treatments can be targeted to where they are most needed, such as at intersections, the
approaches to traffic signals and on tight curves.
Giles (1957) from the UK proposed the first comprehensive standards on skid resistance suggesting four
site categories based on requirements for wet skid resistance and a minimum coefficient of friction as
measured by the sideways force coefficient (SFC) device at 30m/h (SFC30). The requirements were based
upon comparisons between SFC data at ‘crash blackspots’ and SFC taken at random on similar sites.
This early standard led to the UK Highways Agency’s (2004) HD 28/94 standard, which has recently been
further revised to incorporate the findings of the crash risk study undertaken by Viner et al (2005). The
main concepts of the earlier standard were confirmed and they remain features of the revised standard
published as HD 28/04 and reported in Sinhal (2005). New developments in the SCRIM device, updated
survey procedures and a rationalisation of the site categories have also been incorporated in the revised
standard and a range of investigatory levels for each site category has been introduced.
Importantly, the revised standard highlights the importance of engineering judgement in setting
appropriate investigatory levels (ILs) for each site and in conducting site investigations to determine those
sites most likely to deliver improvements in crash risk as a result of providing better skid resistance. The
flexibility to undertake these assessments was contained within the previous standard; however,
experience from implementation had indicated that this part of the policy was not being applied robustly
in practice. Sinhal (2005) reports that:
A major feature of the new standard is the greater range and detail of the advice included to
guide those responsible for providing adequate skid resistance in the application of the
standard. Clear advice and guidance is provided in setting investigatory levels and carrying
out investigations to determine if treatment is required.

2 Skid resistance literature
19
A higher or lower IL than indicated in the standard may be assigned if justified by the observed crash
records and local risk assessment. New Zealand’s skid resistance standards are based on those adopted
by the UK, with some adjustments made after a 1997 analysis of wet-road skidding injury crashes in
New Zealand during the period 1990–1994 (Transit NZ and Roading NZ 2005).
The current Specification for state highway skid resistance management (T10 specification) (NZTA 2010)
specifies threshold levels (TLs) for each site category; these are set 0.10 below the level of the IL. The IL is
set at a level that should trigger an onsite data investigation, and if required, treatment should be
undertaken within the next financial year. The TL is set at a level that is intended to trigger an immediate
response and some form of action at the site starting with a minimum treatment of advisory signing
(slippery when wet signs).
The T/10 specification incorporates the latest revisions of the UK Highways Agency’s HD 28/04 standard
in that it allows the IL to be modified (lower or higher) based upon other factors such as historical crash
rates. The 2010 version still relies heavily on the polished stone value (PSV) equation to predict a required
skid resistance level and an aggregate chip that will meet this requirement throughout the surfacing life,
although, it does allow alternative predictive methods for the selection of aggregates where in-field
performance can be demonstrated. The NZTA policy defines skid resistance for five main site categories of
IL and TL, using equilibrium SCRIM coefficient (ESC) that is the SCRIM coefficient (SC) adjusted within and
between year variations to standardise wet-road skidding crash risk across the network (Cook et al 2004).
2.7 Pavement surface texture
Each feature of the pavement surface performance is primarily or partially determined by the surface
irregularities on different wavelength scales. Traditionally, surface irregularities can be classified into
three main categories: microtexture, macrotexture and longitudinal road roughness. There has been
recent research relating performance and pavement characteristics which has created another category for
an unchecked range or irregularities. The new category is called megatexture with the wavelengths
between 50mm and 500mm (Descornet 1989).
Figure 2.4 shows the deformation of a tyre travelling over various road profiles with irregularities of the
same amplitude but different wavelengths. As surface irregularities increase it may bind to cause dynamic
effects that generate vibrations inside the vehicle, noise due to contact between the tyres and pavement
surface, and higher fuel consumption due to additional rolling resistance (Descornet 1989).
Figure 2.4 Deformation of tyre when rolling on a profile with a = length of tyre footprint, h = mean profile
depth, λ = profile wavelength (Descornet 1989)
Micro-texture: λ < 0.5mm
Macro-texture: 0.5mm < λ < 50mm
Mega-texture: 50mm < λ < 500mm
Roughness: 0.5m < λ < 50 m

The effect of road roughness (and test speed) on GripTester measurements
20
Figure 2.5 Performance features of road pavements against wavelength ranges of surface irregularities that
influence them (Descornet 1989)
Figure 2.5 shows another wavelength diagram illustrating the range of wavelength of surface irregularities
and the parameters that will be affected.
The irregularities of the pavement surface will subject the sprung and unsprung masses of the vehicle to
vertical oscillations that cause the loads exerting onto the pavement to vary by 10% – 20%. The
relationships between loads exerted and the damaging effect is non-linear and the damaging effect caused
by the variation could be up to a 30% – 40% increase in the number of equivalent standard axles. This
effect will lead to an accelerated deterioration of the pavement (Descornet 1989; de Pont and Pidwerbesky
2000).
2.7.1 Microtexture
Microtexture can be defined as any feature on a road stone that is smaller than the stone itself and ranges
from roughness or harshness that can be seen by the naked eye down to roughness that can only be seen
by an electronic microscope (Stevenson 1997). Microtexture determines the level of skid resistance by
providing sliding contact resistance; this is the dominant factor in skid resistance in dry and low speed
conditions (Wilson 2006). It also helps in wet conditions as microtexture breaks the film of water allowing
some adhesion to the surface.
Aggregate without any harshness is considered to be undesirable and can easily cause loss-of-vehicle
control leading to road crashes. The skid resistance on a chipseal road depends mainly on the
microtexture of the aggregate. Microtexture can be worn away by high proportions of heavy commercial
vehicles in the traffic mix, by vehicle tyres polishing the aggregate surface (Stevenson 1997).
Recent research in New Zealand has focused on understanding the mechanisms for the polishing of
aggregates as this is important for road safety as well as for economics. Research studies have shown that

2 Skid resistance literature
21
skid resistance restoration and maintenance programmes can significantly reduce crashes each year in
New Zealand. Therefore, reducing the rate of microtexture deterioration will result in significant road user
social cost savings for roading authorities (Stevenson 1997).
The resistance to aggregate polishing has traditionally been measured in the laboratory in terms of the
PSV test although more recently (both in New Zealand and the UK) the PSV test method has been shown to
be a poor indicator of in-field skid resistance performance. Other methods have been developed including
the Auckland Pavement Polishing Device and Wehner Schulze device which show promise in predicting the
aggregate’s ability to resist polishing (Wilson 2006; Wilson and Black 2008; Dunford 2008). The
microtexture can be measured indirectly or directly by methods such as: ‘the indirect friction
measurements at low slip speeds’ (eg side force routine investigation coefficient (SCRIM), the GripTester,
RoAR and the DF Tester), ‘subjective assessment using pictures’ and ‘directly by measurement using optic
devices’ (Do et al 2000).
Previous research studies on measuring microtexture parameters are defined from the contact
mechanisms between wet roads and vehicle tyres. The parameters defined are size, density and shape of
the aggregate chips. The ability to resist polishing over time is more complex as it depends not only on
the harshness of the aggregate (initial microtexture) but on the geological source properties, the grain
sizes and the toughness of the aggregate minerals and the degree of cementation of the clastic matrix
between minerals and grains (Wilson and Black 2009).
2.7.2 Macrotexture
The range of size for macrotexture is between 0.5mm and 10mm and macrotexture provides escape paths
for the water and for hysteretic friction to develop, therefore a minimum macrotexture around 0.8mm is
preferable at high speeds. Minimum macrotexture levels are appropriately specified in NZTA T/10 (2010).
Figure 2.6 shows the relationship between megatexture, macrotexture and microtexture. It also shows
that macrotexture is determined by size, grade and spacing between the aggregate chips for asphalt
layers and chipseal surfaces.
Figure 2.6 Relationship between megatexture, macrotexture and microtexture

The effect of road roughness (and test speed) on GripTester measurements
22
2.7.3 Megatexture
Previously methods and devices for measuring the various wavelength textures were limited. Megatexture
is out of the normal measuring range and therefore could not be easily measured. However, with the new
generation of contactless profilometers such as laser profilometers, megatexture is now easily measured
(Descornet 1989). Thus, it is possible to optimise road pavement performance while meeting most of the
requirements. Some surface wavelength variations must be present and yet others are undesirable.
Megatexture can be caused by deterioration of the road, examples of such deterioration are alligator
cracks and spalling, small potholes, plucking and scabbling. However, it can also exist in newly built
roads, as it can be a byproduct of the way macrotexture is achieved: ‘a pavement surface with two chip
sizes, a chip bituminous’ [chip seal or surfacing dressing] ‘or cement concrete’ or ‘a stripping concrete’
(Descornet 1989). This megatexture can be a result of tyres contacting irregular areas of the surface due
to a lack of homogeneity in the macrotexture.
2.7.4 Relationship between texture and speed
Microtexture determines the maximum skid resistance achievable at low speed and is the dominant factor
in dry and low speed conditions. Macrotexture on the other hand establishes the rate of reduction in skid
resistance as speed increases. As shown in figure 2.7, as the vehicle speed increases, the skid resistance
the vehicle experiences will decrease in a negative exponential manner. If the macrotexture is rough, the
rate of reduction in skid resistance due to speed will not be as rapid (Wilson 2006). It is therefore
necessary to have harsh microtexture and rough macrotexture in high-speed areas whereas in low-speed
areas it was previously thought that the road’s microtexture harshness was sufficient and macrotexture
less important. This was especially so as high macrotexture also causes an increase in noise propagation
and is therefore less desirable in urban residential areas (a significant adverse environmental factor).
Figure 2.7 Relationship between textures and speeds (PIARC World Road Association 2003)
However, Roe and Hartshorne (1998) conducted research with a locked-wheel skid tester over a range of
speeds between 20 and 130km/h that concluded macrotexture still has an impact on skid resistance
levels at speeds as low as 50km/h, which is similar to the situation shown in figure 2.7 (ie the difference
between A and C or B and D at a speed of 50km/h respectively).

2 Skid resistance literature
23
2.7.5 Macrotexture measurement
Continuous macrotexture measurements are now predominantly undertaken by laser texture
measurements usually described as the mean profile depth (MPD). Alternatively the volumetric sand patch
test method can be used to determine macrotexture at a specific location.
2.7.6 Road roughness
After the development of the International Roughness Index (IRI) the term ‘roughness’ has been typically
used to refer to measuring the riding qualities of the surface itself as well as the IRI roughness
measurement (Prozzi 2001). However, the riding quality is defined here as pavement performance as
perceived by the user, while the roughness will be referred to as the longitudinal unevenness of the road
surface as measured in terms of IRI or NAASRA counts/km.
The roughness of the pavement is one of the indicators of pavement structural performance as it directly
affects the way in which pavements serve the road user. The pavement roughness may also affect the
driving comfort (riding qualities), vehicle operating costs and safety (Hajek et al 1998). However, this
should not be confused with the harshness or roughness relating to other texture ranges previously
discussed.
2.7.7 International Roughness Index
According to ASTM E867-82A, roughness is defined as ‘The deviations of the surface from a true planar
surface with characteristic dimensions that affect vehicle dynamics, ride quality, dynamic loads and
drainage.’
The IRI is an indicator and a measuring scale for pavement roughness based on the response of a standard
motor vehicle to a single longitudinal profile of the road surface (Hajek et al 1998). IRI was originally
developed in 1986 using the results collected from the International Road Roughness Experiment held in
Brazil in 1982 (Sayers 1995).
The IRI has now become a well-recognised standard for measurement of pavement roughness globally.
However, there is a wide variety of alternative devices used for measuring road profiles; these vary from
hand-held dipsticks to high-speed profilers (Perera et al 1996), with each of the devices having their own
measuring units. Hajek et al (1998) evaluated the consequences of switching unique device measurements
to the universal IRI roughness measurements and this has since become an international standard and a
commonly used pavement condition index as it offers many advantages to highway agencies.
The IRI is a geographically transferable and time-stable standard of measurement of road roughness,
because it is directly measurable as the vertical accumulating displacement of a vehicle in m/km. The IRI is
now used by most worldwide agencies and this has encouraged local transportation agencies to use it as
well. The general use of the IRI has led to more equitable allocation of pavement maintenance funding as
the pavement serviceability can now be directly compared between different areas within or between
countries (Hajek et al 1998).
The use of the IRI requires the measurement of actual pavement profiles and is now most usually
measured by laser profilographs. Knowledge of the pavement profile can also be used to help determine
the source of pavement roughness as well as designing an effective maintenance and rehabilitation
treatment programme (Hajek et al 1998).

The effect of road roughness (and test speed) on GripTester measurements
24
2.7.8 Roughness measuring devices
Since the late 1950s, many road profiling devices and roughness indices have been developed and used to
measure and quantify pavement performance. Yet, most of the systems fall into the category of response-
type road roughness measuring systems (RTRRMS) meaning they measure the response of a specific
mechanical device to pavement roughness (Hajek et al 1998). These systems usually required some
conversion by developing transformation equations to the IRI. More recently, many transportation
agencies have changed from using the response-type measurements to laser-based pavement profile
measurements (laser profilographs) which form the basis of the IRI (Hajek et al 1998). In New Zealand, the
RTRRMS were typically the National Association of Australian State Roading Authorities (NAASRA)
roughness meter system prior to laser-based IRI methods. Most road agencies in New Zealand still report
road roughness in terms of both NAASRA counts/km as well as the IRI.
2.8 Skid resistance measurement devices
There is a variety of skid testing equipment/methods available for skid resistance measurement that have
been developed by different countries over the last 50 or more years. However, all of the commercially
available test equipment essentially uses the same principle, that is, to measure the resistance of a rubber
slider or tyre being forced to slide across a wetted road surface, under an applied load (Austroads 2005).
The horizontal friction, traction or force resisting the sliding of the tyre or slider is measured, and the
vertical load is either measured or assumed to be constant.
The frictional force measured depends upon the load that is applied, and therefore the coefficient of
surface friction (sfc, f or µ) is the ratio of the frictional force resisting motion divided by the applied
vertical load.
The range of wet skid resistance measuring techniques available is usually categorised into either:
• in-situ field road surface based devices, or
• laboratory-based measurement devices.
The in-situ road surface (on-site) devices can be further divided into two basic categories: those capable of
measuring continuously over a long stretch of pavement surfacing (continuous friction measurement
equipment devices) and those which measure skid resistance at specific sites (stationary devices). The
continuous techniques can also be categorised as either ‘angled test wheel methods’ or the ‘braked wheel
method’. The braked wheel method can be further subdivided into locked-wheel, variable slip and fixed
slip methods. The most common static devices can either be used at a specific point on a road surface or
in the laboratory. These techniques all measure friction, although with different weightings on the
variables that surface friction depends upon. Figure 2.8 shows a classification of the different skid
resistance measurement methods and subsequent examples of commonly used measurement devices that
all use some form of contact between rubber and the road surface.
Due to their significant differences, a direct comparison between the different device results is not generally
possible. Measured friction is dependent on variable parameters such as slip ratio, testing speed, vertical
load, tyre-rubber composition, tyre tread and inflation pressure and the amount of surface water present.
Some of the systems detect the peak friction and some vary the slip in an attempt to operate around the
peak friction level. Henry (2000) states that each method of measuring friction has advantages. The direct
use of the values produced by one type of measurement relates to a different testing scenario. The locked
wheel method simulates emergency braking without anti-lock brakes (ABS), the sideway-force method

2 Skid resistance literature
25
measures the ability to maintain control in curves, and the fixed slip and variable slip methods relate to
braking with ABS. The variation of friction with slip speed is shown in figure 2.9.
Figure 2.8 Classification of skid resistance measuring contact methods with common examples
Figure 2.9 Relationship of slip speed to friction on a road surface (Austroads 2005)
The PIARC World Road Association International Harmonisation study (Wambold et al 1995) tested 51
various skid testing and texture devices (37 friction measurement and 14 texture measurement devices).
Measuring Friction(microtexture)
Static / PortableMethods - Rubber slider
Dynamic / ContinuousMeasurement Methods
British Pendulum
Tester (BPT)
Dynamic Friction
Tester (DFT)
Angled Test Wheel
Braked in-lineTest Wheel
Sideways Force
Method
Sideway force Coefficient
Routine Investigation
Machine (SCRIM) - UK
Fixed SlipMethods
GripTester(GT) –
Scotland
Locked WheelMethod
(100% Slip)
ASTM E274Locked Wheel
Tester - US
Variable SlipMethod
Road Analyserand Recorder
(ROAR) in Variable Slip
Mode –Norway
Road Analyserand Recorder
(ROAR) in Fixed Slip
Mode
LCPC Adhera –
France

The effect of road roughness (and test speed) on GripTester measurements
26
Commonly known devices used in New Zealand and Australia for measuring surface friction that can be
correlated to microtexture measurements are SCRIM, GripTester, RoAR, DF Tester and the British Pendulum
Tester. These devices, the methods and the harmonisation models are described in various publications,
including Wilson (2006), and will therefore not be discussed in detail in this report. However, as the testing
devices vary considerably by the factors listed above, combined with the variation in environmental factors
that affect skid resistance (such as rainfall history, contaminants and seasonal factors), the harmonisation
attempts have yet to produce reliable correlation equations from one device to another.
The objective of this research project was to determine the effect of road roughness on the GripTester
device and this was therefore the skid testing device primarily used. The DF Tester was also used for field
correlation exercises as this is a stationary device and independent of the effects of longitudinal road
roughness. A laser profilograph from Pavement Management Services (PMS) was also used to measure
actual site road roughness and macrotexture (MPD) measurements. The GripTester and DF Tester are
described in more detail in appendices A and B.
2.8.1 GripTester device
The GripTester is categorised as a fixed slip braked in-line measuring device which is achieved by the means
of a chain and sprocket transmission (Wilson 2006). The GripTester is shown in figure 2.10 and was
developed by Findlay Irvine Limited in Scotland initially for skid resistance measurement of airport runways,
but has since been used extensively internationally for road pavement skid resistance testing (Findlay Irvine
2005). The GripTester has one test wheel that is braked and two bogey driving wheels and weighs
approximately 85kg.
Figure 2.10 GripTester
The GripTester operates using a single treadless rubber measuring test tyre of 254mm in diameter as
specified in the ASTM (2008) to simulate the drag force and load force during skidding at approximately
15% of the survey speed (Wilson 2006). The results obtained from the GripTester are the ratio between the
fraction of tractive drag force ( )dF and the load force ( )Q and this coefficient of friction ratio is known as
the grip number (GN) and can be defined as follows:
FdGNQ
=
Skid resistance measuring devices usually simulate a CoF in wet conditions and therefore require water
spraying onto the road surface in front of the measuring tyre (eg lowest skid resistance for road users).
The GripTester measuring device is installed with a water delivery system that can be operated
automatically or manually to provide a 0.25mm water film beneath the testing tyre relative to the test

2 Skid resistance literature
27
operating speed. The GripTester is portable and is handy for transportation; and it can be towed by any
towing vehicle. The GripTester is described in more detail in appendix A.
2.8.2 DF Tester
The Dynamic Friction Tester (DF Tester), as shown in figures 2.11 and 2.12, is a static or stationary tester
for measuring skid resistance. The device was designed in Japan by Nippo Sangyo Co and is used to
measure the CoF on pavement surfaces.
Figure 2.11 DF Tester – front view Figure 2.12 DF Tester – bottom view
The device has been recognised to be very stable and is used as a measuring reference in the recently
published IFI ASTM International Standard (Wilson 2006). The DF Tester can be used in laboratory
experiments as well as in the field. The output produced by the DF Tester is known as the coefficient of
friction (µ). This can be represented as:
FQ
µ =
Where µ is the coefficient of friction, F is the horizontal torque force and Q is the weight force on the
rubber sliders that are attached to the DF tester. The DF Tester is described in more detail in appendix B.
2.8.3 Laser profilograph
The laser profilograph system used in this research is manufactured by Greenwood Engineering of
Denmark and is a device that obtains up to three dimensional condition information of the pavement
surface (Greenwood Engineering 2012). The laser profilograph system shown in figure 3.2 is attached to
the PMS testing vehicle used in this research.
The profilograph system has up to 15 laser profile sensors used in conjunction with the advanced data
acquisition and an inertial reference system. The laser profilograph can analyse the pavement in the
longitudinal and transverse direction (cross-sectional shape) as well as recording and analysing the
unevenness of pavement, pavement crossfall and grades, rutting and produce output in terms of the IRI
and other indices such as NAASRA roughness indices. In addition, the laser profilograph system is capable
of recording macrotexture of the pavement at normal driving speeds. The laser profilograph system is
relatively lightweight and transferable and therefore can be mounted onto most vehicles with reasonably
little effort (Greenwood Engineering 2012).

The effect of road roughness (and test speed) on GripTester measurements
28
2.8.4 Summary of previous research
Little previous research was found on the effects of longitudinal road roughness on specific continuous
skid resistance measurement device outputs such as the GripTester. A summary of applicable research is:
• Cenek et al (2003) and Wilson (2006) found skid testers (including the GripTester) have differing
sensitivities to microtexture and macrotexture properties of road surfaces. The extension of this work
implies road roughness may also affect skid resistance measurement, especially at higher test speeds.
• Cenek et al (2003) also found that the contribution of macrotexture to overall skid resistance is
comparable to that of aggregate microtexture, suggesting that the components of hysteresis and
adhesion on chip seal surfaces are similar in magnitude.

3 Experimental equipment
29
3 Experimental equipment
3.1 Introduction
The key equipment used to undertake this research was the GripTester, DF Tester, Sensotec accelerometer
and the laser profilograph1. Each piece of equipment had its unique and important role in the study.
The GripTester was used to measure the continuous CoF of the pavement surfaces in order to quantify the
effects of road roughness, surface textures and travelling speeds on skid resistance measurement. The DF
Tester was employed in this study for the purpose of correlating the continuous skid resistance measurement
obtained with the GripTester irrespective of speed and longitudinal road roughness effects. The Sensotec
Accelerometers were mounted on the GripTester to monitor the vertical movements (due to road roughness)
experienced by the GripTester device while travelling across the test sections at various testing speeds. The
laser profilograph was used to measure the longitudinal profile (road roughness), and macrotexture, crossfall
and the geometric curvature of each site prior to undertaking actual field experiments.
3.2 GripTester data collection
The GripTester shown in figure 2.10 is an instrument that measures surface friction using the fixed slip
principle. The GripTester consists of three wheels assembled like that of a tricycle. The surface friction is
measured by the front wheel (also known as the braked wheel). The measuring wheel is fitted with a
smooth tyre made to ASTM specification and is mounted on an axle mechanism aimed to measure both
horizontal drag and vertical load.
The GripTester has dimensions of 1010mm X 790mm X 510mm and weighs 85kg and therefore it is
relatively convenient and portable for towing in a trailer compared with other continuous surface friction
testers. The horizontal drag and vertical load experienced by the measuring tyre is transmitted to the axle
through a transmission chain, the total up and down movement of the transmission chain must not be less
than 17mm or greater than 22mm (refer to appendix A for more details).
3.2.1 Standard test procedures
When travelling over the test surface, the horizontal drag and vertical load measurements are continuously
calculated and transmitted to a data collection computer usually situated in the towing vehicle. The survey
speed is also calculated and stored in the computer for each 1m or 10m averaged friction reading
(depending upon operating mode chosen).
Proprietary GripTester software, Airbase was installed on a PC computer with the Windows operating
system and a USB port. During a testing survey, the computer displays the average friction reading in 10m
length intervals. The data is transmitted from the measuring wheel and axle through the data cable to the
PC computer. Data is stored directly into a Microsoft Access database for convenient data processing.
The Airbase Windows software allows users to perform all the functions associated with collecting and
reporting runway friction data. It also allows collection and reporting of friction data on taxiways, aprons
and roads and is useful for short research sections but not for road network surveys where it is better to
use the Roadbase software.
1 Acknowledgement is given to Pavement Management Services who undertook the macrotexture surveys using their
laser profilograph

The effect of road roughness (and test speed) on GripTester measurements
30
The GripTester can perform two types of friction testing:
1 Operational friction testing
2 Maintenance friction testing.
Operational friction testing enables surface friction testing in all kinds of conditions: wet, misty and
even in snow conditions and does not deliver a water film depth as part of the testing procedure. Previous
research has shown that many road accidents occur during wet and misty conditions, especially when
snow and water have accumulated on the road surface decreasing the skid resistance of the pavement
surface and also when hydroplaning conditions prevail. Operational friction testing enables researchers to
carry out skid testing during winter seasons, when surfaces are entirely or partially accumulated with ice,
water snow or slush. However, when considering such tests, operators should take into consideration that
friction surveys carried out on adjacent dry surfaces do not give useful information. Friction surveys
carried out on surfaces that are heavily accumulated with standing water or slush will also not give reliable
information as a constant water depth is not ensured. Similarly data collected from standing water deeper
than 1mm or slush deeper than 3mm will not give accurate skid resistance results for the road surface-
vehicle interface due to the dynamic drag of the wedge of water in front of the tyre and the separation
from the road surface.
Maintenance friction testing measures the surface friction of the road surface in standard conditions.
Water is distributed to the measuring wheel-road interface with a specified thickness of water film (usually
0.25mm) to simulate wet skid resistance conditions and a standard test speed of 50km/h towing speed.
Maintenance friction testing is a necessary procedure for any advanced pavement management system
and the information it provides allows traffic and transportation engineers to schedule an effective and
efficient maintenance programme. This research was based on this type of survey which is most
commonly used for measuring the surface friction under standard wet road surface conditions. This is
undertaken in order for traffic and highway engineers to manage and design the most appropriate
maintenance treatments and practices for the particular road section as well as giving guidance on
establishing the appropriate design objectives of new road surfaces, maintenance planning and minimum
friction levels for the pavement surfaces. Airport testing commonly uses water depths of up to 1.0mm and
standard test speeds of 65 to 90km/h towing speeds.
In congested road conditions and low road speed environments (especially in urban areas) lower towing
speeds are often required as it is difficult to maintain a constant 50km/h speed. Higher speed surveys are
usually only undertaken on roads for research purposes, ie to determine the effect of other variables
(including macrotexture).
3.2.2 Calibration procedures
The GripTester has standard calibration procedures and daily/monthly maintenance checks to help ensure
data quality integrity is obtained from the testing device. These procedures developed by Findlay Irvine
Ltd were followed as standard research operating practices that included checking the charge of the two
12 volt batteries, the operation of running wheels, the measuring wheel surface and depth of rubber, the
alignment of the axle, the transmission and chain sprocket system including chain tension and lubrication,
the suspension system, the horizontal drag and vertical load cell calibration (load zero, load gain, drag
zero, drag gain).
The GripTester also calculates the distance travelled according to the rotation of its drive wheels. As the
distance per rotation varies slightly with the wearing of the tyre rubber it is important to calibrate the
distance per rotation (DPR) with a known straight distance. The DPR calibration was undertaken at the
beginning of the research project by calibrating the distance with a known 1km section.

3 Experimental equipment
31
3.3 Sensotec accelerometer
An axial accelerometer was used in this research in order to measure the vertical acceleration experienced
by the GripTester during testing due to the longitudinal unevenness (road roughness) of the road surface.
An axial accelerometer is a measuring device, which is able to measure the amplitude of the movement in
up to three-dimensions (x, y and z) (refer to figure 3.1).
Figure 3.1 Three-dimensional axis
3.3.1 Basic accelerometer theory
Accelerometers are measured in terms of accelerations; this is calculated based on the combination of
Newton’s third law and Hooke’s law of spring action. Newton’s third law states that if a force is exerted on
a mass, then the mass will experience acceleration. This can be represented by the following equation:
F = ma
Where
F is the force exerted on the mass (measured in Newton N)
m is the mass (measured in kilograms kg)
a is the acceleration due to the force (measured in metres per second squared ms-2).
Likewise, Hooke’s law states that if a force is applied on a spring with a certain spring constant, the spring
is extended from its equilibrium position for a certain distance. This can be represented by the following
equation: -
F=k x∆
Where
F is the force applied to the spring (measured in Newton N)
k is the spring constant (measured in force per unit length Nm-1)
x∆ is the distance extended due to the force applied.
x
z
y

The effect of road roughness (and test speed) on GripTester measurements
32
By substitution, then:
ma = k x∆
a =
k xm∆
3.3.2 Sensotec low frequency accelerometer
The accelerometer used in this research was designed by Honeywell Sensotec and is a low frequency
accelerometer. The low frequency accelerometer is designed with low impedance strain gauges. This is an
important feature of the experiment, as the impedance of the cables will be affected by the impedance of
the accelerometer, thus, lowering the impedance level will increase the accuracy of the accelerometer
output. Furthermore, a low frequency accelerometer will minimise the sensitivity to external ‘noise’.
Results of the accelerometer calibration are shown in appendix B.
3.4 Dynamic Friction Tester
The results obtained from the DF Tester in this research were used to correlate with the GripTester
measurements and to identify if the GripTester measurements were affected by higher roughness in
comparison with the DF Tester results which are independent of longitudinal unevenness or texture
ranges. The DF Tester was recently selected as a standard reference for the correlation of skid resistance
devices by ASTM International as they recognised its consistency and ability to produce repeatable
measurements for time and temperature. The precision of the DF Tester has demonstrated a range of
standard deviation of 0.044 (at 30km/h) to 0.038 (at 60km/h) for eight measurements on the same
testing surface.
3.5 Laser profilograph
The laser profilograph as shown in figure 3.2 was designed and developed by Greenwood Engineering in
Denmark. At present, there is one laser profilograph in New Zealand which is owned and operated by PMS
in Hamilton. There is also the SCRIM+ device that comes out to New Zealand annually from WDM UK Ltd to
survey the New Zealand state highway network and some local territorial road networks.
Figure 3.2 Laser profilograph owned by Pavement Management Services
Lasers

3 Experimental equipment
33
The front laser beam shown in figure 3.2 can configure up to 25 lasers (the PMS laser profilograph has
13). Each laser beam collects measurements from the pavement to the beam at a sample rate of 16kHz
and the travelled distance is measured with a resolution rate of 20,000 samples per wheel revolution. The
recorded signals from each laser sensor are stored separately for the convenience of further analysis. The
power supply for the laser profilograph, signal controller and the computer systems is located in the
vehicle cabin.
The profilograph can collect both longitudinal and transverse profiles, evenness, roughness (both in terms
of the IRI and NAASRA counts), pavement crossfall and rutting, macrotexture (in terms of mean profile
depth), geometrical grading and differential global processing system (GPS) locations. High accuracy of
results can be generated by the laser profilograph as its laser sensors allow three-dimensional
measurements.
Most pavement measurement devices have limited operating speeds, but the laser profilograph enables
testing to be operated from 20 to 150km/h and results generated can also be stored at a maximum rate
of 5mm distance intervals. Each research test section was surveyed by the PMS laser profilograph for the
determination of road roughness (IRI and NAASRA and macrotexture (MPD)).

The effect of road roughness (and test speed) on GripTester measurements
34
4 Experimental methodology
4.1 Introduction
This section presents the procedures and descriptions for determining the test sites and the methodology
adopted in the research. The three main pieces of equipment used were the GripTester, the DF Tester and
a vertical accelerometer discussed previously. The first section concentrates on the explanation of the
methodologies and criteria for site locations and selection. The last two sections describe the procedures
for testing with the skid resistance measuring device and include the operation of the software
programme.
4.2 Objectives of the research
The main objectives of this research study were to investigate the output errors (or variants) produced by
the GripTester due to different road roughness and surface texture properties as well as to assign the
most suitable test speed for testing with the GripTester device.
4.3 Test site selection procedures
A test site selection matrix with five different NAASRA roughness bands (<69.1, 69.1–85.0, 85.0–103.2,
103.2–116.0 and >116.0 counts/km) and three surface macrotexture ranges (<1.09mm, 1.10–1.69mm,
and >1.7mm) was developed (refer to table 4.1) with sites that populated each matrix cell. The road
roughness was measured in NAASRA counts per kilometre as this is the traditional roughness
measurement technique used in Australia and New Zealand and is still the most commonly understood
roughness measure. Some agencies use the International IRI rather than NAASRA, and an approximate
equivalent value of IRI from the NAASRA roughness value can be derived by the following equation: -
1.326.5
NAASRAIRI +=
Table 4.1 Site selection matrix
Roughness level (NAASRA
counts/km)
Texture level (mm)
<1.09 1.10–1.69 >1.7
<69.1
69.1–85.0
85.0–103.2
103.2–116.0
>116.0
The NAASRA roughness is determined by a mathematical model of two longitudinal profiles measured
simultaneously. The model is referred to as a half-car model having a dynamic response equivalent to a
standard vehicle.
As noted previously, texture wavelengths are classified as microtexture (texture <0.5mm), macrotexture
(texture from 0.5mm–50mm), megatexture (texture from 50–500mm) and longitudinal unevenness or
road roughness (from 0.50m–50m). This research attempted to determine whether there was any

4 Experimental methodology
35
significant relationship between skid resistance measurements obtained from the GripTester and road
roughness and to a lesser extent macrotexture. Macrotexture used in this study is characterised by the
MPD, which is a measuring technique to determine the average texture depth (measured in terms of
millimetres) based on the readings from high-speed laser driven data collection equipment such as the
laser profilograph.
Most of the selected road sites were chosen in the Franklin District, south of Auckland city as it was more
likely roads with the range of roughness required to populate the site matrix could be located close
together; traffic congestion was less and the roads would allow higher than typical urban operating speeds
(>50km/h). Roads in the Franklin District area are managed and monitored under the supervision of Opus
Consultants who maintain the area’s road assessment and maintenance management (RAMM) road
inventory and condition database. Most road controlling authorities (RCAs) in New Zealand use the RAMM
database to record all new, maintenance, repair and replacement activities for each road type within their
geographic area. This database assists in the preparation of maintenance schedules for each particular
road. The RAMM database was used to help determine possible road test sections for more detailed study.
The RAMM database supplied the following information as required by this study (refer to table 4.2):
• road name
• start and end linear referencing of the sections
• directions
• roughness
• texture
• surface types
• age of pavement.
4.3.1 Data capture setup
Nineteen sites were initially selected from the RAMM database. The site features are shown in table 4.2
(sections A – E). However, during the testing period, Franklin District Council resealed test sections E1 – E3
and therefore the road roughness and surface textures for those sites were no longer applicable (as shown
in table 4.2). Hence, three more sites were selected within the Waipa District Council area with similar
properties to sections E1 – E3.
Sites selected were approximately 150m to 300m in length, geometrically level and straight. The sites
were also selected on the basis of relatively homogenous roughness and texture ranges throughout the
sections to eliminate other possible effects that could alter the results produced by the GripTester. The
age of the pavement sections was also taken into consideration, as pavements newer than two years can
still be experiencing initial aggregate polishing (in a typically negative exponential manner) and could
therefore be less stable over time and after multiple test runs. Previous research (Oliver et al 1988; Henry
2000; and Cenek et al 1999) indicated that skid resistance of road surfaces would reach an equilibrium
level state from six months to approximately seven years after construction of the surface, depending on
aggregate type, annual average daily traffic volume (AADT) and traffic composition levels. Thereafter,
depending on climatic conditions, the skid resistance measurements would vary by seasonal and short-
term effects. From experience, an equilibrium level is commonly reached within the first two years on chip
sealed surfaces in New Zealand that have at least 2000 AADT.

The effect of road roughness (and test speed) on GripTester measurements
36
The final 19 sites (after three had been eliminated) were chosen according to the criteria mentioned above
and their road roughness and texture properties. The selection of sites provided at least two similar sites
for each roughness/texture range. The sites selected are summarised in table 4.2.
4.3.2 Site locations
The Franklin District Area consists of primarily rural roads with a wide variety of roughness and texture
ranges and it is also reasonably close to the University of Auckland. There was a preference to test roads
in rural areas because of lower AADT flows. The testing speed for the GripTester on this research project
ranged from 30km/h to 90km/h. Low-speed testing tends to hold up traffic whereas a clear road is
required for testing at higher speeds to obtain results that are more consistent. Four GripTester testing
speeds: 30km/h, 50km/h, 70km/h and 90km/h were chosen for the test runs.
The sites were finalised and located in the suburbs of Glenbrook, Waiuku, Pukekohe and Buckland being
mostly ‘rural’ in nature, whereas the sites located in the Pukekohe area are categorised as ‘urban’.

4 Experimental methodology
37
Table 4.2 Finalised site matrix
Section ID Roughness
(counts/km)
MPD texture
(mm) Road name
Carriageway
start
Carriageway
end
Total
distance (m) Direction Surface type
Age
(yr)
Speed
(km/h)
A1 50–70 >1.7 Glenbrook Rd 13,200 13,400 200 Left 2CHIP 2 100
A2 90–110 >1.7 Glenbrook Rd 14,100 14,306 206 Left 2CHIP 2 100
A3 90–110 1.1 to 1.7 Glenbrook-Waiuku
Rd 1700 1900 200 Left 2CHIP 1 100
A4 90–110 1.1 to 1.7 Glenbrook-Waiuku
Rd 3100 3300 200 Left 1CHIP (CHIPSEAL 1COAT) 10 100
B1 70–90 >1.7 Waiuku Rd 8400 8600 200 Right 2CHIP 1 100
B2 90–110 >1.7 Waiuku Rd 8500 8700 200 Left 2CHIP 1 100
B3 70–90 >1.7 Waiuku Rd 7100 7300 200 Left 1CHIP (CHIPSEAL 1COAT) 14 100
C1 50–70 <1.1 Manukau Rd 500 700 200 Left AC 4 70
C2 50–70 <1.1 Manukau Rd 1300 1560 260 Right AC 6 70
C3 70–90 <1.1 Massey Ave 200 380 180 Right AC 2 50
D1 50–70 >1.7 Buckland Rd 6700 6900 200 Left 1CHIP (CHIPSEAL 1COAT) 9 100
D2 50–70 1.1 to 1.7 George St 1400 1600 200 Left 1CHIP (CHIPSEAL 1COAT) 9 50
D3 70–90 1.1 to 1.7
River Rd 100 300 200 Left 2CHIP (CHIPSEAL 2COAT),
1CHIP(CHIPSEAL 1COAT)
4–7
years 100
D4 50–70 1.1 to 1.7 River Rd 500 700 200 Right 2CHIP 5 100
D5 70–90 1.1 to 1.7 George St 1600 1800 200 Right 1CHIP (CHIPSEAL 1COAT) 9 70
D6 70–90 <1.1 Buckland Rd 7800 8000 200 Right 2CHIP (CHIPSEAL 2COAT) 1 50
E1 110–130 George St 500 700 200 Right 500-700 SLURRY 10 50
E2 >130 George St 500 700 200 Left SLURRY 10 50
E3 110–130 George St 1100 1300 200 Left SLURRY 10 50
F1 110–130 >1.7 Rukuhia Rd 3250 3450 200 Right 1CHIP (CHIPSEAL 1COAT) 100
F2 >130 >1.7 Rukuhia Rd 6350 6560 200 Right 1CHIP (CHIPSEAL 1COAT) 100
F3 >130 >1.7 Rukuhia Rd 6650 6870 200 Right 1CHIP (CHIPSEAL 1COAT) 100

The effect of road roughness (and test speed) on GripTester measurements
38
4.3.3 Site visit
After selecting suitable sites from the RAMM database, site visits were undertaken to confirm locations,
pavement condition and testing criteria. For each potential site, pavement condition distresses such as
potholes, large cracks and flushing were noted as these could possibly affect the output produced by the
GripTester.
Start and end points for each test section were then determined. The testing start point was located
approximately 50m before the actual start of the selected section; likewise, the end point was located
around 50m after the actual end of the section. Temporary spray paint markings were used to mark out
the test start and end points on the road surface and/or on clearly marked nearby features.
Testing with the GripTester was mostly carried out with at least three test runs for each site. It was
therefore important to locate wide and safe turning areas for the towing vehicle to undertake a safe U-turn
vehicle manoeuvre. Furthermore, the GripTester, although reasonably robust, needs careful handling and
should not be run up onto kerbs etc.
4.4 Procedures for testing with the GripTester
4.4.1 GripTester setup
The procedures for setting up the GripTester on site and after equipment calibration are relatively simple.
Additional equipment required to be fitted onto the GripTester prior to testing are the water distribution
system, tow bar, safety chains, data transmission cables and computer setup.
Since skid resistance is lowest in wet road conditions the coefficient of friction obtained by the GripTester
is normally tested in controlled wet road surface conditions. The University of Auckland GripTester
(GT281) utilises an automatic watering system and software that automatically modifies the water pump
flow rate based on the testing speed to keep a constant water depth at the tyre–road surface interface. As
the GripTester uses relatively large amounts of water during testing, a 450 litre water tank has been
installed at the back of the tow vehicle. The GripTester is towed behind the test vehicle that houses a
water bag/container and associated automatic pump control equipment (see figure 4.1).
The GripTester software commonly used is Airbase; however, in this research a modified version of the
software was used in conjunction with the software Roadbase. In both cases, the user can either manually
select the flow of water measured in terms of litres per second, or pre-select the depth of water film
(measured in terms of millimetres) and the software automatically modifies the water pump flow rate to
keep a constant water depth at the tyre–road surface interface. In this research project, a standard water
film depth of 0.25mm was selected.

4 Experimental methodology
39
Figure 4.1 GripTester automatic watering system and water storage tank in back of testing vehicle
The GripTester has an internal computerised programme, which continuously records the resisting force
experienced by the measuring wheel during testing and the vertical load. It also monitors/records the
testing velocity, the amount of water introduced to the axle and the running distance of the test section.
The GripTester computerised control module is shown in figure 4.2.
During testing, all data is constantly transmitted to the laptop computer via the data transmission cable.
The cable is connected from the front of the GripTester to the laptop computer located in the testing
vehicle.
Figure 4.2 GripTester control panel
4.4.2 Data output
Two files are produced from each testing run with the Roadbase software. Results collected from the
GripTester are stored in a database spreadsheet (.dat) file. The surface friction related results are then
extracted from the database spreadsheet and combined with header files to provide a complete database
for the test results.
450 litre water tank
Water pump inlet pipe tank
Water pump
Water pump
outlet pipe tank
Computer data control
box inlet pipe tank
Water flow rate control (gate valve)
GripTester water delivery
pipe

The effect of road roughness (and test speed) on GripTester measurements
40
The Airport software stores all testing results for each testing section in one data format spreadsheet and
only the database spreadsheet file is created. The Airport software continually stores multiple data runs to
one database spreadsheet until the testing is terminated.
4.4.3 Testing procedures with the GripTester
Prior to testing, several data checks are required. These include:
• water checks including both the amount of water in the tank and that the pump system is operating
correctly
• ambient and surface temperatures prior to (and after) test runs.
After the GripTester has been setup and the Airport or Roadbase software has been launched, testing
commences by selecting ‘GripTester survey’ in the software program and a minimum manual water flow
rate of at least 1 litre/second to activate the pump system.
Pressing the Start button of the software program when the vehicle passes the assigned starting point for
the section activates the recording of the skid resistance survey data. Triggering the Marker button (which
can be triggered more than once in each test run) allows the software program to record a particular
location by linear distance recording while testing continues. This enables a log of additional survey
information (eg the beginning and/or end of a flushed bitumen road surface section) to track back to the
exact position of interest when analysing the results. This function is used to locate potholes, cracks,
change of seals and other factors that might affect the homogenous properties of the road surfaces. When
the testing vehicle travels past the assigned ending point of the testing section, an End button is activated
to terminate the GripTester’s data collection test run survey. The software automatically switches back to
the main information window, to allow the data to be saved. ‘Start similar survey’ is used to commence
another testing run survey with identical location, testing length, film depth and similar atmospheric and
surface temperature; the only information needing to be changed is the specific testing comments header.
This function is used for repeating testing runs for the test section.
Three test runs were completed using the Roadbase software which collects and stores CoF data every 1m.
A fourth test run used the Airport software which collects a CoF every 1m but stores the result as a rolling
10m average. The data sets collected by these two systems could later be compared. Three repetitive
Roadbase test runs were undertaken to ensure the GripTester produced repeatable results.
4.5 Procedures for testing with the Dynamic Friction Tester
4.5.1 Testing points
A minimum of three specific test location points for the DF Tester were chosen in the line of the left wheel
path, aligning with the GripTester section surveys. These locations were representative of the chosen
homogeneous sections in terms of texture and roughness and furthermore allowed the consideration of a
correlation equation to be developed for varying textures between the GripTester and DF Tester devices
for typical New Zealand road surfaces. For a full description of this equipment see appendices A and B.
4.5.2 Setup of the DF Tester
The DF Tester is often used for laboratory experiments but it is also well suited for field testing because of
its portability. The equipment setup for field testing that includes the need for water and power to run the

4 Experimental methodology
41
DF Tester is more complex than in laboratory experiments as the operating procedures require full traffic
control measures (ie temporarily closing down the traffic lane).
The DF Tester controller sends and receives signals to and from the DF Tester. The CoF (µ) and
corresponding rotational speed results generated from a DF Tester test are transmitted back to the
controller for storage. Data is stored in a database (.dat) spreadsheet format with skid resistance output
for every 0.1km/h.
4.5.3 Traffic control
The DF Tester requires the operator to undertake a stationary test from a ‘live’ traffic environment.
Acknowledgement is given to Franklin District Council (FDC), OPUS International Consultants (the network
management operators in FDC) and PMS who all contributed in providing safe temporary traffic control on
this research project.
4.5.4 DF Tester procedures
After appropriate traffic control was in place, the DF Tester and associated equipment were set up at the
chosen location. First, the test location identifier and then the desired testing speed and number of
proposed test runs were inserted into the DF controller. Since the DF Tester was designed for use on lower
macrotexture than is typical of New Zealand chip seal surfaces, the tests were undertaken at a lower initial
test speed of 60km/h. Higher speeds can cause damage to the synthetic rubbers of the DF Tester device
and/or cause the device to move from the test position during a test; both outcomes are undesirable.
After assigning all required information and the execution signal triggered from the DF controller’s
monitor, the DF Tester begins rotating in the horizontal plane from a stationary position to the speed
assigned by the operator. The horizontal plate is then lowered to the surface level where the synthetic
rubbers contact the road surface. As the speed of the rotating disk is retarded by the friction developed
between the rubber slider – road surface interface, the resultant forces are measured at the corresponding
speed for every 0.1km/h interval and transmitted to the controller. A graphical output is shown on the
controller’s monitor and the CoF values are displayed for 20km/h and 40km/h. Data is stored at the
operator’s discretion.

The effect of road roughness (and test speed) on GripTester measurements
42
5 Results and discussions
5.1 Introduction
Raw data obtained from the GripTester and the DF Tester all required further data processing before the
information could be analysed. After the data was categorised, results were plotted into graphical outputs
and distinguishable characteristics were identified. An example of the raw data processing and data plots
for section A1, Glenbrook Rd, is shown in appendix D and the processed data results are displayed in
appendix E.
This section focuses on tying together the different parameters that determine the grip number and
attempts to establish any relationships or trends among the variables.
5.2 Grip number variability – part 1
5.2.1 Data group division
The 19 test sections (refer to table 4.2) were further divided into three levels of texture and five levels of
road roughness for analysis purposes. The boundaries for these levels are shown in table 5.1. This
enabled a comparison and determination if the degree of road roughness had any effect on the degree of
macrotexture and other variables such as speed of the test and the GN output. Table 5.1 shows the level
determinants for texture (Tx) and road roughness (RR):
Table 5.1 Limits to establish the level of texture and road roughness
Texture level Texture depth, MDP (mm)
Roughness level NAASRA counts/km
Low <1.09
1 <69.1
Medium 1.10 <Tx <1.69
2 69.1<RR <85.0
High >1.7
3 85.0<RR <103.2
4 103.2<RR <116.0
5 >116.0
Table 5.2 shows the possible combinations of roughness and texture levels; a blank cell represents a
combination that is not possible with the data that was obtained. It can be seen that the data has been
shortlisted into 10 cell groups. Within the individual groups, testing speeds and GN can be compared as
those sections have similar roughness and texture variables. In addition, we can compare and evaluate
how the GN may change as we move onto a higher texture area or rougher section of road. The groups
will later be identified and referred to their numerical roughness level plus L, M or H (representing low,
medium or high texture level)

5 Results and discussions
43
Table 5.2 Matrix of testing sections sorted and grouped in terms of their texture and roughness
Roughness
level
Texture level
Low Medium High
1 = smooth D4,D6 C2,D1,D5 A1
2 C1,C3 D2,D3 B1,B3
3 A2,A4 B2,A3
4 F1
5 = rough F2,F3
The factors GN, test speeds, road roughness and macrotexture were plotted against each other to
ascertain if any linear relationships could be formed between them. The primary link that this research
sought was to see if there was a relationship between road roughness and GN but also if the GN was
dependent on the GripTester test speed and macrotexture.
5.2.2 Statistical analysis of the data
The data was analysed using the University of Auckland ‘R’ software language and environment for
statistical computing and graphics (Department of Statistics, University of Auckland 2010). Figure 5.1
shows a box plot of GN and roughness levels. An analysis of variance was applied to the data. This
showed that the mean (not median) of the GNs across the roughness bands was not statistically different
in each GN (discussed later in appendix E).
Figure 5.1 Box plot of GN against roughness level

The effect of road roughness (and test speed) on GripTester measurements
44
The plot seems to demonstrate a generally steady increase in the mean GN as the road roughness levels
increase from smooth to rough. The GN around roughness band 4 appears higher than the other bands
but could be misleading as only three measurements constitute that roughness level. Data variation
(range) could be seen as decreasing the road roughness; however, this could be explained by the lower
number of measurements for roughness levels 3 and 4. The data appears to be normal, other than
roughness band 2 being slightly left skewed.
The panel plot shown in figure 5.2 was used to observe if any patterns formed and linear relationships
derived. As highlighted, the four most relevant panels are GN vs RR, GN vs Tx, GN vs speed and Tx vs RR.
The plots indicate the GN could have an inverse relationship with speed (although the data spread shows
that it is not strong). There is no noticeable relationship with texture or road roughness. Texture shows to
be positively correlated with road roughness.
Figure 5.2 Panel plot of grip number (GN) against road roughness (RR), texture (Tx) and test speed

5 Results and discussions
45
Table 5.3 shows a covariance matrix of how the four variables move in relation to each other. The matrix
confirms that the GN does have a negative relationship to speed. The 0.39 between the GN and texture
indicates that the GN has a positive relationship with texture even though it was not so obvious from the
plots. Nevertheless, this is expected as higher macrotexture would give greater friction, thus a higher GN
would result. The 0.61 covariance between roughness and texture highlights the positive relationship
between the two variables (also refer to figure 5.3). However, this could be caused by the sampling
methodology rather than from a real relationship; the sections with high road roughness were located in
rural areas, which relates to the higher macrotexture from the chip seal surfacing in those areas.
Table 5.3 Covariance matrix
RR Tx Speed GN
RR 1 0.61 0.01 0.08
Tx 0.61 1 0.19 0.39
Speed 0.01 0.19 1 -0.19
GN 0.08 0.39 -0.19 1
Figure 5.3 Linear regression plot of texture against road roughness
Figure 5.4 shows the grip number plotted against test speed, separated out into their corresponding
texture and roughness combination groups. The combinations 3L, 4L, 4M, 5L and 5M were not possible as
the data did not fit these categories.

The effect of road roughness (and test speed) on GripTester measurements
46
Figure 5.4 Panel plot of GN against test speed, grouped by roughness (1 to 5) and texture (L, M, H)
Overall, we can see that the plots show a general decrease in the GN when increasing the test speeds (this
is however not strong for the 2H and 3H categories). However, the test sections grouped together under
the same panel may not have consistent features. Figure 5.5 shows similar data to figure 5.4, except the
plots are grouped by test speeds rather than by texture and roughness levels. An initial hypothesis of the
research was if increasing road roughness affected the measured CoF, ie the GN, then the variance or
range at higher speeds would be different from that of lower test speeds where road roughness was
thought to have a lesser effect.

5 Results and discussions
47
Figure 5.5 Panel plot of GN against roughness, grouped by test speed
Nevertheless, the plots do not show any clear relationships between the GN and roughness at each level of
speed, nor any shift in points from low to high speeds. There are fewer points in the plots for higher speeds
(90km/h) as some test sections were in urban areas where test speeds were restricted to the speed limit.
A linear (fixed effects) model was then applied to the data grouped in the roughness/texture combinations
for the following variables:
GN ~ Tx + Speed + RR + Tx_RR combination + error terms
The linear regression analysis (appendix F) showed that the GN is a function of test speed (p = 0.0009)
and test section (A1, A2, etc), but not macrotexture (p = 0.99) or road roughness (p =0.509). There are,
however, some significant interactions with road roughness and texture. The resultant multiple R-squared
was 0.56 meaning that the included co-related variables could explain a little over 50% of the variation in
the measured GN from the test sections. Thus, macrotexture and road roughness were not significant
variables. The model would therefore need to have only speed and test sections as explanatory variables.
However, as discussed previously it is quite possible that texture and road roughness is confounded with
the test sections. The correlation of roughness with texture was 0.61.
Consequently a linear mixed effects model was used to analyse and treat the test sections as random
effects. This model (refer to appendix D) showed that both speed and texture remained as explanatory
variables but roughness was eliminated.

The effect of road roughness (and test speed) on GripTester measurements
48
In view of these findings, it can be concluded that for the tested speed range (30km/h to 90 km/h) and
road roughness range (50 to 170 NAASRA counts/km) that the GN is influenced by the test speed and that
texture is also a factor (to be further investigated) but that the measured friction coefficient, GN, is not
influenced by road roughness.
5.2.3 Data transformations
Each test section has its own GN mean, which is different from the grand mean of all GNs combined. The
GN data for all 19 sections was transformed by adding on this difference of means so that every test
section had an equivalent mean (which was the grand mean of the GNs).
The purpose of this transformation was to eliminate the variations for each test section. This was
undertaken in the hope of improving the plots by removing the variability factor due to different test
sections. Three more plots were created to see how a transformed GN could change the linear
relationships between the variables: adjusted GN against speed (figure 5.6), road roughness (figure 5.7)
and texture (figure 5.8).
Linear regressions using the adjusted GN demonstrate that both road roughness and texture variables are
eliminated as factors that can change GN (figures 5.7 and 5.8). Test speed is still a dominant variable that
can influence GN, having a negative relationship on the friction coefficient (figure 5.6). However the
adjusted R2 value of 0.23 may indicate poor fitting of the regression line – the cause of the few outliers. If
the two outliers at the bottom right of the plot were removed the fitting of the data trend line would be
much better.
Figure 5.6 Linear regression of transformed GN against test speed

5 Results and discussions
49
Figure 5.7 Linear regression of transformed GN against road roughness
Figure 5.8 Linear regression of transformed GN against texture

The effect of road roughness (and test speed) on GripTester measurements
50
5.3 Grip number variability – part 2
The second part of this study focused on how the GN and test speed relationship was affected by
macrotexture. An initial hypothesis was that the rate of reduction of GN with increasing test speed would
be less on test sections where macrotexture levels were high. This relationship was established previously
during the PIARC World Road Association experiment in 1992 and reported in Wambold et al (1995).
The six test sections which had the lowest road roughness readings were chosen to be analysed for their
macrotexture effects. These six sections were: A1, C2, D4, D5 and D6, having NAASRA counts between
46.6 and 69.09 counts/km and were considered very low on road roughness levels (refer table 5.4). It was
necessary to choose smooth sections (where roughness counts were low) to reduce any road roughness
effects on the analysis. In addition, the six sections were also grouped in accordance with their level of
texture, as defined in table 5.5.
Table 5.4 Data from test sections A1, C2, D4, D5 and D6, grouped into their texture levels
Test section RR Tx Speed GN Tx level
D6 46.64 0.38 31.54 0.67 L
D6 46.64 0.38 47.36 0.56 L
D4 68.25 1.08 33.12 0.43 L
D4 68.25 1.08 47.65 0.41 L
D4 68.25 1.08 65.01 0.46 L
D4 68.25 1.08 77.47 0.42 L
D1 64.99 1.46 29.61 0.53 M
D1 64.99 1.46 47.06 0.51 M
D1 64.99 1.46 65.54 0.52 M
D1 64.99 1.46 76.98 0.53 M
C2 68.08 1.4 31.24 0.56 M
C2 68.08 1.4 47.82 0.51 M
C2 68.08 1.4 63.3 0.47 M
D5 69.06 1.39 30.99 0.53 M
D5 69.06 1.39 48.01 0.55 M
D5 69.06 1.39 66.3 0.53 M
A1 54.51 1.76 32.74 0.73 H
A1 54.51 1.76 49.57 0.72 H
A1 54.51 1.76 67.58 0.68 H
A1 54.51 1.76 82.72 0.5 H
Table 5.5 Texture limits grouping the sections to their texture levels
Tx levels Tx range Sections
Low Tx<1.09 D6, D4
Medium 1.1 < Tx <1.69 D1, C2, D5
High Tx >1.7 A1

5 Results and discussions
51
Figure 5.9 plots the GN against speed, grouped by level of texture (L, M and H). With the combined data,
the curves in the high and low level texture plots would appear to be of a negative exponential nature.
Also, it may appear that the rate of reduction of the GN, with increasing test speeds, is less for medium
texture surfaces than for low and high texture surfaces. However, when the plots are linked by road
sections, it can be seen that not all GNs form an inverse relationship with test speed and are highly
dependent on the test section itself. This is shown by figures 5.10, 5.11 and 5.12 and discussed below.
Figure 5.9 Panel plot of GN against test speed, grouped by texture level

The effect of road roughness (and test speed) on GripTester measurements
52
Figure 5.10 Plot of GN vs speed for low texture sections (D4 and D6)
Figure 5.11 Plot of GN vs speed for medium texture sections (C2, D1 and D5)
Low Texture
Medium texture

5 Results and discussions
53
Figure 5.12 Plot of GN vs speed for high texture section (A1)
Figure 5.10 shows the GN for section D6 to decrease as the speed increases from 30km/h to 50km/h.
However, the relationship between a decreasing GN and increasing speed for all macrotextured surfaces is
not conclusive, as we can see a moving up and down trend for section D4. D6 has 0.38mm MPD compared
with 1.08mm for D4; this has a possibility of affecting the trends.
Figure 5.11 shows another set of inconclusive trends (D1 and D5) moving randomly and C2 sloping
downwards. Although the movements for D1 and D5 seem arbitrary, they do not seem to be volatile and
could be the cause of experimental fluctuations.
Figure 5.12 for high texture clearly shows a downward trend of GN as speed increases – this was not
expected as the PIARC experiment had found this decreased effect to be more marked on low textured
surfaces as there was less time for hysteretic friction to develop. Since A1 was the only section fitting this
category, the accuracy of this finding could not be confirmed.
The sections D1, D4 and D5, being in close proximity to each other, also share similar texture MPD and all
show some sense of resistance to any loss of GN over the test speed range of 30km/h to 90km/h. When
comparing those three sections with D6 (where the texture was halved), C2 and A1 (different areas)
indicate that sectional properties may have a more dominant effect on GN changes than texture itself. This
leads to the suggestion that there could be some factors relating to the environment or road surface that
were not accounted for in this study.
Examining the road characteristics in table 5.6 shows no clear trends that the surfacing material or the
years since resurfacing could influence the GN changes (A1, C2, D6 show a reduction in GN with speed
and D1, D4 and D5 show no reduction). However, these findings are derived from a small sample of data
and more research could be undertaken in this area with a larger sample size with very similar sites,
carefully changing one variable at a time to better determine any significance in relationships.
High texture

The effect of road roughness (and test speed) on GripTester measurements
54
Table 5.6 Surface characteristics of test sections
Section Surfacing Age (years) Speed (km/h) Tx MPD (mm)
D6 Chip seal 2 coat 1 50 0.38
D4 Chip seal 2 coat 5 100 1.08
D1 Chip seal 1 coat 9 100 1.46
D5 Chip seal 1 coat 9 70 1.39
C2 AC 6 70 1.4
A1 Chip seal 2 coat 2 100 1.76
Another explanation of the variability in the data is that the test wheel track was not followed precisely
and markers were not placed accurately. The testing team was unable to close the road down for better
control over the test section, so tests were carried out in the presence of ‘live’ traffic. Distractions from
moving traffic add to any other human errors, from driving to marker placing, which can ultimately affect
test results.
5.4 GripTester and Dynamic Friction Tester
The research project also enabled an investigation of the relationship in measured CoF between the
GripTester (a continuous friction measurement device) and the stationary DF Tester. This section
compares three aspects over the same test section: GN at test speeds of 50km/h and 70km/h and COF (µ)
by the DF Tester.
CoF measurements were taken at 37 test locations on Glenbrook-Waiuku Road (Glenbrook School area) with
the DF Tester. This location was chosen because it passes through the two entranceways into Glenbrook
School, where high turning volumes polish the road surface aggregates, giving a reasonable range from low
to high CoF. A set of GripTester tests were conducted along the wheel track where the DF Tester
measurements were completed. This enabled a correlation to be obtained between the GN and the CoF.
Figure 5.13 below shows a plot of the GN at test speeds of 50km/h and 70km/h (GN50 and GN70
respectively) against chainage or running distance from the beginning of the test section, and DF Tester’s
CoF (µ) against chainage. The three measurement readings (GN50, GN70 and CoFµ) follow similar patterns
moving in unison for most points. The two entranceways where the friction coefficients drop considerably
show extensive polishing from high turning traffic volumes and is a useful indicator for matching up the
chainages. It can therefore be stated that judging from the pattern bands, the three friction coefficients
correspond to each other reasonably well.

5 Results and discussions
55
Figure 5.13 Plot of GN50, GN70 and CoF against chainage
Figure 5.14 plots GN50 and GN70 against CoF for comparison and derivation of the relationship that links
GN and CoF. Linear regression was applied to both GN50 vs CoF and GN70 vs CoF, and the two lines are
almost indistinguishable. The estimates are 0.193 for the GN50 intercept and 0.198 for GN70, with the
difference of 0.00491 proven to be not significant (t-test, 35 degrees of freedom, 0.05). Also, the
estimates of the regression line slopes are 0.513 for GN50 and 0.493 for GN70. Once more, the difference
of 0.02 in slope is not significant (t-test, 35 degrees of freedom, 0.05). This brings forth the equation
between GN and CoF on this site with an MPD of 1.76mm (high texture) to be:
GN = 0.5×CoF + 0.2
The relationship between GN and CoF is relatively independent of testing speeds between 50km/h and
70km/h; and tests undertaken using the GripTester in that speed range would give the same estimates of
skid resistance. However, it must be kept in mind that the relationship is valid for this particular test
section; any other test sections may give different relationships.
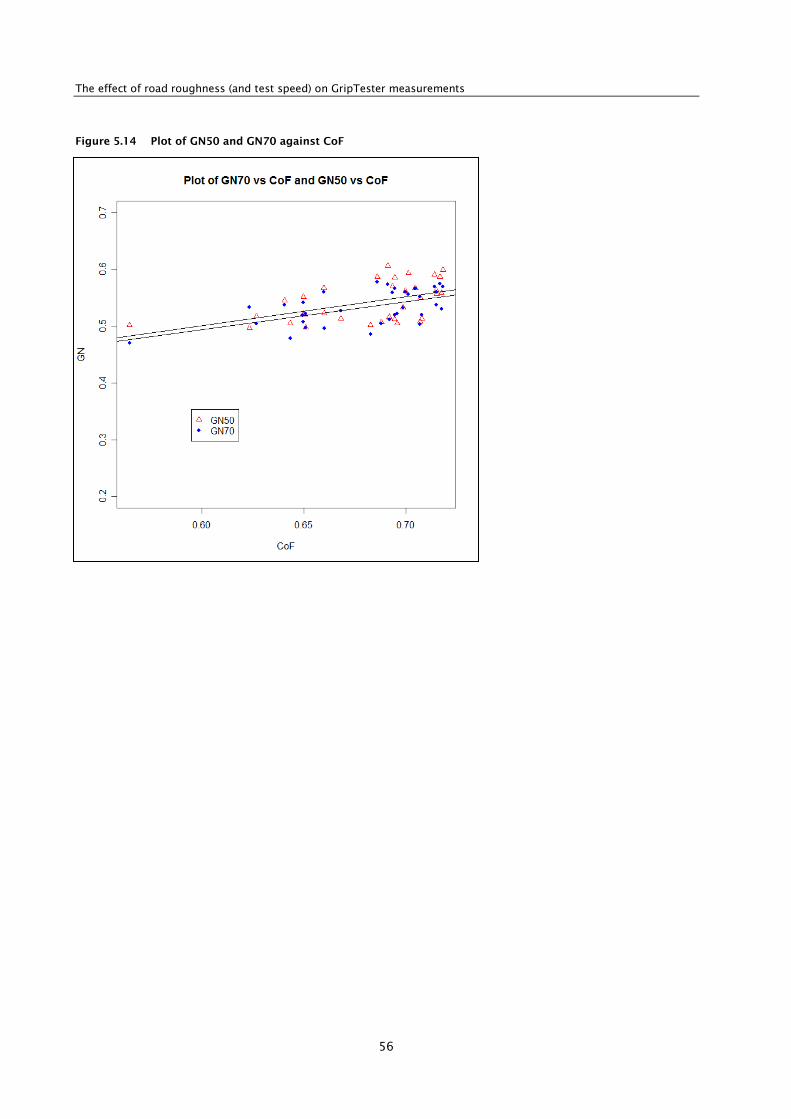
The effect of road roughness (and test speed) on GripTester measurements
56
Figure 5.14 Plot of GN50 and GN70 against CoF

6 Conclusions and recommendations
57
6 Conclusions and recommendations
6.1 Conclusions
Both this and previous research have found the DF Tester as a stationary device to be highly repeatable
with a coefficient of variation (CoV) ≤2.5%. It has also been shown to be a very useful calibration device for
continuous friction measurement devices such as the GripTester. The GripTester can also be reasonably
repeatable with a CoV of typically ≤6.0% between multiple test runs when the test device and measuring
tyre have been conditioned and warmed up. The CoV can increase up to approximately 11% on a relatively
short road section if the tyre is not conditioned prior to the survey.
From the analysis of data collected, not all results concurred with those suggested by theory (eg as
measurement speed increases, skid resistance reduces, which it does at a greater rate when the
macrotexture is high). This research has raised some further questions about the behaviour of skid
resistance and the measurement devices used to determine a measured CoF.
Nevertheless, the following conclusions have been drawn from the research:
• There is a satisfactory linear model of the relationship of the GN with the explanatory variables
texture, testing speed and road roughness. Test speed and texture would appear to have an impact on
the measurement of the GN, but surprisingly road roughness does not appear to have an influence on
the GN as had been hypothesised. More needs to be done in this area to better model the factors
influencing the GripTester results.
• Generally, at lower test speeds (less than 75km/h) the GN (on individual road sections) may not be
dependent on test speeds, but this depends on the nature and condition of the road surfaces being
tested.
• A relationship between the GN obtained from the GripTester and the CoF obtained from the DF Tester
was found to be independent of the test speed of the GripTester on the test section used in the
research. A good correlation was found between the GripTester and the DF Tester on this site.
• In view of these findings, it can be safely considered that the GN is influenced by the test speed and
that texture is also a minor factor (to be further investigated). However this research has shown that
the GN as measured by the GripTester is not significantly influenced by road roughness up to 170
NAASRA counts per km and at testing speeds less than 75km/h.
6.2 Recommendations for future research
Future research recommendations include searching for better controlled test sites and larger samples to
clarify the effect of texture on the GN and to expose unidentified factors that can influence GripTester
output. A greater sample population and site matrix with various skid resistance measurement devices
would determine whether some of the unexpected results found in this study were due primarily to the
small population size or alternatively due to the GripTester measurement device alone.

The effect of road roughness (and test speed) on GripTester measurements
58
7 References
ASTM E501-94 (2000). Standard specification for standard rib tire for pavement skid-resistance tests. In
Book of ASTM standards (vol 04.03). C. E17.24 (Ed). West Conshohocken, Pa, USA: ASTM International.
ASTM E1911-98 (2002) Standard test method for measuring paved surface frictional properties using the
dynamic friction tester. In Book of ASTM standards (vol 04.03). C. E17.21 (Ed). West Conshohocken, Pa,
USA: ASTM International.
ASTM E1844-08 (2008) Standard specification for a size 10 & 4–5 smooth-tread friction test tire. In Book of
ASTM standards (vol 04.03). C. E17.24 (Ed). West Conshohocken, Pa, USA: ASTM International.
Austroads (2005) Guide to the management of road surface skid resistance. Sydney, Australia: Austroads.
Cenek, PD, DJ Alabaster and RB Davies (1999) Seasonal and weather normalisation of skid resistance
measurements. Transfund NZ research report 139. Wellington, New Zealand.
Cenek, PD, P Carpenter, NJ Jamieson and PF Stewart (2003) Prediction of skid resistance performance of
chipseal roads. Transfund NZ research report 256. Wellington, New Zealand.
Cook, D, J Donbavand and CK Kennedy (2004) A review of skid resistance investigatory levels for New
Zealand. Paper presented at the Towards Sustainable Land Transport Conference, Wellington.
Davis, JR (2006) Hydroplaning issues. Accessed 4 April 2013.
www.msgroup.org/forums/mtt/topic.asp?TOPIC_ID=200
Department of Statistics, University of Auckland (2010) The R project. Accessed 9 August 2012.
www.stat.auckland.ac.nz/uoa/sw-the-r-project
de Pont, J and BD Pidwerbesky (2000) Influences of vehicle loading on pavement wear. Transfund NZ
research report 163.
Descornet, G (1998) Inventory of high-speed longitudinal and transverse road evenness measuring
equipment in Europe. FEHRL technical note 1998/01.
Do, M, H Zahouani and R Vargiolu (2000) Angular paramater for characterizing road surface microtexture.
Transportation Research Record 1723: 66–72.
Dunford, A (2008) The Wehner Schulze machine and its potential to improve aggregate specification.
Surface Friction Conference, Managing Road and Runway Surfaces to Improve Safety, CD-ROM
Conference Proceedings, 11–14 May 2008.
Dunlop, R (2003) State highway initiatives – the safety challenge in road engineering. Paper to NZ Traffic
Institute (Trafinz) Annual Conference, Auckland, New Zealand, August 2003.
Elsenaar, PMW, J Reichert and R Sauterey (1977) Pavement characteristics and skid resistance.
Transportation Research Record 922: 1–25.
Findlay Irvine (2005) Highways – griptesterMK2 skid resistance tester. Accessed 5 Dec 2005.
www.findlayirvine.com/products/prod_det.php?sectorId=16&productId=106
Giles, CG (1957) The skidding resistance of roads and the requirements of modern traffic. Paper presented
at the Proceedings of the UK Institution of Civil Engineers.
Greenwood Engineering (2012) Profilograph. Accessed 8 June 2012. www.greenwood.dk/profilograph.php
Hajek, JJ, TJ Kazmierowski and G Musgrove (1998) Switching to international roughness index
Transportation Research Record 1643: 116–124.

7 References
59
Henry, JJ (2000) Evaluation of pavement friction characteristics (No. NCHRP Synthesis 291). Transportation
Research Board, National Research Council.
Henry, JJ (2003) Measurement of wet runway friction and the international friction index. Paper presented
at the 1st Annual Australian Runway and Roads Friction Testing Workshop, Sydney, Australia, 5–7
August 2003.
Highways Agency (2004) HD 28/04. Skid resistance. In Design manual for roads and bridges (Vol 7).
London, UK: Highways Agency.
Hosking, JR (1976) Aggregates for skid-resistant roads. TRL laboratory report 693. Crowthorne, UK:
Transport Road Research Laboratory.
Hosking, R (1992) Road aggregates and skidding. TRL state of the art review no.4. Crowthorne, UK:
Transport Research Laboratory.
Land Transport New Zealand (2004) A companion document to the Austroads guide to traffic engineering
practice. Part 4. Treatment of crash locations. Wellington: Land Transport New Zealand.
Ministry of Transport (MoT) (2012). Motor vehicle crashes in New Zealand 2011. Yearly report 2012,
Statistical Statement Calendar Year 2011. Wellington: MoT.
NZ Transport Agency (NZTA) (2010) T10 Specification for state highway skid resistance management.
Wellington: NZTA.
Nippo Sangyo (2005) Product guide – ASTM: E 1911-98. Accessed 5 December 2005.
www.nippou.com/en/products/dft.html
O’Flaherty, CA (Ed) (2002) Highways – the location, design, construction and maintenance of pavements.
4th edition. Oxford: Butterworth Heinemann.
Oliver, JWH, PF Tredrea and DN Pratt (1988) Seasonal variation of skid resistance in Australia. Australian
Road Research Board special report no.37. Vermont South, Victoria.
Pazzaglia, R and GS Nelson (1993) United States of America patent no. 5,245,856.
Perera, RW, SD Kohn and S Bermanian (1996) Comparison of road profilers. Transportation research
record 1536: 117–124.
PIARC World Road Association (2003) Road Safety Manual: R2ute market.
Prozzi, JJ (2001) Modelling pavement performance by combining field and experimental data. Unpublished
PhD, University of California, Berkeley.
Roe, PG and SA Hartshorne (1998) The polished stone value of aggregates and in-service skidding
resistance. TRL report 322. Crowthorne, Berkshire: Transport Research Laboratory.
Rogers, MP and T Gargett (1991) Skidding resistance standard for the National Road Network. Highways
and Transportation 38, no.4.
Sayers, MW (1995) On the calculation of IRI from longitudinal road profile. Presented at the 74th Annual
Meeting of the Transportation Research Board.
Sinhal, R (2005) The implementation of a skid policy to provide the required friction demand on the main
road network in the United Kingdom. Paper presented at the Internation Conference Surface Friction
Roads and Runways – Improving safety through assessment and design, Christchurch, New Zealand, 1–
4 May 2005.
Stevenson, H (1997) Chipseal microtexture and polishing. New Zealand Engineering (NZE) 1997 52, no.1.
Transit New Zealand (Transit NZ) (2002) T/10 Specification for skid resistance investigation and treatment
selection. Wellington: Transit NZ.

The effect of road roughness (and test speed) on GripTester measurements
60
Transit New Zealand and Roading NZ (2005) Chipsealing in New Zealand. Wellington.
Viner, HE, R Sinhal and AR Parry (2005) Linking road traffic accidents with skid resistance – recent UK
developments. Paper presented at the International Conference, Surface Friction, Roads and Runways –
Improving Safety through Assessment and Design. Christchurch, New Zealand. 1–4 May 2005.
Wambold, JC, CE Antle, JJ Henry and Z Rado (1995) International PIARC experiment to compare and
harmonize texture and skid resistance measurements. Madrid, Spain: PIARC Technical Committee on
Surface Characteristics C.1.
Wilson, DJ (2006). An analysis of the seasonal and short-term variation of road pavement skid resistance.
Unpublished PhD, The University of Auckland, Auckland.
Wilson, DJ and PM Black (2008) Comparison of skid resistance performance between greywackes and
melter slag aggregates in New Zealand. In International Conference on Managing Road and Runway
Surfaces to Improve Safety, CD-ROM Conference Proceedings, 11–14 May 2008.
Wilson, DJ and PM Black (2009) The skid resistance performance of natural New Zealand aggregates using
a dynamic friction tester. Quarterly Journal of Engineering Geology and Hydrogeology 42, no.1: 61–72.

Appendix A: GripTester device
61
Appendix A: GripTester device
The GripTester device is a continuous friction measurement device that utilises the braked wheel method
and is shown in figure A.1a. It is a three-wheeled skid resistance tester that was originally designed by
Findlay Irvine Limited, Scotland in 1987 for airport runway operations. It can be towed behind a vehicle
with an automatic water delivery system or pushed by hand by the operator. The GripTester has one test
wheel that is braked and two bogey driving wheels (figure A.1b). Its mode of operation is the simultaneous
measurement of drag force (Fd) and load force (Q) on a single treadless ASTM specified rubber test tyre
(standard specification) of 254mm diameter, during braked skidding at approximately 15% of the survey
speed. The fixed slip of the test tyre is achieved by means of a chain and sprocket transmission. The test
wheel axle features strain gauges to measure the tractive longitudinal and dynamic vertical forces acting
on the test tyre. The GripTester reports the surface friction coefficient as a grip number (GN) which is the
fraction of tractive drag force (Fd) over the load force (Q):
Where: GN = braked friction force coefficient by means of a GripTester (ranges from 0 to 1.2)
Fd = drag force (horizontal)
Q = weight force (vertical)
GripTester surveys typically use an automated (or manual) water delivery system that provides a 0.25mm
water film depth beneath the testing tyre. The water film depth can be varied if required. The GN is
measured every 1m but is typically reported as an average over every 10m length.
Figure A.1 The GripTester (Findlay Irvine 2005)
a) GripTester (side view) b) GripTester measuring wheel and chain transmission
The GripTester is commonly used for friction measurements on airport pavements, for research purposes
and more recently for monitoring road networks in the UK, Europe, Australia and New Zealand. The braked
wheel device can be operated in push mode of 5km/h up to a maximum speed of 130km/h. It is relatively
easy to transport (at approximately 85kg weight) and can be used with any towing vehicle. The GripTester
has only one test wheel, and therefore results are typically obtained for the left wheel path of a road lane
only, which is usually the wheel path with the lowest measured surface friction. However, results can be
obtained from the right wheel path separately, given appropriate on-road traffic management. Improvements
to the axle system in the Type D GripTester have resolved the earlier problems that were associated with the
measurement of skid resistance on bends.
The GripTester is compact and highly manoeuverable and is a flexible tool that allows testing on road, air
pavement and footway surfaces and is relatively inexpensive to operate.
FdGNQ
=

The effect of road roughness (and test speed) on GripTester measurements
62
Appendix B: Dynamic Friction Tester device
The Dynamic Friction Tester (DF Tester) is a stationary skid testing device developed by Nippo Sangyo Co.
Ltd. The DF Tester device (see figure B.1a) was designed in Japan mainly to measure the dynamic
coefficient of friction on road surfaces. However, it can also be used as a static device to determine the
friction on laboratory-prepared samples, paved surfaces of footpaths, promenades and amusement parks,
and on floor surfaces of buildings and gymnasiums. It has been found to be very stable with time and to
give highly repeatable measurements, and has been chosen as the standard reference in the recently
revised IFI ASTM International Standard (Henry 2003). The testing procedure and methodology is
described in ASTM Standard Test Method E-1911 (2002).
The DF Tester consists of a horizontal disk that spins with its plane parallel to the test surface. The
spinning disk is fitted with three spring-loaded rubber sliders centred on a diameter of 284mm. These
contact the paved surface as the disk rotational speed decreases due to the friction generated between the
sliders and the paved surface. The DF Tester can be used for laboratory investigations and in the field on
actual paved surfaces. The disk is brought to the desired rotational velocity, corresponding to the
maximum tangential velocity of the sliders (V up to a maximum of 90km/h). Water is introduced in front
of the sliders and the disk is lowered to contact the test surface so that it bears the full velocity of the disk
and model assembly. The torque is monitored continuously as the disk rotational velocity reduces due to
the friction between the sliders and the test surface. The torque signal is reduced to a measurement of
friction by converting the torque to the force on the sliders and dividing by the weight of the disk and
motor assembly. The coefficient of friction (µ) is then calculated as follows:
Where: µ = coefficient of friction as measured by the DF Tester
F= torque force (horizontal)
Q = weight force on the three rubber sliders (vertical)
By holding Q constant and substituting K (a constant of proportionality) for 1/Q,
Thus, the coefficient µ varies in direct proportion to F. The DF Tester has a main motor-driven unit that
consists of a fly wheel and disc with three rubber sliders (refer to figures B.1a and B.1b) attached by leaf
springs, and a control unit. The sliders are pressed onto the test surface by the weight of the device
through three rollers. Each slider is loaded to 11.8N by the leaf springs. The disc and the fly wheel are
connected by a spring balance mounted along a circle on which the rubber sliders are fixed. Due to the
forces on the rubber sliders, displacement occurs in a spring balance. This displacement is converted to
an electrical signal attached to the opposite side of the disc. The signal is output through a slip ring and
brush, both of which are mounted on a driving shaft. The speed of rubber sliders is measured from the
output of a rotational speed dynamo. The friction at 20, 40, 60 and 80km/h is recorded and the friction–
speed relationship is plotted as shown in figure B.1c.
The slider assembly consists of a steel backing plate to which is bonded a 6 x 16 x 20mm rubber shape as
shown in figure B.1b. This shape provides a contact pressure of 150 kPa. The rubber compound is
synthetic rubber as specified by ASTM E501 (2000) and is required to have a shore hardness of 58 ± 2.
F
Qµ =
.K Fµ =

Appendix B: Dynamic Friction Tester device
63
Figure B.1 Dynamic Friction Tester (DF Tester) components (Nippo Sangyo 2005)
a) DF Tester main unit b) DF Tester spinning disk and
rubber sliders
c) DF Tester typical result output.
Figure B.2 DF Tester rubber sliders
The DF Tester has the advantage of being able to measure the friction as a function of speed over the
range of zero to 80km/h. A test result of 0.60 DFT20 signifies the DF Tester coefficient of friction
(µ=0.60) at a spin speed of 20km/h. A significant benefit of the DF Tester is that while being a stationary
device, it has a significantly larger contact area than the British Pendulum Tester, and is less affected by
individual aggregate chips. It has been found to produce stable and highly repeatable measurements over
time. These benefits enable the use of this device as a calibration device for other continuous friction
measurement devices such as the GripTester and ROAR (Wambold et al 1995).

The effect of road roughness (and test speed) on GripTester measurements
64
Appendix C: Accelerometer calibration
Regular calibration of the accelerometer was carried out during the project to confirm that the
accelerometer outputs were valid. The calibration procedures for the Sensotec Accelerometer are simple as
it is a tri-axial accelerometer. The calibration of the accelerometer includes exposing a positive one unit of
gravitational force when rested on its upright position with the appropriate axle measuring the
acceleration. The accelerometer is also then exposed to a zero gravitational force when placed on its side
and negative one unit of gravitational force when the accelerometer is laid upside down.
In order to obtain accurate results during calibration, the tri-axial accelerometer was laid on a levelled
surface. The calibration process commenced with connecting the accelerometer to the amplifiers, LabJack2
and a laptop computer. The accelerometer was then placed on the levelled surface on an upside-down,
side and upright position in turn (figures C.1, C.2 and C.3). Since the acceleration readings fluctuate
slightly, it was necessary to record three readings for each of the three sides using the LJStream3 program
as illustrated in table C.1. The readings were then averaged and plotted onto a voltage against a gravity
diagram (refer to figure C.4). The gradient of voltage against gravity divided by the gain provides the
correction factor for the accelerometer.
The result obtained from the calibration of the accelerometer is shown in table C.1:
Table C.1 Accelerometer calibration results
Gravitational force Voltage (volts)
Reading 1 Reading 2 Reading 3 Average
-1g 8.1065 8.1432 8.1445 8.1314
0g 7.0202 7.0257 7.0193 7.0217
+1g 5.9347 5.9163 5.9145 5.9218
Figure C.1 Upright position Figure C.2 Sideway position Figure C.3 Upside down
position
The sensitivity (+/-10g) of the Sensotec Accelerometer was 3.320 mV/g.
2LabJack is a USB or Ethernet-based measurement and automation device that provides analogue inputs, outputs and
digital inputs, outputs. 3LJStream is the software that Labjack uses to read, graph and write to file up to four channels. It scans data at a rate
ranging from 50 to 300 scans per second.

Appendix C: Accelerometer calibration
65
Figure C.4 Accelerometer readings against gravity diagram
C1 Amplifying device
The Sensotec Accelerometer is a standard accelerometer design with a limited voltage output. In order to
obtain usable readings an amplifying device was needed to increase the output voltages. The amplifier
used in this experiment had amplifying gain that increased the output voltage 100 times. The amplifying
device allowed up to eight separate inputs and was connected to a 15 volt DC (direct current) power
supply (see figure C.5).
Figure C.5 Amplifier and DC power supply
This research project used LabJack’s precision-timing crystal and high-speed sample buffer in ‘stream
mode’ (the data is acquired from a maximum of four channels at a speed of 1200 samples per second) to
transfer data continuously from the source to the PC. Figure C.6 shows the interface of LJStream, which
consists of an ‘on & off’ signal, the user-assigned scan rate, and numerical and graphical outputs. The
LJStream channel configuration allows the user to supply the scale factor of the accelerometer after
calibration and thus the LJStream will calculate the outputs according to the scaled functions.
56789
-1 -0.5 0 0.5 1Coefficient of Gravity
Acc
eler
omet
er R
eadi
ngs
(Vol
ts)

The effect of road roughness (and test speed) on GripTester measurements
66
Figure C.6 LJStream interface
C1.1 Accelerometer and data capture setup
The Sensotec Accelerometer is a delicate measuring device which can be easily damaged or supply
inaccurate results due to moisture and/or dust. To provide a stable operating environment the
accelerometer was secured in a waterproof aluminium case. It was then fastened to the GripTester’s
measuring axle to measure the vertical accelerations (or vertical movements) experienced during testing
due to the unevenness (or roughness) of the road surface. In order to obtain precise measurements, a
levelling bubble was used to ensure that the accelerometer was parallel to the ground surface. Protective
tape secured the accelerometer and its cables to the axle to prevent wearing or damage. The results
provided by the accelerometer by itself were too small to analyse and therefore, the amplifying device was
used to increase the voltage output by 100 times. The LabJack was connected to the amplifying device to
the laptop computer (with LJStream installed) via the USB cable in the back of the towing vehicle and is
shown in figure C.7.
Figure C.7 Accelerometer related equipment setup in the back of the vehicle
LJStream
configuration
channels
Laptop computer with
LJStream installed LabJack, connected to
amplifier and laptop
15 volts power supply
Amplifier
On & off signal
Working directory
Graphical
output
Numerical outputs

Appendix D: Processing and analysing raw data
67
Appendix D: Processing and analysing raw data
Raw data obtained from the GripTester and DF Tester all required further data processing before the
information could be analysed. After the data was reformatted, results were plotted into graphical outputs
and descriptive statistical parameters were calculated.
Due to the large amount of data and graphical plots and results produced in this research, only an
example is provided to demonstrate the process.
D1 Processing raw GripTester data
The Roadbase data is stored in database table format which can be opened with Microsoft Access
software. Macro templates were developed in Microsoft Excel using Visual Basic Application (VBA). The
template allowed up to three Roadbase survey runs (10m averaged) to be processed and compared with
one airport run (1m) for each test location and/or test speed undertaken.
Raw test data headers, recorded grip number (GN), test operating speed and the water flow from the
airport and Roadbase database were imported into the Excel template (refer to figure D.1 as an example).
Four similar formatted worksheets were created for each of the testing speeds of 30km/h, 50km/h,
70km/h and 90km/h.
Figure D.1 GripTester macro template after raw data imported
After the raw GripTester data had been processed by the macro templates it was sorted into test speeds.
As noted earlier, raw data obtained from the GripTester included the GNs in respect of the section
displacement from the predefined starting point of the test section.
Figure D.2 displays an example of a graphical output illustrating the relationship between the GN obtained
and the displacement of the test section of section A1 (Glenbrook Road – see table 4.2). This section has
NAASRA roughness ranging from 50 to 70 counts per kilometre and a macrotexture depth of at least 2mm.
As shown in figure D.2, there were two sets of results. The top set of graph series (Y1 axis) shows the
results as measured from the GripTester. The lower set of data (Y2 axis) shows speed (in km/h) of the
GripTester recorded for each test survey.

The effect of road roughness (and test speed) on GripTester measurements
68
Figure D.2 Grip number (GN) against section displacement for the testing speed of 30km/h
As shown in figure D.2 (an example graph) the results obtained from the first 1m average test run are
lower when compared with subsequent test runs. This pattern is repeated each time a new location set up
for the GripTester occurs and is thought to be due to the measuring tyre and axle strain gauges needing
to have some ‘test measuring distance’ to be ‘conditioned’. This effect has been seen on previous projects
and by other researchers and is more acute when short test sections such as in this research project are
used. For this reason, it was decided to call the first run a ‘warm-up run’ and not to include the results in
subsequent analysis.
As also shown in figure D.2 the 10m averaged test run result understandably varies or oscillates vertically
less when compared with the results obtained for every 1m test run as it reports an average of 10 test
points at one time. The 10m averaged result follows reasonably close to the mean of the other three runs
(except the first 30km/h 1m averaged results) and it is therefore reasonable to conclude that both the
Airbase and Roadbase software produce the same coefficient of friction; however, post processed and
therefore reported in a different manner. The 1m test runs would better reflect what occurs to the
GripTester on road sections that have high road roughness as it could be expected that the variations
around the true mean result would be higher with the 1m testing methodology.
The results obtained from test section A1 illustrate the site section was relatively homogenous. The GNs
obtained during the testing for the entire section only fluctuated slightly around the GN value of 0.8; many
of the other sections demonstrated their results in a similar way.
D2 Descriptive statistical analysis
A descriptive statistical analysis of the processed test run results was plotted to quickly visually evaluate
the similarities and/or variations between the three 1m averaged results for each of the test speeds. This
was intended to assist the understanding of the repeatability and reliability of the GripTester results as
well as to be a comparison for other friction-measuring devices such as the DF Tester. This analysis was
Section A1 - Glenbrook Rd 13200-13400 Increasing - 20 February 2006 - 30km/hr
0
0.2
0.4
0.6
0.8
1
1.2
0 50 100 150 200 250Chainage
Grip
Num
ber
0
10
20
30
40
50
60
70
80
90
100
1m Average GN - Average 1m Average GN - Run01 1m Average GN - Run021m Average GN - Run03 10m Average GN 1m Average Speed - Average1m Average Speed - Run01 1m Average Speed - Run02 1m Average Speed - Run0310m Average Speed - Average
NAASRA Roughness: 50-70 counts/kmMPD Texture: >2mm Speed Limit: 100km/hr

Appendix D: Processing and analysing raw data
69
undertaken between the three 1m averaged results because only one test run was performed with the 10m
averaged mode of operation. The following descriptive statistical parameters were calculated and plotted
using the following macros in the Excel template:
• sample average
• geometric mean
• median
• maximum
• minimum
• range
• variance
• standard deviations
• 95th percentile confidence limits.
Figure D.3 is an example of the GN plotted against the section displacement for the same test section as
figure D.2. The higher set of data plotted in figure 5.3 shows the sample parameters in terms of the GN
and the lower set of data series on the graph represents the descriptive statistical variables: variance,
standard deviations and the 95th percentile confidence interval between the test runs.
Figure D.3 Comparison between grip number and distance for test speed 30km/h
Statistical Analysis - Section A1 - Glenbrook Rd 13200-13400 Increasing - 20 February 2006 - 30km/hr
0
0.1
0.2
0.3
0.4
0.5
0.6
0.7
0.8
0.9
1
0 50 100 150 200 250 300
Chainage (m)
Grip
Num
ber (
GN
)
AVE GEOMEAN MEDIAN MAX MIN RANGE DEVSQ STDEV 95% CONF

The effect of road roughness (and test speed) on GripTester measurements
70
In this situation, the standard deviations shown in figure D.3 were relatively high, due to the first
GripTester survey needing to be eliminated from the analysis as it had not yet been fully ‘conditioned’ (as
discussed above). This effect can be shown by studying a different test speed descriptive statistical plot
where the GripTester tyre and axle were fully conditioned. Figure D.4 shows the same example test
section, but with a test speed of 50km/h and immediately after the 30km/h test runs. The variation
analyses such as the standard deviation, range and variance had a significantly lower level compared with
figure D.3, demonstrating the effect of the much lower ‘warm-up run’ when the tyre and axle have not
been adequately ‘conditioned’.
Figure D.4 Comparison between grip number and distance for test speed of 50km/h
D4 Processing Dynamic Friction Tester data
The results generated by the DF Tester were also stored as database file format (.dat). Further macros
were written to import and analyse the data.
D4.1 Methodology for analysing Dynamic Friction Tester results
Three testing points were selected within each of the test sections which provided three sets of raw data.
These were then imported into Excel where they were analysed and the data point plotted to produce
three separate graphs. The results of this are shown in figure D.5.
Statistical Analysis - Section A1 - Glenbrook Rd 13200-13400 Increasing - 20 February 2006 - 50km/hr
0
0.1
0.2
0.3
0.4
0.5
0.6
0.7
0.8
0.9
1
0 50 100 150 200 250 300
Chainage (m)
Grip
Num
ber (
GN
)
AVE GEOMEAN MEDIAN MAX MIN RANGE DEVSQ STDEV 95% CONF

Appendix D: Processing and analysing raw data
71
Figure D.5 DF Tester results (CoF) against slip speed
The graphical plot shown in figure D.5 is an example of the DF Tester results against slip speed, which
were extracted from the first position situated at the 50th metre from the origin of section. As the DF
Tester grinds to a halt when the rotational disk speed is less than approximately 15km/h the reported
result becomes erratic and should not be used. The other end of the graph should similarly not be used.
As shown in figure D.6, the position chosen was tested with three identical test runs to ensure the DF
Tester provided repetitive and reliable data.
Figure D.6 Grip number and coefficient of friction against section displacement
Section A1 - Glenbrook Rd 13200-13400 Increasing - 20 April 2006 - DFTesting - Coefficient of Friction vs. Speed - Point 01
0
100
200
300
400
500
600
700
800
0 20 40 60 80 100 120 Speed (km/hr)
Coefficient of Friction (µ)
Position 1 - Average Position1 - Run 01 Position1 - Run 02 Position1 - Run 03
NAASRA Roughness: 50-70 counts/km MPD Texture: >2mm Speed Limit: 100km/hr
Section A1 - Glenbrook Rd 13200-13400 Increasing - 20 February 2006 - 30km/hr
0
0.2
0.4
0.6
0.8
1
1.2
0 50 100 150 200 250Chainage
Grip
Num
ber &
DFT
Num
ber
0
10
20
30
40
50
60
70
80
90
100
1m Average GN - Average 1m Average GN - Run01 1m Average GN - Run021m Average GN - Run03 10m Average GN DFT Results1m Average Speed - Average 1m Average Speed - Run01 1m Average Speed - Run021m Average Speed - Run03 10m Average Speed - Average
NAASRA Roughness: 50-70 counts/kmMPD Texture: >2mm Speed Limit: 100km/hr

The effect of road roughness (and test speed) on GripTester measurements
72
The DF Tester CoF results were taken with a slip speed of 20km/h. In this research, results obtained from
the DF Tester data were averaged between 20km/h and 40km/h slip speed. Table D.1 shows this
comparison for three equivalent positions on the test section. The table shows this at a 30km/h speed at a
macrotexture of >1.7mm. Comparison tables were constructed for each position within all of the test sites.
Table D.1 Statistical analysis for GripTester and DF Tester (30km/h)
Roughness: NAASRA 50–70 counts/km. Macrotexture: >1.7 mm
Statistical analysis Section
ave GN30
Time slice Ave DFT20
50m 100m 150m P1 P2 P3
Mean 0.733 0.704 0.713 0.666 0.565 0.546 0.535
Maximum 0.797 0.767 0.790 0.700 0.575 0.562 0.548
Minimum 0.641 0.597 0.650 0.633 0.554 0.535 0.521
Range 0.156 0.170 0.140 0.067 0.021 0.027 0.027
Standard deviation 0.083 0.094 0.071 0.033 0.011 0.014 0.014
Variance 0.015 0.018 0.010 0.002 0.222 0.402 0.369
95% confidence interval 0.005 0.006 0.004 0.002 0.001 0.001 0.001
Coefficient of variation 0.113 0.133 0.100 0.050 0.019 0.026 0.025
As shown in table D.1, statistical calculations for the GripTester are shown under the three ’Time slice’
columns. The statistical calculations for each of the time slices were obtained respectively according to the
same displacement to the first point (P1), second point (P2) and third point (P3) of the DF Tester results.
Table D.1 clearly shows the DF Tester variations were considerably lower than those of the GripTester; this
indicates that the results obtained from the DF Tester were more repeatable. This would be expected as
the DF Tester is a stationary device and therefore a repeat test is over the exact same location. The
GripTester, however, relies on the skills of the driver to try and drive over the same line and is therefore
more variable.

Appendix E: Processed test data results
73
Appendix E: Processed test data results
Table E.1 is a summary of the road roughness and surface textures for each of the test sites. The actual
road roughness and textures were measured with the PMS laser profilograph and the base road roughness
and textures were obtained from the RAMM database.
Table E.1 Summary of test site roughness and texture
Test
section
Road roughness Surface textures
Measured RAMM Measured RAMM
A1 54.51 50-70 1.76 >2
A2 96.73 90–110 1.54 >2
A3 96.94 90–110 1.85 1-2
A4 103.19 90–110 1.44 1-2
B1 71.46 70–90 1.79 >2
B2 90.55 90–110 1.79 >2
B3 82.22 70–90 2.30 >2
C1 70.23 50–70 0.45 <1
C2 68.08 50–70 1.40 <1
C3 84.96 70–90 0.87 <1
D1 64.99 50–70 1.46 >2
D2 76.21 50–70 1.17 1–2
D3 76.50 70–90 1.61 1–2
D4 68.25 50–70 1.08 1–2
D5 69.06 70–90 1.39 1–2
D6 46.64 70–90 0.38 <1
F1 115.15 110–130 2.40 >2
F2 171.20 >130 2.32 >2
F3 157.75 110–130 2.27 >2
Table E.2 shows the actual roughness of the six test sections and the corresponding averaged GN and DF
Tester result obtained from the two skid resistance measuring devices during the experimental testing on site.
Table E.2 Summarised GripTester results for the very low roughness test sections
Test
section
Roughness
(counts/km)
Texture
(mm)
Test speed
(km/h)
Grip
number
DFT speed
(km/h) CoF
D6 46.64 0.38 31.54 0.67 30.00 0.71
47.36 0.56 50.00 0.67
A1 54.51 1.76
32.74 0.73 30.00 0.55
49.57 0.72 50.00 0.54
67.58 0.68 70.00 0.58
82.72 0.50
D1 64.99 1.46 29.61 0.53 30.00 0.61

The effect of road roughness (and test speed) on GripTester measurements
74
Test
section
Roughness
(counts/km)
Texture
(mm)
Test speed
(km/h)
Grip
number
DFT speed
(km/h) CoF
47.06 0.51 50.00 0.54
65.54 0.52
76.98 0.53
C2 68.08 1.40
31.24 0.56 30.00 0.74
47.82 0.51 50.00 0.71
63.30 0.47
D4 68.25 1.08
33.12 0.43 30.00 0.66
47.65 0.41 50.00 0.60
65.01 0.46
77.47 0.42
D5 69.06 1.39 30.99 0.53 30.00 0.68
48.01 0.55 50.00 0.56
Table E.3 shows another six sites that were classified as low road roughness with the targeted roughness
bandwidth between 70 and 90 counts/km.
Table E.3 Summarised GripTester results for the low roughness test sections
Test
section
Roughness
(counts/km)
Texture
(mm)
Test speed
(km/h)
Grip
number
DFT speed
(km/h) CoF
C1 70.23 0.45 30.58 0.54 30.00 0.62
44.54 0.46 50.00 0.61
B1 71.46 1.79
31.45 0.58
49.41 0.55
67.99 0.61
85.39 0.57
D2 76.21 1.17 30.49 0.53 30.00 0.72
46.20 0.54 50.00 0.58
D3 76.50 1.61
32.25 0.47 30.00 0.73
48.38 0.44 50.00 0.63
62.73 0.45
B3 82.22 2.30
31.24 0.71 30.00 0.66
48.92 0.59 50.00 0.64
66.80 0.65
83.01 0.66
C3 84.96 0.87 30.81 0.59 30.00 0.53
42.03 0.54 50.00 0.54
Table E.4 summarises the GripTester and DF Tester results obtained for test sections that had targeted
NAASRA road roughness between 90 to 110 counts/km.

Appendix E: Processed test data results
75
Table E.4 Summarised GripTester results for the medium roughness test sections
Test
section
Roughness
(counts/km)
Texture
(mm)
Test speed
(km/h)
Grip
number
DFT speed
(km/hr) CoF
B2 90.55 1.79
30.82 0.57 30.00 0.70
49.85 0.55 50.00 0.57
67.61 0.61
85.40 0.56
A2 96.73 1.54
31.55 0.68
48.54 0.65
67.97 0.61
86.10 0.47
A3 96.94 1.85
34.59 0.68 30.00 0.67
50.05 0.59 50.00 0.62
68.14 0.56
80.52 0.60
A4 103.19 1.44
31.45 0.55 30.00 0.57
48.98 0.49 50.00 0.53
65.58 0.48
83.48 0.48
A high road roughness test section was located on Rukuhia Rd in Waipa District Council (F1) for a targeted
roughness range between 110 and 130 counts/km. Test section F1 was situated on a very low traffic
volume arterial road and the measured data is shown in table E.5.
Table E.5 Summarised GripTester results for the high roughness test sections
Test
section
Roughness
(counts/km)
Texture
(mm)
Test speed
(km/h)
Grip
number
DFT speed
(km/h) CoF
F1 115.15 2.40
33.72 0.64 30.00 0.71
48.41 0.60 50.00 0.62
70.70 0.58
The last classification of road roughness was the very high road roughness (ie >130 NAASRA counts/km).
Only two test sites in Rukuhia Rd of Waipa District Council were selected – refer to table E.6.
Table E.6 Summarised GripTester results for test sections with very high roughness bandwidth
Test
section
Roughness
(counts/km)
Texture
(mm)
Test speed
(km/h)
Grip
number
DFT speed
(km/h) CoF
F3 157.75 2.27
29.99 0.57 30.00 0.65
48.60 0.55 50.00 0.60
67.74 0.52
F2 171.20 2.32
30.94 0.60 30.00 0.70
48.48 0.59 50.00 0.59
68.80 0.57
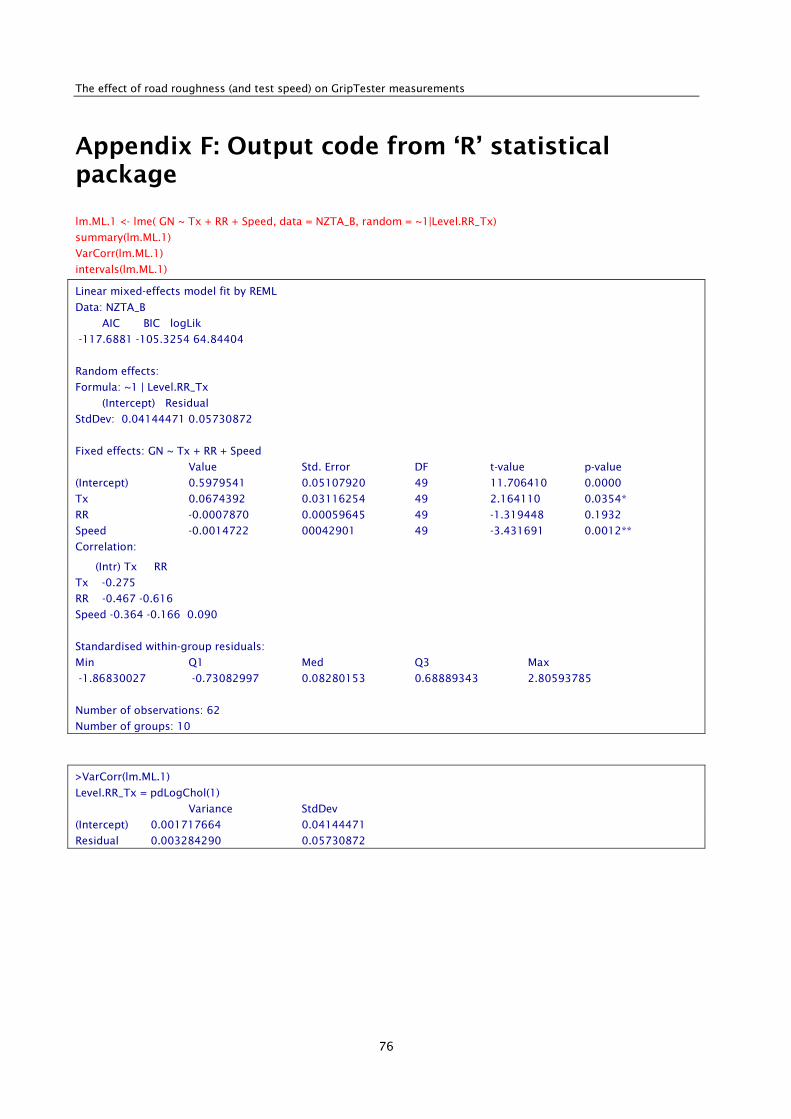
The effect of road roughness (and test speed) on GripTester measurements
76
Appendix F: Output code from ‘R’ statistical package
lm.ML.1 <- lme( GN ~ Tx + RR + Speed, data = NZTA_B, random = ~1|Level.RR_Tx)
summary(lm.ML.1)
VarCorr(lm.ML.1)
intervals(lm.ML.1)
Linear mixed-effects model fit by REML
Data: NZTA_B
AIC BIC logLik
-117.6881 -105.3254 64.84404
Random effects:
Formula: ~1 | Level.RR_Tx
(Intercept) Residual
StdDev: 0.04144471 0.05730872
Fixed effects: GN ~ Tx + RR + Speed
Value Std. Error DF t-value p-value
(Intercept) 0.5979541 0.05107920 49 11.706410 0.0000
Tx 0.0674392 0.03116254 49 2.164110 0.0354*
RR -0.0007870 0.00059645 49 -1.319448 0.1932
Speed -0.0014722 00042901 49 -3.431691 0.0012**
Correlation:
(Intr) Tx RR
Tx -0.275
RR -0.467 -0.616
Speed -0.364 -0.166 0.090
Standardised within-group residuals:
Min Q1 Med Q3 Max
-1.86830027 -0.73082997 0.08280153 0.68889343 2.80593785
Number of observations: 62
Number of groups: 10
>VarCorr(lm.ML.1)
Level.RR_Tx = pdLogChol(1)
Variance StdDev
(Intercept) 0.001717664 0.04144471
Residual 0.003284290 0.05730872

Appendix F: Output code from ‘R’ statistical package
77
intervals(lm.ML.1)
Approximate 95% confidence intervals
Fixed effects:
lower est. upper
(Intercept) 0.495306597 0.5979540988 0.7006016010
Tx 0.004815711 0.0674391879 0.1300626645
RR -0.001985592 -0.0007869832 0.0004116259
Speed -0.002334338 -0.0014722173 -0.0006100967
attr(,"label")
[1] "Fixed effects:"
Random effects:
Level: Level.RR_Tx
lower est. upper
sd((Intercept)) 0.01830692 0.04144471 0.09382592
Within-group standard error:
lower est. upper
0.04690745 0.05730872 0.07001637
lm.df <- lm( GN ~ Tx + speed + RR + level.RR_Tx, data = NZTA_B)
summary(lm.df)
lm(formula = GN ~ Tx + Speed + RR + Level.RR_Tx, data = NZTA_B)
Residuals:
Min 1Q Median 3Q Max
-0.120583 -0.032715 -0.003345 0.036078 0.129010
Coefficients:
Estimate Std. Error t value Pr(>|t|)
(Intercept) 0.8245105 0.0892505 9.238 2.61e-12 ***
Tx -0.0007912 0.0666631 -0.012 0.990579
Speed -0.0015027 0.0004245 -3.540 0.000888 ***
RR -0.0014352 0.0021549 -0.666 0.508526
Level.RR_Tx1L -0.1688868 0.0804213 -2.100 0.040898 *
Level.RR_Tx1M -0.1268659 0.0571262 -2.221 0.031019 *
Level.RR_Tx2H -0.0104163 0.0499246 -0.209 0.835593
Level.RR_Tx2L -0.1245396 0.1216675 -1.024 0.311049
Level.RR_Tx2M -0.1616163 0.0750810 -2.153 0.036305 *
Level.RR_Tx3H -0.0108121 0.0885478 -0.122 0.903316
Level.RR_Tx3M -0.0415289 0.1171693 -0.354 0.724534
Level.RR_Tx4H 0.0258701 0.1114599 0.232 0.817426
Level.RR_Tx5H 0.0537955 0.2147394 0.251 0.803236
---
Signif. codes: 0 ‘***’ 0.001 ‘**’ 0.01 ‘*’ 0.05 ‘.’ 0.1 ‘ ’ 1
Residual standard error: 0.05612 on 49 degrees of freedom
Multiple R-squared: 0.5558, Adjusted R-squared: 0.447
F-statistic: 5.11 on 12 and 49 DF, p-value: 1.885e-05

The effect of road roughness (and test speed) on GripTester measurements
78
Appendix G: Glossary
AADT annual average daily traffic volume
AAV aggregate abrasion value
ABS anti-lock braking system
ADT average daily traffic
AGD average greatest dimension of the sealing chip (mm)
AIV aggregate impact value
ALD average least dimension of the sealing chip (mm)
AP accelerated polishing
APM accelerated polishing machine
ARRB ARRB Group Limited (formerly ARRB Transport Research, Melbourne, Australia)
ASTM American Society for Testing and Materials (now known as ASTM International)
AVE average
BC/BCR benefit–cost ratio
BFC braking force coefficient
BPN British Pendulum number
BS British Standard
CEN Committee for European Normalisation
CoF coefficient of friction
CoV coefficient of variation
CVD number of HCVs/lane/day ≥3.5 tonnes
Dec/‘decreasing’ linear referencing position – decreasing direction of travel
DF Tester Dynamic Friction Tester device
DFT20 Dynamic Friction Tester CoF at 20km/h slip speed
DPR distance per rotation
dTIMS Deigton’s Total Infrastructure Management System
EN European normative
ESC equilibrium SCRIM coefficient
ESR equilibrium skid resistance
GN grip number (CoF from GripTester device)
GN50 grip number at 50km/h g
HCV heavy commercial vehicles
HMA hot mix asphalt
HSD high-speed data
IL investigatory level
Inc/‘Increasing’ linear referencing position – increasing direction of travel
IPENZ NZ Institution of Professional Engineers

Appendix G: Glossary
79
IRI International Roughness Index
ISO International Standards Organisation
km kilometres
km/h kilometres per hour
LA local authority
LCV light commercial vehicles
LGA Local Government Act 2002
LTMA Land Transport Management Act 2003
LTSA Land Transport Safety Authority
LWP left wheel path
µ DF Tester CoF value
MAX maximum value
MIN minimum value
MPD mean profile depth
MSSC mean summer SCRIM coefficient
MTD mean texture depth
MWD Ministry of Works and Development
NAASRA National Association of Australian State Roads Authority
NRB National Roads Board
NZ dTIMS Implementation of Predictive Modelling for Road Management software
NZS New Zealand Standard
OGA open-graded asphalt
OGPA open-graded porous asphalt
PCC Portland Cement Concrete
PMS Pavement Management Systems Ltd
PSD particle size distribution
PSMC Performance Specified Maintenance Contract
PSV polished stone value
QA quality assurance
r coefficient of correlation
R2 coefficient of determination
RAMM NZTA road assessment and maintenance management database
RCA road controlling authorities
RIMS Road Information Management System
RMA Resource Management Act 1991
RNZ Roading New Zealand
RoAR road analyser and recorder machine
rpm revolutions per minute
RR road roughness

The effect of road roughness (and test speed) on GripTester measurements
80
RRL Road Research Laboratory (UK)
RRU Road Research Unit
RS reference station
RTRRMS response-type road roughness measuring systems
RWP right wheel path
SC sealing chip
SCRIM Sideway-force Coefficient Routine Investigation Machine
SFC sideway friction coefficient
SFC50 sideway-force coefficient at 50km/h
SLP stationary laser profilometer
SMA stone mastic asphalt
SMTD sensor measured texture depth
SN40, SN64 skid number at 40mph, skid number at 64km/h (US locked wheel tester)
SNZ Standards New Zealand
SRV skid resistance value
STDEV standard deviation
t tonne
Td texture (macrotexture) depth (mm)
Tf traffic factor
TL threshold level
TMP traffic management plan
TNZ Transit New Zealand
TOC total organic carbon
TPH total petroleum hydrocarbons
TRRL Transport and Road Research Laboratory (UK)
TRL Transport Research Laboratory (UK)
UK United Kingdom
US, USA United States of America
v/l/d vehicles per lane per day
vpd vehicles per day
VTI The Swedish National Road and Transport Research Institute