Royal LePage Franchise Services Fund Interim Report … · Royal LePage Franchise Services Fund...
32
Royal LePage Franchise Services Fund Interim Report to Unitholders Q2 2005 TSX-RSF.un RLP_Q2_Cover 8/10/05 3:20 PM Page 1
-
Upload
trannguyet -
Category
Documents
-
view
216 -
download
0
Transcript of Royal LePage Franchise Services Fund Interim Report … · Royal LePage Franchise Services Fund...

Royal LePage Franchise Services FundInterim Report to Unitholders Q2 2005TSX-RSF.un
RLP_Q2_Cover 8/10/05 3:20 PM Page 1

Royal LePage Franchise Services FundInterim Report to Unitholders Q2 2005
Q2
RLP_Q2_Cover 8/10/05 3:20 PM Page 2

About the Royal LePage Franchise Services FundThe Royal LePage Franchise Services Fund is a leading provider of services to residential realestate brokers and their agents. The Fund generates cash flow from franchise royalties andservice fees derived from a national network of real estate brokers and agents in Canada operating under the Royal LePage and Johnston & Daniel brand names. As at June 30, 2005,the Fund Network is comprised of 264 franchise agreements, operating from 565 locationsserviced by 11,218 agents and sales representatives. The Fund has approximately 20% market share of the Canadian residential resale real estate market based on transactional dollar volume. Royal LePage Franchise Services Fund is a TSX listed income trust, which paysmonthly distributions and trades under the symbol “RSF.UN”.
RLP_Q2_Cover 8/10/05 3:20 PM Page 3

Communications to unitholdersWe regularly provide unitholders with information about the Fund through our annual report,quarterly interim reports and periodic press releases. All up-to-date information is availableonline at www.rsfund.ca. On the site you will find summary information about the company,public reports, press releases, statutory filings, units and distribution information.
Contact usWe welcome inquiries from unitholders, analysts, media representatives and other interestedparties.
Please direct inquiries to:Pamela KempthorneInvestor Relations Officer(416) [email protected]
Head officeRoyal LePage Franchise Services Fund39 Wynford DriveDon Mills, ONM3C 3K5Telephone: (416) 510-5800 Facsimile: (416) [email protected]
Transfer agent and registrarCIBC Mellon Trust Company
AuditorsDeloitte & Touche LLP
Corporate counselGoodman and Carr LLP
RLP_Q2_Cover 8/10/05 3:20 PM Page 4

LETTER TO UNITHOLDERS
Q2 2005 UNITHOLDER REPORT
Financial and Operating HighlightsFor the three months ended June 30, 2005 (thousands) (per unit)
Royalties $ 7,138 $ 0.54Net earnings $ 1,436 $ 0.14Distributable cash $ 5,476 $ 0.41Distributions $ 3,662 $ 0.28
We are pleased to present our results for the second quarter ended June 30, 2005, thestrongest in the Fund’s history.
Royalty revenue increased to $7.1 million and net earnings to $1.4 million, representing 12%and 18% increases respectively, over the second quarter of 2004. Distributable cash totaled$5.5 million, up 8% over the same period in 2004. Growth in royalty revenue was driven by a13% increase in the Fund’s underlying network of agents and sales representatives for thetwelve months ended June 30, 2005 and continued strength in the Canadian residential resalehousing market.
An unprecedented 295 agents were added to the Fund Network during the second quarter andin addition to the 168 agents recruited in the first quarter, the Fund has already exceeded theannual growth target of 400 agents. Royal LePage is a highly valued real estate brand in everyprovince and we continue to attract high performing broker-owners and agents with ourunique suite of web-based marketing and business process automation services. To help ourRealtors leverage these tools, we have invested heavily in training and coaching programs.
Due to solid second quarter performance, the Fund's cash reserve grew to $5.6 million from $3.8million in the previous quarter. This puts the fund in an excellent position to maintain stabledistributions through periods of seasonal fluctuation, and to fund future growth initiatives.
Growth PipelineIn addition to the 463 agents added by organic recruitment in 2005, the Fund grew through theacquisition of 558 agents represented by 38 franchise contracts on January 1, 2005. Total agentgrowth for the six months ended June 30, 2005, is 1,021, well ahead of management's expectations.
An additional 179 agents are in the acquisition pipeline as of June 30, 2005.
Royalty Fee Structural Change Effective July 1, 2005, franchises will begin paying a fixed $100 monthly fee for salesrepresentatives. This impacts only sales representatives that are selling-Realtors, and excludesbroker-owners and managers. Fund management anticipates that a minimum of 400 salesrepresentatives will contribute royalties under the new fee structure.
OutlookThe second quarter saw a softening in the rate of price appreciation in major markets.However, there was no corresponding softening of demand. In most urban markets, increased
1TSX-RSF.un
Interim Report to Unitholders
Q2 2005
RLP_Q2_Text05 8/10/05 3:19 PM Page 1

inventory gave buyers more selection over last year and curbed price increases somewhat.Strong economic fundamentals and low interest rates have kept the demand for homes amongCanadians resolutely high, and we anticipate that the pace of market growth should moderatein the second half of 2005 as latent demand is satisfied and listing inventories continue to rise.Annual house price appreciation should fall from the double-digit increases seen in 2004 tomid-single digit levels by year end; moving us from a market skewed in the seller's favour, tomore balanced conditions.
Philip Soper Kevin A. CashPresident & Chief Executive Officer Chief Financial Officer
2 TSX-RSF.un
Royal LePage Franchise Services Fund
TSX-RSF.un
RLP_Q2_Text05 8/10/05 3:19 PM Page 2

MANAGEMENT’S DISCUSSION AND ANALYSIS OFRESULTS AND FINANCIAL CONDITION
FINANCIAL HIGHLIGHTS
Three Months Three Months Six Months Six MonthsEnded Ended Ended Ended
June 30 June 30 June 30 June 30($ 000's) 2005 2004 2005 2004
Royalties $ 7,138 $ 6,397 $ 12,734 $ 11,252 Less:
Administration expenses 145 93 268 179Interest expense 602 296 1,083 657Management fee 915 950 1,830 1,831
Earnings and
distributable cash $ 5,476 $ 5,058 $ 9,553 $ 8,585
Distributions $ 3,662 $ 3,664 $ 7,323 $ 7,324 Number of agents and
sales representatives 11,218 9,922 11,218 9,922
The table above sets out selected historical information and other data which should be readin conjunction with the attached interim consolidated financial statements for the threemonths (the “Quarter”) and six months ended June 30, 2005. The interim consolidatedfinancial statements are prepared in Canadian dollars and are in accordance with Canadiangenerally accepted accounting principles. External economic and industry factors remainsubstantially unchanged, unless otherwise stated.
OVERVIEWThis Management Discussion and Analysis (“MD&A”) covers the period from January 1, 2005to June 30, 2005 and has been prepared as at August 3, 2005.
Royal LePage Franchise Services Fund (the “Fund”) was established on August 7, 2003, throughan initial public offering. The Fund generates cash flow from the franchise royalties and servicefees of a national network of real estate franchisees, agents and sales representatives, operatingunder the Royal LePage and Johnston & Daniel brand names (collectively the “Fund Network”).
Management of the Fund is governed by a Management Services Agreement (“MSA”). Theservices under the MSA are provided by Residential Income Fund Manager Limited (“RIFML”),a division of Centract Residential Property Services (“Centract”), the residential real estateservices division of Brascan Corporation. The senior management of Centract developed andmanaged the Fund Network prior to the inception of the Fund. Brascan Corporation, througha wholly owned subsidiary, holds a 25% subordinated interest in the Fund (see Transactionswith Related Parties).
As at June 30, 2005, the Fund Network was comprised of 10,376 agents and 842 salesrepresentatives operating from 565 locations under 264 franchise agreements. The FundNetwork has an approximate one-fifth share of the Canadian residential resale real estatemarket based on transactional dollar volume.
3TSX-RSF.un
Interim Report to Unitholders
Q2 2005
RLP_Q2_Text05 8/10/05 3:19 PM Page 3

STRUCTURE OF THE FUNDThe Fund generates royalties with both fixed and variable fee components. A summary ofthese fees is as follows:
Royalty FeesFixed franchise fees are based on the number of agents in the Fund Network and consist ofa monthly flat fee of $100 per agent, a technology fee and web services and other fees.
Variable franchise fees are primarily driven by the total transaction dollar volume of businesstransacted by our agents. The Fund receives 1% of each agent’s gross commission income,subject to a cap of $1,300 per year. In addition, 22 of the Fund’s larger locations situated inthe Greater Toronto Area (“GTA”) pay a premium franchise fee ranging from 1% to 5% of thelocation’s gross revenue.
Approximately 88% (88% - 2004) of the Fund’s royalties are derived from the combined fixedfee of $100 per agent per month, 1% variable fee and premium fees. The remaining royaltystream is generated from technology fees, 4.5% option and web services and other fees.Approximately 64% of the annual royalties are insulated from market fluctuations, as they arenot directly driven by transaction volumes. Management believes that the combination of aroyalty stream based on the number of agents in the network, increasing agent and brokerproductivity and an increasing supply of new housing inventory will provide the base for astrong, stable and growing cash flow.
Monthly DistributionsThe target annual cash distribution is $1.10 per unit. Public unitholder cash distributions aremade monthly. The quarterly target was met during the Quarter. To reduce unitholder risk, 25%of the Fund’s units, which are held by Centract, are subordinated in their rights to distributionsuntil public unitholders receive their target distribution of $0.0917 per unit per month. Thissubordination is in place until August 7, 2008.
OPERATIONS OVERVIEWThe key drivers of the Fund’s business and cash distributions to unitholders are:
1. The number of agents in the Fund;2. Transaction volumes;3. The stability of the Fund’s royalty stream; and4. The Fund’s growth opportunities.
A summary of our performance against these drivers is as follows:
Number of agents in the Fund
• The Fund Network grew by 295 agents or 2.9% during the Quarter, to 10,376 agents. Thisrepresents a growth of 1,021 agents or 10.9% since December 31, 2004. Of this growth,558 was generated through the acquisition of 38 franchise contracts on January 1, 2005,with estimated annual royalties of $1.2 million, and 463 or 4.9% through franchisee netrecruiting efforts.
4 TSX-RSF.un
Royal LePage Franchise Services Fund
TSX-RSF.un
RLP_Q2_Text05 8/10/05 3:19 PM Page 4

Transaction volumesThe performance of the Fund is dependent upon the receipt of royalty revenue, which, inturn, is partially dependent upon the level of residential resale real estate transactions. Theresidential real estate industry is affected by all of the factors affecting the economy ingeneral, including changes in interest rates, unemployment and inflation. During the Quarter,the Canadian Residential Resale Real Estate market (the “market”1 ) remained healthy andwas buoyed by strong consumer confidence and housing affordability. A summary of themarket and related activity for the Quarter is as follows:
• Canada’s housing starts, the market’s future inventory, were 237,200 for the 12 monthsended June 30, 2005, down slightly from the 239,300 recorded for the same period in 2004.The decrease from 2004 levels suggests that activity in the new housing market is slowingslightly from the 17-year high set in 2004.
• The Canadian market totaled $109.7 billion for the 12 months ended June 30, 2005, anincrease of 8.1% compared with the 12 months ended June 30, 2004.
• The year-over-year growth in the Canadian market for the 12 months ended June 30, 2005,was fuelled by an 8.3% increase in average selling price to $238,134 and a 0.2% decreasein residential unit sales to 460,537.
• The GTA market, from which the Fund earns its premium franchise fees, reached atransactional dollar volume of $27.4 billion for the 12 months ended June 30, 2005, a4.5% increase over the same period in 2004. This market activity was fuelled by a totalof 83,283 homes sold at an average selling price of $328,419, representing a 2.8%decrease in homes sold and a 7.5% increase in average price per home, over the sameperiod in 2004.
• The GTA market, for the month of June 2005 as compared to June 2004 was up 7.6% to$3.2 billion as the unit sales fell by 1.3% to 9,153 units, while selling price increased by9.0% to $345,065.
• Agent productivity for the 12 months ended December 31, 2004, was approximately $2.2 millionper agent in transactional dollar volume, which was 10% ahead of the 2003 level of $2.0 millionand 69% ahead of the rest of the Canadian agent productivity of $1.3 million per agent.
• Record low mortgage interest rates, strong consumer confidence, combined with overallhousing affordability continues to encourage first-time buyers to enter the market andexisting homeowners to trade up to larger, more expensive dwellings.
Toward the end of 2004, and during the first two quarters of 2005, there was a notedindustry-wide increase in the inventory of residential resale real estate properties listed forsale. We anticipate that this increase in listing inventory will add more balance to thedemand and supply for residential resale properties, resulting in a reduced pace of priceappreciation from the double digits seen in the early part of 2004 to single digit appreciationin the near-to mid-term.
5TSX-RSF.un
Interim Report to Unitholders
Q2 2005
1 The market is defined as the dollar value of units sold (“Transactional Dollar Volume”) over a twelve month period in a particular geographic area.
RLP_Q2_Text05 8/10/05 3:19 PM Page 5

Stability of the Fund’s royalty stream • The Fund’s royalties are derived primarily from a diverse national network of 264
independently owned and operated franchises, the majority of which operate with lessthan 100 agents.
• The geographic distribution of the Fund Network is similar to the distribution of the overallCanadian agent population.
• During the Quarter there were no contracts subject to renewal.
• The Fund has secured 10, 15 and 20-year agreements, while five-year contracts are theindustry norm.
• As at June 30, 2005, the Fund had $5.6 million in working capital and other reserves to meetfuture cash flow requirements. These reserves may be used to: fund future distributions inlight of the seasonality of the market; fund potential acquisitions; and cover the anticipatedreduction in the 1% variable franchise fee to year-end as a number of agents exceed therelated $1,300 per annum cap towards the end of the year.
Fund growth opportunitiesOur growth objective is to add 200 to 400 agents to the Fund Network annually, withapproximately one half of this growth from acquisitions and one half from internal growth.Growth through acquisition is achieved through Centract’s dedicated network developmentteam operating under the MSA.
Growth in overall royalties is achieved by: increasing the number of agents in the Fund;increasing the productivity of agents; expanding the range of products and services supportingthe franchisees and agents; increasing adoption of these products and services; and providingconcise programs to the Fund Network, supported by on-going training programs to franchiseesand agents that assist in leveraging the Fund’s competitive advantages to attract and retainpotential recruits. A summary of immediate growth opportunities and results to the date of thisreport is as follows:
• The internal growth for the Quarter was 295 agents. This coupled with the internal growth of 168 agents for the quarter ended March 31, 2005 and acquisition of 38 franchise contractsserviced by 558 agents mentioned earlier, added 1,021 paying agents to the Fund’s networksince December 31, 2004, which far exceeds our annual growth target of 200 to 400 agents.
• From November 1, 2004 to the date of this MD&A, franchises operating from 19 locationsserviced by 179 agents were added to the Royal LePage brand. Centract anticipatespresenting these franchise contracts to the Fund’s Trustees for purchase by the Fund onJanuary 1, 2006.
• Effective July 1, 2005, franchises will begin to pay the $100 per month fixed fee forsales representatives.This change impacts selling Realtors only, and typically excludesbroker-owners and managers. As a result, Management estimates that of the 842 salesrepresentatives as of June 30, 2005 approximately 400 to 600 will attract the new fee.
• Centract continues to develop, introduce and support new tools, services and programs,which assist franchisees in attracting and retaining agents, increasing agent productivityand driving down administration costs.
6 TSX-RSF.un
Royal LePage Franchise Services Fund
TSX-RSF.un
RLP_Q2_Text05 8/10/05 3:19 PM Page 6

OPERATING RESULTSThree Months Three Months Six Months Six Months
Ended Ended Ended EndedJune 30 June 30 June 30 June 30
($ 000's) 2005 2004 2005 2004
Royalties $ 7,138 $ 6,397 $ 12,734 $ 11,252 Less:
Administration expenses 145 93 268 179Interest expense 602 296 1,083 657Management fee 915 950 1,830 1,831
Earnings $ 5,476 $ 5,058 $ 9,553 $ 8,585 Amortization of
intangible assets 3,521 3,418 6,992 6,838 Non-controlling interest 519 427 694 471
Net earnings $ 1,436 $ 1,213 $ 1,867 $ 1,276 Basic and diluted earnings
per unit (9,983,000 units) $ 0.14 $ 0.13 $ 0.19 $ 0.13
Earnings of $5.5 million for the Quarter and $9.6 million for the six months ended June 30, 2005,exceeded management’s expectations due primarily to greater than anticipated agent growthand market activity.
Royalties in the Quarter of $7.1 million and for the six months ended June 30, 2005 of $12.7million, are 12% and 13% ahead, respectively, over the same periods in 2004. The growth inroyalties is explained in greater detail below.
Administration costs costs were in line with management’s expectations. Interest expensehas increased over the same period in 2004 as the Fund moved from a variable interest rateposition on its $30.6 million term loan to a $38 million private debt placement at aneffective fixed rate of 6.3%. Management fees have been calculated in line with the termsset out in the MSA, as 20% of royalties less administration expenses, interest expenses andworking capital and other reserves.
Net earnings for the Quarter of $1.4 million and $1.9 for the six months ended June 30, 2005,represent earnings less non-cash charges of $3.5 million for the Quarter and $7.0 million forthe six months ended June 30, 2005, of amortization related to intangible assets and $0.5million for the Quarter and $0.7 million for the six months ended June 30, 2005, related to thenon-controlling interest’s 25% share of the operating results.
The Fund Network as at June 30, 2005, was comprised of 10,376 agents and 842 salesrepresentatives, with 10,069 of the agents operating under the combined flat fee of $100 permonth and 1% of gross earnings option (the “$100/1% option”) and 307 agents operatingunder the 4.5% variable fee option (the “4.5% option”).
7TSX-RSF.un
Interim Report to Unitholders
Q2 2005
RLP_Q2_Text05 8/10/05 3:19 PM Page 7

RoyaltiesThree Months Three Months Six Months Six Months
Ended Ended Ended EndedJune 30 June 30 June 30 June 30
($ 000's) 2005 2004 2005 2004
Fixed franchise fees $ 2,999 $ 2,718 $ 5,944 $ 5,240 Variable franchise fees 2,231 2,008 3,566 3,187 Premium franchise fees 1,103 932 1,679 1,473 Other fees and services 805 739 1,545 1,352
$ 7,138 $ 6,397 $ 12,734 $ 11,252
The Fund generates royalties from both fixed and variable fee components as describedearlier in “Structure of the Fund”.
Total fixed franchise fees, variable franchise fees and premium franchise fees represented 89%and 88% of royalties for the Quarter and the same period in 2004, respectively.
Fixed franchise fees increased 10% and 13% for the Quarter and six months ended June 30,2005, respectively, over the same periods in 2004, in line with the increase in the underlyingnumber of agents.
Variable franchise fees increased 11% and 12% for the Quarter and six months ended June30, 2005, respectively, over the same periods in 2004 while the market activity increased14% and 11% for the Quarter and six months ended June 30, 2005, respectively, over thesame periods in 2004. The market activity for the Quarter outpaced the variable fees for thesame period in 2005 as these fees are paid to the Fund after the sales transaction closes.There is typically a 45 to 60 day delay between the house sale and closing. As such someof the market activity during the Quarter should materialize as variable fees in the quarterended September 30, 2005.
Premium franchise fees are a function of the mix of 22 franchise locations servicing theGTA market, which pay premium fees ranging from 1% to 5% of the location’s grossrevenue. The premium franchise fees increased by 18% and 14%, for the Quarter and forthe six months ended June 30, 2005, respectively, over the same period in 2004, while theGTA market activity for the same periods increased by 6% and 4%, respectively. Thisincrease in premium fees outpaced the overall GTA market due to the greater marketgrowth experienced in the individual market areas serviced by the premium fee payingfranchise locations.
Other fees and services represented 11% and 12% of Fund royalties for the Quarter andsix months ended June 30, 2005, and increased 9% and 14%, respectively, over the sameperiods in 2004. These fees, comprised of technology fees, 4.5% option fees, web serviceand other fees, increased over the same periods in 2004 due primarily to the greater thananticipated number of agents and an increase in the pricing of our new web services andtraining offerings.
Interest expenseInterest expense of $0.6 million for the Quarter and $1.1 million for the six months ended June30, 2005, is comprised of interest on the Fund’s $30.6 million term loan from January 1 to
8 TSX-RSF.un
Royal LePage Franchise Services Fund
TSX-RSF.un
RLP_Q2_Text05 8/10/05 3:19 PM Page 8

February 17, 2005, interest on the $38 million private debt placement from February 18 to June 30, 2005, amortization of the financing charges incurred to secure the $38 million privatedebt placement, and standby charges associated with the Fund’s $2 million operating line,which remained undrawn during the Quarter.
The fixed interest rate on the $38 million private debt placement is 5.882% with an effectiveinterest rate of 6.3% once the five year amortization of the $0.8 million in financing costsassociated with securing the private debt placement and $2 million operating line are takeninto account.
Amortization of intangible assetsIntangible assets relate to the values attributed to the franchise agreements andrelationships and trademarks acquired by the Fund since August 7, 2003. Trademarks arebeing amortized on a straight-line basis over the term of the agreement plus one renewalperiod, while franchise agreements are being amortized over the term of the agreements.Relationships represent the value attributed to franchise renewals and are being amortizedover the renewal period, at the commencement of such period. See 2005 Acquisitionsand Deposit on Acquisitions for further discussion regarding Intangible Assets arising on2005 acquisitions.
Management fee expenseManagement fees of $0.9 million for the Quarter and $1.8 million for the six months endedJune 30, 2005, are in line with Management’s expectations. Management services areprovided under the MSA by RIFML for a fee equal to 20% of cash otherwise available fordistribution, which is calculated as distributable cash after reasonable reserves for futureFund distributions and obligations. The Fund generated reserves of $1.8 million during theQuarter ($1.4 million – quarter ended June 30, 2004) and $2.2 million for the six monthsended June 30, 2005 ($1.3 million for six months ended June 30, 2005). In accordance withthe MSA these reserve amounts have been deducted from cash otherwise distributable inarriving at the Fund’s management fees.
DistributionsDistributions, as summarized in the following table, were in line with annualized targeteddistributions of $1.10 per unit. Management and the Board of Trustees will periodicallyreview the distribution target. Our distributions since inception are summarized in thefollowing chart.
9TSX-RSF.un
Interim Report to Unitholders
Q2 2005
Unitholder Distributions ($ per unit)
$0.20
$0.15
$0.10
$0.05
$0.30
$0.25
$0.00
2003 20052004
Q3* Q4 Q1 Q2 Q3 Q4 Q1 Q2
0.27
5
0.17
5
0.27
5
0.27
5
0.27
5
0.27
5
0.27
5
0.27
5
*Based on a 55 day period
RLP_Q2_Text05 8/10/05 3:19 PM Page 9

DISTRIBUTABLE CASHDistributions to unitholders are computed as net earnings, adjusted for the non-controllinginterest share of net earnings, amortization and other reasonable working capital and otherreserves as defined by the Fund’s Amended and Restated Declaration of Trust.
Distributable cash does not have a standardized meaning under Canadian generallyaccepted accounting principles (“GAAP”) and accordingly may not be comparable to similarmeasures used by other issuers. Management believes that distributable cash is a usefulsupplemental measure of performance as it provides investors with an indication of theamount of cash available for distribution to unitholders. Investors are cautioned, however,that distributable cash should not be construed as an alternative to using net earnings asa measure of profitability or the statement of cash flows. Distributable cash per unit hasbeen calculated on a basis with that prescribed by GAAP for calculating earnings per unitand is derived as follows:
Three Months Three Months Six Months Six MonthsEnded Ended Ended Ended
Distributable cash June 30 June 30 June 30 June 30($ 000's) 2005 2004 2005 2004
Royalties $ 7,138 $ 6,397 $ 12,734 $ 11,252 Less:
Administration expenses 145 93 268 179 Interest expense 602 296 1,083 657 Management fee 915 950 1,830 1,831
Distributable cash 5,476 5,058 9,553 8,585Less change in working
capital and other reserves (1,814) (1,394) (2,230) (1,261)Distributable cash
after reserves $ 3,662 $ 3,664 $ 7,323 $ 7,324
Distributable cash Three Months Three Months Six Months Six MonthsReconciled to the Ended Ended Ended EndedFinancial Statements June 30 June 30 June 30 June 30($ 000's) 2005 2004 2005 2004
Net earnings for the period $ 1,436 $ 1,213 $ 1,867 $ 1,276 Add:
Non-controlling interest shareof net earnings 519 427 694 471
Amortization of intangible assets 3,521 3,418 6,992 6,838 Distributable cash 5,476 5,058 9,553 8,585
Less change in working capital and other reserves (1,814) (1,394) (2,230) (1,261)
Distributable cash after reserves $ 3,662 $ 3,664 $ 7,323 $ 7,324
10 TSX-RSF.un
Royal LePage Franchise Services Fund
TSX-RSF.un
RLP_Q2_Text05 8/10/05 3:19 PM Page 10

Distributable cash before working capital and other reserves totaled $5.5 million for theQuarter and $9.6 million for six months ended June 30, 2005. This was ahead of management’sexpectations for reasons described earlier and since distributable cash before working capitaland other reserves was greater than the declared distributions for the year, working capital andother reserves of $1.4 million were built up during the Quarter and $1.8 million for six monthsended June 30, 2005, bringing total reserves, to $5.6 million (see Reserves).
RESERVESSince inception, the Fund has built up $5.6 million in reserves as summarized in the table below.These reserves have been reduced by $0.1 million and $0.4 million for cash used to acquirefranchise contracts on January 1, 2004 and January 1, 2005, respectively. At this time it ismanagement’s and the Board’s intention to retain the reserve within the Fund to meet seasonalfluctuations in the market, working capital requirements, and to fund growth initiatives.
ReservesTwelve months Six months
August 7, 2003 ended endedto December 31, December 31, June 30,
($ 000’s) 2003 2004 2005 Total
Royalties $ 8,802 $ 23,740 $ 12,734 $ 45,276Less:
Administration expenses 231 513 268 1,012Interest expense 620 1,327 1,083 3,030Management fee 1,550 3,660 1,830 7,040
Distributable cash 6,401 18,240 9,553 34,194Less change in:Distributions to
public unitholders 4,533 10,985 5,493 21,011Distributions to non-
controlling interest 1,511 3,662 1,830 7,003Funding of acquisitions - 120 414 534
$ 357 $ 3,473 $ 1,816 $ 5,646
Distributable cash Reconciled to the Financial Statements
Twelve months Six monthsAugust 7, 2003 ended ended
to December 31, December 31, June 30, ($ 000’s) 2003 2004 2005 Total
Net earnings for the period $ 1,947 $ 3,331 $ 1,867 $ 7,145Add:
Non-controlling interest share of net earnings 702 1,232 694 2,628
Amortization of intangible assets 3,752 13,677 6,992 24,421
Distributable cash $ 6,401 $ 18,240 $ 9,553 $ 34,194
11TSX-RSF.un
Interim Report to Unitholders
Q2 2005
RLP_Q2_Text05 8/10/05 3:19 PM Page 11

2005 ACQUISITIONS AND DEPOSIT ON ACQUISITIONSOn January 1, 2005, the Fund’s independent trustees approved the acquisition of 38 franchisecontracts by the Fund at an estimated purchase price of $9.3 million. These contracts generatean estimated annual royalty stream of $1.2 million and are represented by 47 locations servicedby 558 agents. In line with the terms of the MSA, the purchase price was funded with an initialpayment of $7 million and the balance is expected to be paid during the first quarter of 2006upon audit of the actual royalties generated under these contracts and the recalculation of theactual purchase price as detailed in the MSA.
As the actual purchase price for these contracts cannot be determined until the above conditionsare met, the initial $7 million dollar payment was recorded as Deposit on acquisitions. At eachquarter end during 2005 the purchase price obligation will be recalculated based on the actualroyalties generated from these contracts and the resultant amount will be relieved from theDeposit on acquisitions and reclassified to Intangible assets. The increase in intangible assetswill be amortized in accordance with the Fund’s intangible assets policy. Recalculated purchaseprice obligations in excess of the Deposit on acquisitions will be classified as purchase priceobligation and the corresponding amount transferred to Intangible assets and amortization, aspreviously described, will be recorded.
As at June 30, 2005, the royalties generated to date from these contracts have resulted in apurchase price obligation of $5.9 million. Accordingly, Deposit on acquisitions for the Quarterhas been reduced by $5.9 million, intangible assets increased by $5.9 million and $0.2 millionin related amortization recorded.
PRIVATE DEBT PLACEMENT AND $2 MILLION OPERATING LINEWith the low interest rate environment and the $7 million deposit on acquisitions describedearlier, the Fund sought to increase its debt and take advantage of the low interest rates bymoving from a floating interest rate position to a fixed interest rate position. Accordingly, onFebruary 18, 2005, the Fund completed a $38 million private debt placement with a numberof Canadian institutional investors for a five-year term with interest fixed at 5.882%, payablequarterly in arrears. The private debt placement proceeds, net of approximately $0.8 million inissue costs, were used to repay the Fund’s $30.6 million term loan. The remaining $6.6 millionin net proceeds along with $0.4 million drawn from cash reserves were utilized to meet theFund’s January 1, 2005 initial franchise contract purchase obligation of $7 million (see 2005Acquisitions and Deposit on Acquisitions).
On an annualized basis as compared to 12 months ended December 31, 2004, the privatedebt placement effectively increases the Fund’s interest costs by $1 million, from $1.3 millionin 2004 to $2.3 million, with 23% of the increase coming from the increase in debt from $30.6million to $38 million and the remainder from the increase in the effective interest cost from4.6% in 2004 to 6.3% under the private debt placement. In what management anticipates willbe a rising interest rate environment, the fixing of the interest rate on the Fund’s debt willadd stability and predictability over the next five years to this significant component in thedetermination of the Fund’s distributable cash.
On February 16, 2005, the Fund replaced its $2 million operating line with a $2 million operatingline from a single Canadian financial institution. As of the date of this MD&A these funds remainundrawn. The $0.8 million in issue costs associated with the $38 million private debt placementand the $2 million operating line will be amortized over the term of the private debt placement.
12 TSX-RSF.un
Royal LePage Franchise Services Fund
TSX-RSF.un
RLP_Q2_Text05 8/10/05 3:19 PM Page 12

During the Quarter and six months ended June 30, 2005, $41 thousand and $58 thousand,respectively, of these charges were amortized.
LIQUIDITYThe Fund utilized cash flow generated from operating activities for the Quarter of $5.5 million tomeet administration and distribution requirements, without drawing on our $2 million operating line.
Working CapitalAs at As at As at
June 30 March 31 December 31($ 000's) 2005 2005 2004
Current assetsCash and cash equivalents $ 5,430 $ 3,658 $ 4,444 Accounts receivable and other 3,134 2,960 2,272
$ 8,564 $ 6,618 $ 6,716
Current liabilitiesAccounts payable and
accrued liabilities $ 2,003 $ 1,858 $ 2,001 Distribution payable to unitholders 915 915 915
2,918 2,773 2,916
Net working capital $ 5,646 $ 3,845 $ 3,800
The Fund had a net positive working capital position of $5.6 million as at June 30, 2005 ascompared to $3.8 million as at March 31, 2005 and December 31, 2004, as summarized in thetable above.
Accounts receivable increased $0.2 million from March 31, 2005 and $0.9 million fromDecember 31, 2004, due primarily to the increase in revenue during the Quarter.
Accounts payable and accrued liabilities increased slightly from March 31, 2005 and remainedconsistent with December 31, 2004, and are comprised of a $0.9 million ($0.9 million – 2004)quarterly distribution payable to the non-controlling interest, $0.3 million ($0.3 million – 2004)in management fees payable to RIFML and $0.8 million ($0.8 million – 2004) in deferred servicerevenue and administration expense accruals.
CAPITAL RESOURCESExisting capital resources upon which the Fund can draw consists of a $2 million operatingline, which remains unutilized. Other resources include funds generated from operations inexcess of administration costs, debt servicing and distribution requirements, and $5.6 millionin working capital and other reserves generated since the inception of the Fund and held forfuture distributions in anticipation of the seasonality of the residential resale real estate marketand to finance the acquisition of franchises. Management will assess financing alternativessuch as the issuance of additional Fund units and additional debt when funding requirements,such as potential acquisition opportunities, present themselves.
With $5.6 million in cumulative reserves, an anticipated flow through of strong market unitsales, and the anticipated generation of further reserves through the seasonally stronger third
13TSX-RSF.un
Interim Report to Unitholders
Q2 2005
RLP_Q2_Text05 8/10/05 3:19 PM Page 13

quarter of the year we anticipate meeting our near term financing requirements. A summary ofthe seasonality of the market over the last three years is provided in the chart below.
OFF-BALANCE SHEET ARRANGEMENTSThe Fund has no off-balance sheet arrangements as at the date of this MD&A.
TRANSACTIONS WITH RELATED PARTIESRelated party transactions that the Fund entered into were transacted at contracted rates orat exchange amounts approximating fair market value. These transactions were entered intoin the ordinary course of business and were consistent with prior periods.
CRITICAL ACCOUNTING ESTIMATESSubstantially all of the Fund’s activities are based on cash transactions with revenue andexpenditures based on contracted terms. The only operating activities not based on contractualterms are the Fund’s administration costs and allocation of the intangible assets betweenfranchise agreements, relationships, trademarks and their related amortization period. TheFund’s administration costs of approximately $0.5 million per annum relate to the Fund’s publicreporting, regulatory and insurance costs.
The allocation of the Fund’s intangible assets between their various classifications is subjectto management estimates. The Fund’s intangible assets are continuously monitored to ensurethat there is no impairment in the carrying value of these assets. A change in the carrying valuewould affect the net earnings of the Fund but would have no direct cash flow implications.
ACCOUNTING POLICIESDeferred ChargesSince January 1, 2005 the Fund paid $0.8 million in issue costs associated with the $38 millionprivate debt placement and the $2 million operating line. These costs have been deferred andare being amortized on a straight-line basis over the five-year term of the private debt placement.During the Quarter $41 thousand of these charges were amortized. This amortization policy hasbeen adopted to match the period over which the Fund will benefit from the financing.
FINANCIAL INSTRUMENTSThe Fund’s financial instruments consist of cash and cash equivalents, accounts receivable,accounts payable and accrued liabilities, distributions payable to unitholders and a $38 million
14 TSX-RSF.un
Royal LePage Franchise Services Fund
TSX-RSF.un
Jan Feb Mar Apr May Jun Jul Aug Sep Oct
2003
Nov Dec
2002
2004
Canadian Residential Resale Real Estate Market (% Transactional Dollar Volume by Month)
Source: CREA
4%
6%
8%
10%
12%
RLP_Q2_Text05 8/10/05 3:19 PM Page 14

private debt placement. We estimate that the fair values of these financial instrumentsapproximate their carrying value.
The Fund is exposed to credit risk with respect to accounts receivable to the extent anyfranchisees are unable to pay their fees.
The Fund’s $38 million private debt is fixed at 5.882% for a five year term commencingFebruary 18, 2005 and as such is not subject to interest rate fluctuations.
OUTSTANDING UNITSThe Fund’s capital structure remains unchanged from our launch on August 7, 2003, with theFund authorized to issue an unlimited number of units of the same class with equal rights andprivileges. As at June 30, 2005, 9,983,000 units were issued and outstanding. In addition tothese units, the Fund has also issued 3,327,667 Special Fund Units, which entitles the holderto vote in all votes of Fund units as if they had converted their Subordinated LP Units into Fundunits. This structure remains unchanged from our launch on August 7, 2003.
TAXATION OF FUND DISTRIBUTIONSUnder the Fund’s Amended and Restated Declaration of Trust the maximum tax deductionsavailable to the Fund shall be claimed to the extent it brings its taxable income of the Trust tonil. The estimated deductions available to the Trust are comprised of the costs of the offeringand intangible assets. The deductions available to the unitholders for the year endedDecember 31, 2005 are estimated at $8.3 million, $7.6 million for tax balances available as atDecember 31, 2004, $ 0.1 million for tax deductions arising from the costs associated withthe $38 million private debt placement and $0.6 million for tax deductions arising from theacquisition of the 38 franchise contracts on January 1, 2005.
OUTLOOKWe expect continued strength in the Canadian residential real estate market in the mid-term dueto strong underlying market fundamentals supported by low interest rates, strong consumerconfidence, the relative affordability of residential real estate, a relatively strong economy and asteadily increasing inventory of residential resale homes. This strength will be mitigated somewhatwith rising interest rates and an increase in listing inventory levels. This rise in listing inventoryis expected to lessen the pace of price appreciation from double digits seen in the early partof 2004 to single digit for the near to mid-term, with the anticipated overall effect of a strongbut more balanced market.
The growth in transaction dollar volume of residential resale real estate represents anopportunity to generate greater distributable cash through increased franchise fees earnedfrom increased agent productivity as well as attracting franchisees and agents to our brands.To this end, we anticipate continuing to enhance our service and support offerings andimprove our efficiencies.
During 2004 we embarked on the largest technology revitalization in our history to improveour technology platform for web, Internet, Intranet and online services. The phased launch ofthese systems began in April 2005 and was completed at the beginning of August. Thisimproved technology platform will reinforce our leadership position in the years ahead. Thesetechnology enhancements and strong market fundamentals in combination with favourable
15TSX-RSF.un
Interim Report to Unitholders
Q2 2005
RLP_Q2_Text05 8/10/05 3:19 PM Page 15

debt refinancing and increased royalties from acquisitions, all set the stage for stable andsustainable unitholder distributions.
Effective July 1, 2005, franchises will begin to pay a fixed $100 per month fixed fee for salesrepresentatives. This change impacts selling Realtors only, and typically excludes broker-owners and managers. As a result, Management estimates that of the 842 sales representativesas of June 30, 2005 approximately 400 to 600 will attract the new fee.
FORWARD-LOOKING STATEMENTSCertain statements in Management’s Discussion and Analysis of Results and FinancialCondition may include statements that are “forward-looking statements”. These forward-lookingstatements may reflect the current internal projections, expectations or belief, future growth,performance and business prospects and opportunities of the Fund and are based on informationcurrently available to the Fund. Actual results and developments may differ materially fromresults and developments discussed in the forward-looking statements as they are subjectto a number of risks and uncertainties. Management cannot provide assurance that theactual results of developments will be realized or, even if substantially realized, that theywould have the expected consequences to, or effects on, the Fund. These forward-lookingstatements are made as of the date of this report and the Fund assumes no obligation toupdate or revise them.
16 TSX-RSF.un
Royal LePage Franchise Services Fund
TSX-RSF.un
RLP_Q2_Text05 8/10/05 3:19 PM Page 16

ROYAL LEPAGE FRANCHISE SERVICES FUND
INTERIM CONSOLIDATED BALANCE SHEETS(in thousands of dollars)
June 30, December 31,As at 2005 2004
Assets (Unaudited)Current assets
Cash and cash equivalents $ 5,430 $ 4,444 Accounts receivable 3,074 2,176Prepaid expenses 60 96
8,564 6,716
Deferred charges 743 –Deposit on acquisition (note 3) 1,118 –Intangible assets (note 3) 136,169 137,238
$ 146,594 $ 143,954
Liabilities and Unitholders’ Equity Current liabilities
Accounts payable and accrued liabilities $ 2,003 $ 2,001Distribution payable to unitholders 915 915
2,918 2,916
Long-term debt (note 5) 38,000 30,600Non-controlling interest 26,604 27,740
67,522 61,256
Unitholders’ equity 79,072 82,698
$ 146,594 $ 143,954
See accompanying notes to the interim consolidated financial statements
On behalf of the board
Simon Dean Lorraine Bell
Trustee Trustee
17TSX-RSF.un
Interim Report to Unitholders
Q2 2005
RLP_Q2_Text05 8/10/05 3:19 PM Page 17
ROYAL LEPAGE FRANCHISE SERVICES FUND
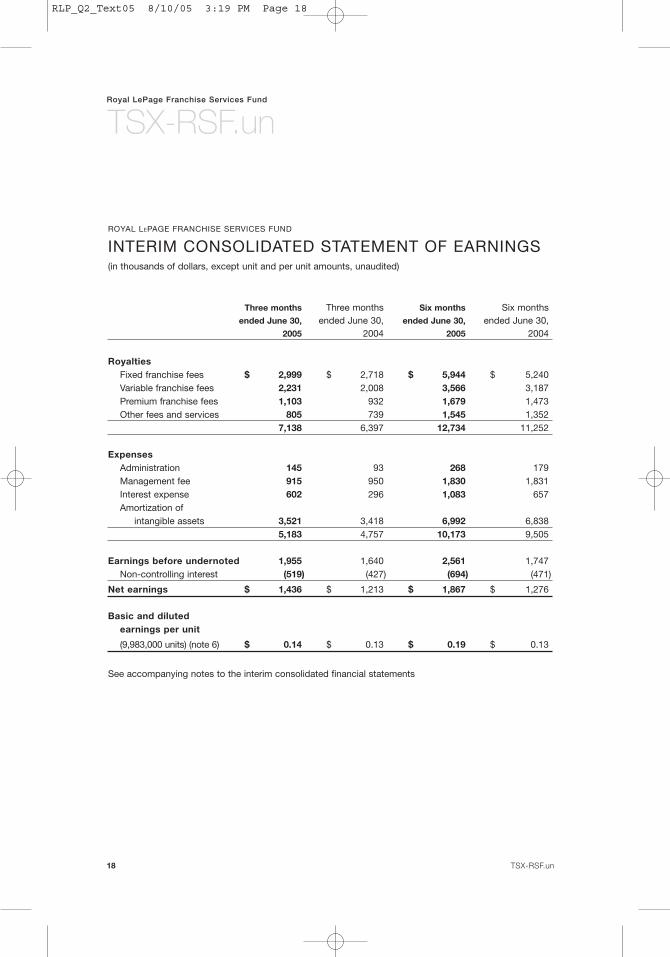
INTERIM CONSOLIDATED STATEMENT OF EARNINGS(in thousands of dollars, except unit and per unit amounts, unaudited)
Three months Three months Six months Six monthsended June 30, ended June 30, ended June 30, ended June 30,
2005 2004 2005 2004
RoyaltiesFixed franchise fees $ 2,999 $ 2,718 $ 5,944 $ 5,240Variable franchise fees 2,231 2,008 3,566 3,187Premium franchise fees 1,103 932 1,679 1,473Other fees and services 805 739 1,545 1,352
7,138 6,397 12,734 11,252
ExpensesAdministration 145 93 268 179Management fee 915 950 1,830 1,831Interest expense 602 296 1,083 657Amortization of
intangible assets 3,521 3,418 6,992 6,8385,183 4,757 10,173 9,505
Earnings before undernoted 1,955 1,640 2,561 1,747Non-controlling interest (519) (427) (694) (471)
Net earnings $ 1,436 $ 1,213 $ 1,867 $ 1,276
Basic and diluted earnings per unit
(9,983,000 units) (note 6) $ 0.14 $ 0.13 $ 0.19 $ 0.13
See accompanying notes to the interim consolidated financial statements
18 TSX-RSF.un
Royal LePage Franchise Services Fund
TSX-RSF.un
RLP_Q2_Text05 8/10/05 3:19 PM Page 18

ROYAL LEPAGE FRANCHISE SERVICES FUND
INTERIM CONSOLIDATED STATEMENTS OF UNITHOLDERS’ EQUITY(in thousands of dollars, unaudited)
Units Net Earnings Distributions Total
Balance, December 31, 2003 $ 92,938 $ 1,947 $ (4,533) $ 90,352Changes during the period:
Net earnings – 1,276 – 1,276Unit distributions – – (5,493) (5,493)
Balance,
June 30, 2004 $ 92,938 $ 3,223 $ (10,026) $ 86,135
Balance, December 31, 2004 $ 92,938 $ 5,278 $ (15,518) $ 82,698Changes during the period:
Net earnings – 1,867 – 1,867Unit distributions – – (5,493) (5,493)
Balance,
June 30, 2005 $ 92,938 $ 7,145 $ (21,011) $ 79,072
See accompanying notes to the interim consolidated financial statements
19TSX-RSF.un
Interim Report to Unitholders
Q2 2005
RLP_Q2_Text05 8/10/05 3:19 PM Page 19

ROYAL LEPAGE FRANCHISE SERVICES FUND
INTERIM CONSOLIDATED STATEMENTS OF CASH FLOWS (in thousands of dollars, unaudited)
Three months Three months Six months Six monthsended June 30, ended June 30, ended June 30, ended June 30,
2005 2004 2005 2004
Cash provided by (used for):Operating activitiesNet earnings for the period $ 1,436 $ 1,213 $ 1,867 $ 1,276Items not affecting cash
Non-controlling interest 519 427 694 471Amortization of deferred charges 41 – 58 –Amortization of intangible assets 3,521 3,418 6,992 6,838
5,517 5,058 9,611 8,585Changes in non-cash working capital (29) (540) (860) (525)
5,488 4,518 8,751 8,060
Investing activitiesDeposit on acquisition (note 3) – – (7,048) –Purchase of intangible assets (19) (4) 7 (120)
(19) (4) (7,041) (120)
Financing activitiesDistributions paid to unitholders (2,747) (2,748) (5,493) (5,493)Distributions paid to
non-controlling interest (915) (916) (1,830) (1,831)Proceeds from private
debt placement – – 38,000 –Repayment of term loan – – (30,600) –Deferred charges (35) – (801) –
(3,697) (3,664) (724) (7,324)
Increase in cash and cash equivalents during the period 1,772 850 986 616
Cash and cash equivalents, beginning of period 3,658 1,205 4,444 1,439
Cash and cash equivalents, end of period $ 5,430 $ 2,055 $ 5,430 $ 2,055
Supplementary Cash Flow InformationCash paid for interest $ 557 $ 286 $ 808 $ 512
See accompanying notes to the interim consolidated financial statements.
20 TSX-RSF.un
Royal LePage Franchise Services Fund
TSX-RSF.un
RLP_Q2_Text05 8/10/05 3:19 PM Page 20

ROYAL LEPAGE FRANCHISE SERVICES FUND
NOTES TO THE INTERIM CONSOLIDATED FINANCIAL STATEMENTSJune 30, 2005(in thousands of dollars, unaudited)
1. ORGANIZATIONRoyal LePage Franchise Services Fund (the “Fund”) is a limited purpose trust established under thelaws of the Province of Ontario and pursuant to an Amended and Restated Declaration of Trust. OnAugust 7, 2003, the Fund raised $99,830 (before issue costs) by issuing units on the Toronto StockExchange. These proceeds together with the proceeds of a term loan were utilized to acquire franchise agreements, relationships and trademark rights.
These consolidated financial statements include the accounts of Royal LePage Franchise ServicesFund, its wholly-owned subsidiary RL RES Holding Trust (“RLHT”), and its 75% owned subsidiaries,Residential Income Fund General Partner Limited (“RIFGP”) and Residential Income Fund L.P. (the“Partnership”). RIFGP is the managing general partner of the Partnership. Trilon Bancorp Inc. (the “non-controlling interest”) owns the remaining 25% interest in the Partnership (the “Subordinated LP Units”) andRIFGP. The Fund receives certain management, administrative and support services from ResidentialIncome Fund Manager Limited (“RIFML”), a party related to the non-controlling interest via common control.
SeasonalityThe Fund’s business follows a seasonal pattern, with revenue traditionally being lower in the first and fourth quarters. Due to this seasonality, the interim earnings statements are not necessarilyindicative of annual earnings.
2. SUMMARY OF ACCOUNTING POLICIESThe accompanying unaudited interim consolidated financial statements are prepared in accordancewith Canadian generally accepted accounting principles (“GAAP”). The accounting principles usedin these interim consolidated financial statements are consistent with those used in the annualconsolidated financial statements except as described below. They do not include all the infor-mation and disclosure required by GAAP for annual financial statements, and should be read inconjunction with the December 31, 2004 annual consolidated financial statements.
Deferred ChargesDeferred charges consist of financing costs which are amortized on a straight-line basis over theterm of the debt to which they relate.
3. INTANGIBLE ASSETSOn January 1, 2005, the Partnership acquired 38 franchise agreements from RIFML with an estimatedpurchase price of $9,256 calculated in accordance with the Management Services Agreement(“MSA”). On February 18, 2005, $7,048 was paid in cash on deposit against this purchase price obligation in accordance with the MSA. The final purchase price is based on the actual audited royalties derived from these franchises for the twelve month period ending October 31, 2005.Accordingly, the final purchase price is not determinable until that time.
Until the final purchase price is determined, each quarter the purchase price obligation is recalculatedbased on the actual royalties received. Correspondingly, the deposit on acquisition is reduced by the calculated amount and transferred to intangible assets. These assets are then amortized inaccordance with the Fund’s policy and calculated on a prospective basis.
21TSX-RSF.un
Interim Report to Unitholders
Q2 2005
RLP_Q2_Text05 8/10/05 3:19 PM Page 21

The recalculated purchase price obligation in excess of the deposit on acquisition will be recordedas a purchase obligation and the corresponding amount added to the intangible assets and amortized as described above.
During the three and six months ended June 30, 2005, $2,920 and $5,930, respectively, was trans-ferred from “deposit on acquisition” and recorded as “intangible assets”. A summary of intangibleassets is as follows:
June 30, 2005
Accumulated Net
Cost Amortization Book Value
Franchise agreements $ 120,338 $ 24,069 $ 96,269Relationships and trademarks 40,252 352 39,900
$ 160,590 $ 24,421 $ 136,169
December 31, 2004
Accumulated NetCost Amortization Book Value
Franchise agreements $ 115,492 $ 17,168 $ 98,324Relationships and trademarks 39,175 261 38,914
$ 154,667 $ 17,429 $ 137,238
4. OPERATING CREDIT FACILITYOn February 16, 2005, the Partnership obtained a credit facility (the “revolver”) of up to $2,000 froma Canadian financial institution. This revolver may be used to provide working capital to thePartnership from time to time. The revolver is subject to annual renewal with outstanding principalunder the revolver subject to interest at the lender’s prime rate plus 1% to 1.5% or the bankeracceptance rate plus 2% to 2.5%, based on the ratio of total debt to Adjusted EBITDA of thePartnership as defined in the credit agreement. The Fund’s $2,000 operating credit facility whichexisted prior to February 16, 2005, was terminated and replaced with the new revolver. As at June 30, 2005, the operating credit facility had not been drawn upon.
5. LONG-TERM DEBTOn February 18, 2005, the Partnership completed the issuance of a $38,000 private debt placement(the “private placement”) provided by Canadian institutional investors. The private placement is fora five-year term with interest fixed at 5.882% payable quarterly in arrears. The proceeds of the private placement, net of $801 in issue costs, were utilized by the Partnership to payout and retire its $30,600 term loan and to fund the Partnership’s January 1, 2005 franchise agreement acquisition obligations.
22 TSX-RSF.un
Royal LePage Franchise Services Fund
TSX-RSF.un
ROYAL LEPAGE FRANCHISE SERVICES FUND
NOTES TO THE INTERIM CONSOLIDATED FINANCIAL STATEMENTSJune 30, 2005(in thousands of dollars, unaudited)
3. INTANGIBLE ASSETS (cont’d)
RLP_Q2_Text05 8/10/05 3:19 PM Page 22
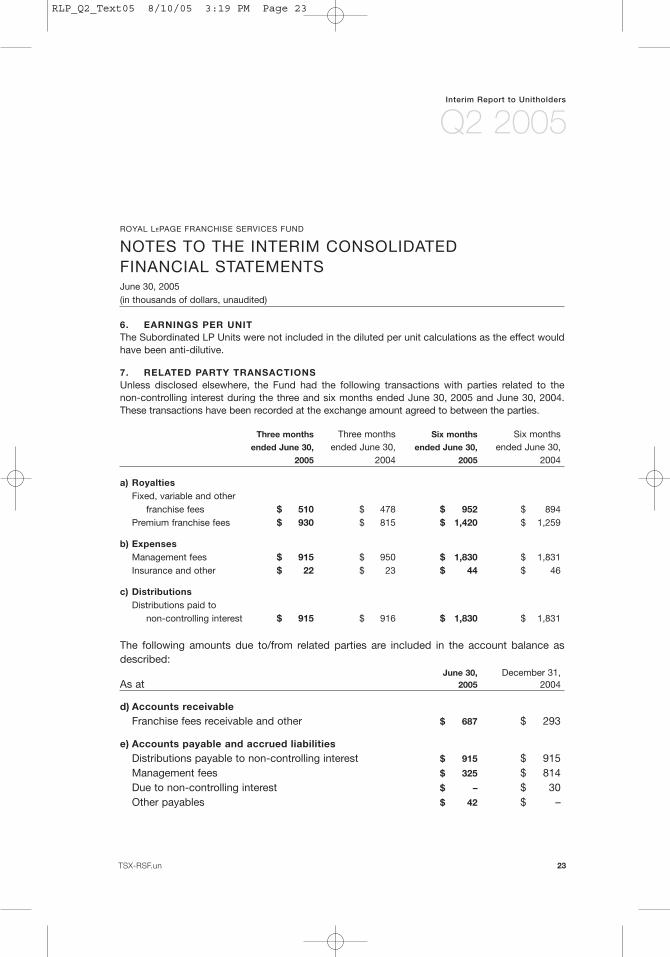
6. EARNINGS PER UNITThe Subordinated LP Units were not included in the diluted per unit calculations as the effect wouldhave been anti-dilutive.
7. RELATED PARTY TRANSACTIONS Unless disclosed elsewhere, the Fund had the following transactions with parties related to the non-controlling interest during the three and six months ended June 30, 2005 and June 30, 2004.These transactions have been recorded at the exchange amount agreed to between the parties.
Three months Three months Six months Six monthsended June 30, ended June 30, ended June 30, ended June 30,
2005 2004 2005 2004
a) RoyaltiesFixed, variable and other
franchise fees $ 510 $ 478 $ 952 $ 894Premium franchise fees $ 930 $ 815 $ 1,420 $ 1,259
b) ExpensesManagement fees $ 915 $ 950 $ 1,830 $ 1,831Insurance and other $ 22 $ 23 $ 44 $ 46
c) DistributionsDistributions paid to
non-controlling interest $ 915 $ 916 $ 1,830 $ 1,831
The following amounts due to/from related parties are included in the account balance asdescribed:
June 30, December 31,As at 2005 2004
d) Accounts receivableFranchise fees receivable and other $ 687 $ 293
e) Accounts payable and accrued liabilitiesDistributions payable to non-controlling interest $ 915 $ 915Management fees $ 325 $ 814Due to non-controlling interest $ – $ 30Other payables $ 42 $ –
23TSX-RSF.un
Interim Report to Unitholders
Q2 2005
ROYAL LEPAGE FRANCHISE SERVICES FUND
NOTES TO THE INTERIM CONSOLIDATED FINANCIAL STATEMENTSJune 30, 2005(in thousands of dollars, unaudited)
RLP_Q2_Text05 8/10/05 3:19 PM Page 23

SUPPLEMENTAL INFORMATIONNET EARNINGS AND DISTRIBUTABLE CASH BY PERIOD
55 Three Three Three Three Three Three Threedays months months months months months months months
ended ended ended ended ended ended ended endedSept. 30 Dec. 31 March 31 June 30 Sept 30 Dec. 31 March 31 June 30
($ 000’s unaudited) 2003 2003 2004 2004 2004 2004 2005 2005
Royalties $ 3,600 $ 5,202 $ 4,855 $ 6,397 $ 6,952 $ 5,536 $ 5,596 $ 7,138Less:
Administration expenses 70 161 86 93 119 215 123 145Management fees 595 955 881 950 911 918 915 915Interest expense 244 376 361 296 293 377 481 602Amortization of intangible assets 1,402 2,350 3,420 3,418 3,419 3,420 3,471 3,521
Earnings before undernoted 1,289 1,360 107 1,640 2,210 606 606 1,955Non-controlling interest (322) (380) (44) (427) (572) (189) (175) (519)
Net earnings for the period 967 980 63 1,213 1,638 417 431 1,436Add:
Amortization of intangible assets 1,402 2,350 3,420 3,418 3,419 3,420 3,471 3,521 Non-controlling interest 322 380 44 427 572 189 175 519
Distributable cash 2,691 3,710 3,527 5,058 5,629 4,026 4,077 5,476Add (less) change in:
Working capital and other reserves (309) 108 260 (1,398) (1,964) (364) (416) (1,814)Reserves for acquisition – (156) (127) – – – – –
Distributable cash after reserves $ 2,382 $ 3,662 $ 3,660 $ 3,660 $ 3,665 $ 3,662 $ 3,661 $ 3,662
Distributable cash available to:Public unit holders $ 1,786 $ 2,747 $ 2,745 $ 2,748 $ 2,746 $ 2,746 $ 2,746 $ 2,747Non-controlling interest 596 915 915 916 915 916 915 915
$ 2,382 $ 3,662 $ 3,660 $ 3,664 $ 3,661 $ 3,662 $ 3,661 $ 3,662
Distributions to public unitholders $ 1,786 $ 2,747 $ 2,745 $ 2,748 $ 2,746 $ 2,746 $ 2,746 $ 2,747
Per unit (9,983,000 units):Basic and diluted earnings $ 0.10 $ 0.10 $ 0.00 $ 0.13 $ 0.16 $ 0.04 $ 0.04 $ 0.14Basic and diluted
distributable cash $ 0.18 $ 0.28 $ 0.26 $ 0.38 $ 0.42 $ 0.30 $ 0.31 $ 0.41Basic and diluted distributions $ 0.18 $ 0.28 $ 0.28 $ 0.28 $ 0.28 $ 0.28 $ 0.28 $ 0.28
24 TSX-RSF.un
Royal LePage Franchise Services Fund
TSX-RSF.un
RLP_Q2_Text05 8/10/05 3:19 PM Page 24

SUPPLEMENTAL INFORMATIONSELECTED FINANCIAL AND OPERATING INFORMATION2
Three Three Three Three Three Three Three Threemonths months months months months months months monthsended ended ended ended ended ended ended ended
Sept. 30 Dec. 31 March 31 June 30 Sept 30 Dec. 31 March 31 June 302003 2003 2004 2004 2004 2004 2005 2005
(pro forma) (reported) (reported) (reported) (reported) (reported) (reported) (reported)
Revenue ($ thousands, unaudited)
Fixed franchise fees $ 2,479 $ 2,465 $ 2,522 $ 2,718 $ 2,691 $ 2,718 $ 2,945 2,999Variable franchise fees 1,901 1,169 1,179 2,008 2,041 1,149 1,335 2,231Premium franchise fees 1,287 930 541 932 1,489 1,009 576 1,103Other fees and services 588 638 613 739 731 660 740 805
$ 6,255 $ 5,202 $ 4,855 $ 6,397 $ 6,952 $ 5,536 $ 5,596 $ 7,138
% Revenue by regionBritish Columbia 12 13 15 14 12 13 15 15Prairies 11 11 12 11 11 11 11 11Ontario 63 62 58 60 64 62 57 57Quebec 9 9 11 11 9 9 13 13Maritimes 5 5 4 4 4 5 4 4
100 100 100 100 100 100 100 100
Three Three Three Three Three Three Three Threemonths months months months months months months monthsended ended ended ended ended ended ended ended
Sept. 30 Dec. 31 March 31 June 30 Sept 30 Dec. 31 March 31 June 30Additions for the period: 2003 2003 2004 2004 2004 2004 2005 2005
Number of agents & sales representatives 142 108 279 189 210 13 750 323
Number of agents 142 101 225 163 175 38 726 295Number of locations (1) (12) 6 9 – (6) 48 (1)Number of franchisees – (1) 4 (2) – (1) 38 (1)
At end of period
Number of agents & sales representatives 9,346 9,454 9,733 9,922 10,132 10,145 10,895 11,218
Number of agents 8,653 8,754 8,979 9,142 9,317 9,355 10,081 10,376Number of locations 521 509 515 524 524 518 566 565Number of franchisees 227 226 230 228 228 227 265 264
2 The pro forma information sets forth unaudited information and has been prepared on a quarterly basis as if the Fund wasin operation since January 1, 2003. The pro forma results have been adjusted to the number of agents, sales representa-tives, locations and fees that would have been recognized had the corporately-owned locations of Royal LePage ResidentialBrokerage Services been franchised on January 1, 2003.
25TSX-RSF.un
Interim Report to Unitholders
Q2 2005
RLP_Q2_Text05 8/10/05 3:19 PM Page 25

SUPPLEMENTAL INFORMATIONFUND UNIT PERFORMANCE
55 Three Three Three Three Three Three Threedays months months months months months months months
ended ended ended ended ended ended ended endedSept. 30 Dec. 31 March 31 June 30 Sept 30 Dec. 31 March 31 June 30
2003 2003 2004 2004 2004 2004 2005 2005
Trading price range of units (TSX: “RSF.UN”)High $ 10.64 $ 10.92 $ 12.10 $ 11.90 $ 12.25 $ 12.15 $ 14.90 $ 14.30Low $ 9.90 $ 10.03 $ 10.80 $ 9.85 $ 10.60 $ 11.40 $ 11.50 $ 12.60Close $ 10.26 $ 10.85 $ 11.70 $ 11.00 $ 11.95 $ 11.55 $ 13.40 $ 13.29
Average daily volume 105,176 18,112 28,016 10,905 5,369 22,531 25,689 5,646
Number of units outstanding at period end 9,983,000 9,983,000 9,983,000 9,983,000 9,983,000 9,983,000 9,983,000 9,983,000
Net enterprise value at period end (thousands)Market capitalization3 $ 136,567 $ 144,421 $ 155,735 $ 146,417 $ 159,062 $ 153,738 $ 178,363 $ 176,899Debt 30,600 30,600 30,600 30,600 30,600 30,600 38,000 38,000
Less:Cash on hand 1,895 1,439 1,205 2,055 3,647 4,444 3,658 5,430
$ 165,272 $ 173,582 $ 185,130 $ 174,962 $ 186,015 $ 179,894 $ 212,705 $ 209,469
3 Comprised of the number of units outstanding at period end and 3,327,667 subordinated units, multiplied by the closing unit price.
CONDENSED BALANCE SHEET
As at As at As at As at As at As at As at As atSept. 30 Dec. 31 March 31 June 30 Sept 30 Dec. 31 March 31 June 30
($ 000’s unaudited) 2003 2003 2004 2004 2004 2004 2005 2005
Cash and cash equivalents $ 1,895 $ 1,439 $ 1,205 $ 2,055 $ 3,647 $ 4,444 $ 3,658 $ 5,430Accounts receivable 2,063 1,970 2,214 2,899 2,382 2,176 2,874 3,074Prepaid expenses 179 241 104 66 41 96 86 60Deferred charges – – – – – – 749 743Deposit on acquisition – – – – – – 4,038 1,118Intangible assets 153,015 150,765 147,491 144,077 140,658 137,238 136,751 136,169
$ 157,152 $ 154,415 $ 151,014 $ 149,097 $ 146,728 $ 143,954 $ 148,156 $ 146,594
Accounts payable and accrued liabilities $ 1,078 $ 2,378 $ 2,530 $ 2,637 $ 1,719 $ 2,001 $ 1,858 $ 2,003
Offering costs 964 – – – – – – –Distributions payable to unitholders 1,786 915 915 915 915 915 915 915Long-term debt 30,600 30,600 30,600 30,600 30,600 30,600 38,000 38,000Non-controlling interest 30,680 30,170 29,299 28,810 28,467 27,740 27,000 26,604Unitholders’ equity 92,044 90,352 87,670 86,135 85,027 82,698 80,383 79,072
$ 157,152 $ 154,415 $ 151,014 $ 149,097 $ 146,728 $ 143,954 $ 148,156 $ 146,594
26 TSX-RSF.un
Royal LePage Franchise Services Fund
TSX-RSF.un
RLP_Q2_Text05 8/10/05 3:19 PM Page 26

SUPPLEMENTAL INFORMATIONCONDENSED CASHFLOW BY PERIOD
55 Three Three Three Three Three Three Threedays months months months months months months months
ended ended ended ended ended ended ended endedSept. 30 Dec. 31 March 31 June 30 Sept 30 Dec. 31 March 31 June 30
($ 000’s unaudited) 2003 2003 2004 2004 2004 2004 2005 2005
Cash provided by (used for):
Operating activitiesNet earnings for the period $ 967 $ 980 $ 63 $ 1,213 $ 1,638 $ 417 $ 431 $ 1,436Add (Deduct)
Non-controlling interest 322 380 44 427 572 189 175 519Amortization of deferred charges – – – – – – 17 41Amortization of intangible assets 1,402 2,350 3,420 3,418 3,419 3,420 3,471 3,521Changes in non-cash working capital (1,760) 815 15 (540) (376) 433 (831) (29)
931 4,525 3,542 4,518 5,253 4,459 3,263 5,488
Investing activitiesDeposit on acquisition – – – – – – (7,048) –Purchase of intangible assets (121,140) (100) (116) (4) – – 26 (19)
(121,140) (100) (116) (4) – – (7,022) (19)
Financing activitiesInitial public offering of units 99,830 – – – – – – –Issue costs paid (8,326) (667) – – – – – –Proceeds from long term debt 30,600 – – – – – 38,000 (2,747)Distributions paid to unitholders – (3,618) (2,745) (2,748) (2,746) (2,746) (2,746) (915)Distributions paid to non-
controlling interest – (596) (915) (916) (915) (916) (915) –Repayment of long term debt – – – – – – (30,600) –Deferred charges – – – – – – (766) (35)
122,104 (4,881) (3,660) (3,664) (3,661) (3,662) 2,973 (3,697)
Increase (decrease) in cash and cash equivalents during the period 1,895 (456) (234) 850 1,592 797 (786) 1,772
Cash and cash equivalents, beginning of period – 1,895 1,439 1,205 2,055 3,647 4,444 3,658
Cash and cash equivalents, end of period $ 1,895 $ 1,439 $ 1,205 $ 2,055 $ 3,647 $ 4,444 $ 3,658 $ 5,430
27TSX-RSF.un
Interim Report to Unitholders
Q2 2005
RLP_Q2_Text05 8/10/05 3:19 PM Page 27

SUPPLEMENTAL INFORMATIONCANADIAN RESIDENTIAL REAL ESTATE MARKET
Three Three Three Three Three Three Three Threemonths months months months months months months monthsended ended ended ended ended ended ended ended
Sept. 30 Dec. 31 March 31 June 30 Sept 30 Dec. 31 March 31 June 302003 2003 2004 2004 2004 2004 2005 2005
CanadaTransaction dollar
volume ($ millions) $ 24,677 $ 20,209 $ 23,558 $ 33,051 $ 25,711 $ 21,335 $ 24,814 $ 37,809Average selling price 209,535 $ 215,967 $ 221,202 $ 230,253 $ 224,550 $ 233,007 $ 238,834 $ 251,101Number of units sold 117,772 93,573 106,500 143,542 114,500 91,566 103,898 150,573Number of agents at
period end 70,098 71,267 72,887 74,430 75,611 76,752 78,816 NAHousing starts 62,771 58,235 39,382 67,378 65,754 60,917 37,084 67,183
Greater Toronto AreaTransaction dollar
volume ($ millions) $ 6,220 $ 5,162 $ 5,927 $ 8,872 $ 6,457 $ 5,507 $ 6,017 $ 9,371Average selling price $ 290,871 $ 298,919 $ 305,653 $ 321,034 $ 312,545 $ 320,165 $ 330,120 $ 344,557Number of units sold 21,384 17,268 19,392 27,636 20,660 17,199 18,228 27,196Housing starts 12,323 12,109 6,831 12,651 12,380 10,253 6,918 13,050
NA: Not available at date of MD&A.
Twelve Twelve Twelve Twelve Twelve Twelve Twelve Twelvemonths months months months months months months monthsended ended ended ended ended ended ended ended
Sept. 30 Dec. 31 March 31 June 30 Sept 30 Dec. 31 March 31 June 302003 2003 2004 2004 2004 2004 2005 2005
CanadaTransaction dollar
volume ($ millions) $ 86,424 $ 90,007 $ 94,457 $ 101,495 $ 102,529 $ 103,666 $ 104,912 $ 109,670Average selling price $ 202,819 $ 207,347 $ 212,432 $ 219,979 $ 223,806 $ 227,261 $ 231,335 $ 238,134Number of units sold 426,113 434,088 444,643 461,387 458,115 456,108 453,506 460,537Housing starts 214,195 218,426 219,538 227,766 230,749 233,431 231,133 230,938Seasonally adjusted
housing starts 234,600 217,600 216,200 239,300 231,000 234,400 218,500 237,200
Greater Toronto AreaTransaction dollar
volume ($ millions) $ 22,493 $ 23,282 $ 24,214 $ 26,181 $ 26,418 $ 26,763 $ 26,851 $ 27,352Average selling price $ 289,540 $ 293,327 $ 297,431 $ 305,568 $ 310,964 $ 315,278 $ 320,712 $ 328,419Number of units sold 77,684 79,371 81,409 85,680 84,956 84,887 83,723 83,283Housing starts 44,578 45,475 42,563 43,914 43,971 42,115 42,202 42,601
28 TSX-RSF.un
Royal LePage Franchise Services Fund
TSX-RSF.un
RLP_Q2_Text05 8/10/05 3:19 PM Page 28