
ROYAL BANKOFCANADA THIRD QUARTER 2015 – REPORT · PDF fileROYAL BANKOFCANADA THIRD...
92
ROYAL BANK OF CANADA THIRD QUARTER 2015 – REPORT TO SHAREHOLDERS Royal Bank of Canada third quarter 2015 results All amounts are in Canadian dollars and are based on financial statements prepared in compliance with International Accounting Standard 34 Interim Financial Reporting, unless otherwise noted. TORONTO, August 26, 2015 – Royal Bank of Canada (RY on TSX and NYSE) today reported net income of $2,475 million for the third quarter ended July 31, 2015, up $97 million or 4% from the prior year. Excluding a specified item in the prior year, net income was up $57 million or 2%. (1) Our results reflect record earnings in Personal & Commercial Banking, strong growth in Investor & Treasury Services, and stable earnings in Wealth Management. These factors were partially offset by lower earnings in Capital Markets compared to record results last year, and lower earnings in Insurance which included the impact of a change in Canadian tax legislation. Results also reflect the positive impact of foreign exchange translation. Compared to the prior quarter, net income decreased $27 million. Excluding a specified item in the prior quarter, net income was up $81 million or 3% (1) , mainly reflecting record earnings in Personal & Commercial Banking and higher earnings in Insurance, partially offset by lower earnings in Capital Markets reflecting less favourable market conditions. Credit quality remained strong with a provision for credit loss (PCL) ratio of 0.23%. As of July 31, 2015, our Basel III Common Equity Tier 1 (CET1) ratio was 10.1% as we continued to strengthen our capital position in advance of closing the announced acquisition of City National, which is expected in the fourth calendar quarter of 2015. Today we announced an increase to our quarterly dividend of $0.02 or 3%, to $0.79 per share. “We delivered a solid quarter, with earnings of over $2.4 billion, reflecting underlying strength across our businesses and strong execution in a challenging environment. I’m pleased to announce today a 3% increase to our quarterly dividend,” said Dave McKay, RBC President and CEO. “RBC achieved strong results for the first nine months of the year and we believe our diversified business model, by segment and geography, along with our differentiated client-focused strategy, positions us to continue adapting to the changing market and to economic headwinds.” Q3 2015 compared to Q3 2014 • Net income of $2,475 million (up 4% from $2,378 million) • Diluted earnings per share (EPS) of $1.66 (up $0.07 from $1.59) • Return on common equity (ROE) of 18.1% (down from 19.6%) • Basel III CET1 ratio of 10.1% (up from 9.5%) Excluding specified item (1) : Q3 2015 compared to Q3 2014 • Net income of $2,475 million (up 2% from $2,418 million) • Diluted EPS of $1.66 (up $0.04 from $1.62) • ROE of 18.1% (down from 20.0%) Q3 2015 compared to Q2 2015 • Net income of $2,475 million (down 1% from $2,502 million) • Diluted EPS of $1.66 (down $0.02 from $1.68) • ROE of 18.1% (down from 19.3%) • Basel III CET1 ratio of 10.1% (up from 10.0%) Excluding specified item (1) : Q3 2015 compared to Q2 2015 • Net income of $2,475 million (up 3% from $2,394 million) • Diluted EPS of $1.66 (up $0.05 from $1.61) • ROE of 18.1% (down from 18.5%) YTD 2015 compared to YTD 2014 • Net income of $7,433 million (up 11% from $6,671 million) • Diluted EPS of $4.99 (up $0.56 from $4.43) • ROE of 18.9% (down from 19.0%) Excluding specified items (1) : YTD 2015 compared to YTD 2014 • Net income of $7,325 million (up 8% from $6,803 million) • Diluted EPS of $4.92 (up $0.40 from $4.52) • ROE of 18.6% (down from 19.4%) (1) Specified items comprise: In Q2 2015, a gain of $108 million (before- and after-tax) from the wind-up of a U.S.-based funding subsidiary that resulted in the release of foreign currency translation adjustment (CTA) that was previously booked in other components of equity (OCE); in Q3 2014, a loss of $40 million (before- and after-tax), related to the closing of the sale on June 27, 2014 of RBC Jamaica; and in Q1 2014, a loss of $60 million (before- and after-tax) also related to the sale of RBC Jamaica, and a provision related to post-employment benefits and restructuring charges in the Caribbean of $40 million ($32 million after-tax). Table of contents 1 Third quarter highlights 2 Management’s Discussion and Analysis 2 Caution regarding forward-looking statements 2 Overview and outlook 2 About Royal Bank of Canada 3 Selected financial and other highlights 4 Economic, market and regulatory review and outlook 5 Key corporate events of 2015 6 Financial performance 6 Overview 10 Business segment results 10 How we measure and report our business segments 10 Key performance and non-GAAP measures 14 Personal & Commercial Banking 16 Wealth Management 17 Insurance 18 Investor & Treasury Services 19 Capital Markets 20 Corporate Support 21 Results by geographic segment 22 Quarterly results and trend analysis 23 Financial condition 23 Condensed balance sheets 24 Off-balance sheet arrangements 26 Risk management 26 Credit risk 33 Market risk 38 Liquidity and funding risk 48 Capital management 53 Additional financial information 53 Exposures to selected financial instruments 54 Accounting and control matters 54 Summary accounting policies and estimates 54 Changes in accounting policies and disclosure 54 Future changes in regulatory disclosure 54 Controls and procedures 54 Related party transactions 55 Enhanced Disclosure Task Force recommendations index 56 Interim Condensed Financial Statements (unaudited) 62 Notes to the Interim Condensed Financial Statements (unaudited) 92 Shareholder information
Transcript of ROYAL BANKOFCANADA THIRD QUARTER 2015 – REPORT · PDF fileROYAL BANKOFCANADA THIRD...

ROYAL BANK OF CANADATHIRD QUARTER 2015 – REPORT TO SHAREHOLDERS
Royal Bank of Canada third quarter 2015 results
All amounts are in Canadian dollars and are based on financial statements prepared in compliance with International Accounting Standard 34 InterimFinancial Reporting, unless otherwise noted.
TORONTO, August 26, 2015 – Royal Bank of Canada (RY on TSX and NYSE) today reported net income of $2,475 million for the third quarter ended July 31,2015, up $97 million or 4% from the prior year. Excluding a specified item in the prior year, net income was up $57 million or 2%.(1) Our results reflect recordearnings in Personal & Commercial Banking, strong growth in Investor & Treasury Services, and stable earnings in Wealth Management. These factors werepartially offset by lower earnings in Capital Markets compared to record results last year, and lower earnings in Insurance which included the impact of achange in Canadian tax legislation. Results also reflect the positive impact of foreign exchange translation.
Compared to the prior quarter, net income decreased $27 million. Excluding a specified item in the prior quarter, net income was up $81 million or 3%(1),mainly reflecting record earnings in Personal & Commercial Banking and higher earnings in Insurance, partially offset by lower earnings in Capital Marketsreflecting less favourable market conditions.
Credit quality remained strong with a provision for credit loss (PCL) ratio of 0.23%. As of July 31, 2015, our Basel III Common Equity Tier 1 (CET1) ratio was10.1% as we continued to strengthen our capital position in advance of closing the announced acquisition of City National, which is expected in the fourthcalendar quarter of 2015. Today we announced an increase to our quarterly dividend of $0.02 or 3%, to $0.79 per share.
“We delivered a solid quarter, with earnings of over $2.4 billion, reflecting underlying strength across our businesses and strong execution in a challengingenvironment. I’m pleased to announce today a 3% increase to our quarterly dividend,” said Dave McKay, RBC President and CEO. “RBC achieved strong resultsfor the first nine months of the year and we believe our diversified business model, by segment and geography, along with our differentiated client-focusedstrategy, positions us to continue adapting to the changing market and to economic headwinds.”
Q3 2015 compared to Q3 2014
• Net income of $2,475 million (up 4% from $2,378 million)• Diluted earnings per share (EPS) of $1.66 (up $0.07 from $1.59)• Return on common equity (ROE) of 18.1% (down from 19.6%)• Basel III CET1 ratio of 10.1% (up from 9.5%)
Excluding specified item(1): Q3 2015 compared to Q3 2014
• Net income of $2,475 million (up 2% from $2,418 million)• Diluted EPS of $1.66 (up $0.04 from $1.62)• ROE of 18.1% (down from 20.0%)
Q3 2015 compared to Q2 2015
• Net income of $2,475 million (down 1% from $2,502 million)• Diluted EPS of $1.66 (down $0.02 from $1.68)• ROE of 18.1% (down from 19.3%)• Basel III CET1 ratio of 10.1% (up from 10.0%)
Excluding specified item(1): Q3 2015 compared to Q2 2015
• Net income of $2,475 million (up 3% from $2,394 million)• Diluted EPS of $1.66 (up $0.05 from $1.61)• ROE of 18.1% (down from 18.5%)
YTD 2015 compared to YTD 2014
• Net income of $7,433 million (up 11% from $6,671 million)• Diluted EPS of $4.99 (up $0.56 from $4.43)• ROE of 18.9% (down from 19.0%)
Excluding specified items(1): YTD 2015 compared to YTD 2014
• Net income of $7,325 million (up 8% from $6,803 million)• Diluted EPS of $4.92 (up $0.40 from $4.52)• ROE of 18.6% (down from 19.4%)
(1) Specified items comprise: In Q2 2015, a gain of $108 million (before- and after-tax) from the wind-up of a U.S.-based funding subsidiary that resulted inthe release of foreign currency translation adjustment (CTA) that was previously booked in other components of equity (OCE); in Q3 2014, a loss of$40 million (before- and after-tax), related to the closing of the sale on June 27, 2014 of RBC Jamaica; and in Q1 2014, a loss of $60 million (before- andafter-tax) also related to the sale of RBC Jamaica, and a provision related to post-employment benefits and restructuring charges in the Caribbean of$40 million ($32 million after-tax).
Table of contents
1 Third quarter highlights2 Management’s Discussion and Analysis2 Caution regarding forward-looking
statements2 Overview and outlook
2 About Royal Bank of Canada3 Selected financial and other highlights4 Economic, market and regulatory review
and outlook5 Key corporate events of 20156 Financial performance
6 Overview10 Business segment results
10 How we measure and report our businesssegments
10 Key performance and non-GAAP measures14 Personal & Commercial Banking16 Wealth Management
17 Insurance18 Investor & Treasury Services19 Capital Markets20 Corporate Support
21 Results by geographic segment22 Quarterly results and trend analysis23 Financial condition
23 Condensed balance sheets24 Off-balance sheet arrangements
26 Risk management26 Credit risk33 Market risk38 Liquidity and funding risk
48 Capital management53 Additional financial information
53 Exposures to selected financialinstruments
54 Accounting and control matters54 Summary accounting policies and
estimates54 Changes in accounting policies and
disclosure54 Future changes in regulatory disclosure54 Controls and procedures
54 Related party transactions55 Enhanced Disclosure Task Force
recommendations index56 Interim Condensed Financial Statements
(unaudited)62 Notes to the Interim Condensed Financial
Statements (unaudited)92 Shareholder information

2 Royal Bank of Canada Third Quarter 2015
Management’s Discussion and Analysis
Management’s Discussion and Analysis (MD&A) is provided to enable a reader to assess our results of operations and financialcondition for the three and nine month periods ended or as at July 31, 2015, compared to the corresponding periods in the prior fiscalyear and the three month period ended April 30, 2015. This MD&A should be read in conjunction with our unaudited InterimCondensed Consolidated Financial Statements for the quarter ended July 31, 2015 (Condensed Financial Statements) and relatednotes and our 2014 Annual Report. This MD&A is dated August 25, 2015. All amounts are in Canadian dollars, unless otherwisespecified, and are based on financial statements prepared in accordance with International Accounting Standard (IAS) 34, InterimFinancial Reporting, as issued by the International Accounting Standards Board (IASB), unless otherwise noted.
Additional information about us, including our 2014 Annual Information Form, is available free of charge on our website at rbc.com/investorrelations, on the Canadian Securities Administrators’ website at sedar.com and on the EDGAR section of the United States(U.S.) Securities and Exchange Commission’s (SEC) website at sec.gov.
Caution regarding forward-looking statements
From time to time, we make written or oral forward-looking statements within the meaning of certain securities laws, including the“safe harbour” provisions of the United States Private Securities Litigation Reform Act of 1995 and any applicable Canadian securitieslegislation. We may make forward-looking statements in this Q3 2015 Report to Shareholders, in other filings with Canadianregulators or the SEC, in other reports to shareholders and in other communications. Forward-looking statements in this documentinclude, but are not limited to, statements relating to our financial performance objectives, vision and strategic goals, the economicand market review and outlook for Canadian, U.S., European and global economies, the regulatory environment in which we operate,the outlook and priorities for each of our business segments, and the risk environment including our liquidity and funding risk. Theforward-looking information contained in this document is presented for the purpose of assisting the holders of our securities andfinancial analysts in understanding our financial position and results of operations as at and for the periods ended on the datespresented and our financial performance objectives, vision and strategic goals, and may not be appropriate for other purposes.Forward-looking statements are typically identified by words such as “believe”, “expect”, “foresee”, “forecast”, “anticipate”,“intend”, “estimate”, “goal”, “plan” and “project” and similar expressions of future or conditional verbs such as “will”, “may”,“should”, “could” or “would”.
By their very nature, forward-looking statements require us to make assumptions and are subject to inherent risks anduncertainties, which give rise to the possibility that our predictions, forecasts, projections, expectations or conclusions will not proveto be accurate, that our assumptions may not be correct and that our financial performance objectives, vision and strategic goals willnot be achieved. We caution readers not to place undue reliance on these statements as a number of risk factors could cause ouractual results to differ materially from the expectations expressed in such forward-looking statements. These factors – many of whichare beyond our control and the effects of which can be difficult to predict – include: credit, market, liquidity and funding, insurance,regulatory compliance, operational, strategic, reputation, legal and regulatory environment, competitive and systemic risks and otherrisks discussed in the Risk management and Overview of other risks sections of our 2014 Annual Report and the Risk managementsection of this Q3 2015 Report to Shareholders; anti-money laundering, growth in wholesale credit, the high levels of Canadianhousehold debt; cybersecurity; the business and economic conditions in Canada, the U.S. and certain other countries in which weoperate; the effects of changes in government fiscal, monetary and other policies; tax risk and transparency; our ability to attract andretain employees; the accuracy and completeness of information concerning our clients and counterparties; the development andintegration of our distribution networks; model, information technology, information management, social media, environmental andthird party and outsourcing risk.
We caution that the foregoing list of risk factors is not exhaustive and other factors could also adversely affect our results. Whenrelying on our forward-looking statements to make decisions with respect to us, investors and others should carefully consider theforegoing factors and other uncertainties and potential events. Material economic assumptions underlying the forward lookingstatements contained in this Q3 2015 Report to Shareholders are set out in the Overview and outlook section and for each businesssegment under the heading Outlook and priorities in our 2014 Annual Report, as updated by the Overview and outlook section of thisQ3 2015 Report to Shareholders. Except as required by law, we do not undertake to update any forward-looking statement, whetherwritten or oral, that may be made from time to time by us or on our behalf.
Additional information about these and other factors can be found in the Risk management and Overview of other risks sectionsof our 2014 Annual Report and the Risk management section of this Q3 2015 Report to Shareholders.
Information contained in or otherwise accessible through the websites mentioned does not form part of this report. All references inthis report to websites are inactive textual references and are for your information only.
Overview and outlook
About Royal Bank of Canada
Royal Bank of Canada is Canada’s largest bank, and one of the largest banks in the world, based on market capitalization. We are oneof North America’s leading diversified financial services companies, and provide personal and commercial banking, wealthmanagement, insurance, investor services and capital markets products and services on a global basis. We employ approximately79,000 full- and part-time employees who serve more than 16 million personal, business, public sector and institutional clientsthrough offices in Canada, the U.S. and 38 other countries. For more information, please visit rbc.com.

Royal Bank of Canada Third Quarter 2015 3
Selected financial and other highlights
As at or for the three months ended As at or for the nine months ended
(Millions of Canadian dollars, except per share, number of and percentage amounts)
July 31
2015April 30
2015July 31
2014July 31
2015July 31
2014
Total revenue $ 8,828 $ 8,830 $ 8,990 $ 27,302 $ 25,726Provision for credit losses (PCL) 270 282 283 822 819Insurance policyholder benefits, claims and acquisition
expense (PBCAE) 656 493 1,009 2,671 2,821Non-interest expense 4,635 4,736 4,602 13,991 13,321Net income before income taxes 3,267 3,319 3,096 9,818 8,765
Net income $ 2,475 $ 2,502 $ 2,378 $ 7,433 $ 6,671
Segments – net incomePersonal & Commercial Banking $ 1,281 $ 1,200 $ 1,138 $ 3,736 $ 3,324Wealth Management 285 271 285 786 798Insurance 173 123 214 481 525Investor & Treasury Services 167 159 110 468 328Capital Markets 545 625 641 1,764 1,653Corporate Support 24 124 (10) 198 43
Net income $ 2,475 $ 2,502 $ 2,378 $ 7,433 $ 6,671
Selected informationEPS – basic $ 1.66 $ 1.68 $ 1.59 $ 5.00 $ 4.45
– diluted 1.66 1.68 1.59 4.99 4.43ROE (1), (2) 18.1% 19.3% 19.6% 18.9% 19.0%PCL on impaired loans as a % of average net loans and
acceptances 0.23% 0.25% 0.26% 0.24% 0.26%Gross impaired loans (GIL) as a % of loans and acceptances 0.50% 0.46% 0.45% 0.50% 0.45%Liquidity coverage ratio (3) 117% 113% n.a. 117% n.a.
Capital ratios, Leverage ratio and multiples (4)
Common Equity Tier 1 (CET1) ratio (4) 10.1% 10.0% 9.5% 10.1% 9.5%Tier 1 capital ratio (4) 11.7% 11.6% 11.2% 11.7% 11.2%Total capital ratio (4) 13.4% 13.5% 13.0% 13.4% 13.0%Assets-to-capital multiple (4) n.a. n.a. 17.3X n.a. 17.3XLeverage ratio (4) 4.2% 4.0% n.a. n.a. n.a.
Selected balance sheet and other informationTotal assets $ 1,085,173 $ 1,032,172 $ 913,870 $ 1,085,173 $ 913,870Securities 235,515 222,643 199,114 235,515 199,114Loans (net of allowance for loan losses) 462,599 448,310 430,421 462,599 430,421Derivative related assets 112,459 107,004 72,823 112,459 72,823Deposits 694,236 651,551 601,691 694,236 601,691Common equity 55,153 51,779 46,965 55,153 46,965Average common equity (1) 52,600 51,500 46,400 51,100 45,300Total capital risk-weighted assets 421,908 398,992 371,949 421,908 371,949Assets under management (AUM) 508,700 486,300 446,500 508,700 446,500Assets under administration (AUA) (5) 5,012,900 4,835,100 4,472,300 5,012,900 4,472,300
Common share informationShares outstanding (000s) – average basic 1,443,052 1,442,078 1,442,312 1,442,579 1,442,615
– average diluted 1,449,540 1,448,651 1,449,455 1,449,206 1,452,868– end of period 1,443,192 1,443,102 1,441,536 1,443,192 1,441,536
Dividends declared per common share $ 0.77 $ 0.77 $ 0.71 $ 2.29 $ 2.09Dividend yield (6) 4.0% 4.0% 3.7% 3.9% 3.7%Common share price (RY on TSX) $ 76.26 $ 80.11 $ 80.47 $ 76.26 $ 80.47Market capitalization (TSX) 110,058 115,607 116,000 110,058 116,000
Business information (number of)Employees (full-time equivalent) (FTE) 74,214 73,136 74,542 74,214 74,542Bank branches 1,354 1,361 1,364 1,354 1,364Automated teller machines (ATMs) 4,892 4,913 4,940 4,892 4,940
Period average US$ equivalent of C$1.00 (7) $ 0.789 $ 0.806 $ 0.925 $ 0.811 $ 0.919Period-end US$ equivalent of C$1.00 $ 0.765 $ 0.829 $ 0.917 $ 0.765 $ 0.917(1) Average amounts are calculated using methods intended to approximate the average of the daily balances for the period. This includes ROE and Average common equity. For further details, refer to
the Key performance and non-GAAP measures section.(2) These measures may not have a standardized meaning under generally accepted accounting principles (GAAP) and may not be comparable to similar measures disclosed by other financial
institutions. For further details, refer to the Key performance and non-GAAP measures section.(3) Effective the second quarter of 2015, we calculate the Liquidity Coverage Ratio (LCR) using the Liquidity Adequacy Requirements (LAR) guideline. The LCR is a new regulatory measure under the
Basel III framework. The LCR is not applicable (n.a.) for prior periods as it was adopted prospectively, effective the second quarter of 2015. The LCR for Q2 2015 has been revised from thatpreviously disclosed. For further details, refer to the Liquidity and funding risk section.
(4) Capital and Leverage ratios presented above are on an “all-in” basis. Effective the first quarter of 2015, the Leverage ratio has replaced the Assets-to-capital multiple (ACM). The Leverage ratio is aregulatory measure under the Basel III framework and is n.a. for prior periods. The ACM is presented on a transitional basis for prior periods. For further details, refer to the Capital managementsection.
(5) AUA represents period-end spot balances and includes securitized residential mortgages and credit card loans as at July 31, 2015 of $21.7 billion and $8.4 billion, respectively (April 30, 2015 –$22.5 billion and $7.9 billion; July 31, 2014 – $23.1 billion and $8.3 billion).
(6) Defined as dividends per common share divided by the average of the high and low share price in the relevant period.(7) Average amounts are calculated using month-end spot rates for the period.

4 Royal Bank of Canada Third Quarter 2015
Economic, market and regulatory review and outlook – data as at August 25, 2015
CanadaThe Canadian economy contracted at an estimated rate of (1.2)% in the second calendar quarter of 2015, following a decline ingrowth of (0.6)% in the first calendar quarter of 2015. This was mostly due to continuing weakness in investment by the energy sectorand slow export activity. Lower growth than expected in the first two calendar quarters of 2015 resulted in an increase in excesscapacity and created downward risks to the inflation outlook, leading the Bank of Canada (BoC) to reduce its overnight rate by 25 bpsto 0.50% in July 2015, the second decrease in the calendar year. The Canadian dollar declined in value against the U.S. dollarfollowing the BoC rate decision, and reached an 11 year low in August 2015, as the market priced in a further divergence in monetarypolicy between the two countries. Housing market activity overall remained solid during the calendar quarter, helped by very lowinterest rates and solid labour markets. The unemployment rate held steady at 6.8% in July 2015, as job gains in the second calendarquarter were accompanied by an increase in the labour force.
Despite the contraction in the first half of calendar 2015, we expect the Canadian economy to grow in calendar 2015 at anestimated rate of 1.0%, which is below our previous estimates. We expect growth of 1.8% in the third calendar quarter and growth of2.6% in the fourth calendar quarter to offset the contraction of the economy in the first six months of the year due to the effect of solidconsumer spending and firmer export growth with the latter benefiting from the lower Canadian dollar relative to the U.S. dollar. Weexpect the BoC to maintain its policy rate at 0.50% through the first half of 2016. However, there is a possibility of a further cut to theovernight rate if economic weakness persists during the second calendar half of 2015.
U.S.The U.S. economy recovered from the slowdown experienced in the first calendar quarter of 2015, and grew in the second calendarquarter at an estimated rate of 2.3%. Consumer spending growth during the calendar quarter was supported by continuingimprovements in the labour market as well as higher disposable income due to lower gasoline prices. The U.S. housing marketshowed some recovery during the calendar quarter, while the unemployment rate improved further to 5.3% in July 2015, which isclose to the range considered full employment by the Federal Reserve (Fed). Despite this improvement in the labour and housingmarkets, the Fed pointed to weaker exports and business investment at its July 2015 meeting, and maintained its cautious policystance by holding its funds target range at historically low levels.
We expect the U.S. economy to grow at an estimated rate of 2.4% in calendar 2015, which is below our previous estimates,reflecting the soft start to the year. Firmer consumer spending growth and improved business investment are expected to result in theeconomy growing at an above-potential pace in the second calendar half of the year. The recovery in economic growth and theunemployment rate moving towards the range considered full employment by the Fed are expected to result in the Fed announcing a25 bps increase to its current funds target range of 0.0% to 0.25% in September 2015.
EuropeThe Euro area economy continued its recovery and grew in the second calendar quarter of 2015 at an estimated rate of 0.3%, mostlydue to the effects of the stimulative monetary policy adopted by the European Central Bank (ECB), lower energy prices, and a weakerEuro. Uncertainty relating to a potential Greek exit from the Euro area resulting from an inability to make sovereign debt payments didnot disrupt economic growth during the calendar quarter. The Euro area inflation rate increased to 0.2% in July 2015 from 0.0% inApril 2015, as a decline in energy prices was more than offset by higher price gains in other sectors. The unemployment rate improvedmarginally to 11.1% in June 2015, from 11.2% in March 2015. The ECB continued its monthly asset purchase program, the PublicSector Purchase Program (PSPP), by making monthly purchases of up to €60 billion of a combination of euro-denominated publicsector securities, asset-backed securities and covered bonds.
We expect the Euro area economy to grow at an estimated rate of 1.4% in calendar 2015, in line with our previous estimates, asthe economy benefits from the stimulus undertaken by the ECB, a weaker Euro, and lower oil prices. We expect the ECB to continuethe PSPP as planned until at least September 2016, and to hold its key interest rate steady at 0.05% for the foreseeable future.
Financial marketsEquity indices in Canada, the U.S. and major European economies displayed some volatility during our current fiscal quarter, mostlyrelated to the effect of low global oil prices, diverging monetary policies amongst global central banks, a possible Greek exit from theEuro as well as a sustained decline in the Chinese equity markets. Yields on both Canadian and U.S. long-term government bondsfluctuated during the fiscal quarter. The Canadian benchmark 10-year government bond yield ended the fiscal quarter lower than theprevious quarter, whereas the U.S. Treasury 10-year bond ended the fiscal quarter above the previous quarter’s yield, reflectingmarket sentiment on divergent central bank policy for the two economies. Credit spreads on corporate bonds in North America andEurope widened during the fiscal quarter. Crude oil prices recovered slightly during the first two months of the fiscal quarter, butdeclined sharply in July 2015 and the early part of August 2015 based on oversupply concerns related to the possible lifting ofeconomic sanctions on Iran and expectations that demand could slow from China, as recent data show weakening in itsmanufacturing sector. Prices for non-precious metals continued to decline due to a combination of strong supply and weaker demandfrom emerging economies, including China.
The macroeconomic headwinds described above, including the slowing Canadian economy and weak exports, continuing low oilprices, as well as potential further cuts by the BoC to its key overnight rate, may negatively impact our results for the remainder offiscal 2015.
Regulatory environmentWe continue to monitor and prepare for regulatory developments in a manner that seeks to ensure compliance with new requirementswhile mitigating any adverse business or economic impacts. Such impacts could result from new or amended regulations and theexpectations of those who enforce them. Significant developments are discussed below.
Royal Bank of Canada Third Quarter 2015 5
Section 619 of the Dodd-Frank Wall Street Reform and Consumer Protection Act (Dodd-Frank Act), together with the implementingrules of the U.S. regulatory agencies (collectively, the Volcker Rule), established broad prohibitions and restrictions on proprietarytrading and investing in or sponsoring hedge funds or private equity funds. Subject to conformance period requirements, the VolckerRule became effective on July 21, 2015. The Volcker Rule is complex and, subject to certain exceptions, applies to the worldwideoperations of non-U.S. banking organization such as RBC that operate a branch or agency or have a bank subsidiary in the U.S. Aspreviously reported, RBC has exited certain activities that could not be restructured to comply with the Volcker Rule. Exiting thoseactivities will not have a material impact on our overall results.
We continue to prepare for implementation of the Fed’s “Enhanced Prudential Standards for Bank Holding Companies andForeign Banking Organizations”, which are rules adopted pursuant to section 165 of the Dodd-Frank Act. These rules introduce a newoversight regime for non-U.S. banks with subsidiaries, affiliates and branches operating in the U.S. and whose U.S. operations havesignificant assets (generally $50 billion or more), and will require RBC to manage its U.S.-based operations pursuant to riskmanagement, governance, liquidity and capital standards set forth in the enhanced supervision rules. RBC has incurred, and willcontinue to incur, costs to comply with the additional U.S.-based financial reporting, risk management and governance requirementsof the rule and we may have less flexibility in our capital and liquidity planning which historically has been managed on a globalbasis. These impacts are not expected to materially affect our overall results.
In November 2014, the Financial Stability Board (FSB) proposed minimum common international standards related to the TotalLoss-Absorbing Capacity (TLAC) of global systemically important banks (G-SIBs). The standards are intended to address thesufficiency of G-SIBs’ capital to absorb losses in a resolution situation in a manner that minimizes the impact on financial stabilityand ensures continuity of critical and long-term debt functions. To date, neither RBC nor any other Canadian bank has beendesignated as a G-SIB. Designation as a G-SIB could result in higher capital requirements over and above the additional 1% domesticcapital buffer established by the Office of the Superintendent of Financial Institutions (OSFI) for the largest six Canadian banks,including RBC, designated as domestic systemically important banks (D-SIBs).
In its April 21, 2015 Federal Budget announcement, the Government of Canada (GoC) confirmed its plans to adopt a “bail-in”regime for Canada’s D-SIBs to limit taxpayer exposure to potential losses of a failing bank and to ensure a bank’s shareholders andcreditors remain responsible for bearing losses. The proposed regime would only apply to certain unsecured debt and not to customerdeposits, and would allow for the permanent conversion of eligible liabilities of a non-viable bank into common shares. Banks wouldbe subject to comprehensive disclosure and reporting requirements, along with minimum loss absorbency requirements to ensurethey can withstand significant losses and to emerge from a conversion well-capitalized. The manner in which the proposal is finalizedcould adversely impact our cost of funding.
The 2015 Federal Budget announced a new principles-based Consumer Code for banks which would include new rules in areassuch as basic banking access, board obligations, business practices, consumer disclosures and complaints reporting. Further detailson these proposed changes will likely not be made available until early 2016.
The 2015 Federal Budget also included several proposed tax changes that could negatively impact our earnings in fiscal 2016.While we are continuing to assess the full impact of these changes, we do not expect them to materially impact our financial results.
The GoC is continuing consultations on potential reforms to the Canadian payments system in areas like next-generationpayments and minimum standards to address risks associated with unregulated participants. Similar consultations are underway inthe U.S. and Europe. Related to this, the GoC has indicated it would be monitoring the level of interchange fees charged to merchantsfor potential adverse impacts on the market, including as it relates to the recent 5-year commitment entered into by Visa andMasterCard to lower the average fee charged on domestic consumer credit cards to merchants. RBC is well-positioned for this changeand does not anticipate the GoC will take further action in this area in the near-term.
For a discussion on risk factors resulting from these and other regulatory developments which may affect our business and financialresults, refer to the Risk management – Top and emerging risks section of our 2014 Annual Report. For further details on ourframework and activities to manage risks, refer to the Risk management and Capital management sections of our 2014 Annual Reportand of this Q3 2015 Report to Shareholders.
Key corporate events of 2015
Royal Bank of Canada (Suisse) SA (RBC Suisse)On July 14, 2015, we announced that we have entered into a definitive agreement to sell Royal Bank of Canada (Suisse) SA, (RBCSuisse), to SYZ Group, subject to customary closing conditions including regulatory approvals. The transaction is expected to close inthe fourth quarter of 2015. For further details, refer to Note 7 of our Condensed Financial Statements.
RBC Royal Bank (Suriname) N.V.On July 31, 2015, we completed the sale of RBC Royal Bank (Suriname) N.V. (RBC Suriname), as previously announced on April 1,2015. As a result of the transaction, we recorded a total loss on disposal of $19 million (before and after-tax), including a loss of$23 million in the second quarter in Non-interest expense – Other, and a gain of $4 million in the third quarter including foreigncurrency translation gains reclassified from Other components of equity. For further details, refer to Note 7 of our Condensed FinancialStatements.
City National CorporationOn January 22, 2015, we announced that we had entered into a merger agreement to acquire City National Corporation (City National),the holding company for City National Bank, for cash and RBC common shares. As at the date of announcement, the total transactionvalue was approximately US$5.4 billion. The aggregate consideration will be paid with approximately US$2.7 billion in cash and

6 Royal Bank of Canada Third Quarter 2015
approximately 44 million RBC common shares. The total number of RBC common shares to be issued and the amount of cash to bepaid in the transaction are both fixed. The transaction value will be determined at the time of closing based upon the price of ourcommon shares at such time. The transaction is expected to close in the first quarter of 2016 and is subject to customary closingconditions, including regulatory approvals. Common stockholders of City National approved the transaction in a vote held on May 27,2015. For further details, refer to Note 7 of our Condensed Financial Statements.
Financial performance
Overview
Q3 2015 vs. Q3 2014Net income of $2,475 million was up $97 million or 4% from a year ago. Diluted earnings per share (EPS) of $1.66 was up $0.07 andreturn on common equity (ROE) of 18.1% was down 150 bps from 19.6% last year. Our Common Equity Tier 1 (CET1) ratio was 10.1%.
Excluding a specified item last year described below, net income was up $57 million or 2% from last year, and diluted EPS of$1.66 was up $0.04. Our results reflected solid volume growth and strong fee-based revenue growth across most businesses inCanadian Banking, the positive impact of foreign exchange translation on earnings, and growth in average fee-based client assets.Higher earnings from our foreign exchange businesses also contributed to the increase. These factors were partially offset by lowertrading results due to less favourable market conditions, a higher effective tax rate, lower transaction volumes and the change in fairvalue of our U.S. share-based compensation plan in Wealth Management.
For further details on our results and CET1 ratio, refer to the Business segment results and Capital management sections,respectively.
Q3 2015 vs. Q2 2015Net income decreased $27 million or 1% from the prior quarter. Diluted EPS was down $0.02 and ROE was down 120 bps compared to19.3% last quarter.
Excluding a specified item last quarter described below, net income increased $81 million or 3% from the prior quarter, anddiluted EPS was up $0.05. Our results reflected higher earnings due to the positive impact of seasonal factors, including additionaldays in the quarter particularly in Canadian Banking, and strong fee-based revenue growth and solid volume growth across mostbusinesses in Canadian Banking. Lower claims costs, largely in our life retrocession business, a favourable impact of investment-related activities on the Canadian life business, and higher M&A activity also contributed to the increase. These factors were partiallyoffset by lower trading results reflecting less favourable market conditions, and lower origination activity as compared to the stronglevels last quarter.
Q3 2015 vs. Q3 2014 (Nine months ended)Net income of $7,433 million increased $762 million or 11% from a year ago. Nine months diluted EPS of $4.99 was up $0.56 andROE of 18.9% was down 10 bps.
Excluding the specified items described below, net income increased $522 million or 8% from the prior year, and diluted EPS wasup $0.40. Our results reflected solid volume growth and strong fee-based revenue growth across most businesses in CanadianBanking, and strong business growth in Capital Markets. Higher earnings from growth in average fee-based client assets, the positiveimpact of foreign exchange translation, higher earnings from our foreign exchange businesses, and higher earnings from new U.K.annuity contracts also contributed to the increase. These factors were partially offset by higher costs in support of business growth,lower spreads, and restructuring costs of $76 million ($53 million after-tax) related to our U.S. & International Wealth Managementbusiness.
Specified itemsFor the nine months ended July 31, 2015, our results were impacted by a gain of $108 million (before- and after-tax) from the wind-upof a U.S.-based funding subsidiary that resulted in the release of foreign currency translation adjustment (CTA) that was previouslybooked in other components of equity (OCE), which was recorded in Corporate Support last quarter. During the three months endedJuly 31, 2014, our results were impacted by a loss of $40 million (before- and after-tax), which included foreign currency translationrelated to the closing of the sale of RBC Jamaica. For the nine months ended July 31, 2014, our results were impacted by a total loss of$100 million (before- and after-tax) related to the sale of RBC Jamaica, as well as a provision of $40 million ($32 million after-tax)related to post-employment benefits and restructuring charges in the Caribbean. Results excluding these specified items are non-GAAP measures. For further details, refer to the Key performance and non-GAAP measures section.
Estimated impact of foreign currency translation on our consolidated financial resultsOur foreign currency-denominated results are impacted by exchange rate fluctuations. Revenue, PCL, insurance policyholder benefits,claims and acquisition expense (PBCAE), non-interest expense and net income denominated in foreign currency are translated at theaverage rate of exchange for the period.

Royal Bank of Canada Third Quarter 2015 7
The following table reflects the estimated impact of foreign exchange translation on key income statement items:
For the three months ended For the nine months ended
(Millions of Canadian dollars, except per share amounts)
Q3 2015 vs.Q3 2014
Q3 2015 vs.Q2 2015
Q3 2015 vs.Q3 2014
Increase (decrease):Total revenue $ 295 $ 60 $ 694PCL 3 – 5PBCAE 25 10 45Non-interest expense 196 43 440Income taxes 27 2 85Net income 44 5 119
Impact on EPSBasic $ .03 $ .00 $ .08Diluted .03 .00 .08
The relevant average exchange rates that impact our business are shown in the following table:
For the three months ended For the nine months ended
(Average foreign currency equivalent of C$1.00) (1)
July 31
2015April 30
2015July 31
2014July 31
2015July 31
2014
U.S. dollar $ 0.789 $ 0.806 $ 0.925 $ 0.811 $ 0.919British pound 0.508 0.530 0.547 0.527 0.550Euro 0.715 0.729 0.682 0.716 0.673(1) Average amounts are calculated using month-end spot rates for the period.
Total revenue
For the three months ended For the nine months ended
(Millions of Canadian dollars, except percentageamounts)
July 312015
April 302015
July 312014
July 312015
July 312014
Interest income $ 5,755 $ 5,557 $ 5,673 $ 17,014 $ 16,543Interest expense 1,972 2,000 2,026 6,043 5,987
Net interest income $ 3,783 $ 3,557 $ 3,647 $ 10,971 $ 10,556Net interest margin (on average
earning assets) (1) 1.72% 1.71% 1.90% 1.72% 1.88%
Investments (2) $ 2,063 $ 2,020 $ 1,849 $ 6,070 $ 5,431Insurance (2) 1,021 806 1,383 3,719 3,790Trading 56 359 285 755 895Banking (2) 1,071 1,195 1,093 3,261 3,078Underwriting and other advisory 531 559 552 1,535 1,381Other (2) 303 334 181 991 595
Non-interest income $ 5,045 $ 5,273 $ 5,343 $ 16,331 $ 15,170
Total revenue $ 8,828 $ 8,830 $ 8,990 $ 27,302 $ 25,726
Additional informationTotal trading revenue
Net interest income $ 623 $ 595 $ 578 $ 1,758 $ 1,505Non-interest income 56 359 285 755 895
Total trading revenue $ 679 $ 954 $ 863 $ 2,513 $ 2,400(1) Net interest margin (on average earning assets) is calculated as net interest income divided by average earning assets.(2) Refer to the Financial Performance section of our 2014 Annual Report for the definition of these categories.
Q3 2015 vs. Q3 2014Total revenue decreased $162 million or 2% from last year, which included the negative change in fair value of investments backingour policy holders liabilities of $292 million, which was largely offset in PBCAE. The positive impact of foreign exchange translationthis quarter increased total revenue by $295 million.
Net interest income increased $136 million or 4%, mainly due to solid volume growth across most businesses in CanadianBanking, and higher lending activity in Capital Markets. These factors were partially offset by lower spreads.
Net interest margin was down 18 bps compared to last year, largely due to the lower interest rate environment and competitivepressures. The change in the fourth quarter of 2014 in recording of certain loan fees in our business portfolio from Net interest incometo Non-interest income in Personal & Commercial Banking also contributed to the decrease.
Investments revenue increased $214 million or 12%, mainly due to growth in average fee-based client assets and the positiveimpact of foreign exchange translation. Higher securities brokerage commissions in Capital Markets, and higher mutual funddistribution fees in Canadian Banking also contributed to the increase. These factors were partly offset by lower transaction volumesin Wealth Management reflecting uncertain market conditions, and the change in fair value of our U.S. share-based compensationplan.
Insurance revenue decreased $362 million or 26%, mainly due to the negative change in fair value of investments backing ourpolicyholder liabilities resulting from the increase in long-term interest rates, and a reduction of revenue related to our retrocessioncontracts, both of which were largely offset in PBCAE. These factors were partially offset by business growth in our life, home and autoinsurance businesses.

8 Royal Bank of Canada Third Quarter 2015
Trading revenue in Non-interest income decreased $229 million. Total trading revenue of $679 million, which comprises trading-related revenue recorded in Net interest income and Non-interest income, was down $184 million or 21%, mainly reflecting lowertrading results due to less favourable market conditions as compared to the strong levels last year, partially offset by the positiveimpact of foreign exchange translation.
Banking revenue decreased $22 million or 2%, mainly due to the change in fair value of certain available-for-sale (AFS) securitiesused for funding activities which is offset in Other revenue. This factor was partially offset by higher credit card loan balances andtransaction volumes, and higher foreign exchange revenue reflecting increased client activity mainly due to market volatility.
Underwriting and other advisory revenue decreased $21 million or 4%, primarily due to lower equity origination in the U.S. andCanada as compared to strong levels last year. This factor was partially offset by strong growth in M&A activity in the U.S. and Europe,higher debt origination activity mainly in the U.S., and the positive impact of foreign exchange translation.
Other revenue increased $122 million or 67%, mainly due to the change in fair value of certain derivatives used to economicallyhedge our funding activities noted above.
Q3 2015 vs. Q2 2015Total revenue decreased $2 million from the prior quarter. Excluding a specified item in the prior quarter noted above, total revenueincreased $106 million or 1%, primarily due to the positive change in fair value of investments backing our policyholder liabilities,largely offset in PBCAE. The positive impact of seasonal factors on our banking businesses, including additional days in the quarter,strong fee-based revenue growth and solid volume growth across most businesses in Canadian Banking, and the positive impact offoreign exchange translation also contributed to the increase. These factors were partially offset by lower trading revenue reflectingless favourable market conditions, and lower origination activity as compared to the strong levels last quarter.
Q3 2015 vs. Q3 2014 (Nine months ended)Total revenue increased $1,576 million or 6%. Excluding a specified item noted above, total revenue increased $1,468 million or 6%,primarily due to the positive impact of foreign exchange translation, and solid volume growth across most businesses as well asstrong fee-based revenue growth in Canadian Banking. Solid growth in our corporate and investment banking businesses, growth inCanadian Insurance, higher revenue from U.K. annuity contracts, and higher trading revenue reflecting increased client activity andmore favourable market conditions in the first half of the year also contributed to the increase. These factors were partially offset by areduction of revenue related to our retrocession contracts, largely offset in PBCAE, lower spreads, and lower equity origination activity.
Revenue excluding the specified item noted above is a non-GAAP measure. For further details, including a reconciliation, refer to theKey performance and non-GAAP measures section.
Provision for credit lossesQ3 2015 vs. Q3 2014Total PCL decreased $13 million or 5% from a year ago, mainly due to lower PCL in Caribbean Banking, partially offset by higher PCL inCapital Markets and Canadian Banking.
Q3 2015 vs. Q2 2015Total PCL decreased $12 million or 4% from the prior quarter, mainly due to lower PCL in Wealth Management, partially offset byhigher PCL in Canadian Banking.
Q3 2015 vs. Q3 2014 (Nine months ended)Total PCL increased $3 million from the prior year, mainly due to higher PCL in Wealth Management and Capital Markets, largely offsetby lower PCL in Personal & Commercial Banking.
For further details on PCL, refer to the Credit quality performance section.
Insurance policyholder benefits, claims and acquisition expenseQ3 2015 vs. Q3 2014PBCAE decreased $353 million or 35% from a year ago, mainly due to the negative change in fair value of our investments backing ourpolicyholder liabilities, and a reduction of PBCAE related to our retrocession contracts, which were largely offset in insurance revenue.These factors were partially offset by business growth, including a new U.K. annuity contract, and higher claims costs in our liferetrocession business.
Q3 2015 vs. Q2 2015PBCAE increased $163 million or 33% from the prior quarter, mainly due to the positive change in fair value of our investmentsbacking our policyholder liabilities, largely offset in insurance revenue. This factor was partially offset by a favourable impact ofinvestment-related activities in the Canadian life business and lower net claims costs.
Q3 2015 vs. Q3 2014 (Nine months ended)PBCAE decreased $150 million or 5% from the prior year, mainly due to a reduction of PBCAE related to our retrocession contracts,which was largely offset in insurance revenue, and lower claims costs in Canadian Insurance. These factors were partially offset bybusiness growth in International insurance, including new U.K. annuity contracts, and the positive change in fair value of investmentsbacking our policyholder liabilities, largely offset in insurance revenue. In addition, our prior year results were impacted by favourableactuarial adjustments reflecting management actions and assumption changes.
Royal Bank of Canada Third Quarter 2015 9
Non-interest expense
For the three months ended For the nine months ended
(Millions of Canadian dollars, except percentage amounts)
July 31
2015April 30
2015July 31
2014 (2)
July 31
2015July 31
2014 (2)
Salaries $ 1,309 $ 1,273 $ 1,216 $ 3,849 $ 3,601Variable compensation 1,133 1,264 1,253 3,578 3,465Benefits and retention compensation 399 421 373 1,252 1,200Share-based compensation 49 38 24 222 184
Human resources $ 2,890 $ 2,996 $ 2,866 $ 8,901 $ 8,450Equipment 327 311 287 935 859Occupancy 351 356 350 1,042 997Communications 213 224 207 635 588Professional fees 223 204 178 625 500Amortization of other intangibles 180 178 171 532 490Other 451 467 543 1,321 1,437
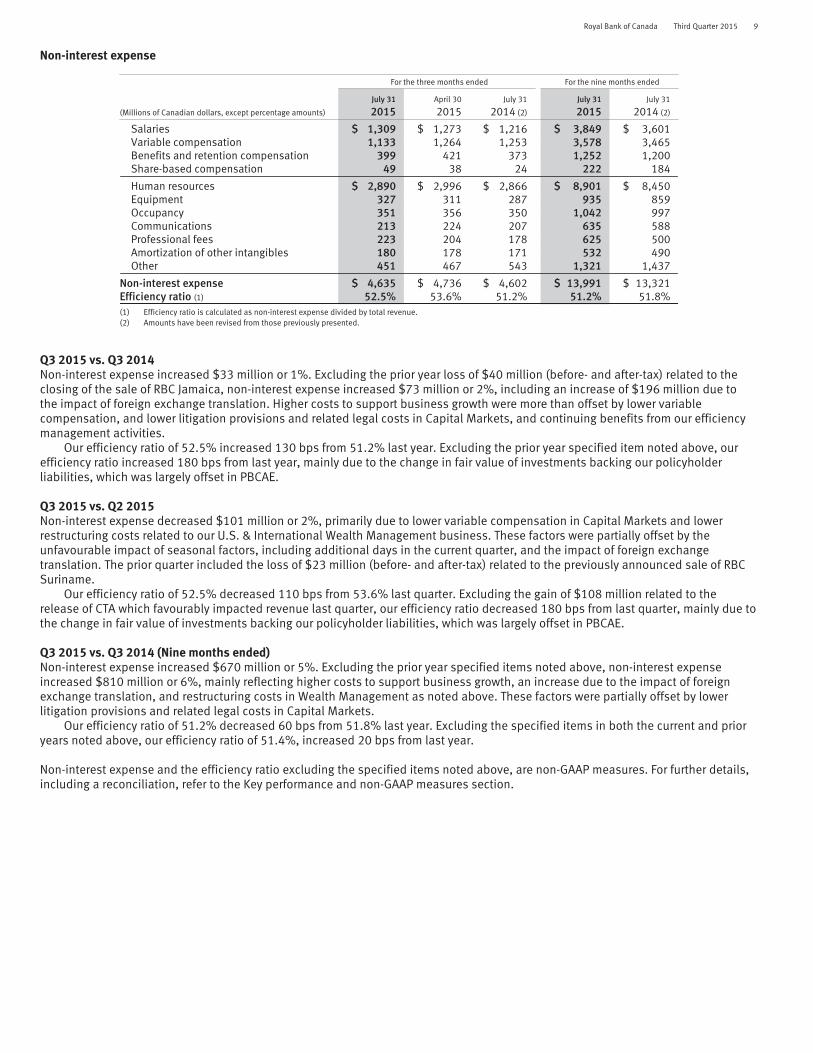
Non-interest expense $ 4,635 $ 4,736 $ 4,602 $ 13,991 $ 13,321Efficiency ratio (1) 52.5% 53.6% 51.2% 51.2% 51.8%(1) Efficiency ratio is calculated as non-interest expense divided by total revenue.(2) Amounts have been revised from those previously presented.
Q3 2015 vs. Q3 2014Non-interest expense increased $33 million or 1%. Excluding the prior year loss of $40 million (before- and after-tax) related to theclosing of the sale of RBC Jamaica, non-interest expense increased $73 million or 2%, including an increase of $196 million due tothe impact of foreign exchange translation. Higher costs to support business growth were more than offset by lower variablecompensation, and lower litigation provisions and related legal costs in Capital Markets, and continuing benefits from our efficiencymanagement activities.
Our efficiency ratio of 52.5% increased 130 bps from 51.2% last year. Excluding the prior year specified item noted above, ourefficiency ratio increased 180 bps from last year, mainly due to the change in fair value of investments backing our policyholderliabilities, which was largely offset in PBCAE.
Q3 2015 vs. Q2 2015Non-interest expense decreased $101 million or 2%, primarily due to lower variable compensation in Capital Markets and lowerrestructuring costs related to our U.S. & International Wealth Management business. These factors were partially offset by theunfavourable impact of seasonal factors, including additional days in the current quarter, and the impact of foreign exchangetranslation. The prior quarter included the loss of $23 million (before- and after-tax) related to the previously announced sale of RBCSuriname.
Our efficiency ratio of 52.5% decreased 110 bps from 53.6% last quarter. Excluding the gain of $108 million related to therelease of CTA which favourably impacted revenue last quarter, our efficiency ratio decreased 180 bps from last quarter, mainly due tothe change in fair value of investments backing our policyholder liabilities, which was largely offset in PBCAE.
Q3 2015 vs. Q3 2014 (Nine months ended)Non-interest expense increased $670 million or 5%. Excluding the prior year specified items noted above, non-interest expenseincreased $810 million or 6%, mainly reflecting higher costs to support business growth, an increase due to the impact of foreignexchange translation, and restructuring costs in Wealth Management as noted above. These factors were partially offset by lowerlitigation provisions and related legal costs in Capital Markets.
Our efficiency ratio of 51.2% decreased 60 bps from 51.8% last year. Excluding the specified items in both the current and prioryears noted above, our efficiency ratio of 51.4%, increased 20 bps from last year.
Non-interest expense and the efficiency ratio excluding the specified items noted above, are non-GAAP measures. For further details,including a reconciliation, refer to the Key performance and non-GAAP measures section.

10 Royal Bank of Canada Third Quarter 2015
Income taxes
For the three months ended For the nine months ended
(Millions of Canadian dollars, except percentage amounts)
July 31
2015April 30
2015July 31
2014July 31
2015July 31
2014
Income taxes $ 792 $ 817 $ 718 $ 2,385 $ 2,094
Net income before income taxes $ 3,267 $ 3,319 $ 3,096 $ 9,818 $ 8,765Canadian statutory income tax rate (1) 26.3% 26.3% 26.3% 26.3% 26.3%
Lower average tax rate applicable to subsidiaries (0.2)% (0.3)% (2.5)% (0.7)% (2.3)%Tax-exempt income from securities (3.2)% (2.7)% (4.3)% (2.9)% (3.5)%Tax rate change 0.1% 0.6% 0.0% 0.2% 0.0%Effect of previously unrecognized tax loss, tax
credit or temporary differences (0.1)% 0.0% 0.0% 0.0% 0.0%Other 1.3% 0.7% 3.7% 1.4% 3.4%
Effective income tax rate (2) 24.2% 24.6% 23.2% 24.3% 23.9%(1) Blended Federal and Provincial statutory income tax rate.(2) Total income taxes as a percentage of net income before income taxes.
Q3 2015 vs. Q3 2014Income tax expense increased $74 million or 10% from last year, mainly due to higher earnings before income taxes. The effectiveincome tax rate of 24.2% increased 100 bps primarily due to lower tax-exempt income and the impact of increased income in highertax rate jurisdictions in the current year. These factors were partially offset by lower unfavourable tax adjustments.
Q3 2015 vs. Q2 2015Income tax expense decreased $25 million or 3% from last quarter, mainly due to lower earnings before income taxes. The effectiveincome tax rate of 24.2% decreased 40 bps from 24.6% in the last quarter, mainly due to higher tax-exempt income.
Q3 2015 vs. Q3 2014 (Nine months ended)Income tax expense increased $291 million or 14%, mainly due to higher earnings before income taxes. The effective income tax rateof 24.3% increased 40 bps primarily due to lower tax-exempt income and the impact of increased income in higher tax ratejurisdictions in the current year. These factors were partially offset by lower unfavourable tax adjustments.
Business segment results
How we measure and report our business segments
The key methodologies and assumptions used in our management reporting framework are periodically reviewed by management toensure they remain valid and remain unchanged from October 31, 2014. For further details, refer to the How we measure and reportour business segments section of our 2014 Annual Report.
Key performance and non-GAAP measures
Performance measures
Return on common equity (ROE)We measure and evaluate the performance of our consolidated operations and each business segment using a number of financialmetrics, such as net income and ROE. We use ROE, at both the consolidated and business segment levels, as a measure of return ontotal capital invested in our business. Management views the business segment ROE measure as a useful measure for supportinginvestment and resource allocation decisions because it adjusts for certain items that may affect comparability between businesssegments and certain competitors. For further details, refer to the Key performance and non-GAAP measures section of our 2014Annual Report.
The following table provides a summary of our ROE calculations:
For the three months ended
July 31
2015April 30
2015July 31
2014
(Millions of Canadian dollars, except percentage amounts)
Personal &Commercial
BankingWealth
Management Insurance
Investor &TreasuryServices
CapitalMarkets
CorporateSupport Total Total Total
Net income available to commonshareholders $ 1,264 $ 278 $ 172 $ 164 $ 530 $ (9) $ 2,399 $ 2,426 $ 2,297
Total average common equity (1), (2) 16,550 5,950 1,550 2,650 16,300 9,600 52,600 51,500 46,400
ROE (3) 30.3% 18.6% 43.6% 24.5% 12.9% n.m. 18.1% 19.3% 19.6%

Royal Bank of Canada Third Quarter 2015 11
For the nine months ended
July 31
2015July 31
2014
(Millions of Canadian dollars, except percentage amounts)
Personal &Commercial
BankingWealth
Management Insurance
Investor &TreasuryServices
CapitalMarkets
CorporateSupport Total Total
Net income available to commonshareholders $ 3,686 $ 769 $ 478 $ 460 $ 1,721 $ 105 $ 7,219 $ 6,425
Total average common equity (1), (2) 16,300 5,900 1,550 2,550 16,300 8,500 51,100 45,300
ROE (3) 30.3% 17.5% 41.1% 24.2% 14.1% n.m. 18.9% 19.0%(1) Average common equity represents rounded figures.(2) The amounts for the segments are referred to as attributed capital.(3) ROE is based on actual balances of average common equity before rounding.n.m. not meaningful
Non-GAAP measuresWe believe that certain non-GAAP measures described below are more reflective of our ongoing operating results, and provide readerswith a better understanding of management’s perspective on our performance. These measures enhance the comparability of ourfinancial performance for the three and nine months ended July 31, 2015 with the corresponding periods in the prior year and thethree months ended April 30, 2015 as well as, in the case of economic profit, measure relative contribution to shareholder value. Non-GAAP measures do not have a standardized meaning under GAAP and may not be comparable to similar measures disclosed by otherfinancial institutions.
The following discussion describes the non-GAAP measures we use in evaluating our operating results.
Economic profitEconomic profit is net income excluding the after-tax effect of amortization of other intangibles less a capital charge for use ofattributed capital. It measures the return generated by our businesses in excess of our cost of capital, thus enabling users to identifyrelative contributions to shareholder value.
The capital charge includes a charge for common equity and preferred shares. In 2014, we revised our cost of equity to 9.0% from8.5% in 2013, largely as a result of higher long-term interest rates. For 2015, our cost of capital remains 9.0%.
The following table provides a summary of our Economic profit:
For the three months ended
July 31
2015April 30
2015July 31
2014
(Millions of Canadian dollars)
Personal &Commercial
BankingWealth
Management Insurance
Investor &TreasuryServices
CapitalMarkets
CorporateSupport Total Total Total
Net income $ 1,281 $ 285 $ 173 $ 167 $ 545 $ 24 $ 2,475 $ 2,502 $ 2,378add: Non-controlling interests (1) (1) – – – (24) (26) (29) (26)
After-tax effect of amortization ofother intangibles 4 17 – 5 1 – 27 30 29
Intangibles writedown – – – – – – – 4 2
Adjusted net income (loss) $ 1,284 $ 301 $ 173 $ 172 $ 546 $ – $ 2,476 $ 2,507 $ 2,383less: Capital charge 392 140 36 63 386 227 1,244 1,176 1,107
Economic profit (loss) $ 892 $ 161 $ 137 $ 109 $ 160 $ (227) $ 1,232 $ 1,331 $ 1,276
For the nine months ended
July 31
2015July 31
2014
(Millions of Canadian dollars)
Personal &Commercial
BankingWealth
Management Insurance
Investor &TreasuryServices
CapitalMarkets
CorporateSupport Total Total
Net income $ 3,736 $ 786 $ 481 $ 468 $ 1,764 $ 198 $ 7,433 $ 6,671add: Non-controlling interests (6) (1) – (1) – (69) (77) (77)
After-tax effect of amortization ofother intangibles 19 52 – 16 1 (1) 87 93
Intangibles writedown – 4 – – – – 4 2
Adjusted net income (loss) $ 3,749 $ 841 $ 481 $ 483 $ 1,765 $ 128 $ 7,447 $ 6,689less: Capital charge 1,140 412 108 178 1,140 599 3,577 3,220
Economic profit (loss) $ 2,609 $ 429 $ 373 $ 305 $ 625 $ (471) $ 3,870 $ 3,469
12 Royal Bank of Canada Third Quarter 2015
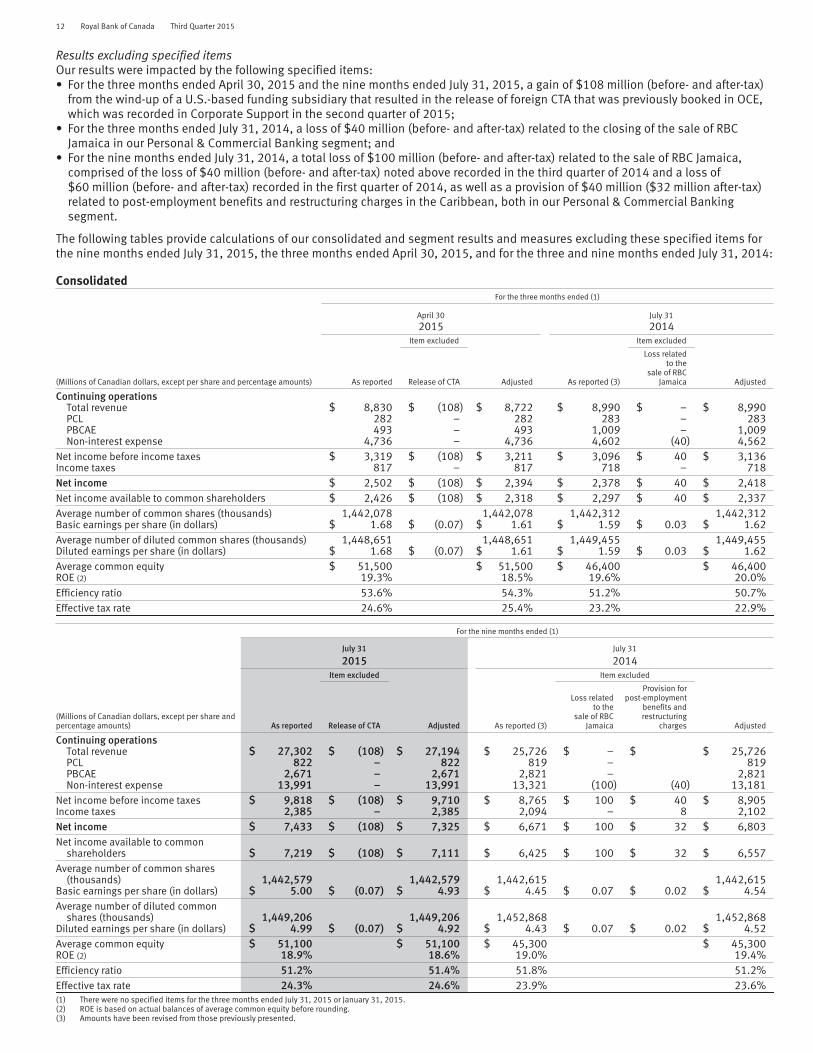
Results excluding specified itemsOur results were impacted by the following specified items:• For the three months ended April 30, 2015 and the nine months ended July 31, 2015, a gain of $108 million (before- and after-tax)
from the wind-up of a U.S.-based funding subsidiary that resulted in the release of foreign CTA that was previously booked in OCE,which was recorded in Corporate Support in the second quarter of 2015;
• For the three months ended July 31, 2014, a loss of $40 million (before- and after-tax) related to the closing of the sale of RBCJamaica in our Personal & Commercial Banking segment; and
• For the nine months ended July 31, 2014, a total loss of $100 million (before- and after-tax) related to the sale of RBC Jamaica,comprised of the loss of $40 million (before- and after-tax) noted above recorded in the third quarter of 2014 and a loss of$60 million (before- and after-tax) recorded in the first quarter of 2014, as well as a provision of $40 million ($32 million after-tax)related to post-employment benefits and restructuring charges in the Caribbean, both in our Personal & Commercial Bankingsegment.
The following tables provide calculations of our consolidated and segment results and measures excluding these specified items forthe nine months ended July 31, 2015, the three months ended April 30, 2015, and for the three and nine months ended July 31, 2014:
ConsolidatedFor the three months ended (1)
April 30
2015July 31
2014Item excluded Item excluded
(Millions of Canadian dollars, except per share and percentage amounts) As reported Release of CTA Adjusted As reported (3)
Loss relatedto the
sale of RBCJamaica Adjusted
Continuing operationsTotal revenue $ 8,830 $ (108) $ 8,722 $ 8,990 $ – $ 8,990PCL 282 – 282 283 – 283PBCAE 493 – 493 1,009 – 1,009Non-interest expense 4,736 – 4,736 4,602 (40) 4,562
Net income before income taxes $ 3,319 $ (108) $ 3,211 $ 3,096 $ 40 $ 3,136Income taxes 817 – 817 718 – 718Net income $ 2,502 $ (108) $ 2,394 $ 2,378 $ 40 $ 2,418Net income available to common shareholders $ 2,426 $ (108) $ 2,318 $ 2,297 $ 40 $ 2,337Average number of common shares (thousands) 1,442,078 1,442,078 1,442,312 1,442,312Basic earnings per share (in dollars) $ 1.68 $ (0.07) $ 1.61 $ 1.59 $ 0.03 $ 1.62Average number of diluted common shares (thousands) 1,448,651 1,448,651 1,449,455 1,449,455Diluted earnings per share (in dollars) $ 1.68 $ (0.07) $ 1.61 $ 1.59 $ 0.03 $ 1.62Average common equity $ 51,500 $ 51,500 $ 46,400 $ 46,400ROE (2) 19.3% 18.5% 19.6% 20.0%Efficiency ratio 53.6% 54.3% 51.2% 50.7%Effective tax rate 24.6% 25.4% 23.2% 22.9%
For the nine months ended (1)
July 31
2015July 31
2014Item excluded Item excluded
(Millions of Canadian dollars, except per share andpercentage amounts) As reported Release of CTA Adjusted As reported (3)
Loss relatedto the
sale of RBCJamaica
Provision forpost-employment
benefits andrestructuring
charges Adjusted
Continuing operationsTotal revenue $ 27,302 $ (108) $ 27,194 $ 25,726 $ – $ $ 25,726PCL 822 – 822 819 – 819PBCAE 2,671 – 2,671 2,821 – 2,821Non-interest expense 13,991 – 13,991 13,321 (100) (40) 13,181
Net income before income taxes $ 9,818 $ (108) $ 9,710 $ 8,765 $ 100 $ 40 $ 8,905Income taxes 2,385 – 2,385 2,094 – 8 2,102Net income $ 7,433 $ (108) $ 7,325 $ 6,671 $ 100 $ 32 $ 6,803Net income available to common
shareholders $ 7,219 $ (108) $ 7,111 $ 6,425 $ 100 $ 32 $ 6,557Average number of common shares
(thousands) 1,442,579 1,442,579 1,442,615 1,442,615Basic earnings per share (in dollars) $ 5.00 $ (0.07) $ 4.93 $ 4.45 $ 0.07 $ 0.02 $ 4.54Average number of diluted common
shares (thousands) 1,449,206 1,449,206 1,452,868 1,452,868Diluted earnings per share (in dollars) $ 4.99 $ (0.07) $ 4.92 $ 4.43 $ 0.07 $ 0.02 $ 4.52Average common equity $ 51,100 $ 51,100 $ 45,300 $ 45,300ROE (2) 18.9% 18.6% 19.0% 19.4%Efficiency ratio 51.2% 51.4% 51.8% 51.2%Effective tax rate 24.3% 24.6% 23.9% 23.6%(1) There were no specified items for the three months ended July 31, 2015 or January 31, 2015.(2) ROE is based on actual balances of average common equity before rounding.(3) Amounts have been revised from those previously presented.
Royal Bank of Canada Third Quarter 2015 13
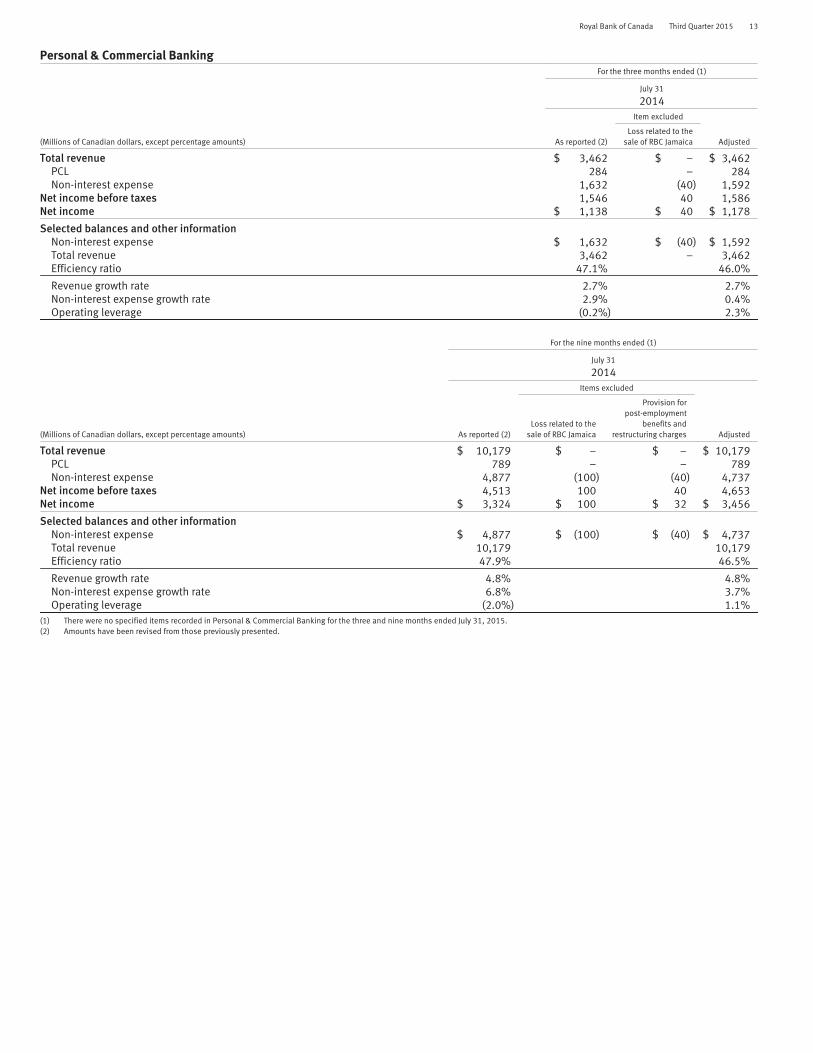
Personal & Commercial BankingFor the three months ended (1)
July 31
2014Item excluded
(Millions of Canadian dollars, except percentage amounts) As reported (2)Loss related to the
sale of RBC Jamaica Adjusted
Total revenue $ 3,462 $ – $ 3,462PCL 284 – 284Non-interest expense 1,632 (40) 1,592
Net income before taxes 1,546 40 1,586Net income $ 1,138 $ 40 $ 1,178
Selected balances and other informationNon-interest expense $ 1,632 $ (40) $ 1,592Total revenue 3,462 – 3,462Efficiency ratio 47.1% 46.0%
Revenue growth rate 2.7% 2.7%Non-interest expense growth rate 2.9% 0.4%Operating leverage (0.2%) 2.3%
For the nine months ended (1)
July 31
2014Items excluded
(Millions of Canadian dollars, except percentage amounts) As reported (2)Loss related to the
sale of RBC Jamaica
Provision forpost-employment
benefits andrestructuring charges Adjusted
Total revenue $ 10,179 $ – $ – $ 10,179PCL 789 – – 789Non-interest expense 4,877 (100) (40) 4,737
Net income before taxes 4,513 100 40 4,653Net income $ 3,324 $ 100 $ 32 $ 3,456
Selected balances and other informationNon-interest expense $ 4,877 $ (100) $ (40) $ 4,737Total revenue 10,179 10,179Efficiency ratio 47.9% 46.5%
Revenue growth rate 4.8% 4.8%Non-interest expense growth rate 6.8% 3.7%Operating leverage (2.0%) 1.1%
(1) There were no specified items recorded in Personal & Commercial Banking for the three and nine months ended July 31, 2015.(2) Amounts have been revised from those previously presented.

14 Royal Bank of Canada Third Quarter 2015
Personal & Commercial Banking
As at or for the three months ended As at or for the nine months ended
(Millions of Canadian dollars, except percentage amounts)
July 31
2015April 30
2015July 31
2014July 31
2015July 31
2014
Net interest income $ 2,543 $ 2,399 $ 2,475 $ 7,435 $ 7,296Non-interest income 1,083 1,073 987 3,229 2,883
Total revenue 3,626 3,472 3,462 10,664 10,179PCL 257 235 284 744 789Non-interest expense 1,648 1,618 1,632 4,894 4,877
Net income before income taxes 1,721 1,619 1,546 5,026 4,513Net income $ 1,281 $ 1,200 $ 1,138 $ 3,736 $ 3,324
Revenue by businessCanadian Banking $ 3,390 $ 3,244 $ 3,252 $ 9,970 $ 9,523Caribbean & U.S. Banking 236 228 210 694 656
Selected balances and other informationROE 30.3% 29.7% 29.4% 30.3% 29.2%NIM (1) 2.72% 2.70% 2.79% 2.71% 2.79%Efficiency ratio (2) 45.4% 46.6% 47.1% 45.9% 47.9%Efficiency ratio adjusted (2), (3) n.a. n.a. 46.0% n.a. 46.5%Operating leverage 3.8% 2.1% (0.2)% 4.4% (2.0)%Operating leverage adjusted (3) 1.2% n.a. 2.3% 1.5% 1.1%Effective income tax rate 25.6% 25.9% 26.4% 25.7% 26.3%Average total earning assets (4) $ 370,700 $ 365,100 $ 352,500 $ 366,200 $ 349,200Average loans and acceptances (4) 369,100 363,800 351,500 364,800 348,500Average deposits 299,200 294,400 279,100 295,800 276,700AUA (5) 227,900 226,700 213,600 227,900 213,600PCL on impaired loans as a % of average net loans and acceptances 0.28% 0.26% 0.32% 0.27% 0.30%
Estimated impact of U.S. dollar and Trinidad & Tobago dollar (TTD) translation on key incomestatement items(Millions of Canadian dollars, except percentage amounts)
For the threemonths ended
For the ninemonths ended
Q3 2015 vs.Q3 2014
Q3 2015 vs.Q2 2015
Q3 2015 vs.Q3 2014
Increase (decrease):Total revenue $ 17 $ 2 $ 50Non-interest expense 11 1 31Net income 4 1 13
Percentage change in average US$ equivalent of C$1.00 (15)% (2)% (12)%Percentage change in average TTD equivalent of C$1.00 (16)% (2)% (13)%(1) NIM is calculated as Net interest income divided by Average total earning assets.(2) Efficiency ratio is calculated as Non-interest expense divided by Total revenue.(3) Measures have been adjusted by excluding the Q3 2014 loss of $40 million related to the closing of RBC Jamaica, and the Q1 2014 loss of $60 million related to the sale of RBC Jamaica and the
provision of $40 million related to post-employment benefits and restructuring charges in the Caribbean. These are non-GAAP measures. For further details, refer to the Key performance andnon-GAAP measures section.
(4) Average total earning assets and average loans and acceptances include average securitized residential mortgages and credit card loans for the three months ended July 31, 2015 of $56.6 billionand $8.4 billion, respectively (April 30, 2015 – $56.7 billion and $7.9 billion; July 31, 2014 – $52.0 billion and $8.3 billion).
(5) AUA represents period-end spot balances and includes securitized residential mortgages and credit card loans as at July 31, 2015 of $21.7 billion and $8.4 billion, respectively (April 30, 2015 –$22.5 billion and $7.9 billion; July 31, 2014 – $23.1 billion and $8.3 billion).
n.a. not applicable
Q3 2015 vs. Q3 2014Net income increased $143 million or 13% compared to last year. Excluding the loss last year of $40 million (before- and after-tax)related to the closing of the sale of RBC Jamaica, net income increased $103 million or 9%, primarily due to solid volume growth andstrong fee-based revenue growth across most businesses in Canada, and higher earnings in the Caribbean. This was partially offset byhigher costs to support business growth and lower spreads.
Total revenue increased $164 million or 5%.Canadian Banking revenue increased $138 million or 4%, reflecting solid volume growth across most businesses and strong fee-
based revenue growth primarily attributable to strong net long-term fund sales and capital appreciation resulting in higher mutualfund distribution fees, and higher cards service and foreign exchange revenue. These factors were partially offset by lower spreads.
Caribbean & U.S. Banking revenue increased $26 million or 12% compared to last year, mainly due to the positive impact offoreign exchange translation. The prior year included revenue from RBC Jamaica.
Net interest margin decreased 7 bps mainly due to the change in the fourth quarter of 2014 in recording of certain loan fees in ourbusiness portfolio from Net interest income to Non-interest income, which reduced net interest margin by 3 bps. The lower interestrate environment and competitive pressures also contributed to the decrease.
PCL decreased $27 million and the PCL ratio decreased 4 bps mainly due to lower provisions in our Caribbean portfolios, partiallyoffset by higher write-offs in our credit card portfolio and higher PCL in our personal lending and residential mortgage portfolios inCanada. For further details, refer to the Credit quality performance section.
Non-interest expense increased $16 million or 1%. Excluding the prior year loss related to the closing of the sale of RBC Jamaica notedabove, non-interest expense increased $56 million or 4% mainly due to higher costs in support of business growth and an increase due tothe impact of foreign exchange translation. These factors were partially offset by continuing benefits from our efficiency managementactivities. The prior year included expenses from RBC Jamaica.
Q3 2015 vs. Q2 2015Net income increased $81 million or 7% from last quarter, reflecting the positive impact of seasonal factors, including additional daysin the quarter, and strong fee-based revenue growth and solid volume growth across most businesses in Canada. These factors were

Royal Bank of Canada Third Quarter 2015 15
partially offset by higher costs to support business growth and higher PCL. The prior quarter included the loss related to the previouslyannounced sale of RBC Suriname.
Net interest margin increased 2 bps. Net interest margin in the prior quarter was unfavourably impacted by a cumulativeaccounting adjustment.
Q3 2015 vs. Q3 2014 (Nine months ended)Net income increased $412 million or 12%. Excluding the loss last year of $100 million (before- and after-tax) related to the sale ofRBC Jamaica and a provision of $40 million ($32 million after-tax) related to post-employment benefits and restructuring charges inthe Caribbean, net income increased $280 million or 8%, largely due to solid volume growth and strong fee-based revenue growthacross most businesses in Canada, as well as higher earnings in the Caribbean, partly offset by higher costs to support businessgrowth and lower spreads.
Total revenue increased $485 million or 5% reflecting solid volume growth across most businesses in Canada and strong fee-based revenue growth primarily attributable to strong net long-term fund sales and capital appreciation resulting in higher mutualfunds distribution fees, and higher cards service revenue. The positive impact of foreign exchange translation and the implementationof full-service pricing in the Caribbean also contributed to the increase. These factors were partly offset by lower spreads. The prioryear included revenue from RBC Jamaica.
PCL decreased $45 million, with the PCL ratio decreasing 3 bps, largely due to lower provisions in our commercial lending andpersonal loans portfolios, partially offset by higher write-offs in our credit card portfolio.
Non-interest expense increased $17 million. Excluding the prior year specified items noted above, non-interest expense was up$157 million or 3%, mostly due to higher infrastructure, marketing, and staff costs to support business growth. Higher non-interestexpense due to the impact of foreign exchange translation and the loss related to the previously announced sale of RBC Suriname asnoted above also contributed to the increase. These factors were partially offset by continuing benefits from our efficiencymanagement activities. The prior year included expenses related to RBC Jamaica.
Results excluding the specified items noted above are non-GAAP measures. For further details, including a reconciliation, refer to theKey performance and non-GAAP measures section.
Canadian BankingAs at or for the three months ended As at or for the nine months ended
(Millions of Canadian dollars, except percentage amounts)
July 31
2015April 30
2015July 31
2014July 31
2015July 31
2014
Net interest income $ 2,381 $ 2,248 $ 2,331 $ 6,970 $ 6,863Non-interest income 1,009 996 921 3,000 2,660
Total revenue 3,390 3,244 3,252 9,970 9,523PCL 238 212 230 684 692Non-interest expense 1,476 1,426 1,426 4,362 4,208
Net income before income taxes 1,676 1,606 1,596 4,924 4,623Net income $ 1,239 $ 1,191 $ 1,185 $ 3,650 $ 3,432
Revenue by businessPersonal Financial Services $ 1,949 $ 1,843 $ 1,857 $ 5,678 $ 5,442Business Financial Services 780 745 771 2,317 2,266Cards and Payment Solutions 661 656 624 1,975 1,815
Selected balances and other informationROE 36.5% 37.1% 37.7% 36.8% 37.4%NIM (1) 2.66% 2.64% 2.73% 2.66% 2.73%Efficiency ratio (2) 43.5% 44.0% 43.8% 43.8% 44.2%Operating leverage 0.7% 2.4% 1.7% 1.0% 1.0%Effective income tax rate 26.1% 25.8% 25.8% 25.9% 25.8%Average total earning assets (3) $ 354,600 $ 349,000 $ 339,000 $ 350,400 $ 336,100Average loans and acceptances (3) 360,300 354,700 344,000 356,000 340,900Average deposits 282,000 277,000 264,100 278,700 261,500AUA (4) 217,700 216,900 204,300 217,700 204,300PCL on impaired loans as a % of average net loans
and acceptances 0.26% 0.25% 0.26% 0.26% 0.27%(1) NIM is calculated as Net interest income divided by Average total earning assets.(2) Efficiency ratio is calculated as Non-interest expense divided by Total revenue.(3) Average total earning assets and average loans and acceptances include average securitized residential mortgages and credit card loans for the three months ended July 31, 2015 of
$56.6 billion and $8.4 billion, respectively (April 30, 2015 – $56.7 billion and $7.9 billion; July 31, 2014 – $52.0 billion and $8.3 billion).(4) AUA represents period-end spot balances and includes securitized residential mortgages and credit card loans as at July 31, 2015 of $21.7 billion and $8.4 billion respectively (April 30,
2015 – $22.5 billion and $7.9 billion; July 31, 2014 – $23.1 billion and $8.3 billion).
Q3 2015 vs. Q3 2014Net income increased $54 million or 5% compared to last year, reflecting solid volume growth and strong fee-based revenue growthacross most businesses, partly offset by lower spreads.
Total revenue increased $138 million or 4% from last year.Personal Financial Services revenue increased $92 million or 5%, largely due to volume growth in personal deposits and
residential mortgages, and higher fee-based revenue primarily attributable to strong net long-term fund sales and capital appreciationresulting in higher mutual fund distribution fees.
Business Financial Services revenue increased $9 million or 1%, as solid volume growth in business deposits and loans waslargely offset by lower spreads.
Cards and Payment Solutions revenue increased $37 million or 6%, mainly due to higher loan balances and transaction volumes.

16 Royal Bank of Canada Third Quarter 2015
Net interest margin decreased 7 bps compared to last year mainly due to the change in the fourth quarter of 2014 in recording ofcertain loan fees, which reduced net interest margin by 3 bps. The lower interest rate environment and competitive pressures alsocontributed to the decrease.
PCL increased $8 million mainly due to higher write-offs in our credit card portfolio and higher PCL in our personal lending andresidential mortgage portfolios. The PCL ratio remained flat.
Non-interest expense increased $50 million or 4%, due to higher costs to support business growth.
Q3 2015 vs. Q2 2015Net income increased $48 million or 4% from last quarter, mainly due to the positive impact of seasonal factors, including additionaldays in the quarter, and strong fee-based revenue growth and solid volume growth across most businesses. These factors werepartially offset by higher costs in support of business growth and higher PCL.
Net interest margin increased 2 bps. Net interest margin in the prior quarter was unfavourably impacted by a cumulativeaccounting adjustment.
Q3 2015 vs. Q3 2014 (Nine months ended)Net income increased $218 million or 6% due to solid volume growth across most businesses and strong fee-based revenue growth,partially offset by higher costs to support business growth and lower spreads.
Total revenue increased $447 million or 5% reflecting solid volume growth across most businesses as well as strong fee-basedrevenue growth primarily attributable to strong net long-term fund sales and capital appreciation resulting in higher mutual funddistribution fees, and higher cards service revenue.
PCL decreased $8 million, with the PCL ratio decreasing 1 bp, mostly due to lower provisions in our commercial lending and smallbusiness portfolios, partially offset by higher write-offs in our credit card portfolio.
Non-interest expense increased $154 million or 4% mainly due to higher infrastructure, marketing, and staff costs to supportbusiness growth.
Wealth Management
As at or for the three months ended As at or for the nine months ended
(Millions of Canadian dollars, except number of and percentage amounts and as otherwise noted)
July 31
2015April 30
2015July 31
2014July 31
2015July 31
2014
Net interest income $ 129 $ 122 $ 117 $ 375 $ 346Non-interest income
Fee-based revenue 1,200 1,166 1,059 3,511 3,073Transactional and other revenue 379 460 409 1,236 1,255
Total revenue 1,708 1,748 1,585 5,122 4,674PCL – 32 – 45 19Non-interest expense 1,302 1,340 1,191 3,975 3,555
Net income before income taxes 406 376 394 1,102 1,100Net income $ 285 $ 271 $ 285 $ 786 $ 798
Revenue by businessCanadian Wealth Management $ 561 $ 564 $ 555 $ 1,664 $ 1,603U.S. & International Wealth Management 691 729 609 2,085 1,800
U.S. & International Wealth Management (US$ millions) 545 591 564 1,693 1,656Global Asset Management (1) 456 455 421 1,373 1,271
Selected balances and other informationROE 18.6% 18.3% 20.3% 17.5% 19.1%Pre-tax margin (2) 23.8% 21.5% 24.9% 21.5% 23.5%Number of advisors (3) 4,044 4,074 4,244 4,044 4,244Average loans and acceptances $ 17,700 $ 17,900 $ 15,900 $ 17,800 $ 15,400Average deposits 40,500 40,600 35,900 40,300 35,600AUA – total (4) 778,400 747,500 700,600 778,400 700,600
– U.S. & International Wealth Management (4) 488,500 459,400 419,500 488,500 419,500– U.S. & International Wealth Management (US$ millions) (4) 373,900 381,500 384,400 373,900 384,400
AUM (4) 503,200 481,100 442,100 503,200 442,100Average AUA 764,700 767,000 694,600 758,200 682,600Average AUM 496,200 485,700 436,200 482,600 420,600
Estimated impact of U.S. dollar, British pound and Euro translation on key income statement items(Millions of Canadian dollars, except percentage amounts and as otherwise noted)
For the threemonths ended
For the ninemonths ended
Q3 2015 vs.Q3 2014
Q3 2015 vs.Q2 2015
Q3 2015 vs.Q3 2014
Increase (decrease):Total revenue $ 88 $ 19 $ 202Non-interest expense 75 16 175Net income 8 2 13
Percentage change in average US$ equivalent of C$1.00 (15)% (2)% (12)%Percentage change in average British pound equivalent of C$1.00 (7)% (4)% (4)%Percentage change in average Euro equivalent of C$1.00 5% (2)% 6%(1) Effective the first quarter of 2014, BlueBay results are no longer reported on a one-month lag. As a result, the first quarter of 2014 included four months of results from BlueBay.(2) Pre-tax margin is defined as net income before income taxes divided by Total revenue.(3) Represents client-facing advisors across all our wealth management businesses.(4) Represents period-end spot balances.

Royal Bank of Canada Third Quarter 2015 17
Q3 2015 vs. Q3 2014Net income of $285 million was flat from a year ago, as higher earnings from growth in average fee-based client assets was offset bylower transaction volumes and the change in fair value of our U.S. share-based compensation plan.
Total revenue increased $123 million or 8%, including the positive impact of foreign exchange translation of $88 million.Canadian Wealth Management revenue increased $6 million or 1%, mainly due to growth in average fee-based client assets
resulting from net sales and capital appreciation, largely offset by lower transaction volumes reflecting uncertain market conditions.U.S. & International Wealth Management revenue increased $82 million or 13%. In U.S. dollars, revenue decreased $19 million,
mainly due to lower transaction volumes reflecting uncertain market conditions, and the change in fair value of our U.S. share-basedcompensation plan.
Global Asset Management revenue increased $35 million or 8%, mainly due to growth in average fee-based client assetsresulting from capital appreciation and net sales.
Non-interest expense increased $111 million or 9%, mainly reflecting an increase due to the impact of foreign exchangetranslation, higher costs to support business growth in Canadian Wealth Management and Global Asset Management, and additionalrestructuring costs of $5 million ($4 million after-tax) related to our U.S. & International Wealth Management business.
Q3 2015 vs. Q2 2015Net income of $285 million increased $14 million or 5% from the prior quarter mainly due to lower PCL, lower restructuring costsrelated to our U.S. & International Wealth Management business and higher earnings from growth in average fee-based client assets.These factors were partially offset by lower transaction volumes.
Q3 2015 vs. Q3 2014 (Nine months ended)Net income of $786 million decreased $12 million, mainly due to restructuring costs of $76 million ($53 million after-tax), lowertransaction volumes, the change in fair value of our U.S. share-based compensation plan and higher PCL. These factors were mostlyoffset by higher earnings from growth in average fee-based client assets.
Total revenue increased $448 million or 10%, mainly due to growth in average fee-based client assets resulting from capitalappreciation and net sales, and the positive impact of foreign exchange translation. These factors were partially offset by lowertransaction volumes.
PCL increased $26 million mainly due to provisions on a couple of accounts related to our U.S. & International WealthManagement business.
Non-interest expense increased $420 million or 12%, mainly reflecting an increase due to the impact of foreign exchangetranslation, higher staff costs and infrastructure investments to support business growth in Canadian Wealth Management and GlobalAsset Management, the restructuring costs as noted above, and higher variable compensation driven by higher revenue.
Insurance
As at or for the three months ended As at or for the nine months ended
(Millions of Canadian dollars, except percentage amounts)
July 31
2015April 30
2015July 31
2014July 31
2015July 31
2014
Non-interest incomeNet earned premiums $ 843 $ 829 $ 923 $ 2,574 $ 2,802Investment income (1) 52 (164) 381 788 779Fee income 126 141 79 357 209
Total revenue 1,021 806 1,383 3,719 3,790Insurance policyholder benefits and claims (1) 610 446 925 2,504 2,537Insurance policyholder acquisition expense 46 47 84 167 284Non-interest expense 153 156 143 455 430
Net income before income taxes 212 157 231 593 539Net income $ 173 $ 123 $ 214 $ 481 $ 525
Revenue by businessCanadian Insurance $ 603 $ 337 $ 871 $ 2,430 $ 2,265International Insurance 418 469 512 1,289 1,525
Selected balances and other informationROE 43.6% 33.0% 53.2% 41.1% 45.5%Premiums and deposits (2) $ 1,252 $ 1,217 $ 1,310 $ 3,707 $ 3,846Fair value changes on investments backing policyholder liabilities (1) (37) (300) 255 438 396
(1) Investment income can experience volatility arising from fluctuation of fair value through profit or loss (FVTPL) assets. The investments which support actuarial liabilities are predominantly fixedincome assets designated as at FVTPL. Consequently, changes in the fair values of these assets are recorded in investment income in the consolidated statement of income and are largely offset bychanges in the fair value of the actuarial liabilities, the impact of which is reflected in insurance policyholder benefits and claims.
(2) Premiums and deposits include premiums on risk-based insurance and annuity products, and individual and group segregated fund deposits, consistent with insurance industry practices.
Q3 2015 vs. Q3 2014Net income decreased $41 million or 19% from a year ago, mainly due to a change in Canadian tax legislation impacting certainforeign affiliates which became effective November 1, 2014 and higher net claims costs in our life retrocession business. In addition,prior year results were impacted by favourable actuarial adjustments reflecting management actions and assumption changes. Thesefactors were partially offset by higher earnings from a new U.K. annuity contract and a favourable impact of investment-relatedactivities on the Canadian life business.

18 Royal Bank of Canada Third Quarter 2015
Canadian Insurance revenue decreased $268 million or 31%, mainly due to the negative change in fair value of investmentsbacking our policyholder liabilities resulting from the increase in long-term interest rates, largely offset in PBCAE. This factor waspartially offset by business growth in our life, home and auto insurance businesses.
International Insurance revenue decreased $94 million or 18%, mainly due to a reduction of revenue related to our retrocessioncontracts, largely offset in PBCAE. This factor was partially offset by business growth including revenue from the new U.K. annuitycontract.
PBCAE decreased $353 million or 35%, mainly due to the negative change in fair value of our investments backing ourpolicyholder liabilities, and a reduction of PBCAE related to our retrocession contracts, which were largely offset in revenue. Thesefactors were partially offset by business growth, including a new U.K. annuity contract, and higher claims costs as noted above.
Non-interest expense increased $10 million or 7%, primarily due to higher costs to support business growth.
Q3 2015 vs. Q2 2015Net income increased $50 million or 41% from the prior quarter mainly due to lower net claims costs, largely in our life retrocessionbusiness, a favourable impact of investment-related activities on the Canadian life business, and higher earnings from a new U.K.annuity contract.
Q3 2015 vs. Q3 2014 (Nine months ended)Net income decreased $44 million or 8%, mainly due to a change in Canadian tax legislation impacting certain foreign affiliates asnoted above. In addition, prior year results were impacted by favourable actuarial adjustments as noted above. Higher net claimscosts mainly in our International insurance business also contributed to the decrease. These factors were partially offset by higherearnings from new U.K. annuity contracts.
Total revenue decreased $71 million or 2%, mainly due to a reduction of revenue related to our retrocession contracts, largelyoffset in PBCAE. This factor was partially offset by business growth in International and Canadian Insurance, including higher revenuefrom new U.K. annuity contracts, and the positive change in fair value of investments backing our policyholder liabilities, largely offsetin PBCAE.
PBCAE decreased $150 million or 5%, mainly due to a reduction of PBCAE related to our retrocession contracts, which werelargely offset in revenue, and lower claims costs in Canadian Insurance. These factors were partially offset by business growth inInternational Insurance, including new U.K. annuity contracts, and the positive change in fair value of investments backing ourpolicyholder liabilities, largely offset in revenue. In addition, prior year results were impacted by favourable actuarial adjustments asnoted above.
Non-interest expense increased $25 million or 6%, mainly due to higher staff costs to support business growth in CanadianInsurance.
Investor & Treasury Services
As at or for the three months ended As at or for the nine months ended
(Millions of Canadian dollars, except percentage amounts)
July 31
2015April 30
2015July 31
2014July 31
2015July 31
2014
Net interest income $ 204 $ 198 $ 182 $ 598 $ 549Non-interest income 352 330 298 992 859
Total revenue (1) 556 528 480 1,590 1,408Non-interest expense 331 312 330 958 965
Net income before income taxes 225 216 150 632 443Net income $ 167 $ 159 $ 110 $ 468 $ 328
Selected balances and other informationROE 24.5% 24.2% 20.1% 24.2% 20.0%Average deposits $ 144,200 $ 136,200 $ 110,200 $ 136,200 $ 111,900
Client deposits 52,000 48,800 42,700 48,300 41,900Wholesale funding deposits 92,200 87,400 67,500 87,900 70,000
AUA (2) 3,990,900 3,846,900 3,546,100 3,990,900 3,546,100Average AUA 3,924,300 3,798,500 3,481,977 3,796,100 3,429,000
Estimated impact of U.S. dollar, British pound and Euro translation on key income statement items(Millions of Canadian dollars, except percentage amounts)
For the threemonths ended
For the ninemonths ended
Q3 2015 vs.Q3 2014
Q3 2015 vs.Q2 2015
Q3 2015 vs.Q3 2014
Increase (decrease):Total revenue $ (2) $ 5 $ (17)Non-interest expense (5) 4 (19)Net income 2 0 0
Percentage change in average US$ equivalent of C$1.00 (15)% (2)% (12)%Percentage change in average British pound equivalent of C$1.00 (7)% (4)% (4)%Percentage change in average Euro equivalent of C$1.00 5% (2)% 6%
(1) Effective the third quarter of 2015, we have aligned the reporting period of Investor Services, which resulted in an additional month of earnings being included in the third quarter of 2015. The netimpact of the additional month was recorded in revenue.
(2) Represents period-end spot balances.

Royal Bank of Canada Third Quarter 2015 19
Q3 2015 vs. Q3 2014Net income increased $57 million or 52%, primarily due to an additional month of earnings in Investor Services of $42 million($28 million after-tax), higher earnings from our foreign exchange businesses, and increased custodial fees. These factors werepartially offset by lower funding and liquidity earnings.
Total revenue increased $76 million or 16%, mainly related to the impact of an additional month in Investor Services as notedabove, higher revenue from our foreign exchange businesses reflecting increased client activity mainly due to market volatility, andhigher custodial fees. These factors were partially offset by lower funding and liquidity revenue as the prior year benefitted fromtighter credit spreads.
Non-interest expense increased $1 million, largely reflecting continuing benefits from our efficiency management activities.
Q3 2015 vs. Q2 2015Net income increased $8 million or 5%, primarily related to an additional month of earnings in Investor Services as noted above,partially offset by lower funding and liquidity earnings driven by widening credit spreads.
Q3 2015 vs. Q3 2014 (Nine months ended)Net income increased $140 million or 43%, driven by higher earnings from our foreign exchange businesses, an additional month ofearnings in Investor Services as noted above, and increased custodial fees.
Total revenue increased $182 million or 13%, mainly due to higher revenue from our foreign exchange businesses reflectingincreased client activity primarily due to market volatility, an additional month in Investor Services as noted above, and highercustodial fees.
Non-interest expense decreased $7 million, mainly due to continuing benefits from our efficiency management activities.
Capital Markets
(Millions of Canadian dollars, except percentage amounts)
As at or for the three months ended As at or for the nine months ended
July 31
2015April 30
2015July 31
2014July 31
2015July 31
2014
Net interest income (1) $ 1,016 $ 940 $ 999 $ 2,872 $ 2,608Non-interest income 1,030 1,307 1,186 3,454 3,259
Total revenue (1) 2,046 2,247 2,185 6,326 5,867PCL 15 15 1 35 12Non-interest expense 1,187 1,280 1,269 3,624 3,445
Net income before income taxes 844 952 915 2,667 2,410Net income $ 545 $ 625 $ 641 $ 1,764 $ 1,653
Revenue by business (2)
Corporate and Investment Banking $ 1,006 $ 958 $ 965 $ 2,850 $ 2,591Global Markets 1,070 1,323 1,184 3,542 3,175Other (30) (34) 36 (66) 101
Selected balances and other informationROE 12.9% 14.9% 16.9% 14.1% 15.3%Average total assets $ 465,200 $ 465,400 $ 391,500 $ 469,600 $ 384,000Average trading securities 116,100 118,800 103,200 117,700 103,300Average loans and acceptances 81,300 77,700 66,300 77,600 63,600Average deposits 62,700 60,000 49,000 59,300 46,300PCL on impaired loans as a % of average net loans and acceptances 0.07% 0.08% 0.01% 0.06% 0.02%
Estimated impact of U.S. dollar, British pound and Euro translation on key income statement items(Millions of Canadian dollars, except percentage amounts and as otherwise noted)
For the threemonths ended
For the ninemonths ended
Q3 2015 vs.Q3 2014
Q3 2015 vs.Q2 2015
Q3 2015 vs.Q3 2014
Increase (decrease):Total revenue $ 174 $ 24 $ 434Non-interest expense 114 21 252Net income 37 1 112
Percentage change in average US$ equivalent of C$1.00 (15)% (2)% (12)%Percentage change in average British pound equivalent of C$1.00 (7)% (4)% (4)%Percentage change in average Euro equivalent of C$1.00 5% (2)% 6%(1) The taxable equivalent basis (teb) adjustment for the three months ended July 31, 2015 was $133 million (April 30, 2015 – $115 million, July 31, 2014 – $174 million) and for the nine months
ended July 31, 2015 was $357 million (July 31, 2014 – $391 million). For further discussion, refer to the How we measure and report our business segments section of our 2014 Annual Report.(2) Effective the first quarter of 2015, we reclassified amounts from Global Markets to Other related to certain proprietary trading strategies which we exited in the fourth quarter of 2014 to comply with
the Volcker Rule. Prior period amounts have been revised from those previously presented.
Q3 2015 vs. Q3 2014Net income decreased $96 million or 15% as compared to very strong results last year, driven by lower trading results due to lessfavourable market conditions as compared to the strong levels last year. A higher effective tax rate reflecting increased earnings inhigher tax jurisdictions also contributed to the decrease, partially offset by lower variable compensation, the positive impact offoreign exchange translation, and growth in our corporate and investment banking businesses.
Total revenue decreased $139 million or 6%, which included the positive impact of foreign exchange translation.

20 Royal Bank of Canada Third Quarter 2015
Corporate and Investment Banking revenue increased $41 million or 4%, which included the positive impact of foreign exchangetranslation, largely due to strong growth in M&A activity in the U.S. and Europe, and higher lending and debt origination activitymainly in the U.S. These factors were partially offset by lower equity origination in the U.S. and Canada as compared to robust levelslast year.
Global Markets revenue decreased $114 million or 10%, primarily due to lower trading revenue as noted above. Lower equityorigination in Canada and the U.S. as compared to robust levels last year also contributed to the decrease. These factors werepartially offset by the positive impact of foreign exchange translation, and higher debt origination activity in the U.S. and Canada.
Other revenue decreased $66 million, mainly due to lower revenue in certain legacy portfolios.PCL of $15 million increased $14 million, primarily due to provisions taken on a single account. For further details, refer to the
Credit quality performance section.Non-interest expense decreased $82 million or 6%, largely due to lower variable compensation, and lower litigation provisions
and related legal costs, partially offset by an increase due to the impact of foreign exchange translation.
Q3 2015 vs. Q2 2015Net income decreased $80 million or 13%, primarily due to lower trading results reflecting less favourable market conditions, andlower origination activity as compared to the strong levels last quarter. These factors were partially offset by lower variablecompensation and higher M&A activity in Europe and the U.S.
Q3 2015 vs. Q3 2014 (Nine months ended)Net income increased $111 million or 7%, driven by strong business growth, reflecting our continued focus on origination andlending, higher trading results, and the positive impact of foreign exchange translation. These factors were partially offset by highercosts to support business growth, and a higher effective tax rate reflecting increased earnings in higher tax jurisdictions, largely in theU.S.
Total revenue increased $459 million or 8%, mainly due to the positive impact of foreign exchange translation, strong growth indebt origination reflecting increased issuance activity in the U.S., growth in lending largely in the U.S. and Europe, and higher M&Aactivity. Higher trading revenue reflecting increased client activity and more favourable market conditions in the first half of the yearalso contributed to the increase. These factors were partially offset by lower equity origination activity across all regions as comparedto the strong levels in the prior year.
PCL of $35 million increased $23 million from the prior year, primarily due to provisions taken on a few accounts.Non-interest expense increased $179 million or 5%, largely reflecting an increase due to the impact of foreign exchange
translation, and higher costs to support business growth. These factors were partially offset by lower litigation provisions and relatedlegal costs, and lower variable compensation.
Corporate Support
As at or for the three months ended As at or for the nine months ended
(Millions of Canadian dollars)
July 31
2015April 30
2015July 31
2014July 31
2015July 31
2014
Net interest income (loss) (1) $ (109) $ (102) $ (126) $ (309) $ (243)Non-interest income (loss) (20) 131 21 190 51
Total revenue (1) (129) 29 (105) (119) (192)PCL (2) – (2) (1) (1)Non-interest expense 14 30 37 84 49
Net income (loss) before income taxes (1) (141) (1) (140) (202) (240)Income taxes (recoveries) (1) (165) (125) (130) (400) (283)
Net income (2) $ 24 $ 124 $ (10) $ 198 $ 43
(1) Teb adjusted.(2) Net income reflects income attributable to both shareholders and Non-Controlling Interests (NCI). Net income attributable to NCI for the three months ended July 31, 2015 was $24 million (April 30,
2015 – $22 million; July 31, 2014 – $23 million), and for the nine months ended July 31, 2015 was $69 million (July 31, 2014 – $69 million).
Due to the nature of activities and consolidation adjustments reported in this segment, we believe that a comparative period analysisis not relevant. The following identifies material items affecting the reported results in each period.
Net interest income (loss) and income taxes (recoveries) in each period in Corporate Support include the deduction of the tebadjustments related to the gross-up of income from Canadian taxable corporate dividends recorded in Capital Markets. The amountdeducted from net interest income (loss) was offset by an equivalent increase in income taxes (recoveries). The teb amount for thethree months ended July 31, 2015 was $133 million as compared to $115 million in the prior quarter and $174 million last year. Forthe nine months ended July 31, 2015, the amount was $357 million as compared to $391 million in the prior year. For furtherdiscussion, refer to the How we measure and report our business segments section of our 2014 Annual Report.
In addition to the teb impacts noted above, the following identifies the other material items affecting the reported results in eachperiod.
Q3 2015Net income was $24 million, largely reflecting asset/liability management activities.
Q2 2015Net income was $124 million, largely reflecting a gain of $108 million (before- and after-tax) from the wind-up of a U.S.-based fundingsubsidiary that resulted in the release of CTA that was previously booked in OCE, and asset/liability management activities.

Royal Bank of Canada Third Quarter 2015 21
Q3 2014Net loss was $10 million largely reflecting net unfavourable tax adjustments, mostly offset by asset/liability management activities.
Q3 2015 (Nine months ended)Net income was $198 million, largely reflecting the gain of $108 million through the release of CTA as noted above, a gain on sale of areal estate asset in Q1 2015 and asset/liability management activities.
Q3 2014 (Nine months ended)Net income was $43 million, largely reflecting asset/liability management activities and gains on private equity investments, partiallyoffset by net unfavourable tax adjustments.
Results by geographic segment (1)
For geographic reporting, our segments are grouped into the following: Canada, U.S., and Other International. Transactions areprimarily recorded in the location that best reflects the risk due to negative changes in economic conditions and prospects for growthdue to positive economic changes. The following table summarizes our financial results by geographic region.
For the three months ended For the nine months ended
July 31
2015April 30
2015 (2)
July 31
2014 (2)
July 31
2015July 31
2014 (2)
(Millions ofCanadian dollars) Canada U.S.
OtherInternational Canada U.S.
OtherInternational Canada U.S.
OtherInternational Canada U.S.
OtherInternational Canada U.S.
OtherInternational
Total revenue $ 5,546 $ 1,679 $ 1,603 $ 5,304 $ 1,848 $ 1,678 $ 5,624 $ 1,641 $ 1,725 $ 17,261 $ 5,186 $ 4,855 $ 16,089 $ 4,654 $ 4,983
Net income $ 1,868 $ 254 $ 353 $ 1,866 $ 321 $ 315 $ 1,764 $ 295 $ 319 $ 5,545 $ 851 $ 1,037 $ 4,952 $ 837 $ 882
(1) For further details, refer to Note 30 of our audited 2014 Annual Consolidated Financial Statements.(2) Amounts have been revised from those previously presented.
Q3 2015 vs. Q3 2014Net income in Canada was up $104 million or 6% from the prior year, mainly due to solid volume growth and strong fee-basedrevenue growth across most businesses in Canadian Banking, and higher earnings in Investor & Treasury Services. These factors werepartially offset by lower trading results due to less favourable market conditions and lower equity origination activity as compared tothe strong levels last year, higher costs in support of business growth, and lower spreads.
U.S. net income decreased $41 million or 14% compared to last year, primarily due to lower trading results as a result of lessfavourable market conditions and lower equity origination activity as compared to strong levels last year, partially offset by stronggrowth in M&A activity and the positive impact of foreign exchange translation.
Other International net income was up $34 million or 11% from the prior year. The positive impact of foreign exchangetranslation, lower provisions in our Caribbean portfolios, and higher M&A activity, were largely offset by lower trading results. Inaddition, our prior year results were unfavourably impacted by the loss of $40 million (before- and after-tax) related to the closing ofthe sale of RBC Jamaica.
Q3 2015 vs. Q2 2015Net income in Canada was up $2 million from the prior quarter, due to the positive impact of seasonal factors, including additionaldays in the quarter, and strong fee-based revenue growth and solid volume growth across most businesses in Canadian Banking. Inaddition, our prior quarter results were favourably impacted by a gain of $108 million (before- and after-tax) from the wind-up of aU.S.-based funding subsidiary that resulted in the release of CTA that was previously booked in OCE, which was recorded in CorporateSupport.
U.S. net income decreased $67 million or 21% from the prior quarter, primarily due to lower trading results as noted above,partially offset by higher M&A activity.
Other International net income was up $38 million or 12% from the prior quarter, mainly due to higher earnings from a new U.K.annuity contract. In addition, our results in the prior quarter were unfavourably impacted by the loss related to the announced sale ofRBC Suriname.
Q3 2015 vs. Q3 2014 (Nine months ended)Net income in Canada was up $593 million or 12% from the prior year, mainly due solid volume growth and strong fee-based revenuegrowth across most businesses in Canadian Banking, and higher earnings in our Investor & Treasury Services businesses. The gainrecorded in Corporate Support through the release of CTA as noted above also contributed to the increase. These factors were partiallyoffset by higher costs in support of business growth and lower spreads.
U.S. net income was up $14 million or 2% from the prior year including the positive impact of foreign exchange translation,primarily due to strong business growth in Capital Markets, reflecting our continued focus on origination and lending, and highertrading results. This factor was partially offset by higher restructuring costs related to our U.S. & International Wealth Managementbusiness, a higher effective tax rate in Capital Markets, and higher PCL in Wealth Management.
Other International net income was up $155 million or 18% as the prior year was unfavourably impacted by a loss of $100 million(before- and after-tax) related to the sale of RBC Jamaica, a provision of $40 million ($32 million after-tax) related to post-employmentbenefits and restructuring charges in the Caribbean, and lower PCL.

22 Royal Bank of Canada Third Quarter 2015
Quarterly results and trend analysis
Our quarterly results are impacted by a number of trends and recurring factors, which include seasonality of certain businesses,general economic and market conditions, and fluctuations in the Canadian dollar relative to other currencies. The following tablesummarizes our results for the last eight quarters (the period):
Quarterly results (1)
2015 2014 2013
(Millions of Canadian dollars, except per share and percentage amounts) Q3 Q2 Q1 Q4 Q3 Q2 Q1 Q4
Net interest income $ 3,783 $ 3,557 $ 3,631 $ 3,560 $ 3,647 $ 3,449 $ 3,460 $ 3,351Non-interest income 5,045 5,273 6,013 4,822 5,343 4,827 5,000 4,568
Total revenue $ 8,828 $ 8,830 $ 9,644 $ 8,382 $ 8,990 $ 8,276 $ 8,460 $ 7,919PCL 270 282 270 345 283 244 292 334PBCAE 656 493 1,522 752 1,009 830 982 878Non-interest expense 4,635 4,736 4,620 4,340 4,602 4,332 4,387 4,151
Net income before income taxes $ 3,267 $ 3,319 $ 3,232 $ 2,945 $ 3,096 $ 2,870 $ 2,799 $ 2,556Income taxes 792 817 776 612 718 669 707 455
Net income $ 2,475 $ 2,502 $ 2,456 $ 2,333 $ 2,378 $ 2,201 $ 2,092 $ 2,101
EPS – basic $ 1.66 $ 1.68 $ 1.66 $ 1.57 $ 1.59 $ 1.47 $ 1.39 $ 1.40– diluted 1.66 1.68 1.65 1.57 1.59 1.47 1.38 1.39
Segments – net income (loss)Personal & Commercial Banking $ 1,281 $ 1,200 $ 1,255 $ 1,151 $ 1,138 $ 1,115 $ 1,071 $ 1,070Wealth Management 285 271 230 285 285 278 235 202Insurance 173 123 185 256 214 154 157 107Investor & Treasury Services 167 159 142 113 110 112 106 91Capital Markets 545 625 594 402 641 507 505 469Corporate Support 24 124 50 126 (10) 35 18 162
Net income $ 2,475 $ 2,502 $ 2,456 $ 2,333 $ 2,378 $ 2,201 $ 2,092 $ 2,101
Effective income tax rate 24.2% 24.6% 24.0% 20.8% 23.2% 23.3% 25.3% 17.8%Period average US$ equivalent of C$1.00 $ 0.789 $ 0.806 $ 0.839 $ 0.900 $ 0.925 $ 0.907 $ 0.926 $ 0.960
(1) Fluctuations in the Canadian dollar relative to other foreign currencies have affected our consolidated results over the period.
Specified items affecting our consolidated results• In the second quarter of 2015, our results included a gain of $108 million (before- and after-tax) from the wind-up of a U.S.-based
funding subsidiary that resulted in the release of CTA that was previously booked in OCE.• In the third quarter of 2014, our results included a loss of $40 million (before- and after-tax) which includes foreign currency
translation related to the closing of the sale of RBC Jamaica.• In the first quarter of 2014, our results included a loss of $60 million (before- and after-tax) related to the announced sale of RBC
Jamaica, as well as a provision of $40 million ($32 million after-tax) related to post-employment benefits and restructuring chargesin the Caribbean.
• In the fourth quarter of 2013, our results included a charge of $160 million ($118 million after-tax) as a result of tax legislation inCanada, which affects policyholders’ tax treatment of certain individual life insurance policies, as well as net favourable income taxadjustments, including a $124 million income tax adjustment related to prior years.
Trend analysisThe Canadian and U.S. economies have generally improved over the period, reflecting solid consumer spending, stronger labourmarkets and firm housing market activity. Since the third quarter of 2014, growth in Canada has moderated with growth contracting inthe first two calendar quarters of 2015 due to the sharp decline in global oil prices, and weak export activity. Global equity indicesexperienced volatility throughout the period resulting from geopolitical uncertainty, the possibility of Euro area recession, and thelower global oil prices. For further details, refer to the Economic and market review and outlook section.
Earnings have generally trended upwards over the period, driven by solid volume growth and higher fee-based revenue growth inour Canadian Banking businesses and higher earnings from growth in average-fee based client assets reflecting capital appreciationand strong net sales in Wealth Management. Capital Markets results have generally trended upwards since the fourth quarter of 2013,and were negatively impacted in the fourth quarter of 2014 by the exit of certain proprietary trading strategies to comply with theVolcker Rule and the implementation of valuation adjustments related to funding costs on uncollateralized OTC derivatives. Results inour Insurance segment have fluctuated over the period, as the fourth quarter of 2013 was impacted by an unfavourable chargeresulting from tax legislation in Canada as noted above, while results in 2015 were impacted by an unfavourable change in Canadiantax legislation impacting certain foreign affiliates, which became effective November 1, 2014. Investor & Treasury Services resultshave generally trended upwards over the period largely due to benefits from our efficiency management activities, and strong growthin our foreign exchange businesses reflecting favourable market conditions since the first quarter of 2015. In addition, Investor &Treasury Services results in the third quarter of 2015 benefited from an additional month of earnings as a result of aligning reportingperiods.
Revenue generally trended upwards over the period, mostly due to solid volume growth and higher fee-based revenue growth inour Canadian Banking businesses, and growth in average fee-based client assets in Wealth Management. Trading revenue hasgenerally trended upwards since the fourth quarter of 2013, and was unfavourably impacted in the fourth quarter of 2014 by the exit
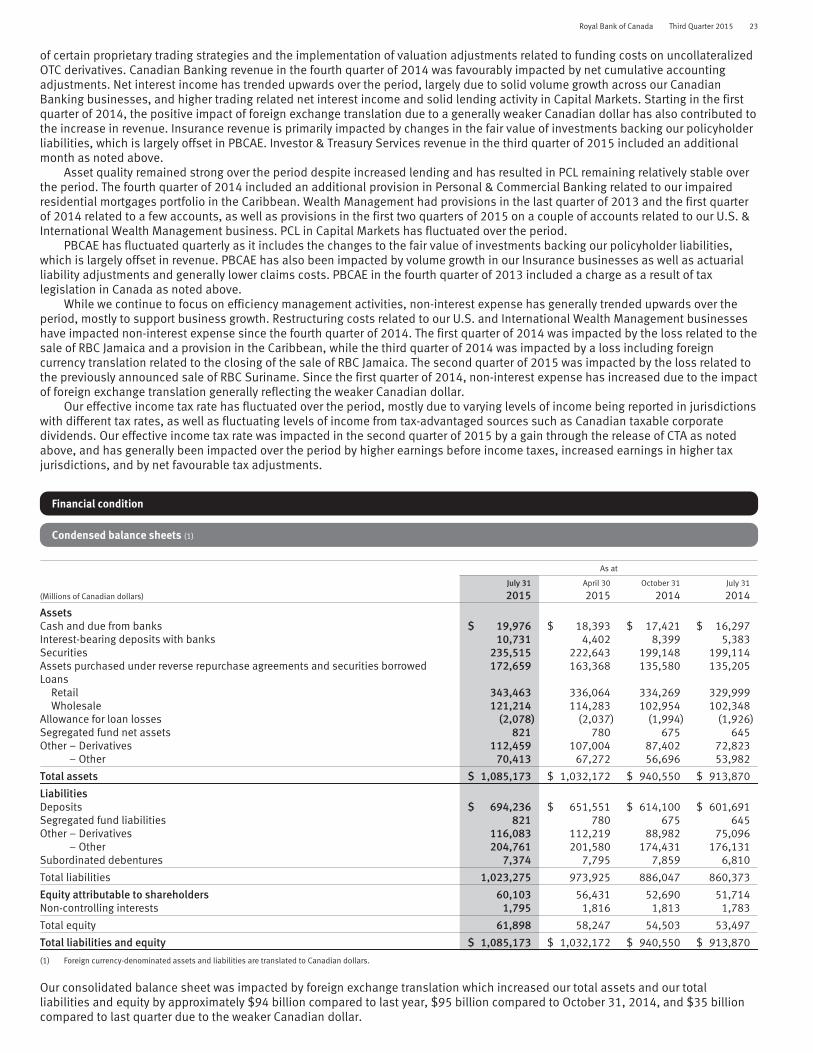
Royal Bank of Canada Third Quarter 2015 23
of certain proprietary trading strategies and the implementation of valuation adjustments related to funding costs on uncollateralizedOTC derivatives. Canadian Banking revenue in the fourth quarter of 2014 was favourably impacted by net cumulative accountingadjustments. Net interest income has trended upwards over the period, largely due to solid volume growth across our CanadianBanking businesses, and higher trading related net interest income and solid lending activity in Capital Markets. Starting in the firstquarter of 2014, the positive impact of foreign exchange translation due to a generally weaker Canadian dollar has also contributed tothe increase in revenue. Insurance revenue is primarily impacted by changes in the fair value of investments backing our policyholderliabilities, which is largely offset in PBCAE. Investor & Treasury Services revenue in the third quarter of 2015 included an additionalmonth as noted above.
Asset quality remained strong over the period despite increased lending and has resulted in PCL remaining relatively stable overthe period. The fourth quarter of 2014 included an additional provision in Personal & Commercial Banking related to our impairedresidential mortgages portfolio in the Caribbean. Wealth Management had provisions in the last quarter of 2013 and the first quarterof 2014 related to a few accounts, as well as provisions in the first two quarters of 2015 on a couple of accounts related to our U.S. &International Wealth Management business. PCL in Capital Markets has fluctuated over the period.
PBCAE has fluctuated quarterly as it includes the changes to the fair value of investments backing our policyholder liabilities,which is largely offset in revenue. PBCAE has also been impacted by volume growth in our Insurance businesses as well as actuarialliability adjustments and generally lower claims costs. PBCAE in the fourth quarter of 2013 included a charge as a result of taxlegislation in Canada as noted above.
While we continue to focus on efficiency management activities, non-interest expense has generally trended upwards over theperiod, mostly to support business growth. Restructuring costs related to our U.S. and International Wealth Management businesseshave impacted non-interest expense since the fourth quarter of 2014. The first quarter of 2014 was impacted by the loss related to thesale of RBC Jamaica and a provision in the Caribbean, while the third quarter of 2014 was impacted by a loss including foreigncurrency translation related to the closing of the sale of RBC Jamaica. The second quarter of 2015 was impacted by the loss related tothe previously announced sale of RBC Suriname. Since the first quarter of 2014, non-interest expense has increased due to the impactof foreign exchange translation generally reflecting the weaker Canadian dollar.
Our effective income tax rate has fluctuated over the period, mostly due to varying levels of income being reported in jurisdictionswith different tax rates, as well as fluctuating levels of income from tax-advantaged sources such as Canadian taxable corporatedividends. Our effective income tax rate was impacted in the second quarter of 2015 by a gain through the release of CTA as notedabove, and has generally been impacted over the period by higher earnings before income taxes, increased earnings in higher taxjurisdictions, and by net favourable tax adjustments.
Financial condition
Condensed balance sheets (1)
As at
(Millions of Canadian dollars)
July 31
2015April 30
2015October 31
2014July 31
2014
AssetsCash and due from banks $ 19,976 $ 18,393 $ 17,421 $ 16,297Interest-bearing deposits with banks 10,731 4,402 8,399 5,383Securities 235,515 222,643 199,148 199,114Assets purchased under reverse repurchase agreements and securities borrowed 172,659 163,368 135,580 135,205Loans
Retail 343,463 336,064 334,269 329,999Wholesale 121,214 114,283 102,954 102,348
Allowance for loan losses (2,078) (2,037) (1,994) (1,926)Segregated fund net assets 821 780 675 645Other – Derivatives 112,459 107,004 87,402 72,823
– Other 70,413 67,272 56,696 53,982
Total assets $ 1,085,173 $ 1,032,172 $ 940,550 $ 913,870
LiabilitiesDeposits $ 694,236 $ 651,551 $ 614,100 $ 601,691Segregated fund liabilities 821 780 675 645Other – Derivatives 116,083 112,219 88,982 75,096
– Other 204,761 201,580 174,431 176,131Subordinated debentures 7,374 7,795 7,859 6,810
Total liabilities 1,023,275 973,925 886,047 860,373
Equity attributable to shareholders 60,103 56,431 52,690 51,714Non-controlling interests 1,795 1,816 1,813 1,783
Total equity 61,898 58,247 54,503 53,497
Total liabilities and equity $ 1,085,173 $ 1,032,172 $ 940,550 $ 913,870
(1) Foreign currency-denominated assets and liabilities are translated to Canadian dollars.
Our consolidated balance sheet was impacted by foreign exchange translation which increased our total assets and our totalliabilities and equity by approximately $94 billion compared to last year, $95 billion compared to October 31, 2014, and $35 billioncompared to last quarter due to the weaker Canadian dollar.

24 Royal Bank of Canada Third Quarter 2015
Q3 2015 vs. Q3 2014Total assets were up $171 billion or 19% from last year, including an increase due to the impact of foreign exchange translation asnoted above.
Interest-bearing deposits with banks increased $5 billion, largely reflecting higher deposits with central banks.Securities were up $36 billion or 18% compared to last year, primarily reflecting an increase due to the impact of foreign
exchange translation, and higher government and corporate debt securities largely as a result of our management of liquidity andfunding risk and increased client activity.
Assets purchased under reverse repurchase agreements (reverse repos) and securities borrowed increased $37 billion or 28%,mainly attributable to an increase due to the impact of foreign exchange translation and increased client and business activities.
Loans were up $32 billion or 7%, predominantly due to solid volume growth in residential mortgages, growth in wholesale loans,and an increase due to the impact of foreign exchange translation.
Derivative assets were up $40 billion or 54%, mainly attributable to an increase due to the impact of foreign exchange translationand increased fair values on interest rate swaps, partially offset by increased financial netting.
Other assets were up $16 billion or 30%, largely reflecting higher cash collateral requirements and an increase due to the impactof foreign exchange translation.
Total liabilities were up $163 billion or 19% from last year, including an increase due to the impact of foreign exchangetranslation as noted above.
Deposits increased $93 billion or 15%, mainly reflecting an increase due to the impact of foreign exchange translation, theissuance of fixed term notes to satisfy our funding requirements, and growth in business and retail deposits.
Derivative liabilities were up $41 billion or 55%, mainly attributable to an increase due to the impact of foreign exchangetranslation and increased fair values on interest rate swaps, partially offset by increased financial netting.
Other liabilities increased $29 billion or 16%, mainly reflecting an increase due to the impact of foreign exchange translation andhigher obligations related to repurchase agreements. An increase in cash collateral requirements also contributed to the increase.
Total equity increased $8 billion or 16%, largely reflecting an increase due to the impact of foreign exchange translation andearnings, net of dividends.
Q3 2015 vs. Q2 2015Total assets increased $53 billion or 5% from the prior quarter, primarily attributable to an increase due to the impact of foreignexchange translation, solid volume growth in residential mortgages, higher deposits with central banks, and an increase in derivativeassets due to higher fair values on cross-currency interest rate swaps and lower financial netting.
Total liabilities increased $49 billion or 5% from the prior quarter, primarily attributable to an increase due to the impact offoreign exchange translation, the issuance of fixed-term notes to satisfy our funding requirements, and growth in business deposits.
Q3 2015 vs. Q4 2014Total assets increased $145 billion or 15%, mainly attributable to an increase due to the impact of foreign exchange translation andan increase in reverse repos largely due to higher client activity. Higher government debt securities, growth in wholesale loans andresidential mortgages, and an increase in cash collateral requirements also contributed to the increase. These factors were partiallyoffset by a decrease in derivative assets due to lower fair values on interest rate swaps and increased financial netting.
Total liabilities increased $137 billion or 15%, mainly reflecting an increase due to the impact of foreign exchange translation,higher deposits largely reflecting our issuance of fixed-term notes to satisfy funding requirements and increased client activity, andhigher obligations related to repurchase agreements. These factors were partially offset by a decrease in derivative liabilities due tothe reasons noted above.
Off-balance sheet arrangements
In the normal course of business, we engage in a variety of financial transactions that, for accounting purposes, are not recorded onour Consolidated Balance Sheets. Off-balance sheet transactions are generally undertaken for risk, capital and funding managementpurposes which benefit us and our clients. These include transactions with structured entities and may also include the issuance ofguarantees. These transactions give rise to, among other risks, varying degrees of market, credit, liquidity and funding risk, which arediscussed in the Risk management section. Please refer to pages 43 to 46 of our 2014 Annual Report for a more detailed discussion ofthese types of arrangements.
We use structured entities to securitize our financial assets as well as assist our clients in securitizing their financial assets. Theseentities are not operating entities, typically have no employees, and may or may not be recorded on our Consolidated Balance Sheets.
In the normal course of business, we engage in a variety of financial transactions that may qualify for derecognition. We apply thederecognition rules to determine whether we have effectively transferred substantially all the risks and rewards or control associatedwith the financial assets to a third party. If the transaction meets specific criteria, it may qualify for full or partial derecognition fromour Consolidated Balance Sheets.
Securitizations of our financial assetsWe periodically securitize our credit card receivables, residential and commercial mortgage loans and bond participation certificatesprimarily to diversify our funding sources, to enhance our liquidity position and for capital purposes. We also securitize residentialand commercial mortgage loans for sales and trading activities.
We securitize our credit card receivables, on a revolving basis, through a consolidated structured entity. We securitize single andmultiple-family residential mortgages through the National Housing Act Mortgage-Backed Securities (NHA MBS) program. The majorityof our securitization activities are recorded on our Consolidated Balance Sheets as we do not meet the derecognition criteria. Duringthe second quarter, we derecognized $967 million of purchased mortgages where both the NHA MBS and the residual interests in themortgages were sold to third parties resulting in the transfer of substantially all of the risks and rewards. There were no such

Royal Bank of Canada Third Quarter 2015 25
transactions in the current quarter or prior year. For additional details of our securitization activities, refer to Note 6 and Note 7 of ouraudited 2014 Annual Consolidated Financial Statements.
We periodically securitize residential mortgage loans for the Canadian social housing program through the NHA MBS program,which are derecognized from our Consolidated Balance Sheets when sold to third party investors. During the third quarter of 2015, wedid not have any securitization transactions of residential mortgage loans for the Canadian social housing program (April 30, 2015 –$63 million; July 31, 2014 – $80 million).
We also periodically securitize commercial mortgages by selling them in collateral pools, which meet certain diversification,leverage and debt coverage criteria, to structured entities, one of which is sponsored by us. Securitized commercial mortgage loans arederecognized from our Consolidated Balance Sheets as we have transferred substantially all of the risk and rewards of ownership of thesecuritized assets. Our continuing involvement with the transferred assets is limited to servicing the underlying commercial mortgagessold to our sponsored structured entity. As at July 31, 2015, there were $1.3 billion of commercial mortgages outstanding related tothese securitization activities (April 30, 2015 – $1.2 billion and July 31, 2014 – $1.2 billion). During the current quarter, we securitized$195 million of commercial mortgages which were sold to our sponsored entity (April 30, 2015 - nil and July 31, 2014 – nil).
Involvement with unconsolidated structured entitiesIn the normal course of business, we engage in a variety of financial transactions with structured entities to support our customers’financing and investing needs, including securitization of client financial assets, creation of investment products, and other types ofstructured financing.
We have the ability to use credit mitigation tools such as third party guarantees, credit default swaps, and collateral to mitigaterisks assumed through securitization and re-securitization exposures. The process in place to monitor the credit quality of oursecuritization and re-securitization exposures involves, among other things, reviewing the performance of the underlying assets. Weaffirm our ratings each quarter and formally confirm or assign a new rating at least annually. For further details on our activities tomanage risks, refer to the Risk management section.
Below is a description of our activities with respect to certain significant unconsolidated structured entities. For a completediscussion of our interests in consolidated and unconsolidated structured entities, refer to Note 7 of our audited 2014 AnnualConsolidated Financial Statements.
RBC-administered multi-seller conduitsWe administer multi-seller conduits which are used primarily for the securitization of our clients’ financial assets. As at July 31, 2015,our maximum exposure to loss from these conduits was $39 billion (April 30, 2015 – $39 billion; July 31, 2014 – $32 billion),primarily representing backstop liquidity and partial credit enhancement facilities extended to the conduits.
As at July 31, 2015, the notional amount of backstop liquidity facilities we provided was $39 billion (April 30, 2015 – $39 billion;July 31, 2014 – $32 billion) and the partial credit enhancement facilities we provided were $3.7 billion (April 30, 2015 – $3.7 billion;July 31, 2014 – $2.9 billion). The increases in the amount of backstop liquidity and credit enhancement facilities provided to themulti-seller conduits compared to the prior year primarily reflect an increase in the outstanding securitized assets of the multi-sellerconduits and fluctuations in exchange rates.
Total loans extended to the multi-seller conduits under the backstop liquidity facilities were $774 million, a decrease of$132 million from the prior quarter and a decrease of $78 million from the prior year due mainly to principal repayments, partiallyoffset by fluctuations in the exchange rates. Total assets of the multi-seller conduits as at July 31, 2015 were $38 billion (April 30,2015 – $38 billion; July 31, 2014 – $31 billion). The increase from the prior year was primarily due to increases in the Student loans,Auto loans and leases, Transportation finance and Consumer loans asset classes and fluctuations in exchange rates.
As at July 31, 2015, the total asset-backed commercial paper (ABCP) issued by the conduits amounted to $26 billion (April 30,2015 – $26 billion; July 31, 2014 – $20 billion). The rating agencies that rate the ABCP rated 71% of the total amount issued withinthe top ratings category (April 30, 2015 – 71%; July 31, 2014 – 72%) and the remaining amount in the second highest ratingscategory. We sometimes purchase ABCP issued by the multi-seller conduits in our capacity as a placement agent in order to facilitateoverall program liquidity. As at July 31, 2015, the fair value of our inventory was $34 million, an increase of $27 million from the priorquarter and an increase of $2 million from the prior year. The fluctuations in inventory held reflect normal trading activity. Thisinventory is classified as Securities – Trading on our Consolidated Balance Sheets.
Structured financeWe invest in auction rate securities of trusts which fund their long-term investments in student loans by issuing short-term seniorand subordinated notes. Our maximum exposure to loss in these auction rate securities trusts as at July 31, 2015 was $0.5 billion(April 30, 2015 – $0.6 billion; July 31, 2014 – $0.9 billion). The decrease in our maximum exposure to loss is primarily related to thesale of auction rate securities, partially offset by exchange rate differences. As at July 31, 2015, approximately 89% of theseinvestments were rated AA or higher based on ratings published by Standard & Poor’s.
We also provide liquidity facilities to certain municipal bond Tender Option Bond (TOB) trusts in which we have an interest but donot consolidate because the residual certificates issued by the TOB trusts are held by third parties. As at July 31, 2015, our maximumexposure to loss from these unconsolidated municipal bond TOB trusts was $0.8 billion (April 30, 2015 – $0.9 billion; July 31, 2014 –$0.7 billion). The decrease in our maximum exposure to loss relative to the prior quarter is primarily related to the decrease in thenumber of TOB trusts. The increase in our maximum exposure to loss relative to the prior year is primarily related to the additions ofnew TOB trusts.
During fiscal 2014, we entered the collateralized loan obligation market as a senior warehouse lender and structuring andplacement agent. We provide senior warehouse financing to discrete unaffiliated structured entities that are established by thirdparties to acquire loans and issue term collateralized loan obligations. A portion of the proceeds from the sale of the termcollateralized loan obligations certificates is used to fully repay the senior warehouse financing that we provide. As at July 31, 2015,our maximum exposure to loss associated with the outstanding senior warehouse financing facilities was $135 million (April 30,2015 – $318 million; July 31, 2014 – $305 million). The decreases in our maximum exposure to loss relative to the prior quarter andprior year are related to a decrease in the outstanding drawings on certain financing facilities.
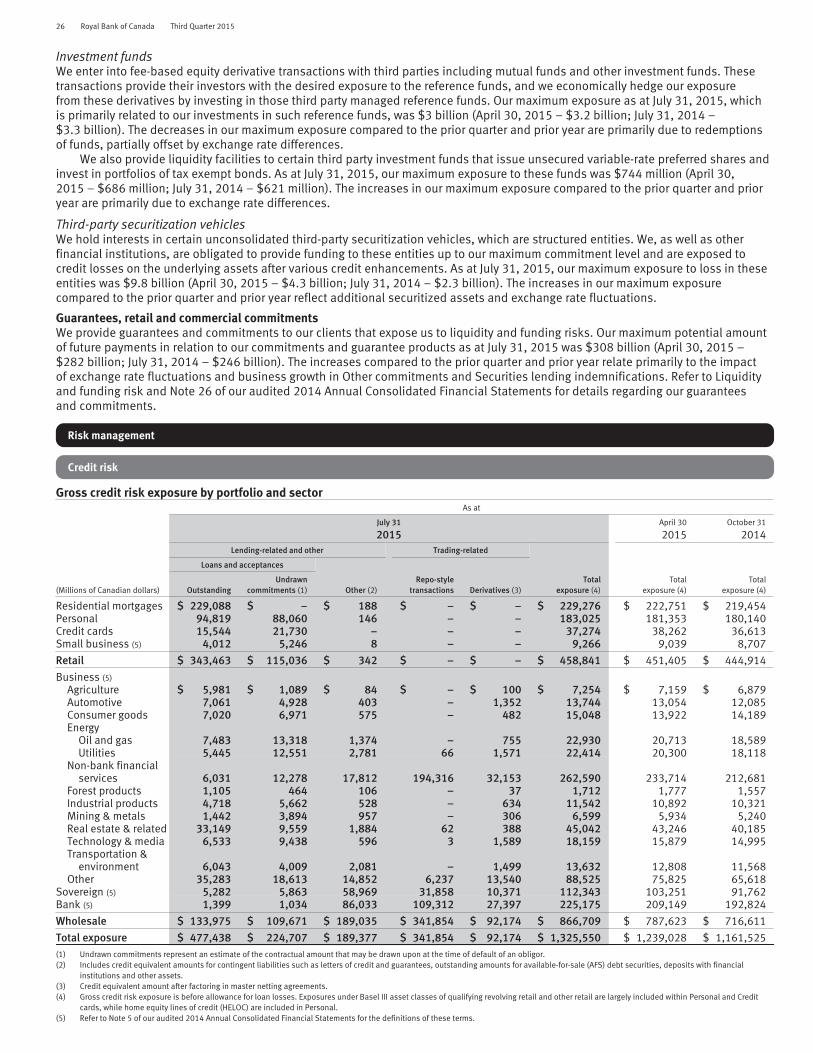
26 Royal Bank of Canada Third Quarter 2015
Investment fundsWe enter into fee-based equity derivative transactions with third parties including mutual funds and other investment funds. Thesetransactions provide their investors with the desired exposure to the reference funds, and we economically hedge our exposurefrom these derivatives by investing in those third party managed reference funds. Our maximum exposure as at July 31, 2015, whichis primarily related to our investments in such reference funds, was $3 billion (April 30, 2015 – $3.2 billion; July 31, 2014 –$3.3 billion). The decreases in our maximum exposure compared to the prior quarter and prior year are primarily due to redemptionsof funds, partially offset by exchange rate differences.
We also provide liquidity facilities to certain third party investment funds that issue unsecured variable-rate preferred shares andinvest in portfolios of tax exempt bonds. As at July 31, 2015, our maximum exposure to these funds was $744 million (April 30,2015 – $686 million; July 31, 2014 – $621 million). The increases in our maximum exposure compared to the prior quarter and prioryear are primarily due to exchange rate differences.
Third-party securitization vehiclesWe hold interests in certain unconsolidated third-party securitization vehicles, which are structured entities. We, as well as otherfinancial institutions, are obligated to provide funding to these entities up to our maximum commitment level and are exposed tocredit losses on the underlying assets after various credit enhancements. As at July 31, 2015, our maximum exposure to loss in theseentities was $9.8 billion (April 30, 2015 – $4.3 billion; July 31, 2014 – $2.3 billion). The increases in our maximum exposurecompared to the prior quarter and prior year reflect additional securitized assets and exchange rate fluctuations.
Guarantees, retail and commercial commitmentsWe provide guarantees and commitments to our clients that expose us to liquidity and funding risks. Our maximum potential amountof future payments in relation to our commitments and guarantee products as at July 31, 2015 was $308 billion (April 30, 2015 –$282 billion; July 31, 2014 – $246 billion). The increases compared to the prior quarter and prior year relate primarily to the impactof exchange rate fluctuations and business growth in Other commitments and Securities lending indemnifications. Refer to Liquidityand funding risk and Note 26 of our audited 2014 Annual Consolidated Financial Statements for details regarding our guaranteesand commitments.
Risk management
Credit risk
Gross credit risk exposure by portfolio and sectorAs at
July 31
2015April 30
2015October 31
2014Lending-related and other Trading-related
Loans and acceptances
(Millions of Canadian dollars) OutstandingUndrawn
commitments (1) Other (2)Repo-style
transactions Derivatives (3)Total
exposure (4)Total
exposure (4)Total
exposure (4)
Residential mortgages $ 229,088 $ – $ 188 $ – $ – $ 229,276 $ 222,751 $ 219,454Personal 94,819 88,060 146 – – 183,025 181,353 180,140Credit cards 15,544 21,730 – – – 37,274 38,262 36,613Small business (5) 4,012 5,246 8 – – 9,266 9,039 8,707
Retail $ 343,463 $ 115,036 $ 342 $ – $ – $ 458,841 $ 451,405 $ 444,914
Business (5)
Agriculture $ 5,981 $ 1,089 $ 84 $ – $ 100 $ 7,254 $ 7,159 $ 6,879Automotive 7,061 4,928 403 – 1,352 13,744 13,054 12,085Consumer goods 7,020 6,971 575 – 482 15,048 13,922 14,189Energy
Oil and gas 7,483 13,318 1,374 – 755 22,930 20,713 18,589Utilities 5,445 12,551 2,781 66 1,571 22,414 20,300 18,118
Non-bank financialservices 6,031 12,278 17,812 194,316 32,153 262,590 233,714 212,681
Forest products 1,105 464 106 – 37 1,712 1,777 1,557Industrial products 4,718 5,662 528 – 634 11,542 10,892 10,321Mining & metals 1,442 3,894 957 – 306 6,599 5,934 5,240Real estate & related 33,149 9,559 1,884 62 388 45,042 43,246 40,185Technology & media 6,533 9,438 596 3 1,589 18,159 15,879 14,995Transportation &
environment 6,043 4,009 2,081 – 1,499 13,632 12,808 11,568Other 35,283 18,613 14,852 6,237 13,540 88,525 75,825 65,618
Sovereign (5) 5,282 5,863 58,969 31,858 10,371 112,343 103,251 91,762Bank (5) 1,399 1,034 86,033 109,312 27,397 225,175 209,149 192,824
Wholesale $ 133,975 $ 109,671 $ 189,035 $ 341,854 $ 92,174 $ 866,709 $ 787,623 $ 716,611
Total exposure $ 477,438 $ 224,707 $ 189,377 $ 341,854 $ 92,174 $ 1,325,550 $ 1,239,028 $ 1,161,525(1) Undrawn commitments represent an estimate of the contractual amount that may be drawn upon at the time of default of an obligor.(2) Includes credit equivalent amounts for contingent liabilities such as letters of credit and guarantees, outstanding amounts for available-for-sale (AFS) debt securities, deposits with financial
institutions and other assets.(3) Credit equivalent amount after factoring in master netting agreements.(4) Gross credit risk exposure is before allowance for loan losses. Exposures under Basel III asset classes of qualifying revolving retail and other retail are largely included within Personal and Credit
cards, while home equity lines of credit (HELOC) are included in Personal.(5) Refer to Note 5 of our audited 2014 Annual Consolidated Financial Statements for the definitions of these terms.

Royal Bank of Canada Third Quarter 2015 27
Q3 2015 vs. Q2 2015Total gross credit risk exposure increased $87 billion or 7% from the prior quarter, primarily reflecting an increase due to the impact offoreign exchange translation, growth in loans and acceptances and higher deposits with central banks.
Retail exposure increased $7 billion or 2%, mainly due to volume growth in Canadian residential mortgages and personal loans,partly offset by a decrease in exposure to credit cards.
Wholesale exposure increased $79 billion or 10%, primarily attributable to an increase in Other lending-related exposure relatedto deposits with central banks and AFS securities, higher loans and acceptances reflecting solid growth across most sectors, and anincrease in derivative assets due to higher fair values on cross currency interest rate swaps and lower financial netting. The growthalso reflects an increase due to the impact of foreign exchange translation on foreign currency-denominated assets as a result of aweaker Canadian dollar. Wholesale loan utilization is marginally down to 37% from 38% last quarter.
Gross credit risk exposure by geography (1)
As at
July 31
2015April 30
2015October 31
2014Lending-related and other Trading-related
Loans and acceptances
(Millions of Canadian dollars) OutstandingUndrawn
commitments OtherRepo-style
transactions Derivatives Total exposureTotal
exposureTotal
exposure
Canada $ 404,426 $ 149,903 $ 75,847 $ 59,035 $ 28,137 $ 717,348 $ 704,057 $ 674,079U.S. 39,125 55,789 37,420 172,627 14,625 319,586 272,496 258,167Europe 18,653 15,549 56,772 64,957 44,526 200,457 182,112 163,066Other International 15,234 3,466 19,338 45,235 4,886 88,159 80,363 66,213
Total Exposure $ 477,438 $ 224,707 $ 189,377 $ 341,854 $ 92,174 $ 1,325,550 $ 1,239,028 $ 1,161,525
(1) Geographic profile is based on country of residence of the borrower.
Q3 2015 vs. Q2 2015Relative to the previous quarter, the U.S. exposure increased 17%, Europe 10%, Other International 10% and Canada 2% largelyreflecting an increase due to the impact of foreign exchange translation, volume increases and higher deposits with central banks.
European exposure
As at
July 31
2015April 30
2015October 31
2014Loans and acceptances Other
(Millions of Canadian dollars) OutstandingUndrawn
commitments (1) Securities (2)
Letters ofcredit and
guaranteesRepo-style
transactions Derivatives
TotalEuropeanexposure
TotalEuropeanexposure
TotalEuropeanexposure
Gross exposure to Europe $ 18,653 $ 15,549 $ 31,592 $ 25,180 $ 64,957 $ 44,526 $ 200,457 $ 182,112 $ 163,066Less: Collateral held against
repo-style transactions – – – – 63,642 – 63,642 61,179 51,386Potential future credit
exposure add-on amount – – – – – 29,961 29,961 26,461 22,403Undrawn commitments – 15,549 – 25,180 – – 40,729 39,449 38,079
Gross drawn exposure to Europe $ 18,653 $ – $ 31,592 $ – $ 1,315 $ 14,565 $ 66,125 $ 55,023 $ 51,198
Less: Collateral applied againstderivatives – – – – – 10,665 10,665 9,640 8,249
Add: Trading securities – – 13,895 – – – 13,895 14,379 15,471
Net exposure to Europe (3) $ 18,653 $ – $ 45,487 $ – $ 1,315 $ 3,900 $ 69,355 $ 59,762 $ 58,420
(1) These amounts are comprised of $14.4 billion to corporate entities, $0.3 billion to financial entities and $0.8 billion to sovereign entities. On a country basis, exposure is comprised of $7.0 billionto the U.K., $2.4 billion to France, $1.9 billion to Germany, $0.4 billion to Ireland, $0.1 billion to Spain, and $0.1 billion to Italy, with the remaining $3.4 billion related to Other Europe. Of theundrawn commitments, over 80% are to investment grade entities.
(2) Securities include $13.9 billion of trading securities (April 30, 2015 – $14.4 billion), $17.6 billion of deposits (April 30, 2015 – $13.6 billion), and $14.0 billion of AFS securities (April 30, 2015 –$10.3 billion).
(3) Excludes $3.1 billion (April 30, 2015 – $3.9 billion) of exposures to supranational agencies.
Our gross credit risk exposure is calculated based on the definitions provided under the Basel III framework whereby risk exposure iscalculated before taking into account any collateral and inclusive of an estimate of potential future changes to that credit exposure.On that basis, our total European exposure as at July 31, 2015 was $200 billion. Our gross drawn exposure to Europe was $66 billion,after taking into account collateral held against repo-style transactions of $64 billion, letters of credit and guarantees, and undrawncommitments for loans of $41 billion and potential future credit exposure to derivatives of $30 billion. Our net exposure to Europewas $69 billion, after taking into account $11 billion of collateral, primarily in cash, we hold against derivatives and the addition oftrading securities of $14 billion held in our trading book. Our net exposure to Europe also reflected $1.3 billion of mitigation throughcredit default swaps, which are largely used to hedge single name exposures and market risk.

28 Royal Bank of Canada Third Quarter 2015
Net European exposure by country (1)
As at
July 31
2015April 30
2015October 31
2014
(Millions of Canadian dollars)Loans
outstanding SecuritiesRepo-style
transactions Derivatives Total Total Total
U.K. $ 11,125 $ 12,928 $ 947 $ 1,235 $ 26,235 $ 22,824 $ 24,033Germany 1,219 8,319 8 819 10,365 11,049 10,172France 353 4,891 55 535 5,834 4,404 4,284
Total U.K., Germany, France $ 12,697 $ 26,138 $ 1,010 $ 2,589 $ 42,434 $ 38,277 $ 38,489
Greece $ – $ – $ – $ – $ – $ – $ –Ireland 1,142 95 29 73 1,339 1,344 883Italy 44 39 – 20 103 134 150Portugal 8 2 – 1 11 17 9Spain 315 46 – 58 419 490 476
Total Peripheral (2) $ 1,509 $ 182 $ 29 $ 152 $ 1,872 $ 1,985 $ 1,518
Luxembourg $ 681 $ 3,805 $ 1 $ 32 $ 4,519 $ 2,231 $ 1,909Netherlands 854 3,495 8 715 5,072 4,732 4,260Norway 430 4,269 – 34 4,733 3,503 3,011Sweden 353 3,184 95 6 3,638 2,153 2,731Switzerland 627 2,564 151 98 3,440 3,798 3,557Other 1,502 1,850 21 274 3,647 3,083 2,945
Total Other Europe $ 4,447 $ 19,167 $ 276 $ 1,159 $ 25,049 $ 19,500 $ 18,413
Total exposure to Europe $ 18,653 $ 45,487 $ 1,315 $ 3,900 $ 69,355 $ 59,762 $ 58,420
(1) Geographic profile is based on country of risk, which reflects our assessment of the geographic risk associated with a given exposure. Typically, this is the residence of the borrower.(2) Gross credit risk exposure to peripheral Europe is comprised of Greece $nil (April 30, 2015 – $nil), Ireland $7.4 billion (April 30, 2015 – $2.5 billion), Italy $0.3 billion (April 30, 2015 – $0.3 billion),
Portugal $nil (April 30, 2015 – $nil), and Spain $1.3 billion (April 30, 2015 – $1.2 billion).
Q3 2015 vs. Q2 2015Net credit risk exposure to Europe increased $10 billion from last quarter, largely driven by increased exposure in the U.K.,Luxembourg, Sweden and France. Our net exposure to peripheral Europe, which includes Greece, Ireland, Italy, Portugal and Spain,remained minimal, with total outstanding exposure decreasing $0.1 billion during the quarter to $1.9 billion.
Our exposure was predominantly investment grade. Our net exposure to larger European countries, including the U.K., Germanyand France, was primarily related to our capital markets, wealth management, and investor services businesses, particularly in fixedincome, treasury services, derivatives, and corporate and individual lending. These are predominantly client-driven businesses wherewe transact with a range of European financial institutions, corporations, and individuals. In addition, we engage in primary dealeractivities in the U.K., where we participate in auctions of government debt and act as a market maker and provide liquidity to clients.Exposures to other European countries are largely related to securities which include trading securities, deposits, and AFS securities.
Our trading securities are related to both client market-making activities and our funding and liquidity management needs. All ofour trading securities are marked-to-market on a daily basis. Deposits are primarily related to deposits with central banks or financialinstitutions and also included deposits related to our wealth management business in the Channel Islands. AFS securities are largelycomprised of Organization for Economic Co-operation and Development government and corporate debt. Our European corporate loanbook is managed on a global basis and the underwriting standards for this loan book reflect the same approach to the use of ourbalance sheet as we have applied in both Canada and the U.S. We had PCL on this portfolio of $0.3 million this quarter. The grossimpaired loans ratio of this loan book was 0.3%, up from 0.2% last quarter.
Net European exposure by client type
As at
July 31
2015April 30
2015October 31
2014(Millions ofCanadiandollars) U.K. Germany France
Total U.K.,Germany,
France Greece Ireland Italy Portugal SpainTotal
PeripheralOther
EuropeTotal
EuropeTotal
EuropeTotal
Europe
Financials $ 6,513 $ 6,913 $ 711 $ 14,137 $ – $ 165 $ 65 $ 1 $ 54 $ 285 $ 12,553 $ 26,975 $ 24,524 $ 24,641Sovereign 9,879 1,202 4,533 15,614 – 9 – 77 86 7,653 23,353 17,466 17,527Corporate 9,843 2,250 590 12,683 – 1,165 38 10 288 1,501 4,843 19,027 17,772 16,252
Total $ 26,235 $ 10,365 $ 5,834 $ 42,434 $ – $ 1,339 $ 103 $ 11 $ 419 $ 1,872 $ 25,049 $ 69,355 $ 59,762 $ 58,420
Q3 2015 vs. Q2 2015Our net exposure to Sovereign increased $5.9 billion mainly due to increases in U.K., Other Europe and France. The increase inFinancials of $2.5 billion was largely in Other Europe, partly offset by a decrease in Germany. The net exposure to Corporates of$1.3 billion was mainly due to increases in Other Europe and U.K.

Royal Bank of Canada Third Quarter 2015 29
Residential mortgages and home equity lines of credit (insured vs. uninsured)Residential mortgages and home equity lines of credit are secured by residential properties. The following table presents a breakdownby geographic region:
As at July 31, 2015
(Millions of Canadian dollars, exceptpercentage amounts)
Residential mortgages (1)Home equity
lines of credit (3)
Insured (2) Uninsured Total Total
Region (4)
CanadaAtlantic provinces $ 6,751 56% $ 5,405 44% $ 12,156 $ 2,057Quebec 13,342 49 14,058 51 27,400 4,122Ontario 36,509 40 55,187 60 91,696 16,840Prairie provinces 27,142 53 23,955 47 51,097 10,009B.C. and territories 15,765 37 26,895 63 42,660 9,368
Total Canada (5) $ 99,509 44% $ 125,500 56% $ 225,009 $ 42,396U.S. 2 – 735 100 737 307Other International 14 – 3,210 100 3,224 2,984
Total International $ 16 –% $ 3,945 100% $ 3,961 $ 3,291
Total $ 99,525 43% $ 129,445 57% $ 228,970 $ 45,687
As at April 30, 2015
(Millions of Canadian dollars, exceptpercentage amounts)
Residential mortgages (1)Home equity
lines of credit (3)
Insured (2) Uninsured Total Total
Region (4)
CanadaAtlantic provinces $ 6,572 56% $ 5,262 44% $ 11,834 $ 2,059Quebec 13,470 50 13,498 50 26,968 4,168Ontario 35,785 40 53,160 60 88,945 16,902Prairie provinces 26,326 53 23,003 47 49,329 10,093B.C. and territories 15,493 37 26,185 63 41,678 9,541
Total Canada (5) $ 97,646 45% $ 121,108 55% $ 218,754 $ 42,763U.S. 4 1 613 99 617 316Other International 13 – 2,938 100 2,951 2,796
Total International $ 17 –% $ 3,551 100% $ 3,568 $ 3,112
Total $ 97,663 44% $ 124,659 56% $ 222,322 $ 45,875
(1) The residential mortgages amounts exclude our third party mortgage-backed securities (MBS) of $119 million (April 30, 2015 – $163 million).(2) Insured residential mortgages are mortgages whereby our exposure to default is mitigated by insurance through the Canada Mortgage and Housing
Corporation (CMHC) or other private mortgage default insurers.(3) HELOC includes revolving and non-revolving loans.(4) Refer to the Risk management section of our 2014 Annual Report for the definitions of these regions.(5) Total consolidated residential mortgages in Canada of $224 billion (April 30, 2015 – $219 billion) is comprised of $201 billion (April 30, 2015 –
$196 billion) of residential mortgages and $5 billion (April 30, 2015 – $5 billion) of mortgages with commercial clients of which $3 billion (April 30,2015 – $3 billion) are insured mortgages, both in Canadian Banking, and $18 billion (April 30, 2015 – $18 billion) of residential mortgages in CapitalMarkets held for securitization purposes.
Home equity lines of credit are uninsured and reported within the personal loan category. As at July 31, 2015, home equity lines ofcredit in Canadian Banking were $42 billion (April 30, 2015 – $43 billion). Approximately 98% of these home equity lines of credit(April 30, 2015 – 98%) are secured by a first lien on real estate, and 7% (April 30, 2015 – 8%) of the total homeline clients pay thescheduled interest payment only.

30 Royal Bank of Canada Third Quarter 2015
Residential mortgages portfolio by amortization periodThe following table provides a summary of the percentage of residential mortgages that fall within the remaining amortization periodsbased upon current customer payment amounts, which incorporate payments larger than the minimum contractual amount and/orhigher frequency of payments:
As at
July 31
2015April 30
2015
CanadaU.S. and Other
International Total CanadaU.S. and Other
International Total
Amortization period≤ 25 years 74% 93% 75% 73% 93% 73%> 25 years ≤ 30 years 23 7 23 23 7 23> 30 years ≤ 35 years 3 – 2 4 – 4> 35 years – – – – – –
Total 100% 100% 100% 100% 100% 100%
Average loan-to-value (LTV) ratio for newly originated and acquired uninsured residential mortgages and homeline productsThe following table provides a summary of our average LTV ratio for newly originated and acquired uninsured residential mortgagesand homeline products by geographic region:
For the three months ended For the nine months ended
July 31
2015April 30
2015July 31
2015Uninsured Uninsured Uninsured
Residentialmortgages (1)
Homelineproducts (2)
Residentialmortgages (1)
Homelineproducts (2)
Residentialmortgages (1)
Homelineproducts (2)
Region (3)
Atlantic provinces 73% 75% 73% 75% 74% 75%Quebec 72 73 71 73 71 73Ontario 71 70 71 70 71 70Prairie provinces 73 74 74 74 73 74B.C. and territories 69 66 68 66 69 66U.S. 72 n.m. 72 n.m. 72 n.m.Other International 85 n.m. 85 n.m. 85 n.m.
Average of newly originated and acquired forthe year (4), (5) 71% 70% 71% 70% 71% 70%
Total Canadian Banking residential mortgages portfolio 56% 55% 56% 55% 56% 55%(1) Residential mortgages excludes residential mortgages within the homeline products.(2) Homeline products are comprised of both residential mortgages and home equity lines of credit.(3) Refer to the Risk management section of our 2014 Annual Report for the definitions of these regions.(4) The average LTV ratio for newly originated and acquired uninsured residential mortgages and homeline products is calculated on a weighted basis by mortgage
amounts at origination.(5) For newly originated mortgages and homeline products, LTV is calculated based on the total facility amount for the residential mortgage and homeline product divided
by the value of the related residential property.n.m. not meaningful
While the above table provides the LTV ratios for the current quarter originations, the LTV ratio on our outstanding balances of theentire Canadian Banking uninsured residential mortgages, including homeline products, is 55% as at July 31, 2015 (April 30, 2015 –56%). This calculation is weighted by mortgage balances and adjusted for property values based on the Teranet – National BankNational Composite House Price Index.
We employ a risk-based approach to property valuation. Property valuation methods include automated valuation models (AVM)and appraisals. An AVM is a tool that estimates the value of a property by reference to market data including sales of comparableproperties and price trends specific to the Metropolitan Statistical Area in which the property being valued is located. Using a risk-based approach, we also employ appraisals which can include drive-by or full on-site appraisals.
We continue to actively manage our entire mortgage portfolio and perform stress testing, based on a combination of increasingunemployment, rising interest rates, and a downturn in real estate markets. Our stress test results indicate the vast majority of ourresidential mortgage and homeline clients have sufficient capacity to continue making payments in the event of a shock to one of theabove noted parameters.

Royal Bank of Canada Third Quarter 2015 31
Credit quality performance
Provision for (recovery of) credit loss
For the three months endedFor the nine months
ended
(Millions of Canadian dollars, except percentage amounts)
July 31
2015April 30
2015July 31
2014July 31
2015July 31
2014
Personal & Commercial Banking $ 257 $ 235 $ 284 $ 744 $ 789Wealth Management – 32 – 45 19Capital Markets 15 15 1 35 12Corporate Support and Other (1) (2) – (2) (2) (1)
Total PCL $ 270 $ 282 $ 283 $ 822 $ 819
Canada (2)
Residential mortgages $ 6 $ 5 $ 4 $ 19 $ 17Personal 98 97 96 291 299Credit cards 92 94 88 278 260Small business 7 9 8 25 33
Retail 203 205 196 613 609Wholesale 42 11 30 81 88
PCL on impaired loans 245 216 226 694 697
U.S. (2)
Retail $ – $ 1 $ 1 $ 1 $ 1Wholesale 4 10 4 21 7
PCL on impaired loans 4 11 5 22 8
Other International (2)
Retail $ 9 $ 10 $ 21 $ 23 $ 60Wholesale 12 45 31 83 54
PCL on impaired loans 21 55 52 106 114
Total PCL $ 270 $ 282 $ 283 $ 822 $ 819
PCL ratio (3)
Total PCL ratio 0.23% 0.25% 0.26% 0.24% 0.26%Personal & Commercial Banking 0.28 0.26 0.32 0.27 0.30
Canadian Banking 0.26 0.25 0.26 0.26 0.27Caribbean Banking 0.99 1.06 3.07 0.99 1.85
Wealth Management 0.01 0.73 (0.02) 0.34 0.16Capital Markets 0.07 0.08 0.01 0.06 0.02
(1) PCL in Corporate Support and Other is primarily comprised of PCL for legacy portfolios and PCL for loans not yet identified as impaired. For further information, refer to the How we measureand report our business segments section.
(2) Geographic information is based on residence of borrower.(3) PCL on impaired loans as a % of average net loans and acceptances.
Q3 2015 vs. Q3 2014Total PCL decreased $13 million, or 5%, from a year ago. The PCL ratio of 23 bps decreased 3 bps.
PCL in Personal & Commercial Banking decreased $27 million or 10%, and the PCL ratio of 28 bps decreased 4 bps, mainly due tolower provisions in our Caribbean portfolios. This factor was partially offset by higher write-offs in our Canadian credit cards portfolioand higher PCL in our Canadian personal lending and residential mortgage portfolios.
PCL in Capital Markets increased $14 million, mainly due to provisions taken on a single account.
Q3 2015 vs. Q2 2015Total PCL decreased $12 million, or 4%, from last quarter. The PCL ratio of 23 bps decreased 2 bps.
PCL in Personal & Commercial Banking increased $22 million or 9%, and the PCL ratio of 28 bps increased 2 bps, mainly due to areversal of a single account in our Canadian commercial lending portfolio last quarter. Our current quarter included lower provisions inour Caribbean portfolios.
PCL in Wealth Management decreased $32 million as the prior quarter included a provision taken on a single account related toour U.S. & International Wealth Management business.
PCL in Capital Markets was flat as compared to the prior quarter.
Q3 2015 vs. Q3 2014 (Nine months ended)Total PCL increased $3 million from the prior year. PCL ratio of 24 bps, decreased 2 bps.
PCL in Personal & Commercial Banking decreased $45 million or 6%, and the PCL ratio of 27 bps decreased 3 bps, mainly due tolower provisions in our Caribbean portfolios, and in our Canadian commercial lending and small business portfolios. These factorswere partially offset by higher write-offs in our credit cards portfolio.
PCL in Wealth Management increased $26 million, mainly due to provisions on a couple of accounts primarily related to ourU.S. & International Wealth Management business.
PCL in Capital Markets increased $23 million, mainly due to provisions taken on a few accounts.

32 Royal Bank of Canada Third Quarter 2015
Gross impaired loans (GIL)
As at
(Millions of Canadian dollars, except percentage amounts)
July 31
2015April 30
2015July 31
2014
Personal & Commercial Banking $ 1,919 $ 1,901 $ 1,929Wealth Management 130 91 17Capital Markets 328 151 50Investor & Treasury Services 2 2 2Corporate Support and Other – – 1
Total GIL $ 2,379 $ 2,145 $ 1,999
Canada (1)
Retail $ 640 $ 675 $ 696Wholesale 589 490 480
GIL 1,229 1,165 1,176
U.S. (1)
Retail $ 10 $ 10 $ 13Wholesale 199 99 18
GIL 209 109 31
Other International (1)
Retail $ 382 $ 360 $ 327Wholesale 559 511 465
GIL 941 871 792
Total GIL $ 2,379 $ 2,145 $ 1,999
Impaired loans, beginning balance $ 2,145 $ 2,133 $ 1,975Classified as impaired during the period (new impaired) (2) 498 438 330Net repayments (2) (18) (44) (19)Amounts written off (326) (323) (299)Other (2), (3) 80 (59) 12
Impaired loans, balance at end of period $ 2,379 $ 2,145 $ 1,999
GIL ratio (4)
Total GIL ratio 0.50% 0.46% 0.45%Personal & Commercial Banking 0.52 0.52 0.55
Canadian Banking 0.31 0.32 0.33Caribbean Banking 9.93 9.23 11.01
Wealth Management 0.73 0.51 0.10Capital Markets 0.40 0.19 0.08
(1) Geographic information is based on residence of borrower.(2) Certain GIL movements for Canadian Banking retail and wholesale portfolios are generally allocated to New Impaired, as Return to
performing status, Net repayments, Sold, and Exchange and other movements amounts are not reasonably determinable. Certain GILmovements for Caribbean Banking retail and wholesale portfolios are generally allocated to Exchange and other movements, as Returnto performing status, Net repayments, and Sold amounts are not reasonably determinable.
(3) Includes Return to performing status during the year, Recoveries of loans and advances previously written off, Sold, and Exchange andother movements.
(4) GIL as a % of loans and acceptances.
Q3 2015 vs. Q3 2014Total GIL increased $380 million or 19% from a year ago. The GIL ratio of 50 bps increased 5 bps.
GIL in Personal & Commercial Banking decreased $10 million, and the GIL ratio of 52 bps decreased 3 bps, mainly due to lowerimpaired loans in our residential mortgages and personal loans portfolios, partially offset by an increase due to the impact of foreignexchange translation on our Caribbean portfolios.
GIL in Wealth Management increased $113 million, mainly due to higher impaired loans in the U.S. & International WealthManagement business.
GIL in Capital Markets increased $278 million, primarily due to higher impaired loans in the oil and gas, utilities and consumergoods sectors.
Q3 2015 vs. Q2 2015Total GIL increased $234 million from the prior quarter. The GIL ratio of 50 bps increased 4 bps.
GIL in Personal & Commercial Banking increased $18 million, mainly due to higher impaired loans in our Canadian commerciallending portfolio and an increase due to the impact of foreign exchange translation on our Caribbean portfolios, partially offset bylower impaired loans in our Canadian residential mortgages and personal lending portfolios. The GIL ratio of 52 bps was flat ascompared to the prior quarter.
GIL in Wealth Management increased $39 million or 43%, mainly due to higher impaired loans on a single account related to ourU.S. & International Wealth Management business.
GIL in Capital Markets increased $177 million, due to a few accounts primarily in the oil and gas sector.
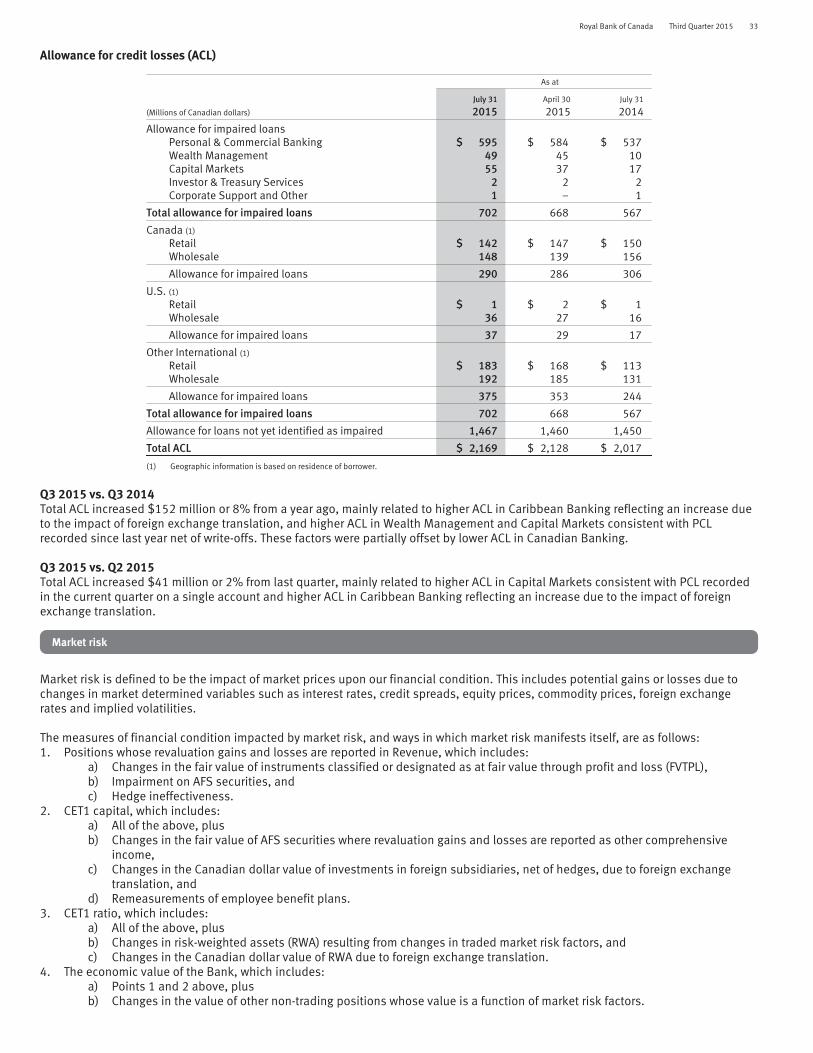
Royal Bank of Canada Third Quarter 2015 33
Allowance for credit losses (ACL)
As at
(Millions of Canadian dollars)
July 31
2015April 30
2015July 31
2014
Allowance for impaired loansPersonal & Commercial Banking $ 595 $ 584 $ 537Wealth Management 49 45 10Capital Markets 55 37 17Investor & Treasury Services 2 2 2Corporate Support and Other 1 – 1
Total allowance for impaired loans 702 668 567
Canada (1)
Retail $ 142 $ 147 $ 150Wholesale 148 139 156
Allowance for impaired loans 290 286 306
U.S. (1)
Retail $ 1 $ 2 $ 1Wholesale 36 27 16
Allowance for impaired loans 37 29 17
Other International (1)
Retail $ 183 $ 168 $ 113Wholesale 192 185 131
Allowance for impaired loans 375 353 244
Total allowance for impaired loans 702 668 567
Allowance for loans not yet identified as impaired 1,467 1,460 1,450
Total ACL $ 2,169 $ 2,128 $ 2,017
(1) Geographic information is based on residence of borrower.
Q3 2015 vs. Q3 2014Total ACL increased $152 million or 8% from a year ago, mainly related to higher ACL in Caribbean Banking reflecting an increase dueto the impact of foreign exchange translation, and higher ACL in Wealth Management and Capital Markets consistent with PCLrecorded since last year net of write-offs. These factors were partially offset by lower ACL in Canadian Banking.
Q3 2015 vs. Q2 2015Total ACL increased $41 million or 2% from last quarter, mainly related to higher ACL in Capital Markets consistent with PCL recordedin the current quarter on a single account and higher ACL in Caribbean Banking reflecting an increase due to the impact of foreignexchange translation.
Market risk
Market risk is defined to be the impact of market prices upon our financial condition. This includes potential gains or losses due tochanges in market determined variables such as interest rates, credit spreads, equity prices, commodity prices, foreign exchangerates and implied volatilities.
The measures of financial condition impacted by market risk, and ways in which market risk manifests itself, are as follows:1. Positions whose revaluation gains and losses are reported in Revenue, which includes:
a) Changes in the fair value of instruments classified or designated as at fair value through profit and loss (FVTPL),b) Impairment on AFS securities, andc) Hedge ineffectiveness.
2. CET1 capital, which includes:a) All of the above, plusb) Changes in the fair value of AFS securities where revaluation gains and losses are reported as other comprehensive
income,c) Changes in the Canadian dollar value of investments in foreign subsidiaries, net of hedges, due to foreign exchange
translation, andd) Remeasurements of employee benefit plans.
3. CET1 ratio, which includes:a) All of the above, plusb) Changes in risk-weighted assets (RWA) resulting from changes in traded market risk factors, andc) Changes in the Canadian dollar value of RWA due to foreign exchange translation.
4. The economic value of the Bank, which includes:a) Points 1 and 2 above, plusb) Changes in the value of other non-trading positions whose value is a function of market risk factors.

34 Royal Bank of Canada Third Quarter 2015
Market risk controls – FVTPL positionsAs an element of the Enterprise Risk Appetite Framework, the Board of Directors approves the overall market risk constraints for RBC.Group Risk Management (GRM) creates and manages the control structure for FVTPL positions that ensures that business is conductedconsistent with Board requirements. The Market and Trading Credit Risk function within GRM is responsible for creating and managingthe controls and governance procedures that ensure that risk taken is consistent with risk appetite constraints set by the Board. Thesecontrols include limits on probabilistic measures of potential loss such as Value-at-Risk and Stressed Value-at-Risk as defined below:
Value-at-Risk (VaR) – is a statistical measure of potential loss for a financial portfolio computed at a given level of confidenceand over a defined holding period. We measure VaR at the 99th percentile confidence level for price movements over a one dayholding period using historic simulation of the last two years of equally weighted historic market data. These calculations areupdated daily with current risk positions with the exception of Credit Valuation Adjustments (CVA) and certain other positionswhich are updated weekly.
Stressed Value-at-Risk (SVaR) – is calculated in an identical manner as VaR with the exception that it is computed using a fixedhistorical one year period of extreme volatility and its inverse rather than the most recent two year history. The stress period usedis the interval from September 2008 through August 2009. Stressed VaR is calculated weekly for all portfolios.
These measures are computed on all positions that are FVTPL for financial reporting purposes, with the exception of those in adesignated hedging relationship and those in our insurance businesses.
Market risk measures – FVTPL positions
VaR and SVaRThe following table presents our Market risk VaR and Market risk SVaR figures.
July 31, 2015 April 30, 2015 July 31, 2014
As atJul. 31
For thethree months ended As at
Apr. 30
For thethree months ended As at
Jul. 31
For thethree months ended
(Millions of Canadian dollars) Average High Low Average Average
Equity $ 13 $ 9 $ 17 $ 6 $ 9 $ 11 $ 9 $ 10Foreign exchange 5 4 7 3 4 4 1 2Commodities 4 3 6 3 3 4 2 2Interest rate (1) 29 29 34 23 26 29 19 22Credit specific (1) 8 8 8 8 8 8 8 8Diversification (2) (26) (22) (28) (16) (21) (22) (16) (18)
Market risk VaR $ 33 $ 31 $ 37 $ 26 $ 29 $ 34 $ 23 $ 26
Market risk SVaR $ 122 $ 91 $ 122 $ 73 $ 86 $ 105 $ 76 $ 87
July 31, 2015 July 31, 2014
As atJul. 31
For thenine months ended As at
Jul. 31
For thenine months ended
(Millions of Canadian dollars) Average High Low Average
Equity $ 13 $ 10 $ 20 $ 6 $ 9 $ 10Foreign exchange 5 4 7 3 1 2Commodities 4 4 6 3 2 3Interest rate (1) 29 28 34 23 19 29Credit specific (1) 8 8 9 7 8 9Diversification (2) (26) (21) (34) (15) (16) (21)
Market risk VaR $ 33 $ 33 $ 40 $ 26 $ 23 $ 32
Market risk SVaR $ 122 $ 101 $ 157 $ 73 $ 76 $ 97
(1) General credit spread risk is measured under interest rate VaR while credit specific risk captures issuer-specific credit spread volatility.(2) Market risk VaR is less than the sum of the individual risk factor VaR results due to portfolio diversification.
Q3 2015 vs. Q3 2014Average market risk VaR of $31 million was up $5 million compared to the prior year mainly reflecting an increase due to the impact offoreign exchange translation and higher exposure to our credit risk due to the implementation of valuation adjustments related tofunding costs on uncollateralized OTC derivatives (FVA) at the end of the fourth quarter of 2014.
Average SVaR of $91 million was up $4 million compared to the prior year, largely due to the implementation of FVA as notedabove and an increase due to the impact of foreign exchange translation. SVaR of $122 million as at July 31, 2015 was the highestlevel observed during the quarter, which was primarily driven by higher equity risk.
Q3 2015 vs. Q2 2015Average market risk VaR was down $3 million compared to the prior quarter, mainly due to the roll forward of the historical timeperiod used to calculate VaR, which no longer included the market volatility from the summer of 2013 when the Federal Reserve Boardsignalled the end of its quantitative easing program.

Royal Bank of Canada Third Quarter 2015 35
Average SVaR was down $14 million over the prior quarter, mainly driven by lower equity risk through the first half of the thirdquarter. SVaR of $122 million as at July 31, 2015 was the highest level observed during the quarter, which was mainly driven byhigher equity risk at the end of the quarter, and was consistent with levels observed during the second quarter of 2015.
Q3 2015 vs. Q3 2014 (Nine months ended)Average market risk VaR of $33 million increased $1 million compared to the prior year, mainly reflecting an increase due to theimpact of foreign exchange translation and the implementation of FVA as noted above.
Average SVaR of $101 million increased by $4 million compared to the prior year due to the impact of foreign exchangetranslation and the implementation of FVA as noted above.
The following chart graphically displays a bar chart of our daily trading profit and loss and a line chart of our daily Market risk VaR.There were no daily net trading losses during the quarter, as was also the case in the second quarter of 2015.
Daily Trading Revenue Market Risk VaR
Jul-2014
Oct-2014
Jul-2015
Jan-2015
Apr-2015
-60
-40
-20
20
40
60
Trading Revenue and VaR (Millions of Canadian dollars)
0
Market risk measures for other FVTPL positions – Assets and liabilities of RBC InsuranceWe offer a range of insurance products to clients and hold investments to meet the future obligations to policyholders. Theinvestments which support actuarial liabilities are predominantly fixed income assets designated as at FVTPL. Consequently, changesin the fair values of these assets are recorded in investment income in the consolidated statements of income and are largely offset bychanges in the fair value of the actuarial liabilities, the impact of which is reflected in insurance policyholder benefits and claims. Asat July 31, 2015, we had liabilities in respect to insurance obligations of $9.4 billion and trading securities of $7.5 billion in supportof the liabilities.
Market risk controls – Structural Interest Rate Risk (SIRR) positions(1)
The asset/liability mismatch of positions not marked-to-market is referred to as SIRR and is subject to a separate set of limits andcontrols. The Board of Directors approves the overall risk appetite for SIRR, and the Asset Liability Committee (ALCO) along with GRMprovide oversight for this risk through risk policies, limits, and operating standards. In addition, interest rate risk reports are reviewedregularly by GRM, ALCO, the Group Risk Committee, the Risk Committee of the Board and the Board of Directors.
Structural Interest Rate Risk measurementSIRR measures include the impact of interest rate changes to both one year’s net interest income and the instantaneous impact toeconomic value of equity. These measures are reported on a weekly basis and are subject to limits and controls set by ALCO and GRM.
We further supplement our assessment by measuring interest rate risk for a range of dynamic and static market scenarios.Dynamic scenarios simulate our interest income in response to various combinations of business and market factors. Business factorsinclude assumptions about future pricing strategies and volume and mix of new business, whereas market factors include assumedchanges in interest rate levels and changes in the shape of the yield curve. Static scenarios supplement dynamic scenarios and areemployed for assessing the risks to the value of equity and net interest income.
As part of our monitoring process, the effectiveness of our interest rate risk mitigation activity is assessed on value and earningsbases, and model assumptions are validated against actual client behavior.
(1) SIRR positions include impact of derivatives in hedge accounting relationships and AFS securities used for interest rate risk management.

36 Royal Bank of Canada Third Quarter 2015
Market risk measures – Structural Interest Rate PositionsThe following table provides the potential before-tax impact of an immediate and sustained 100 bps increase or decrease in interestrates on net interest income and economic value of equity of our non-trading portfolio, assuming that no further hedging isundertaken. These measures are based upon assumptions made by senior management and validated by empirical research. Allinterest rate risk measures are based upon interest rate exposures at a specific time and continuously change as a result of businessactivities and our risk management actions. During the third quarter of 2015, our interest rate risk exposure was within our targetlevel.
July 31
2015April 30
2015July 31
2014Economic value of equity risk Net interest income risk (2)
(Millions of Canadian dollars)
Canadiandollar
impact
U.S.dollar
impact (1) Total
Canadiandollar
impact
U.S.dollar
impact (1) Total
Economicvalue of
equity riskNet interest
income risk (2)
Economicvalue of
equity riskNet interest
income risk (2)
Before-tax impact of:100bps increase in rates $ (884) $ (9) $ (893) $ 326 $ 11 $ 337 $ (877) $ 357 $ (827) $ 394100bps decrease in rates 566 – 566 (313) (6) (319) 622 (353) 685 (321)
(1) Represents the impact on the non-trading portfolios held in our U.S. banking operations.(2) Represents the 12-month Net interest income exposure to an instantaneous and sustained shift in interest rates.
Market risk measures for other material non-trading portfolios
AFS securitiesWe held $60 billion of securities classified as AFS as at July 31, 2015, which is up from $50 billion in the prior quarter. We hold debtsecurities designated as AFS primarily as investments and to manage liquidity and interest rate risk in our non-trading bankingactivity. Certain legacy debt portfolios are also classified as AFS. As at July 31, 2015, our portfolio of AFS securities exposes us tointerest rate risk of a pre-tax loss of $8.6 million as measured by the change in the value of the securities for a one basis point parallelincrease in yields. The portfolio also exposes us to credit spread risk of a pre-tax loss of $18.6 million, as measured by the change invalue for a one basis point widening of credit spreads. Changes in the value of these securities are reported in other comprehensiveincome. The value of the AFS securities included in our Structural Interest Rate Risk measure as at July 31, 2015 was $50.2 billion, upfrom $46.9 billion as at April 30, 2015. Our AFS securities also include equity exposures of $1.8 billion as at July 31, 2015, up from$1.7 billion in the prior quarter.
Derivatives related to non-trading activityWe use derivatives to hedge market risk exposures unrelated to our trading activity. In aggregate, derivative assets not related totrading activity of $7.7 billion as at July 31, 2015 were up from $5.7 billion last quarter, and derivative liabilities of $4.5 billion as atJuly 31, 2015 were up from $3.6 billion in last quarter.
Non-trading derivatives in hedge accounting relationshipsThe derivative assets and liabilities described above included derivative assets in a designated hedge accounting relationship of$2.7 billion as at July 31, 2015, up from $2.6 billion in the last quarter, and derivative liabilities of $2.4 billion as at July 31, 2015, upfrom $1.7 billion in the last quarter. These derivative assets and liabilities are included in our Structural Interest Rate Risk measure.We use interest rate swaps to manage our AFS securities and structural interest rate risk, as described above. To the extent theseswaps are considered effective hedges, changes in their fair value are recognized in other comprehensive income. The interest raterisk for the designated cash flow hedges, measured as the change in the fair value of the derivatives for a one basis point parallelincrease in yields, was $5.8 million as of July 31, 2015.
We also use interest rate swaps to hedge changes in the fair value of certain fixed-rate instruments. Changes in fair value of theinterest rate swaps and the hedged instruments that are related to interest rate movements are reflected in income.
We also use foreign exchange derivatives to manage our exposure to equity investments in subsidiaries that are denominated inforeign currencies, particularly the U.S. dollar and British pound. Changes in the fair value of these hedges and the cumulativetranslation adjustment related to our structural foreign exchange risk are reported in other comprehensive income.
Other non-trading derivativesWe use derivatives including interest rate swaps and foreign exchange derivatives that are not in designated hedge accountingrelationships to manage other non-trading exposures. These derivatives have been designated as fair value through profit and losswith changes in the fair value of these derivatives reflected in income. Derivative assets of $5 billion as at July 31, 2015 on thesetrades were up from $3.1 billion last quarter, and derivative liabilities of $2.1 billion as at July 31, 2015 were up from $1.9 billionlast quarter.
Non-trading foreign exchange rate riskForeign exchange rate risk is the potential adverse impact on earnings and economic value due to changes in foreign currency rates.Our revenue, expenses and income denominated in currencies other than the Canadian dollar are subject to fluctuations as a result ofchanges in the value of the average Canadian dollar relative to the average value of those currencies. Our most significant exposure isto the U.S. dollar, due to our level of operations in the U.S. and other activities conducted in U.S. dollars. Other significant exposuresare to the British pound and the Euro, due to our activities conducted internationally in these currencies. A strengthening orweakening of the Canadian dollar compared to the U.S. dollar, British pound and the Euro could reduce or increase, as applicable,the translated value of our foreign currency denominated revenue, expenses and earnings and could have a significant effect on theresults of our operations. We are also exposed to foreign exchange rate risk arising from our investments in foreign operations. For

Royal Bank of Canada Third Quarter 2015 37
un-hedged equity investments, when the Canadian dollar appreciates against other currencies, the unrealized translation losses onnet foreign investments decreases our shareholders’ equity through the other components of equity and decreases the translatedvalue of the RWA of the foreign currency-denominated asset. The reverse is true when the Canadian dollar depreciates against othercurrencies. Consequently, we consider these impacts in selecting an appropriate level of our investments in foreign operations to behedged.
Our overall trading and non-trading market risk objectives, policies and methodologies have not changed significantly from 2014.
Linkage of market risk to selected balance sheet itemsThe following table provides the linkages between selected balance sheet items with positions included in our trading market risk andnon-trading market risk disclosures, which illustrates how we manage market risk for our assets and liabilities through different riskmeasures.
As at July 31, 2015
Market risk measure
(Millions of Canadian dollars)Balance sheet
amount Traded risk (1)Non-traded
risk (2)Non-traded risk
primary risk sensitivity
Assets subject to market riskCash and due from banks (3) $ 19,976 $ 12,697 $ 7,279 Interest rateInterest-bearing deposits with banks (4) 10,731 5,103 5,628 Interest rateSecurities
Trading (5) 172,370 164,483 7,887 Interest rate, credit spreadAvailable-for-sale (6) 63,145 – 63,145 Interest rate, credit spread, equity
Assets purchased under reverse repurchase agreements andsecurities borrowed (7) 172,659 172,469 190 Interest rate
LoansRetail (8) 343,463 15,828 327,635 Interest rateWholesale (9) 121,214 144 121,070 Interest rateAllowance for loan losses (2,078) – (2,078) Interest rate
Segregated fund net assets (10) 821 – 821 Interest rateDerivatives 112,459 104,783 7,676 Interest rate, foreign exchangeOther assets (11) 64,695 23,313 41,382 Interest rateAssets not subject to market risk (12) 5,718
Total assets $ 1,085,173 $ 498,820 $ 580,635
Liabilities subject to market riskDeposits (13) $ 694,236 $ 160,953 $ 533,283 Interest rateSegregated fund liabilities (14) 821 – 821 Interest rateOther
Obligations related to securities sold short 55,656 55,656 –Obligations related to assets sold under repurchase
agreements and securities loaned (15) 83,236 83,055 181 Interest rateDerivatives 116,083 111,548 4,535 Interest rate, foreign exchangeOther liabilities (16) 59,156 18,573 40,583 Interest rate
Subordinated debentures 7,374 – 7,374 Interest rateLiabilities not subject to market risk (17) 6,713
Total liabilities $ 1,023,275 $ 429,785 $ 586,777
Total equity $ 61,898
Total liabilities and equity $ 1,085,173
(1) Traded risk includes FVTPL positions whose revaluation gains and losses are reported in revenue. Market risk measures of VaR, SVaR and Stress testing are used as risk controls for traded risk.(2) Non-traded risk includes positions used in the management of the SIRR and other non-trading portfolios. Other material non-trading portfolios include positions from our Insurance business and
AFS securities not included in SIRR.The following footnotes provide additional information on the Non-traded risk amounts:(3) Cash and due from banks includes $6,104 million included in SIRR. An additional $1,175 million is included in other risk controls.(4) Interest-bearing deposits with banks of $5,628 million are included in SIRR.(5) Trading securities include $7,887 million in securities used in the management of the SIRR of RBC Insurance, which is not included in our disclosed SIRR measure.(6) Includes available-for-sale securities of $59,842 million and held-to-maturity securities of $3,303 million. $53,468 million of the total securities are included in SIRR. An additional $1,834 million
are held by our insurance businesses that do not contribute to our disclosed SIRR measures. The remaining $7,844 million are captured in other internal non-trading market risk reporting.(7) Assets purchased under reverse repurchase agreements include $190 million reflected in SIRR.(8) Retail loans include $327,638 million reflected in SIRR.(9) Wholesale loans include $119,666 million reflected in SIRR. An additional $1,404 million is used in the management of the SIRR of RBC Insurance.(10) Investments for the account of segregated fund holders are included in the management of the SIRR of RBC Insurance.(11) Other assets include $38,732 million reflected in SIRR. An additional $2,650 million is used in the management of the SIRR of RBC Insurance.(12) Assets not subject to market risk include $5,718 million of physical and other assets.(13) Deposits include $533,283 million reflected in SIRR.(14) Insurance and investment contracts for the account of segregated fund holders are included in the management of the SIRR of RBC Insurance.(15) Obligations related to assets sold under repurchase agreements include $181 million reflected in SIRR.(16) Other liabilities include $10,269 million used in the management of the SIRR of RBC Insurance, and $30,314 million contribute to our SIRR measure.(17) Liabilities not subject to market risk include $6,713 million of payroll related and other liabilities.

38 Royal Bank of Canada Third Quarter 2015
As at April 30, 2015
Market risk measure
(Millions of Canadian dollars)Balance sheet
amount Traded risk (1)Non-traded
risk (2)Non-traded risk
primary risk sensitivity
Assets subject to market riskCash and due from banks (3) $ 18,393 $ 10,431 $ 7,962 Interest rateInterest-bearing deposits with banks (4) 4,402 784 3,618 Interest rateSecurities
Trading (5) 169,763 162,380 7,383 Interest rate, credit spreadAvailable-for-sale (6) 52,880 – 52,880 Interest rate, credit spread, equity
Assets purchased under reverse repurchase agreements andsecurities borrowed (7) 163,368 163,250 118 Interest rate
LoansRetail (8) 336,064 15,792 320,272 Interest rateWholesale (9) 114,283 272 114,011 Interest rateAllowance for loan losses (2,037) – (2,037) Interest rate
Segregated fund net assets (10) 780 – 780 Interest rateDerivatives 107,004 101,296 5,708 Interest rate, foreign exchangeOther assets (11) 60,354 22,029 38,325 Interest rateAssets not subject to market risk (12) 6,918
Total assets $ 1,032,172 $ 476,234 $ 549,020
Liabilities subject to market riskDeposits (13) $ 651,551 $ 142,353 $ 509,198 Interest rateSegregated fund liabilities (14) 780 – 780 Interest rateOther
Obligations related to securities sold short 54,314 54,314 –Obligations related to assets sold under repurchase
agreements and securities loaned (15) 81,207 81,097 110 Interest rateDerivatives 112,219 108,610 3,609 Interest rate, foreign exchangeOther liabilities (16) 58,206 17,965 40,241 Interest rate
Subordinated debentures 7,795 – 7,795 Interest rateLiabilities not subject to market risk (17) 7,853
Total liabilities $ 973,925 $ 404,339 $ 561,733
Total equity $ 58,247
Total liabilities and equity $ 1,032,172
(1) Traded risk includes FVTPL positions whose revaluation gains and losses are reported in revenue. Market risk measures of VaR, SVaR and Stress testing are used as risk controls for traded risk.(2) Non-traded risk includes positions used in the management of the SIRR and other non-trading portfolios. Other material non-trading portfolios include positions from our Insurance business and
AFS securities not included in SIRR.The following footnotes provide additional information on the Non-traded risk amounts:(3) Cash and due from banks includes $7,134 million included in SIRR. An additional $828 million is included in other risk controls.(4) Interest-bearing deposits with banks of $3,618 million are included in SIRR.(5) Trading securities include $7,383 million in securities used in the management of the SIRR of RBC Insurance, which is not included in our disclosed SIRR measure.(6) Available-for-sale securities of $50,053 million are included in SIRR. An additional $2,827 million are held by our insurance businesses that do not contribute to our disclosed SIRR measures and
certain legacy assets.(7) Assets purchased under reverse repurchase agreements include $118 million reflected in SIRR.(8) Retail loans include $320,276 million reflected in SIRR.(9) Wholesale loans include $112,757 million reflected in SIRR. An additional $1,254 million is used in the management of the SIRR of RBC Insurance.(10) Investments for the account of segregated fund holders are included in the management of the SIRR of RBC Insurance.(11) Other assets include $35,642 million reflected in SIRR. An additional $2,683 million is used in the management of the SIRR of RBC Insurance.(12) Assets not subject to market risk include $6,918 million of physical and other assets.(13) Deposits include $509,198 million reflected in SIRR.(14) Insurance and investment contracts for the account of segregated fund holders are included in the management of the SIRR of RBC Insurance.(15) Obligations related to assets sold under repurchase agreements include $110 million reflected in SIRR.(16) Other liabilities include $10,151 million used in the management of the SIRR of RBC Insurance, and $30,090 million contribute to our SIRR measure.(17) Liabilities not subject to market risk include $7,853 million of payroll related and other liabilities.
Liquidity and funding risk
There have been no material changes to our Liquidity Management Framework from the framework described in our 2014 AnnualReport. We continue to maintain liquidity and funding that is appropriate for the execution of our strategy and, as appropriate, modifyour risk policies, practices and processes to align with regulatory developments and to position ourselves for prospective regulatoryreforms. Our liquidity and funding risk remains well within our risk appetite.
Regulatory environmentIn May 2014, OSFI issued the final version of the “Liquidity Adequacy Requirements (LAR)” guideline. The LAR guideline aims toconvert the BCBS liquidity requirements, including the Liquidity Coverage Ratio (LCR) and Net Stable Funding Ratio (NSFR) liquiditymetrics together with monitoring tools, into OSFI guidance and formalize the use of the OSFI-designed Net Cumulative Cash Flow(NCCF) as a supervisory monitoring tool. Consistent with these requirements, we are submitting monthly LCR and NCCF reports andquarterly NSFR results to OSFI as well as Quantitative Impact Study reports on LCR and NSFR for OSFI and BCBS twice a year.
In August 2014, the Government of Canada’s Department of Finance released its bail-in consultation paper “Taxpayer Protectionand Bank Recapitalization Regime”. Bail-in regimes are being implemented in a number of jurisdictions following the 2008 financialcrisis in an effort to limit taxpayer exposure to potential losses of a failing institution and ensure the institution’s shareholders andcreditors remain responsible for bearing such losses. The proposed regime applies only to D-SIBs and focuses on a specific range of

Royal Bank of Canada Third Quarter 2015 39
liabilities and excludes deposits. In its April 21, 2015 Federal Budget announcement, the Government of Canada confirmed itsintention to move forward with the Taxpayer Protection and Bank Recapitalization Regime, although no firm timeline was provided.
In October 2014, the BCBS issued the final standard for the NSFR and banks are required to meet the minimum standard byJanuary 1, 2018. The final “Net stable funding ratio disclosure standards” document was issued by the BCBS in June 2015 and bankswill be required to comply with them from the date of the first reporting period after January 1, 2018.
Risk measurementTo monitor and control risk within appropriate tolerances, limits are set on various metrics reflecting a range of time horizons andseverity of stress conditions. Risk methodologies and underlying assumptions are periodically reviewed and validated to ensurealignment with our operating environment, expected economic and market conditions, rating agency preferences, regulatoryrequirements and accepted practices.
Liquidity risk is measured using contractual maturity dates for some assets and liabilities (e.g., wholesale lending and funding)and effective maturity for others. In the effective maturity approach, the liquidity value of assets and liabilities is determined based onobserved behavioural or market-based patterns unrelated to contractual maturity. For example, effective maturity may be shorter thancontractual maturity if the demonstrated behaviour of the asset suggests that it can be monetized before maturity. Effective maturityfor a liability may be longer than contractual maturity if the demonstrated behaviour of the liability suggests that it will be extended orrolled over at maturity. Specific examples include government bonds for assets as they can be quickly and reliably monetized andrelationship-based deposits for liabilities where a significant portion is typically assigned core value although contractual maturitydates may be quite short or even legally characterized as available on demand (conversely, demand loans display attributes of longerterm assets and are treated accordingly from an effective maturity perspective). Internally derived assumptions consider all relevantmaterial and available data, information and methods of quantifying liquidity risk.
For further details on our methodologies and measurement, refer to the Liquidity and funding risk section of our 2014 AnnualReport.
Risk profileAs at July 31, 2015, relationship-based deposits as internally defined, which are the primary source of funding for retail loans andmortgages, were $419 billion or 50% of our total funding (April 30, 2015 – $406 billion or 51%). Funding for highly liquid assetsconsisted primarily of short-term wholesale funding that reflects the expected monetization period of these assets. This wholesalefunding comprised unsecured short-term liabilities of $108 billion and secured (repos and short sales) liabilities of $157 billion, andrepresented 13% and 19% of total funding as at July 31, 2015, respectively (April 30, 2015 – $91 billion and $150 billion or 11% and19% of total funding, respectively). Long-term wholesale funding is mostly used to fund less liquid wholesale assets. Additionalquantitative information is provided in the Funding section below.
As at July 31, 2015, we held earmarked contingency liquidity assets of $13 billion, of which $8 billion was in U.S. currency and$5 billion was in Canadian currency (April 30, 2015 – $13 billion of which $8 billion was in U.S. currency and $5 billion was inCanadian currency). During the quarter ended July 31, 2015, we held on average $13 billion, of which $8 billion was in U.S. currencyand $5 billion was in Canadian currency (April 30, 2015 – $13 billion of which $8 billion was in U.S. currency and $5 billion was inCanadian currency). We also held a derivatives pledging liquid asset buffer of US$4 billion as at July 31, 2015 to mitigate the volatilityof our net pledging requirements for derivatives trading (April 30, 2015 – US$4 billion). This buffer averaged US$4 billion during thequarter ended July 31, 2015 (April 30, 2015 – US$4 billion). These assets are included in our high-quality liquid asset (HQLA) pool,which is discussed below.
Liquidity Coverage Ratio (LCR)The Liquidity Coverage Ratio, is a Basel III metric that measures the sufficiency of HQLA available to meet net short-term financialobligations over a thirty day period in an acute stress scenario. The BCBS regulatory minimum coverage level for LCR is currently 60%,increasing each year to 100% by January 2019. In May 2014, OSFI released the final LAR guideline and adopted a minimum LCRrequirement of 100% for Canadian banks, effective January 1, 2015.
In July 2014, OSFI released the final guideline on “Public Disclosure Requirements for Domestic Systemically Important Banks onLiquidity Coverage Ratio (LCR)”, implementing without change the BCBS LCR Disclosure Standards. OSFI required Canadian banks todisclose the LCR beginning in Q2 2015. LCR is disclosed using the standard Basel disclosure template and is calculated using theaverage of month-end positions during the quarter.
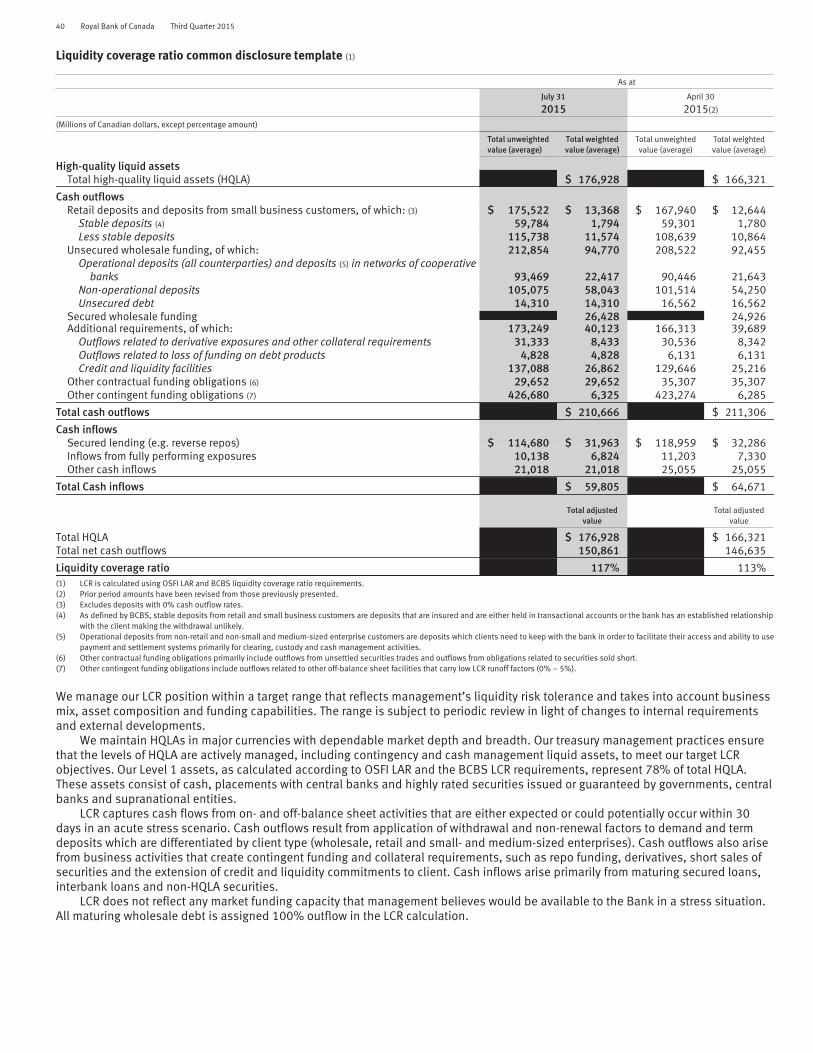
40 Royal Bank of Canada Third Quarter 2015
Liquidity coverage ratio common disclosure template (1)
As at
July 31
2015April 30
2015(2)
(Millions of Canadian dollars, except percentage amount)
Total unweightedvalue (average)
Total weightedvalue (average)
Total unweightedvalue (average)
Total weightedvalue (average)
High-quality liquid assetsTotal high-quality liquid assets (HQLA) $ 176,928 $ 166,321
Cash outflowsRetail deposits and deposits from small business customers, of which: (3) $ 175,522 $ 13,368 $ 167,940 $ 12,644
Stable deposits (4) 59,784 1,794 59,301 1,780Less stable deposits 115,738 11,574 108,639 10,864
Unsecured wholesale funding, of which: 212,854 94,770 208,522 92,455Operational deposits (all counterparties) and deposits (5) in networks of cooperative
banks 93,469 22,417 90,446 21,643Non-operational deposits 105,075 58,043 101,514 54,250Unsecured debt 14,310 14,310 16,562 16,562
Secured wholesale funding 26,428 24,926Additional requirements, of which: 173,249 40,123 166,313 39,689
Outflows related to derivative exposures and other collateral requirements 31,333 8,433 30,536 8,342Outflows related to loss of funding on debt products 4,828 4,828 6,131 6,131Credit and liquidity facilities 137,088 26,862 129,646 25,216
Other contractual funding obligations (6) 29,652 29,652 35,307 35,307Other contingent funding obligations (7) 426,680 6,325 423,274 6,285
Total cash outflows $ 210,666 $ 211,306
Cash inflowsSecured lending (e.g. reverse repos) $ 114,680 $ 31,963 $ 118,959 $ 32,286Inflows from fully performing exposures 10,138 6,824 11,203 7,330Other cash inflows 21,018 21,018 25,055 25,055
Total Cash inflows $ 59,805 155,217 $ 64,671
Total adjustedvalue
Total adjustedvalue
Total HQLA $ 176,928 $ 166,321Total net cash outflows 150,861 146,635
Liquidity coverage ratio 117% 113%(1) LCR is calculated using OSFI LAR and BCBS liquidity coverage ratio requirements.(2) Prior period amounts have been revised from those previously presented.(3) Excludes deposits with 0% cash outflow rates.(4) As defined by BCBS, stable deposits from retail and small business customers are deposits that are insured and are either held in transactional accounts or the bank has an established relationship
with the client making the withdrawal unlikely.(5) Operational deposits from non-retail and non-small and medium-sized enterprise customers are deposits which clients need to keep with the bank in order to facilitate their access and ability to use
payment and settlement systems primarily for clearing, custody and cash management activities.(6) Other contractual funding obligations primarily include outflows from unsettled securities trades and outflows from obligations related to securities sold short.(7) Other contingent funding obligations include outflows related to other off-balance sheet facilities that carry low LCR runoff factors (0% – 5%).
We manage our LCR position within a target range that reflects management’s liquidity risk tolerance and takes into account businessmix, asset composition and funding capabilities. The range is subject to periodic review in light of changes to internal requirementsand external developments.
We maintain HQLAs in major currencies with dependable market depth and breadth. Our treasury management practices ensurethat the levels of HQLA are actively managed, including contingency and cash management liquid assets, to meet our target LCRobjectives. Our Level 1 assets, as calculated according to OSFI LAR and the BCBS LCR requirements, represent 78% of total HQLA.These assets consist of cash, placements with central banks and highly rated securities issued or guaranteed by governments, centralbanks and supranational entities.
LCR captures cash flows from on- and off-balance sheet activities that are either expected or could potentially occur within 30days in an acute stress scenario. Cash outflows result from application of withdrawal and non-renewal factors to demand and termdeposits which are differentiated by client type (wholesale, retail and small- and medium-sized enterprises). Cash outflows also arisefrom business activities that create contingent funding and collateral requirements, such as repo funding, derivatives, short sales ofsecurities and the extension of credit and liquidity commitments to client. Cash inflows arise primarily from maturing secured loans,interbank loans and non-HQLA securities.
LCR does not reflect any market funding capacity that management believes would be available to the Bank in a stress situation.All maturing wholesale debt is assigned 100% outflow in the LCR calculation.

Royal Bank of Canada Third Quarter 2015 41
Q3 2015 vs. Q2 2015LCR of 117% increased from 113% in the prior quarter, primarily due to higher HQLA, and growth in client deposits and other fundingsources receiving favourable treatment under the OSFI LAR guidelines.
Liquidity reserve and asset encumbranceAs recommended by the Enhanced Disclosure Task Force (EDTF), the following tables provide summaries of our liquidity reserve andasset encumbrance. Unencumbered assets represent, for the most part, a ready source of funding that can be accessed quickly, whenrequired. In the Liquidity reserve table, available liquid assets consist of on-balance sheet cash and securities holdings as well assecurities received as collateral from securities financing (reverse repos and off-balance sheet collateral swaps) and derivativetransactions and constitute the preferred source for quickly accessing liquidity. The other component of our liquidity reserve consistsprimarily of uncommitted and undrawn central bank credit facilities that could be accessed under exceptional circumstances providedcertain pre-conditions could be met and where advances could be supported by eligible assets (e.g. certain unencumbered loans) notincluded in the liquid assets category. The Asset encumbrance table provides a comprehensive view of the assets available to theBank, not just the liquidity reserve, and identifies assets already pledged as well as those available for use as collateral (includingunencumbered assets from the Liquidity reserve table) for secured funding purposes. Less liquid assets such as mortgages and creditcard receivables can in part be monetised although require more lead time relative to liquid assets. As at July 31, 2015, our assetsavailable as collateral comprised 62% of our total liquid assets. For the purpose of constructing the following tables, encumberedassets include: (i) bank-owned liquid assets that are either pledged as collateral (e.g., repo financing and derivative pledging) or notfreely available due to regulatory or internal policy requirements (e.g., earmarked to satisfy mandatory reserve or local capitaladequacy requirements and to maintain continuous access to payment and settlement systems); (ii) securities received as collateralfrom securities financing and derivative transactions which have either been re-hypothecated where permissible (e.g., to obtainfinancing through repos or to cover securities sold short) or have no liquidity value since re-hypothecation is prohibited; and(iii) illiquid assets that have been securitized and sold into the market or that have been pledged as collateral in support of structuredterm funding vehicles. We do not include encumbered assets as a source of available liquidity in measuring liquidity risk.Unencumbered assets are the difference between total and encumbered assets from both on- and off-balance sheet sources.

42 Royal Bank of Canada Third Quarter 2015
Liquidity reserve (1)
As at July 31, 2015
(Millions of Canadian dollars)Bank-ownedliquid assets
Securities receivedas collateral from
securities financingand derivative
transactionsTotal liquid
assetsEncumberedliquid assets
Unencumberedliquid assets
Cash and holding at central banks $ 20,656 $ – $ 20,656 $ 1,211 $ 19,445Deposits in other banks available overnight 2,783 – 2,783 501 2,282Securities issued or guaranteed by sovereigns, central banks or
multilateral development banks (2), (3) 256,313 20,079 276,392 139,335 137,057Other (2) 153,113 30,825 183,938 82,519 101,419
Liquidity assets eligible at central banks (not included above) (4) 65 – 65 – 65Undrawn credit lines granted by central banks (5) 10,621 – 10,621 – 10,621Other assets eligible as collateral for discount (6) 125,985 – 125,985 – 125,985Other liquid assets (7) 20,682 – 20,682 20,682 –
Total liquid assets $ 590,218 $ 50,904 $ 641,122 $ 244,248 $ 396,874
(Millions of Canadian dollars)
As at April 30, 2015
Bank-ownedliquid assets
Securities receivedas collateral from
securities financingand derivative
transactionsTotal liquid
assetsEncumberedliquid assets
Unencumberedliquid assets
Cash and holding at central banks $ 14,655 $ – $ 14,655 $ 1,179 $ 13,476Deposits in other banks available overnight 3,640 – 3,640 572 3,068Securities issued or guaranteed by sovereigns, central banks or
multilateral development banks (2), (3) 244,976 19,133 264,109 137,090 127,019Other (2) 145,227 31,928 177,155 76,169 100,986
Liquidity assets eligible at central banks (not included above) (4) 64 – 64 – 64Undrawn credit lines granted by central banks (5) 9,420 – 9,420 – 9,420Other assets eligible as collateral for discount (6) 125,311 – 125,311 – 125,311Other liquid assets (7) 18,571 – 18,571 18,571 –
Total liquid assets $ 561,864 $ 51,061 $ 612,925 $ 233,581 $ 379,344
As at
(Millions of Canadian dollars)
July 31
2015April 30
2015
Royal Bank of Canada $ 248,299 $ 231,244Foreign branches 56,223 54,522Subsidiaries 92,352 93,578
Total unencumbered liquid assets $ 396,874 $ 379,344
(1) Information is provided from an enterprise-wide perspective and amounts shown are based on face value. In managing liquidity risk, we consider legal, regulatory, tax and other constraints that mayimpede transferability of liquidity among RBC units.
(2) The Bank-owned liquid assets amount includes securities owned outright by the bank or acquired via on-balance sheet securities finance transactions.(3) Includes liquid securities issued by provincial governments and U.S. government sponsored entities working under U.S. Federal government’s conservatorship (e.g. Federal National Mortgage
Association and Federal Home Loan Mortgage Corporation).(4) Includes Auction Rate Securities.(5) Includes loans that qualify as eligible collateral for the discount window facility available to us at the Federal Reserve Bank of New York. Amounts are face value and would be subject to collateral
margin requirements applied by the Federal Reserve Bank to determine collateral value/borrowing capacity. Access to the discount window borrowing program is conditional on meetingrequirements set by the Federal Reserve Bank and borrowings are typically expected to be infrequent and due to uncommon occurrences requiring temporary accommodation.
(6) Represents our unencumbered Canadian dollar non-mortgage loan book (at face value) that could, subject to satisfying conditions precedent to borrowing and application of prescribed collateralmargin requirements, be pledged to the Bank of Canada for advances under its Emergency Lending Assistance (ELA) program. ELA and other central bank facilities are not considered sources ofavailable liquidity in our normal liquidity risk profile but could in extraordinary circumstances, where normal market liquidity is seriously impaired, allow us and other banks to monetize assetseligible as central bank collateral to meet requirements and mitigate further market liquidity disruption.
(7) Represents pledges related to OTC and exchange-traded derivative transactions.
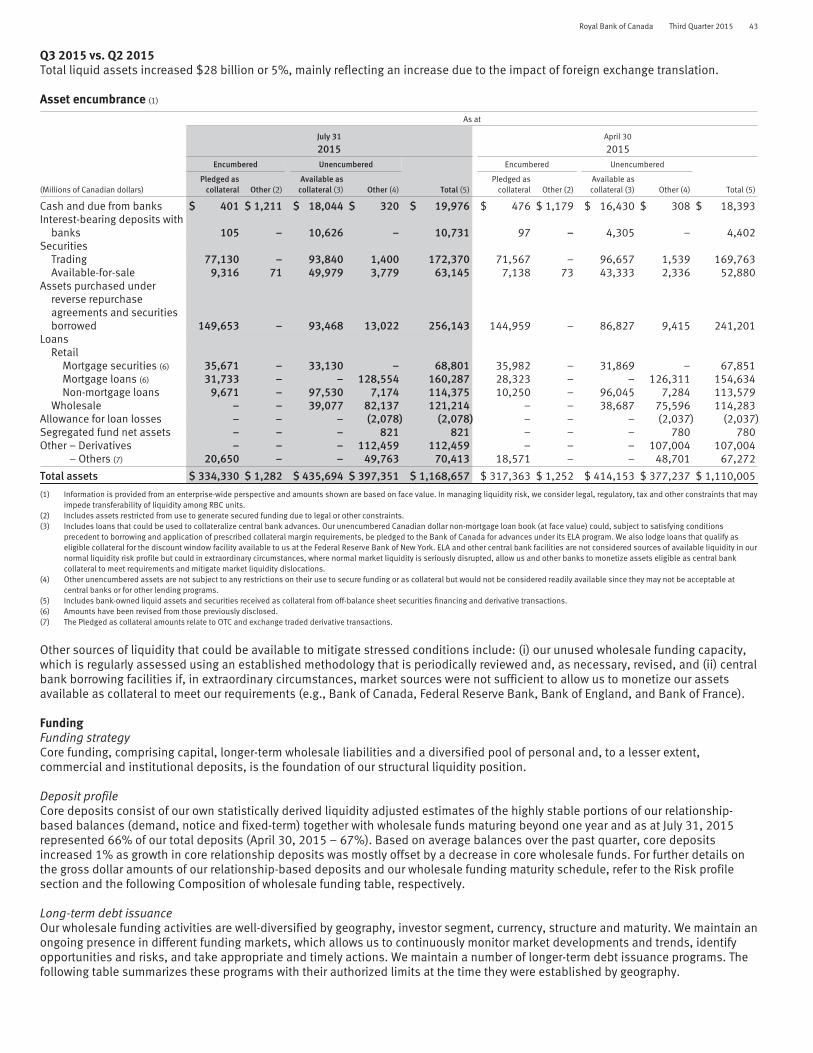
Royal Bank of Canada Third Quarter 2015 43
Q3 2015 vs. Q2 2015Total liquid assets increased $28 billion or 5%, mainly reflecting an increase due to the impact of foreign exchange translation.
Asset encumbrance (1)
As at
July 31
2015April 30
2015Encumbered Unencumbered Encumbered Unencumbered
(Millions of Canadian dollars)Pledged as
collateral Other (2)Available as
collateral (3) Other (4) Total (5)Pledged as
collateral Other (2)Available ascollateral (3) Other (4) Total (5)
Cash and due from banks $ 401 $ 1,211 $ 18,044 $ 320 $ 19,976 $ 476 $ 1,179 $ 16,430 $ 308 $ 18,393Interest-bearing deposits with
banks 105 – 10,626 – 10,731 97 – 4,305 – 4,402Securities
Trading 77,130 – 93,840 1,400 172,370 71,567 – 96,657 1,539 169,763Available-for-sale 9,316 71 49,979 3,779 63,145 7,138 73 43,333 2,336 52,880
Assets purchased underreverse repurchaseagreements and securitiesborrowed 149,653 – 93,468 13,022 256,143 144,959 – 86,827 9,415 241,201
LoansRetail
Mortgage securities (6) 35,671 – 33,130 – 68,801 35,982 – 31,869 – 67,851Mortgage loans (6) 31,733 – – 128,554 160,287 28,323 – – 126,311 154,634Non-mortgage loans 9,671 – 97,530 7,174 114,375 10,250 – 96,045 7,284 113,579
Wholesale – – 39,077 82,137 121,214 – – 38,687 75,596 114,283Allowance for loan losses – – – (2,078) (2,078) – – – (2,037) (2,037)Segregated fund net assets – – – 821 821 – – – 780 780Other – Derivatives – – – 112,459 112,459 – – – 107,004 107,004
– Others (7) 20,650 – – 49,763 70,413 18,571 – – 48,701 67,272
Total assets $ 334,330 $ 1,282 $ 435,694 $ 397,351 $ 1,168,657 $ 317,363 $ 1,252 $ 414,153 $ 377,237 $ 1,110,005
(1) Information is provided from an enterprise-wide perspective and amounts shown are based on face value. In managing liquidity risk, we consider legal, regulatory, tax and other constraints that mayimpede transferability of liquidity among RBC units.
(2) Includes assets restricted from use to generate secured funding due to legal or other constraints.(3) Includes loans that could be used to collateralize central bank advances. Our unencumbered Canadian dollar non-mortgage loan book (at face value) could, subject to satisfying conditions
precedent to borrowing and application of prescribed collateral margin requirements, be pledged to the Bank of Canada for advances under its ELA program. We also lodge loans that qualify aseligible collateral for the discount window facility available to us at the Federal Reserve Bank of New York. ELA and other central bank facilities are not considered sources of available liquidity in ournormal liquidity risk profile but could in extraordinary circumstances, where normal market liquidity is seriously disrupted, allow us and other banks to monetize assets eligible as central bankcollateral to meet requirements and mitigate market liquidity dislocations.
(4) Other unencumbered assets are not subject to any restrictions on their use to secure funding or as collateral but would not be considered readily available since they may not be acceptable atcentral banks or for other lending programs.
(5) Includes bank-owned liquid assets and securities received as collateral from off-balance sheet securities financing and derivative transactions.(6) Amounts have been revised from those previously disclosed.(7) The Pledged as collateral amounts relate to OTC and exchange traded derivative transactions.
Other sources of liquidity that could be available to mitigate stressed conditions include: (i) our unused wholesale funding capacity,which is regularly assessed using an established methodology that is periodically reviewed and, as necessary, revised, and (ii) centralbank borrowing facilities if, in extraordinary circumstances, market sources were not sufficient to allow us to monetize our assetsavailable as collateral to meet our requirements (e.g., Bank of Canada, Federal Reserve Bank, Bank of England, and Bank of France).
FundingFunding strategyCore funding, comprising capital, longer-term wholesale liabilities and a diversified pool of personal and, to a lesser extent,commercial and institutional deposits, is the foundation of our structural liquidity position.
Deposit profileCore deposits consist of our own statistically derived liquidity adjusted estimates of the highly stable portions of our relationship-based balances (demand, notice and fixed-term) together with wholesale funds maturing beyond one year and as at July 31, 2015represented 66% of our total deposits (April 30, 2015 – 67%). Based on average balances over the past quarter, core depositsincreased 1% as growth in core relationship deposits was mostly offset by a decrease in core wholesale funds. For further details onthe gross dollar amounts of our relationship-based deposits and our wholesale funding maturity schedule, refer to the Risk profilesection and the following Composition of wholesale funding table, respectively.
Long-term debt issuanceOur wholesale funding activities are well-diversified by geography, investor segment, currency, structure and maturity. We maintain anongoing presence in different funding markets, which allows us to continuously monitor market developments and trends, identifyopportunities and risks, and take appropriate and timely actions. We maintain a number of longer-term debt issuance programs. Thefollowing table summarizes these programs with their authorized limits at the time they were established by geography.

44 Royal Bank of Canada Third Quarter 2015
Programs by geography
Canada U.S. Europe/Asia
• Canadian Shelf – $15 billion • SEC Registered Medium Term NoteProgram – US$40 billion
• European Debt Issuance Program –US$40 billion
• SEC Registered Covered Bond Program –US$15 billion (1)
• Global Covered Bond Program –Euro 32 billion
• Japanese Issuance Programs –JPY 1 trillion
(1) Subject to the Euro 32 billion Global Covered Bond Program limit.
We also raise long-term funding using Canadian Deposit Notes, Canadian NHA MBS, Canada Mortgage Bonds, credit card receivable-backed securities, Kangaroo Bonds (issued in the Australian domestic market by foreign firms) and Yankee Certificates of Deposit(issued in the U.S. domestic market by foreign firms). We continuously evaluate expansion into new markets and untapped investorsegments against relative issuance costs since diversification expands our wholesale funding flexibility and minimizes fundingconcentration and dependency, and generally reduces financing costs. As presented in the following charts, our current long-termdebt profile is well diversified by currency as well as by type of long-term funding products. Maintaining competitive credit ratings isalso critical to cost-effective funding.
Long-term debt (1) – funding mix by currency of issuance ($ 147 billion as at July 31, 2015)
Euro8%
Other6%
U.S. dollar48%
Canadian dollar38%
Long-term debt (1) – funding mix by product($ 147 billion as at July 31, 2015)
Cards and autosecuritization
7%
Covered Bonds22%
MBS/CMB (2)
16%
Unsecured funding55%
(1) Based on original term to maturity greater than 1 year(2) Mortgage-backed securities and Canada Mortgage Bonds

Royal Bank of Canada Third Quarter 2015 45
The following table provides our composition of wholesale funding based on remaining term to maturity and represents our enhanceddisclosure in response to EDTF recommendations.
Composition of wholesale funding (1)
As at July 31, 2015
(Millions of Canadian dollars)Less than
1 month1 to 3
months3 to 6
months6 to 12
monthsLess than 1
year sub-total1 year
to 2 years2 years and
greater Total
Deposits from banks (2) $ 6,779 $ 48 $ 59 $ 37 $ 6,923 $ – $ – $ 6,923Certificates of deposit and commercial paper 1,567 9,358 18,077 13,404 42,406 3,173 174 45,753Asset-backed commercial paper (3) 1,355 2,076 3,156 5,174 11,761 – – 11,761Senior unsecured medium-term notes (4) 54 1,397 7,408 8,499 17,358 18,409 40,825 76,592Senior unsecured structured notes (5) 375 403 784 802 2,364 622 5,358 8,344Mortgage securitization 96 596 1,251 1,954 3,897 2,694 16,385 22,976Covered bonds/asset-backed securities (6) 3 692 1,500 3,543 5,738 4,887 27,521 38,146Subordinated liabilities – – 1,500 – 1,500 105 5,620 7,225Other (7) 2,356 4,842 1,196 1,116 9,510 20 4,430 13,960
Total $ 12,585 $ 19,412 $ 34,931 $ 34,529 $ 101,457 $ 29,910 $ 100,313 $ 231,680
Of which:– Secured $ 3,756 $ 7,214 $ 5,907 $ 10,670 $ 27,547 $ 7,580 $ 43,907 $ 79,034– Unsecured 8,829 12,198 29,024 23,859 73,910 22,330 56,406 152,646
As at April 30, 2015
(Millions of Canadian dollars)Less than
1 month1 to 3
months3 to 6
months6 to 12
monthsLess than 1
year sub-total1 year
to 2 years2 years and
greater Total
Deposits from banks (2) $ 4,361 $ 22 $ 24 $ 60 $ 4,467 $ – $ – $ 4,467Certificates of deposit and commercial paper 5,536 8,427 7,608 16,327 37,898 3,180 48 41,126Asset-backed commercial paper (3) 1,048 2,175 3,390 4,229 10,842 – – 10,842Senior unsecured medium-term notes (4) 1,071 1,728 1,348 10,948 15,095 19,393 37,620 72,108Senior unsecured structured notes (5) 291 657 519 935 2,402 776 5,190 8,368Mortgage securitization 113 654 891 1,784 3,442 3,287 16,509 23,238Covered bonds/asset-backed securities (6) 1,229 665 698 2,024 4,616 6,303 24,837 35,756Subordinated liabilities – 1,500 – 1,500 3,000 – 4,643 7,643Other (7) 3,701 118 969 1,420 6,208 39 4,106 10,353
Total $ 17,350 $ 15,946 $ 15,447 $ 39,227 $ 87,970 $ 32,978 $ 92,953 $ 213,901
Of which:– Secured $ 5,804 $ 3,494 $ 4,980 $ 8,037 $ 22,315 $ 9,590 $ 41,346 $ 73,251– Unsecured 11,546 12,452 10,467 31,190 65,655 23,388 51,607 140,650
(1) Excludes bankers’ acceptances.(2) Only includes deposits raised by treasury. Excludes deposits associated with services we provide to these banks (e.g., custody, cash management).(3) Only includes consolidated liabilities, including our collateralized commercial paper program.(4) Includes deposit notes.(5) Includes notes where the payout is tied to movements in foreign exchange, commodities and equities.(6) Includes credit card, auto and mortgage loans.(7) Includes tender option bonds (secured) of $6,071 million (April 30, 2015 – $3,341 million), bearer deposit notes (unsecured) of $3,748 million (April 30, 2015 – $3,180 million) and other long-term
structured deposits (unsecured) of $4,141 million (April 30, 2015 – $3,832 million).
Contractual maturities of financial assets, financial liabilities and off-balance sheet itemsThe following tables provide remaining contractual maturity profiles of all our assets, liabilities, and off-balance sheet items at theircarrying value (i.e. amortized cost or fair value) at the balance sheet date and have been enhanced in response to EDTFrecommendations. Off-balance sheet items are allocated based on the expiry date of the contract.
Details of contractual maturities and commitments to extend funds are a source of information for the management of liquidityrisk. Among other purposes, these details form a basis for modeling a behavioural balance sheet with effective maturities to calculateliquidity risk measures. For further details, refer to the Risk measurement section.

46 Royal Bank of Canada Third Quarter 2015
Contractual maturities of financial assets, financial liabilities and off-balance sheet items
As at July 31, 2015
(Millions of Canadian dollars)Less than 1
month1 to 3
months3 to 6
months6 to 9
months9 to 12
months1 year
to 2 years2 years
to 5 years5 years
and greater
With nospecific
maturity Total
AssetsCash and deposits with banks $ 26,717 $ 71 $ – $ – $ 406 $ – $ – $ – $ 3,513 $ 30,707Securities
Trading (1) 112,448 45 41 27 79 184 586 5,923 53,037 172,370Available-for-sale 2,983 5,073 1,875 947 3,223 5,504 24,753 16,912 1,875 63,145
Assets purchased under reverserepurchase agreements andsecurities borrowed 77,804 36,437 22,785 7,559 16,741 3,405 – – 7,928 172,659
Loans (net of allowance for loan losses) 18,537 13,618 12,526 20,156 22,750 55,378 196,319 35,754 87,561 462,599Other
Customers’ liability underacceptances 9,599 2,910 196 23 26 6 1 – – 12,761
Derivatives 7,828 7,943 7,184 3,313 3,237 10,745 26,041 46,161 7 112,459Other financial assets 27,616 3,066 616 216 61 80 27 394 1,009 33,085
Total financial assets $ 283,532 $ 69,163 $ 45,223 $ 32,241 $ 46,523 $ 75,302 $ 247,727 $105,144 $ 154,930 $ 1,059,785Other non-financial assets 1,891 817 1,590 357 85 573 1,615 2,479 15,981 25,388
Total assets $ 285,423 $ 69,980 $ 46,813 $ 32,598 $ 46,608 $ 75,875 $ 249,342 $107,623 $ 170,911 $ 1,085,173
Liabilities and equityDeposits (2)
Unsecured borrowing $ 43,158 $ 26,685 $ 40,985 $ 29,044 $ 20,778 $ 37,437 $ 49,651 $ 13,407 $ 335,314 $ 596,459Secured borrowing 1,381 4,628 5,577 6,231 6,517 10,435 20,290 9,577 – 64,636Covered bonds – – 1,963 – 2,294 1,195 22,038 5,651 – 33,141
OtherAcceptances 9,599 2,910 196 23 26 6 1 – – 12,761Obligations related to securities sold
short 55,656 – – – – – – – – 55,656Obligations related to assets sold
under repurchase agreements andsecurities loaned 69,634 3,793 1,967 104 424 410 2 – 6,902 83,236
Derivatives 6,169 8,540 8,121 3,906 3,801 13,718 28,609 43,214 5 116,083Other financial liabilities 21,441 3,078 357 184 168 70 227 4,086 368 29,979
Subordinated debentures – – – – – – – 7,374 – 7,374
Total financial liabilities $ 207,038 $ 49,634 $ 59,166 $ 39,492 $ 34,008 $ 63,271 $ 120,818 $ 83,309 $ 342,589 $ 999,325Other non-financial liabilities 1,066 419 2,524 182 252 828 2,525 8,852 7,302 23,950Equity – – – – – – – – 61,898 61,898
Total liabilities and equity $ 208,104 $ 50,053 $ 61,690 $ 39,674 $ 34,260 $ 64,099 $ 123,343 $ 92,161 $ 411,789 $ 1,085,173
Off-balance sheet itemsFinancial guarantees $ 543 $ 1,183 $ 3,545 $ 1,092 $ 5,732 $ 3,048 $ 5,528 $ 259 $ 26 $ 20,956Lease commitments 59 120 181 176 171 612 1,254 1,285 – 3,858Commitments to extend credit 3,761 6,849 6,129 7,128 8,215 27,821 130,145 13,235 3,434 206,717Other commitments 247 465 580 893 2,656 258 730 322 74,609 80,760
Total off-balance sheet items $ 4,610 $ 8,617 $ 10,435 $ 9,289 $ 16,774 $ 31,739 $ 137,657 $ 15,101 $ 78,069 $ 312,291(1) Trading debt securities classified as fair value through profit or loss have been included in the less than 1 month category as there is no expectation to hold these assets to their contractual
maturity.(2) A major portion of relationship-based deposits are repayable on demand or at short notice on a contractual basis while, in practice, these customer balances form a core base, as explained in the
preceding Deposit profile section, for our operations and liquidity needs.
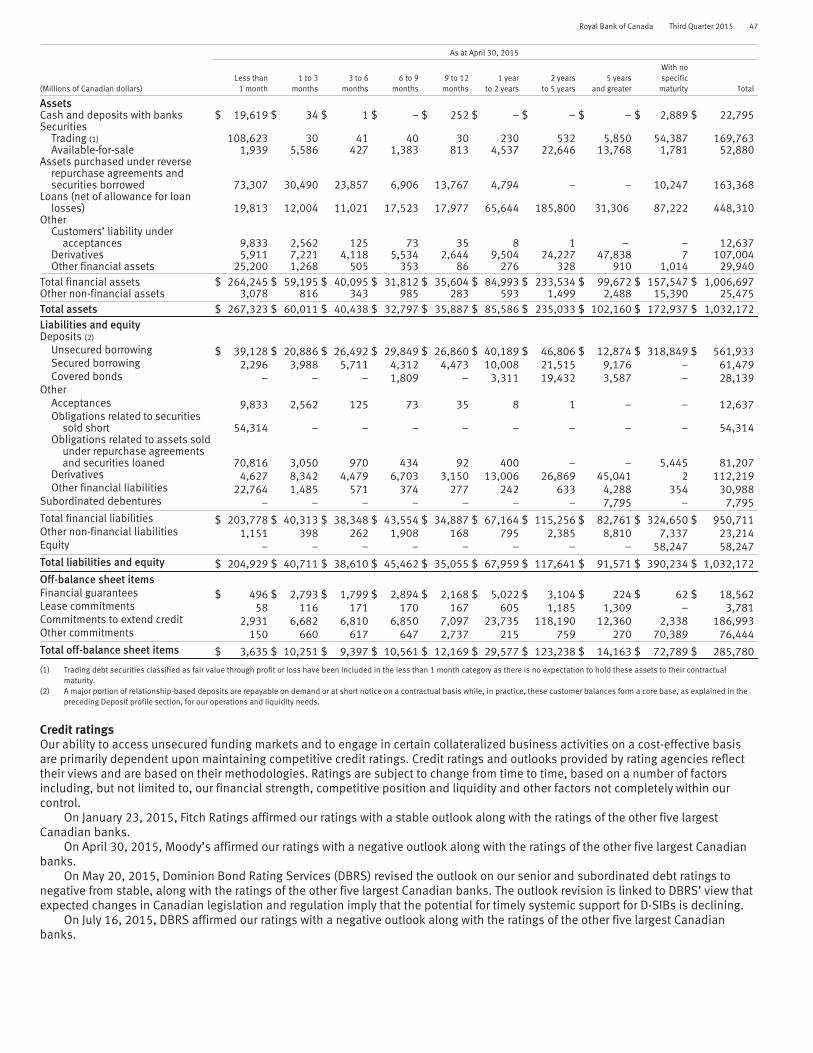
Royal Bank of Canada Third Quarter 2015 47
As at April 30, 2015
(Millions of Canadian dollars)Less than
1 month1 to 3
months3 to 6
months6 to 9
months9 to 12
months1 year
to 2 years2 years
to 5 years5 years
and greater
With nospecific
maturity Total
AssetsCash and deposits with banks $ 19,619 $ 34 $ 1 $ – $ 252 $ – $ – $ – $ 2,889 $ 22,795Securities
Trading (1) 108,623 30 41 40 30 230 532 5,850 54,387 169,763Available-for-sale 1,939 5,586 427 1,383 813 4,537 22,646 13,768 1,781 52,880
Assets purchased under reverserepurchase agreements andsecurities borrowed 73,307 30,490 23,857 6,906 13,767 4,794 – – 10,247 163,368
Loans (net of allowance for loanlosses) 19,813 12,004 11,021 17,523 17,977 65,644 185,800 31,306 87,222 448,310
OtherCustomers’ liability under
acceptances 9,833 2,562 125 73 35 8 1 – – 12,637Derivatives 5,911 7,221 4,118 5,534 2,644 9,504 24,227 47,838 7 107,004Other financial assets 25,200 1,268 505 353 86 276 328 910 1,014 29,940
Total financial assets $ 264,245 $ 59,195 $ 40,095 $ 31,812 $ 35,604 $ 84,993 $ 233,534 $ 99,672 $ 157,547 $ 1,006,697Other non-financial assets 3,078 816 343 985 283 593 1,499 2,488 15,390 25,475Total assets $ 267,323 $ 60,011 $ 40,438 $ 32,797 $ 35,887 $ 85,586 $ 235,033 $ 102,160 $ 172,937 $ 1,032,172Liabilities and equityDeposits (2)
Unsecured borrowing $ 39,128 $ 20,886 $ 26,492 $ 29,849 $ 26,860 $ 40,189 $ 46,806 $ 12,874 $ 318,849 $ 561,933Secured borrowing 2,296 3,988 5,711 4,312 4,473 10,008 21,515 9,176 – 61,479Covered bonds – – – 1,809 – 3,311 19,432 3,587 – 28,139
OtherAcceptances 9,833 2,562 125 73 35 8 1 – – 12,637Obligations related to securities
sold short 54,314 – – – – – – – – 54,314Obligations related to assets sold
under repurchase agreementsand securities loaned 70,816 3,050 970 434 92 400 – – 5,445 81,207
Derivatives 4,627 8,342 4,479 6,703 3,150 13,006 26,869 45,041 2 112,219Other financial liabilities 22,764 1,485 571 374 277 242 633 4,288 354 30,988
Subordinated debentures – – – – – – – 7,795 – 7,795Total financial liabilities $ 203,778 $ 40,313 $ 38,348 $ 43,554 $ 34,887 $ 67,164 $ 115,256 $ 82,761 $ 324,650 $ 950,711Other non-financial liabilities 1,151 398 262 1,908 168 795 2,385 8,810 7,337 23,214Equity – – – – – – – – 58,247 58,247Total liabilities and equity $ 204,929 $ 40,711 $ 38,610 $ 45,462 $ 35,055 $ 67,959 $ 117,641 $ 91,571 $ 390,234 $ 1,032,172Off-balance sheet itemsFinancial guarantees $ 496 $ 2,793 $ 1,799 $ 2,894 $ 2,168 $ 5,022 $ 3,104 $ 224 $ 62 $ 18,562Lease commitments 58 116 171 170 167 605 1,185 1,309 – 3,781Commitments to extend credit 2,931 6,682 6,810 6,850 7,097 23,735 118,190 12,360 2,338 186,993Other commitments 150 660 617 647 2,737 215 759 270 70,389 76,444Total off-balance sheet items $ 3,635 $ 10,251 $ 9,397 $ 10,561 $ 12,169 $ 29,577 $ 123,238 $ 14,163 $ 72,789 $ 285,780
(1) Trading debt securities classified as fair value through profit or loss have been included in the less than 1 month category as there is no expectation to hold these assets to their contractualmaturity.
(2) A major portion of relationship-based deposits are repayable on demand or at short notice on a contractual basis while, in practice, these customer balances form a core base, as explained in thepreceding Deposit profile section, for our operations and liquidity needs.
Credit ratingsOur ability to access unsecured funding markets and to engage in certain collateralized business activities on a cost-effective basisare primarily dependent upon maintaining competitive credit ratings. Credit ratings and outlooks provided by rating agencies reflecttheir views and are based on their methodologies. Ratings are subject to change from time to time, based on a number of factorsincluding, but not limited to, our financial strength, competitive position and liquidity and other factors not completely within ourcontrol.
On January 23, 2015, Fitch Ratings affirmed our ratings with a stable outlook along with the ratings of the other five largestCanadian banks.
On April 30, 2015, Moody’s affirmed our ratings with a negative outlook along with the ratings of the other five largest Canadianbanks.
On May 20, 2015, Dominion Bond Rating Services (DBRS) revised the outlook on our senior and subordinated debt ratings tonegative from stable, along with the ratings of the other five largest Canadian banks. The outlook revision is linked to DBRS’ view thatexpected changes in Canadian legislation and regulation imply that the potential for timely systemic support for D-SIBs is declining.
On July 16, 2015, DBRS affirmed our ratings with a negative outlook along with the ratings of the other five largest Canadianbanks.
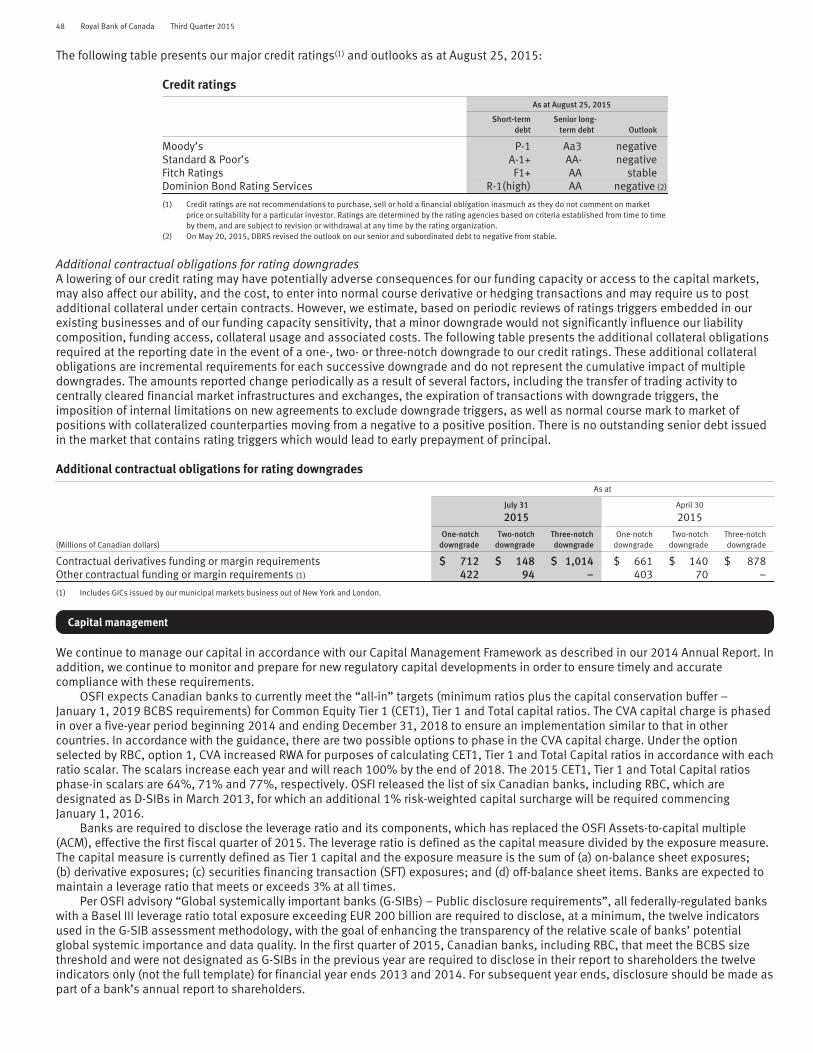
48 Royal Bank of Canada Third Quarter 2015
The following table presents our major credit ratings(1) and outlooks as at August 25, 2015:
Credit ratings
As at August 25, 2015
Short-termdebt
Senior long-term debt Outlook
Moody’s P-1 Aa3 negativeStandard & Poor’s A-1+ AA- negativeFitch Ratings F1+ AA stableDominion Bond Rating Services R-1(high) AA negative (2)
(1) Credit ratings are not recommendations to purchase, sell or hold a financial obligation inasmuch as they do not comment on marketprice or suitability for a particular investor. Ratings are determined by the rating agencies based on criteria established from time to timeby them, and are subject to revision or withdrawal at any time by the rating organization.
(2) On May 20, 2015, DBRS revised the outlook on our senior and subordinated debt to negative from stable.
Additional contractual obligations for rating downgradesA lowering of our credit rating may have potentially adverse consequences for our funding capacity or access to the capital markets,may also affect our ability, and the cost, to enter into normal course derivative or hedging transactions and may require us to postadditional collateral under certain contracts. However, we estimate, based on periodic reviews of ratings triggers embedded in ourexisting businesses and of our funding capacity sensitivity, that a minor downgrade would not significantly influence our liabilitycomposition, funding access, collateral usage and associated costs. The following table presents the additional collateral obligationsrequired at the reporting date in the event of a one-, two- or three-notch downgrade to our credit ratings. These additional collateralobligations are incremental requirements for each successive downgrade and do not represent the cumulative impact of multipledowngrades. The amounts reported change periodically as a result of several factors, including the transfer of trading activity tocentrally cleared financial market infrastructures and exchanges, the expiration of transactions with downgrade triggers, theimposition of internal limitations on new agreements to exclude downgrade triggers, as well as normal course mark to market ofpositions with collateralized counterparties moving from a negative to a positive position. There is no outstanding senior debt issuedin the market that contains rating triggers which would lead to early prepayment of principal.
Additional contractual obligations for rating downgrades
As at
July 31
2015April 30
2015
(Millions of Canadian dollars)One-notch
downgradeTwo-notch
downgradeThree-notchdowngrade
One-notchdowngrade
Two-notchdowngrade
Three-notchdowngrade
Contractual derivatives funding or margin requirements $ 712 $ 148 $ 1,014 $ 661 $ 140 $ 878Other contractual funding or margin requirements (1) 422 94 – 403 70 –
(1) Includes GICs issued by our municipal markets business out of New York and London.
Capital management
We continue to manage our capital in accordance with our Capital Management Framework as described in our 2014 Annual Report. Inaddition, we continue to monitor and prepare for new regulatory capital developments in order to ensure timely and accuratecompliance with these requirements.
OSFI expects Canadian banks to currently meet the “all-in” targets (minimum ratios plus the capital conservation buffer –January 1, 2019 BCBS requirements) for Common Equity Tier 1 (CET1), Tier 1 and Total capital ratios. The CVA capital charge is phasedin over a five-year period beginning 2014 and ending December 31, 2018 to ensure an implementation similar to that in othercountries. In accordance with the guidance, there are two possible options to phase in the CVA capital charge. Under the optionselected by RBC, option 1, CVA increased RWA for purposes of calculating CET1, Tier 1 and Total Capital ratios in accordance with eachratio scalar. The scalars increase each year and will reach 100% by the end of 2018. The 2015 CET1, Tier 1 and Total Capital ratiosphase-in scalars are 64%, 71% and 77%, respectively. OSFI released the list of six Canadian banks, including RBC, which aredesignated as D-SIBs in March 2013, for which an additional 1% risk-weighted capital surcharge will be required commencingJanuary 1, 2016.
Banks are required to disclose the leverage ratio and its components, which has replaced the OSFI Assets-to-capital multiple(ACM), effective the first fiscal quarter of 2015. The leverage ratio is defined as the capital measure divided by the exposure measure.The capital measure is currently defined as Tier 1 capital and the exposure measure is the sum of (a) on-balance sheet exposures;(b) derivative exposures; (c) securities financing transaction (SFT) exposures; and (d) off-balance sheet items. Banks are expected tomaintain a leverage ratio that meets or exceeds 3% at all times.
Per OSFI advisory “Global systemically important banks (G-SIBs) – Public disclosure requirements”, all federally-regulated bankswith a Basel III leverage ratio total exposure exceeding EUR 200 billion are required to disclose, at a minimum, the twelve indicatorsused in the G-SIB assessment methodology, with the goal of enhancing the transparency of the relative scale of banks’ potentialglobal systemic importance and data quality. In the first quarter of 2015, Canadian banks, including RBC, that meet the BCBS sizethreshold and were not designated as G-SIBs in the previous year are required to disclose in their report to shareholders the twelveindicators only (not the full template) for financial year ends 2013 and 2014. For subsequent year ends, disclosure should be made aspart of a bank’s annual report to shareholders.
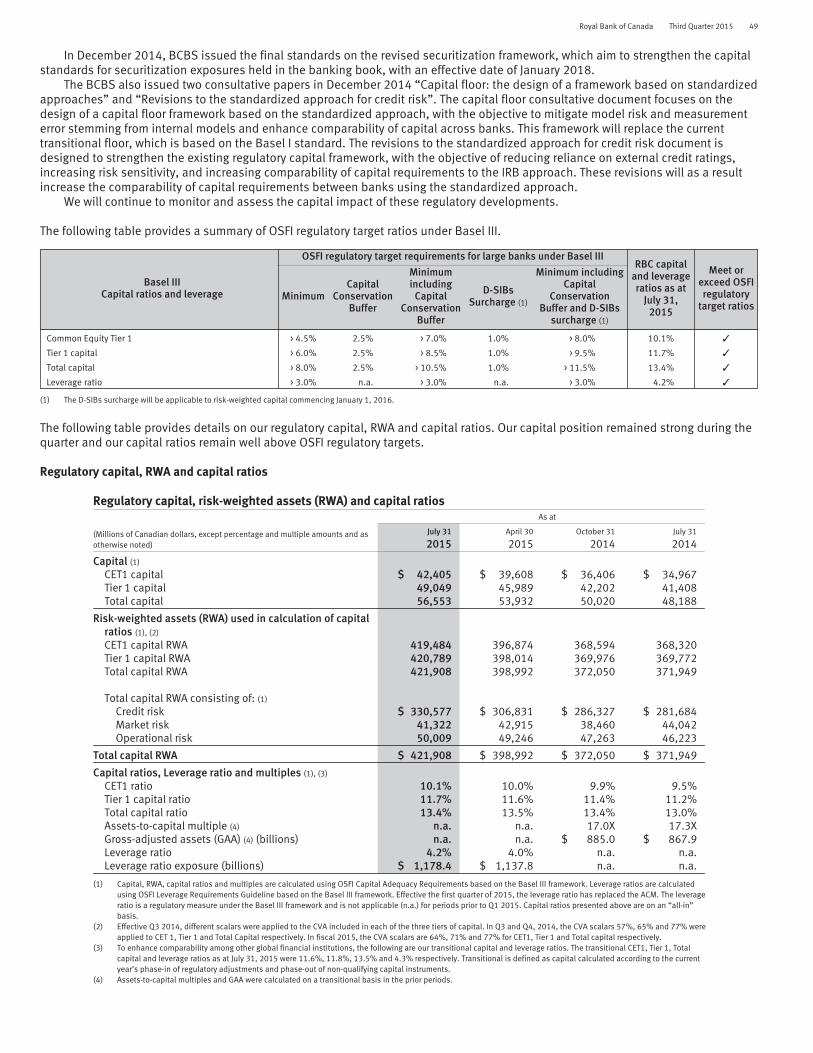
Royal Bank of Canada Third Quarter 2015 49
In December 2014, BCBS issued the final standards on the revised securitization framework, which aim to strengthen the capitalstandards for securitization exposures held in the banking book, with an effective date of January 2018.
The BCBS also issued two consultative papers in December 2014 “Capital floor: the design of a framework based on standardizedapproaches” and “Revisions to the standardized approach for credit risk”. The capital floor consultative document focuses on thedesign of a capital floor framework based on the standardized approach, with the objective to mitigate model risk and measurementerror stemming from internal models and enhance comparability of capital across banks. This framework will replace the currenttransitional floor, which is based on the Basel I standard. The revisions to the standardized approach for credit risk document isdesigned to strengthen the existing regulatory capital framework, with the objective of reducing reliance on external credit ratings,increasing risk sensitivity, and increasing comparability of capital requirements to the IRB approach. These revisions will as a resultincrease the comparability of capital requirements between banks using the standardized approach.
We will continue to monitor and assess the capital impact of these regulatory developments.
The following table provides a summary of OSFI regulatory target ratios under Basel III.
Basel IIICapital ratios and leverage
OSFI regulatory target requirements for large banks under Basel IIIRBC capital
and leverageratios as at
July 31,2015
Meet orexceed OSFIregulatory
target ratiosMinimum
CapitalConservation
Buffer
Minimumincluding
CapitalConservation
Buffer
D-SIBsSurcharge (1)
Minimum includingCapital
ConservationBuffer and D-SIBs
surcharge (1)
Common Equity Tier 1 > 4.5% 2.5% > 7.0% 1.0% > 8.0% 10.1% ✓
Tier 1 capital > 6.0% 2.5% > 8.5% 1.0% > 9.5% 11.7% ✓
Total capital > 8.0% 2.5% > 10.5% 1.0% > 11.5% 13.4% ✓
Leverage ratio > 3.0% n.a. > 3.0% n.a. > 3.0% 4.2% ✓
(1) The D-SIBs surcharge will be applicable to risk-weighted capital commencing January 1, 2016.
The following table provides details on our regulatory capital, RWA and capital ratios. Our capital position remained strong during thequarter and our capital ratios remain well above OSFI regulatory targets.
Regulatory capital, RWA and capital ratios
Regulatory capital, risk-weighted assets (RWA) and capital ratiosAs at
(Millions of Canadian dollars, except percentage and multiple amounts and asotherwise noted)
July 31
2015April 30
2015October 31
2014July 31
2014
Capital (1)
CET1 capital $ 42,405 $ 39,608 $ 36,406 $ 34,967Tier 1 capital 49,049 45,989 42,202 41,408Total capital 56,553 53,932 50,020 48,188
Risk-weighted assets (RWA) used in calculation of capitalratios (1), (2)
CET1 capital RWA 419,484 396,874 368,594 368,320Tier 1 capital RWA 420,789 398,014 369,976 369,772Total capital RWA 421,908 398,992 372,050 371,949
Total capital RWA consisting of: (1)
Credit risk $ 330,577 $ 306,831 $ 286,327 $ 281,684Market risk 41,322 42,915 38,460 44,042Operational risk 50,009 49,246 47,263 46,223
Total capital RWA $ 421,908 $ 398,992 $ 372,050 $ 371,949
Capital ratios, Leverage ratio and multiples (1), (3)
CET1 ratio 10.1% 10.0% 9.9% 9.5%Tier 1 capital ratio 11.7% 11.6% 11.4% 11.2%Total capital ratio 13.4% 13.5% 13.4% 13.0%Assets-to-capital multiple (4) n.a. n.a. 17.0X 17.3XGross-adjusted assets (GAA) (4) (billions) n.a. n.a. $ 885.0 $ 867.9Leverage ratio 4.2% 4.0% n.a. n.a.Leverage ratio exposure (billions) $ 1,178.4 $ 1,137.8 n.a. n.a.
(1) Capital, RWA, capital ratios and multiples are calculated using OSFI Capital Adequacy Requirements based on the Basel III framework. Leverage ratios are calculatedusing OSFI Leverage Requirements Guideline based on the Basel III framework. Effective the first quarter of 2015, the leverage ratio has replaced the ACM. The leverageratio is a regulatory measure under the Basel III framework and is not applicable (n.a.) for periods prior to Q1 2015. Capital ratios presented above are on an “all-in”basis.
(2) Effective Q3 2014, different scalars were applied to the CVA included in each of the three tiers of capital. In Q3 and Q4, 2014, the CVA scalars 57%, 65% and 77% wereapplied to CET 1, Tier 1 and Total Capital respectively. In fiscal 2015, the CVA scalars are 64%, 71% and 77% for CET1, Tier 1 and Total capital respectively.
(3) To enhance comparability among other global financial institutions, the following are our transitional capital and leverage ratios. The transitional CET1, Tier 1, Totalcapital and leverage ratios as at July 31, 2015 were 11.6%, 11.8%, 13.5% and 4.3% respectively. Transitional is defined as capital calculated according to the currentyear’s phase-in of regulatory adjustments and phase-out of non-qualifying capital instruments.
(4) Assets-to-capital multiples and GAA were calculated on a transitional basis in the prior periods.

50 Royal Bank of Canada Third Quarter 2015
Q3 2015 vs. Q2 2015
10.0%
April 30, 2015 (1) Internalcapital
generation (2)
Increase inpension
discount rate
RWA growth(excl. FX)
Net FX impact Other July 31, 2015 (1)
Continuity of CET1 ratio (Basel III)
32 bps5 bps (20) bps
2 bps(7) bps
10.1%
(1) Represents round figures.(2) Internal capital generation includes $1.3 billion which represents Net income available to shareholders less common and preferred shares dividends.
Q3 2015 vs. Q2 2015Our CET1 ratio was 10.1%, up 10 bps from last quarter, mainly reflecting internal capital generation and the positive impact of ahigher discount rate in determining our pension and other post-employment benefit obligations. These factors were partially offset byhigher RWA reflecting business growth, and the net impact of foreign exchange translation.
CET1 capital RWA increased $23 billion, mainly reflecting an increase due to the impact of foreign exchange translation andbusiness growth largely in our wholesale lending portfolio, repo-style transactions and derivatives.
Our Tier 1 capital ratio of 11.7% was up 10 bps, mainly due to the factors noted under the CET1 ratio, and the issuance ofpreferred shares.
Our Total capital ratio of 13.4% was down 10 bps, as the factors noted under Tier 1 capital ratio above were mostly offset by netredemption of subordinated debentures.
Our Leverage ratio of 4.2% was up 20 bps, mainly due to internal capital generation, the positive impact of a higher discount ratein determining our pension and other post-employment benefit obligations, and the issuance of preferred shares. These factors werepartially offset by the net impact of foreign exchange translation.
Q3 2015 vs. Q4 2014Our CET1 ratio increased 20 bps from October 31, 2014, mainly reflecting internal capital generation, partially offset by higher RWAreflecting business growth, and the net impact of foreign exchange translation.
CET1 capital RWA increased $51 billion, mainly reflecting an increase due to the impact of foreign exchange translation andbusiness growth largely in our wholesale lending portfolio, repo-style transactions and derivatives.
Our Tier 1 capital ratio increased 30 bps, mainly reflecting the factors noted under CET1 ratio, and the net issuance of preferredshares.
Our Total capital ratio was flat, as the factors noted under Tier 1 capital ratio were mostly offset by the net redemption ofsubordinated debentures.
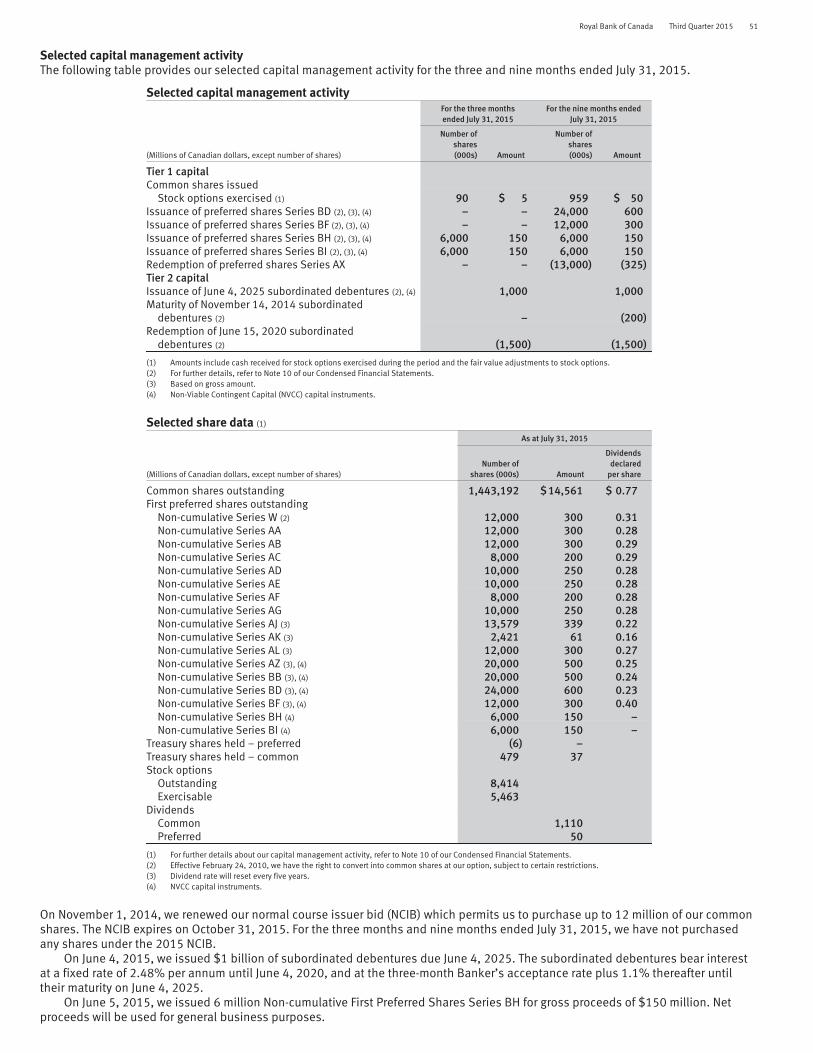
Royal Bank of Canada Third Quarter 2015 51
Selected capital management activityThe following table provides our selected capital management activity for the three and nine months ended July 31, 2015.
Selected capital management activityFor the three monthsended July 31, 2015
For the nine months endedJuly 31, 2015
(Millions of Canadian dollars, except number of shares)
Number ofshares(000s) Amount
Number ofshares(000s) Amount
Tier 1 capitalCommon shares issued
Stock options exercised (1) 90 $ 5 959 $ 50Issuance of preferred shares Series BD (2), (3), (4) – – 24,000 600Issuance of preferred shares Series BF (2), (3), (4) – – 12,000 300Issuance of preferred shares Series BH (2), (3), (4) 6,000 150 6,000 150Issuance of preferred shares Series BI (2), (3), (4) 6,000 150 6,000 150Redemption of preferred shares Series AX – – (13,000) (325)Tier 2 capitalIssuance of June 4, 2025 subordinated debentures (2), (4) 1,000 1,000Maturity of November 14, 2014 subordinated
debentures (2) – (200)Redemption of June 15, 2020 subordinated
debentures (2) (1,500) (1,500)
(1) Amounts include cash received for stock options exercised during the period and the fair value adjustments to stock options.(2) For further details, refer to Note 10 of our Condensed Financial Statements.(3) Based on gross amount.(4) Non-Viable Contingent Capital (NVCC) capital instruments.
Selected share data (1)
As at July 31, 2015
(Millions of Canadian dollars, except number of shares)Number of
shares (000s) Amount
Dividendsdeclared
per share
Common shares outstanding 1,443,192 $ 14,561 $ 0.77First preferred shares outstanding
Non-cumulative Series W (2) 12,000 300 0.31Non-cumulative Series AA 12,000 300 0.28Non-cumulative Series AB 12,000 300 0.29Non-cumulative Series AC 8,000 200 0.29Non-cumulative Series AD 10,000 250 0.28Non-cumulative Series AE 10,000 250 0.28Non-cumulative Series AF 8,000 200 0.28Non-cumulative Series AG 10,000 250 0.28Non-cumulative Series AJ (3) 13,579 339 0.22Non-cumulative Series AK (3) 2,421 61 0.16Non-cumulative Series AL (3) 12,000 300 0.27Non-cumulative Series AZ (3), (4) 20,000 500 0.25Non-cumulative Series BB (3), (4) 20,000 500 0.24Non-cumulative Series BD (3), (4) 24,000 600 0.23Non-cumulative Series BF (3), (4) 12,000 300 0.40Non-cumulative Series BH (4) 6,000 150 –Non-cumulative Series BI (4) 6,000 150 –
Treasury shares held – preferred (6) –Treasury shares held – common 479 37Stock options
Outstanding 8,414Exercisable 5,463
DividendsCommon 1,110Preferred 50
(1) For further details about our capital management activity, refer to Note 10 of our Condensed Financial Statements.(2) Effective February 24, 2010, we have the right to convert into common shares at our option, subject to certain restrictions.(3) Dividend rate will reset every five years.(4) NVCC capital instruments.
On November 1, 2014, we renewed our normal course issuer bid (NCIB) which permits us to purchase up to 12 million of our commonshares. The NCIB expires on October 31, 2015. For the three months and nine months ended July 31, 2015, we have not purchasedany shares under the 2015 NCIB.
On June 4, 2015, we issued $1 billion of subordinated debentures due June 4, 2025. The subordinated debentures bear interestat a fixed rate of 2.48% per annum until June 4, 2020, and at the three-month Banker’s acceptance rate plus 1.1% thereafter untiltheir maturity on June 4, 2025.
On June 5, 2015, we issued 6 million Non-cumulative First Preferred Shares Series BH for gross proceeds of $150 million. Netproceeds will be used for general business purposes.

52 Royal Bank of Canada Third Quarter 2015
On July 22, 2015, we issued 6 million Non-cumulative First Preferred Shares Series BI for gross proceeds of $150 million. Netproceeds will be used for general business purposes.
As at August 21, 2015, the number of outstanding common shares and stock options was 1,443,191,703 and 8,413,811,respectively, and the number of Treasury shares – preferred and Treasury shares – common was 42,863 and 393,104, respectively.
NVCC provisions require the conversion of our capital instruments into a variable number of common shares in the event thatOSFI deems the Bank to be non-viable or a federal or provincial government in Canada publicly announces that the Bank has acceptedor agreed to accept a capital injection. If a NVCC trigger event were to occur, our NVCC capital instruments preferred shares Series AZ,preferred shares Series BB, preferred shares Series BD, preferred shares Series BF, preferred shares Series BH, preferred sharesSeries BI, subordinated debentures due on July 17, 2024, subordinated debentures due on September 29, 2026 and subordinateddebentures due on June 4, 2025 would be converted into RBC common shares pursuant to an automatic conversion formula with aconversion price based on the greater of: (i) a floor price of $5.00, and (ii) the current market price of our common shares at the timeof the trigger event (10-day weighted average). Based on a floor price of $5.00 and including an estimate for accrued dividends andinterest, these NVCC capital instruments would convert into a maximum of 1,358 million RBC common shares, on aggregate, whichwould represent a dilution impact of 48.48% based on the number of RBC common shares outstanding as at July 31, 2015.
Attributed capitalOur methodology for allocating capital to our business segments is based on the higher of fully diversified economic capital and theBasel III regulatory capital requirements. Risk-based capital attribution provides a uniform base for performance measurement amongbusiness segments, which compares to our overall corporate return objective and facilitates management decisions in resourceallocation in conjunction with other factors. The following outlines our attributed capital.
Attributed capitalFor the three months ended
(Millions of Canadian dollars)
July 31
2015April 30
2015October 31
2014July 31
2014
Credit risk $ 16,500 $ 16,050 $ 15,250 $ 13,900Market risk (trading and non-trading) 3,800 3,900 4,200 4,000Operational risk 4,600 4,800 4,200 4,550Business and fixed asset risk 2,900 3,050 2,600 2,850Insurance risk 550 550 500 500Goodwill and other intangibles 11,950 11,850 11,400 11,300Regulatory capital allocation 5,100 5,400 4,200 4,050
Attributed capital $ 45,400 $ 45,600 $ 42,350 $ 41,150
Under attribution of capital 7,200 5,900 5,100 5,250
Average common equity $ 52,600 $ 51,500 $ 47,450 $ 46,400
Q3 2015 vs. Q2 2015Attributed capital decreased $0.2 billion largely due to lower operational and business risks reflecting lower revenue primarily due tolower trading revenue, and lower regulatory capital allocation. These factors were partially offset by higher credit risk mainly due togrowth in loan book including residential mortgages, derivatives and trading securities. The increase in goodwill and other intangiblesrisk reflects the increase due to the impact of foreign exchange as a result of the weaker Canadian dollar. We remain well capitalizedwith current levels of available capital exceeding the attributed capital required to underpin all of our material risks.

Royal Bank of Canada Third Quarter 2015 53
Additional financial information
Exposures to selected financial instruments
As at
July 31, 2015 July 31, 2014
(Millions of Canadian dollars)Subprime
RMBSAlt-A
RMBS
CDOsthat may
containsubprime
or Alt-A TotalSubprime
RMBSAlt-A
RMBS
CDOsthat may
containsubprime
or Alt-A Total
Fair value of securities $ 242 $ 218 $ – $ 460 $ 212 $ 193 $ – $ 405
Fair value of securities by ratingAAA $ – $ – $ – $ 2 $ – $ –AA 125 1 – 27 4 –A 25 2 – 66 3 –BBB 5 17 – 24 4 –Below BBB- 87 198 – 93 182 –
Total $ 242 $ 218 $ – $ 460 $ 212 $ 193 $ – $ 405
Fair value of securities by vintage2003 (or before) $ – $ 1 $ – $ – $ 23 $ –2004 30 18 – 7 38 –2005 49 64 – 80 82 –2006 114 105 – 103 42 –2007 and later 49 30 – 22 8 –
Total $ 242 $ 218 $ – $ 460 $ 212 $ 193 $ – $ 405
Amortized cost of subprime/Alt-A mortgages (whole loans) $ 9 $ 43 $ – $ 52 $ 9 $ 37 $ – $ 46
Total subprime and Alt-A exposures $ 251 $ 261 $ – $ 512 $ 221 $ 230 $ – $ 451
Sensitivities of fair value of securities to changes in assumptions:100bps increase in credit spread $ (10) $ (11)100bps increase in interest rates (3) (37)20% increase in default rates (5) (7)25% decrease in prepayment rates (2) 13
Certain activities and transactions we enter into expose us to the risk of default of U.S. subprime and Alt-A residential mortgages. Ourexposures to U.S. subprime and Alt-A residential mortgages of $512 million represented less than 0.1% of our total assets as atJuly 31, 2015, compared to $451 million or less than 0.1% last year. The increase of $61 million primarily reflected an increase due tothe impact of foreign exchange translation.
Q3 2015 vs. Q3 2014Our total holdings of RMBS noted in the table above may be exposed to U.S. subprime risk. As at July 31, 2015, our U.S. subprimeRMBS exposure of $242 million increased $30 million or 14% from last year, primarily due to the impact of foreign exchangetranslation. Of this exposure, $150 million or 62% of our related holdings were rated A and above, an increase of $55 million from lastyear due to the purchase of securities and an increase due to the impact of foreign exchange translation.
As at July 31, 2015, our exposure to U.S. subprime loans of $9 million was flat compared to the prior year.Of our total portfolio of RMBS, holdings with a fair value of $218 million may be exposed to U.S. Alt-A risk. U.S. Alt-A exposures
increased $25 million from last year primarily reflecting an increase due to the impact of foreign exchange translation. Approximately62% of U.S. Alt-A exposures were issued during 2006 and onwards, which compares to 26% last year. As at July 31, 2015, ourexposure to U.S. Alt-A loans of $43 million increased $6 million from last year.
Of our total portfolio of CDOs, we have no holdings that are exposed to U.S. subprime or Alt-A risk. As at July 31, 2015, the fairvalue of our U.S. corporate CDOs of $1,148 million, which were predominantly comprised of corporate collateralized loan obligations,increased $224 million from last year mainly reflecting an increase due to the impact of foreign exchange translation.
Commercial mortgage-backed securitiesThe fair value of our total direct holdings of Canadian and U.S. commercial mortgage-backed securities was $673 million as at July 31,2015.
Assets and liabilities measured at fair valueOur financial instruments carried at fair value are classified as Level 1, 2, or 3, in accordance with the fair value hierarchy set out inIFRS 13 Fair Value Measurement. For further details on the fair value of our financial instruments and transfers between levels of thefair value hierarchy, refer to Note 3 of our audited 2014 Annual Consolidated Financial Statements.

54 Royal Bank of Canada Third Quarter 2015
The following table presents the total fair value of each major class of financial assets and financial liabilities measured at fairvalue and the percentage of the fair value of each class categorized as Level 1, 2, or 3 as at July 31, 2015.
As at July 31, 2015
(Millions of Canadian dollars, except percentage amounts) Fair value (1) Level 1 (1) Level 2 (1) Level 3 (1) Total
Financial assetsSecurities at FVTPL $ 172,370 40% 60% 0% 100%Available-for-sale 59,827 13 81 6 100Assets purchased under reverse repurchase
agreements and securities borrowed 105,393 0 100 0 100Loans – Wholesale 3,569 0 81 19 100Derivatives 201,964 1 98 1 100
Financial liabilitiesDeposits $ 108,284 0% 99% 1% 100%Obligations related to securities sold short 55,656 66 34 0 100Obligations related to assets sold under
repurchase agreements and securitiesloaned 74,474 0 100 0 100
Derivatives 205,751 1 98 1 100
(1) The derivative assets and liabilities presented in the table above do not reflect the impact of netting.
Accounting and control matters
Summary accounting policies and estimates
Our Condensed Financial Statements are presented in compliance with International Accounting Standards (IAS) 34 Interim FinancialReporting. The significant accounting policies are described in Note 2 of our Condensed Financial Statements and Note 2 of ouraudited 2014 Annual Consolidated Financial Statements.
Changes in accounting policies and disclosure
We have adopted amendments to IAS 32 Financial Instruments: Presentation, and International Financial Reporting Standards (IFRS)Interpretations Committee IFRIC Interpretation 21 Levies, effective November 1, 2014. Refer to Note 2 of our Condensed FinancialStatements for details of these changes.
Future changes in regulatory disclosure
Basel Committee on Banking Supervision revised Pillar 3 disclosure requirementsIn January 2015, the BCBS issued the final standard for the revised Pillar 3 disclosure requirements with the goal of enhancing thetransparency and improve comparability and consistency of banks’ capital and risk disclosure. BCBS requires all banks to provide therevised Pillar 3 disclosures by the end of fiscal 2016 and OSFI is expected to issue their domestic guidance for Canadian banks in thefall of 2015.
Controls and procedures
Disclosure controls and proceduresAs of July 31, 2015, management evaluated, under the supervision of and with the participation of the President and Chief ExecutiveOfficer and the Chief Administrative Officer and Chief Financial Officer, the effectiveness of our disclosure controls and procedures asdefined under rules adopted by the U.S. SEC. Based on that evaluation, the President and Chief Executive Officer and the ChiefAdministrative Officer and Chief Financial Officer concluded that our disclosure controls and procedures were effective as of July 31,2015.
Internal control over financial reportingNo changes were made in our internal control over financial reporting during the quarter ended July 31, 2015 that have materiallyaffected, or are reasonably likely to materially affect, our internal control over financial reporting.
Related party transactions
In the ordinary course of business, we provide normal banking services and operational services, and enter into other transactionswith associated and other related corporations, including our joint venture entities, on terms similar to those offered to non-relatedparties. We grant loans to directors, officers and other employees at rates normally accorded to preferred clients. In addition, we offerdeferred share and other plans to non-employee directors, executives and certain other key employees. For further information, referto Notes 12 and 29 of our audited 2014 Annual Consolidated Financial Statements.
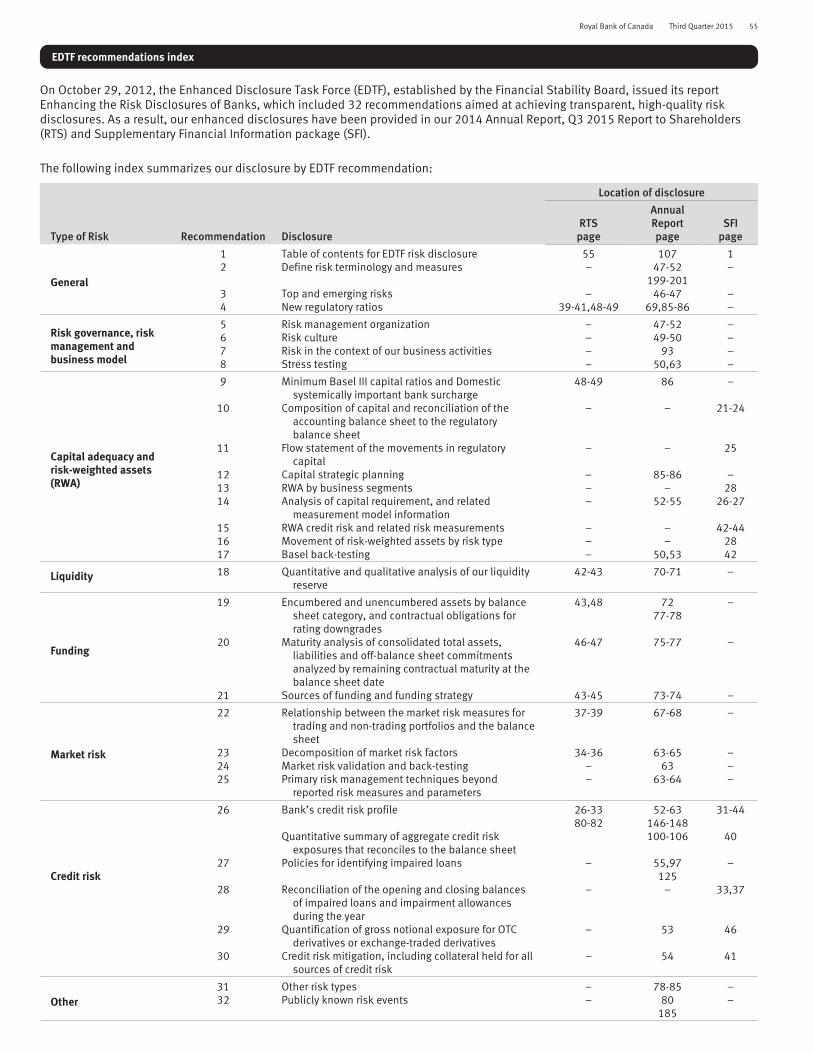
Royal Bank of Canada Third Quarter 2015 55
EDTF recommendations index
On October 29, 2012, the Enhanced Disclosure Task Force (EDTF), established by the Financial Stability Board, issued its reportEnhancing the Risk Disclosures of Banks, which included 32 recommendations aimed at achieving transparent, high-quality riskdisclosures. As a result, our enhanced disclosures have been provided in our 2014 Annual Report, Q3 2015 Report to Shareholders(RTS) and Supplementary Financial Information package (SFI).
The following index summarizes our disclosure by EDTF recommendation:
Location of disclosure
Type of Risk Recommendation DisclosureRTS
page
AnnualReportpage
SFIpage
General
1 Table of contents for EDTF risk disclosure 55 107 12 Define risk terminology and measures – 47-52
199-201–
3 Top and emerging risks – 46-47 –4 New regulatory ratios 39-41,48-49 69,85-86 –
Risk governance, riskmanagement andbusiness model
5 Risk management organization – 47-52 –6 Risk culture – 49-50 –7 Risk in the context of our business activities – 93 –8 Stress testing – 50,63 –
Capital adequacy andrisk-weighted assets(RWA)
9 Minimum Basel III capital ratios and Domesticsystemically important bank surcharge
48-49 86 –
10 Composition of capital and reconciliation of theaccounting balance sheet to the regulatorybalance sheet
– – 21-24
11 Flow statement of the movements in regulatorycapital
– – 25
12 Capital strategic planning – 85-86 –13 RWA by business segments – – 2814 Analysis of capital requirement, and related
measurement model information– 52-55 26-27
15 RWA credit risk and related risk measurements – – 42-4416 Movement of risk-weighted assets by risk type – – 2817 Basel back-testing – 50,53 42
Liquidity 18 Quantitative and qualitative analysis of our liquidityreserve
42-43 70-71 –
Funding
19 Encumbered and unencumbered assets by balancesheet category, and contractual obligations forrating downgrades
43,48 7277-78
–
20 Maturity analysis of consolidated total assets,liabilities and off-balance sheet commitmentsanalyzed by remaining contractual maturity at thebalance sheet date
46-47 75-77 –
21 Sources of funding and funding strategy 43-45 73-74 –
Market risk
22 Relationship between the market risk measures fortrading and non-trading portfolios and the balancesheet
37-39 67-68 –
23 Decomposition of market risk factors 34-36 63-65 –24 Market risk validation and back-testing – 63 –25 Primary risk management techniques beyond
reported risk measures and parameters– 63-64 –
Credit risk
26 Bank’s credit risk profile 26-3380-82
52-63146-148
31-44
Quantitative summary of aggregate credit riskexposures that reconciles to the balance sheet
100-106 40
27 Policies for identifying impaired loans – 55,97125
–
28 Reconciliation of the opening and closing balancesof impaired loans and impairment allowancesduring the year
– – 33,37
29 Quantification of gross notional exposure for OTCderivatives or exchange-traded derivatives
– 53 46
30 Credit risk mitigation, including collateral held for allsources of credit risk
– 54 41
Other31 Other risk types – 78-85 –32 Publicly known risk events – 80
185–

56 Royal Bank of Canada Third Quarter 2015
Interim Condensed Consolidated Financial Statements (unaudited)
Interim Condensed Consolidated Balance Sheets (unaudited)
As at
(Millions of Canadian dollars)
July 31
2015April 30
2015October 31
2014July 31
2014
AssetsCash and due from banks $ 19,976 $ 18,393 $ 17,421 $ 16,297
Interest-bearing deposits with banks 10,731 4,402 8,399 5,383
Securities (Note 4)
Trading 172,370 169,763 151,380 152,756Available-for-sale 63,145 52,880 47,768 46,358
235,515 222,643 199,148 199,114
Assets purchased under reverse repurchase agreements and securities borrowed 172,659 163,368 135,580 135,205
Loans (Note 5)
Retail 343,463 336,064 334,269 329,999Wholesale 121,214 114,283 102,954 102,348
464,677 450,347 437,223 432,347Allowance for loan losses (Note 5) (2,078) (2,037) (1,994) (1,926)
462,599 448,310 435,229 430,421
Segregated fund net assets 821 780 675 645
OtherCustomers’ liability under acceptances 12,761 12,637 11,462 10,443Derivatives (Note 6) 112,459 107,004 87,402 72,823Premises and equipment, net 2,667 2,595 2,684 2,603Goodwill 9,322 8,890 8,647 8,568Other intangibles 2,810 2,779 2,775 2,782Investments in joint ventures and associates 346 319 295 306Employee benefit assets 108 84 138 179Other assets 42,399 39,968 30,695 29,101
182,872 174,276 144,098 126,805
Total assets $ 1,085,173 $ 1,032,172 $ 940,550 $ 913,870
Liabilities and equityDeposits (Note 8)
Personal $ 218,629 $ 215,903 $ 209,217 $ 204,427Business and government 449,397 415,311 386,660 377,635Bank 26,210 20,337 18,223 19,629
694,236 651,551 614,100 601,691
Segregated fund net liabilities 821 780 675 645
OtherAcceptances 12,761 12,637 11,462 10,443Obligations related to securities sold short 55,656 54,314 50,345 52,054Obligations related to assets sold under repurchase agreements and securities loaned 83,236 81,207 64,331 65,423Derivatives (Note 6) 116,083 112,219 88,982 75,096Insurance claims and policy benefit liabilities 9,395 9,373 8,564 8,473Employee benefit liabilities 2,431 2,611 2,420 2,205Other liabilities 41,282 41,438 37,309 37,533
320,844 313,799 263,413 251,227
Subordinated debentures (Note 10) 7,374 7,795 7,859 6,810
Total liabilities 1,023,275 973,925 886,047 860,373
Equity attributable to shareholdersPreferred shares (Note 10) 4,950 4,650 4,075 4,750Common shares (shares issued – 1,443,191,703, 1,443,101,716, 1,442,232,886 and 1,441,535,962) (Note 10) 14,561 14,556 14,511 14,475Treasury shares – preferred (shares held – (5,704), 70,730, 1,207 and (57,070)) – 2 – (1)
– common (shares held – 478,978, (1,357,362), 891,733 and 117,579) 37 (104) 71 10Retained earnings 35,795 34,142 31,615 30,526Other components of equity 4,760 3,185 2,418 1,954
60,103 56,431 52,690 51,714Non-controlling interests 1,795 1,816 1,813 1,783
Total equity 61,898 58,247 54,503 53,497
Total liabilities and equity $ 1,085,173 $ 1,032,172 $ 940,550 $ 913,870
The accompanying notes are an integral part of these Interim Condensed Consolidated Financial Statements.

Royal Bank of Canada Third Quarter 2015 57
Interim Condensed Consolidated Statements of Income (unaudited)
For the three months ended For the nine months ended
(Millions of Canadian dollars, except per share amounts)
July 31
2015April 30
2015July 31
2014July 31
2015July 31
2014
Interest incomeLoans $ 4,241 $ 4,130 $ 4,318 $ 12,679 $ 12,710Securities 1,177 1,111 1,097 3,360 3,060Assets purchased under reverse repurchase agreements and securities borrowed 319 298 237 918 718Deposits and other 18 18 21 57 55
5,755 5,557 5,673 17,014 16,543
Interest expenseDeposits and other 1,387 1,460 1,493 4,348 4,410Other liabilities 525 477 473 1,509 1,394Subordinated debentures 60 63 60 186 183
1,972 2,000 2,026 6,043 5,987
Net interest income 3,783 3,557 3,647 10,971 10,556
Non-interest incomeInsurance premiums, investment and fee income 1,021 806 1,383 3,719 3,790Trading revenue 56 359 285 755 895Investment management and custodial fees 966 943 838 2,836 2,469Mutual fund revenue 739 716 671 2,150 1,930Securities brokerage commissions 358 361 340 1,084 1,032Service charges 405 391 380 1,188 1,108Underwriting and other advisory fees 531 559 552 1,535 1,381Foreign exchange revenue, other than trading 137 301 215 592 620Card service revenue 209 192 181 605 509Credit fees 320 311 317 876 841Net gain on available-for-sale securities (Note 4) 42 42 36 111 130Share of profit in joint ventures and associates 28 39 44 109 128Other 233 253 101 771 337
5,045 5,273 5,343 16,331 15,170
Total revenue 8,828 8,830 8,990 27,302 25,726
Provision for credit losses (Note 5) 270 282 283 822 819
Insurance policyholder benefits, claims and acquisition expense 656 493 1,009 2,671 2,821
Non-interest expenseHuman resources (Note 9) 2,890 2,996 2,866 8,901 8,450Equipment 327 311 287 935 859Occupancy 351 356 350 1,042 997Communications 213 224 207 635 588Professional fees 223 204 178 625 500Amortization of other intangibles 180 178 171 532 490Other 451 467 543 1,321 1,437
4,635 4,736 4,602 13,991 13,321
Income before income taxes 3,267 3,319 3,096 9,818 8,765Income taxes 792 817 718 2,385 2,094
Net income $ 2,475 $ 2,502 $ 2,378 $ 7,433 $ 6,671
Net income attributable to:Shareholders $ 2,449 $ 2,473 $ 2,352 $ 7,356 $ 6,594Non-controlling interests 26 29 26 77 77
$ 2,475 $ 2,502 $ 2,378 $ 7,433 $ 6,671
Basic earnings per share (in dollars) (Note 11) $ 1.66 $ 1.68 $ 1.59 $ 5.00 $ 4.45Diluted earnings per share (in dollars) (Note 11) 1.66 1.68 1.59 4.99 4.43Dividends per common share (in dollars) 0.77 0.77 0.71 2.29 2.09
The accompanying notes are an integral part of these Interim Condensed Consolidated Financial Statements.

58 Royal Bank of Canada Third Quarter 2015
Interim Condensed Consolidated Statements of Comprehensive Income (unaudited)
For the three months ended For the nine months ended
(Millions of Canadian dollars)
July 31
2015April 30
2015July 31
2014July 31
2015July 31
2014
Net income $ 2,475 $ 2,502 $ 2,378 $ 7,433 $ 6,671
Other comprehensive income (loss), net of taxesItems that will be reclassified subsequently to income:
Net change in unrealized gains (losses) on available-for-sale securitiesNet unrealized gains (losses) on available-for-sale securities 14 (122) 39 100 121Reclassification of net losses (gains) on available-for-sale securities to income (9) (20) (7) (29) (42)
5 (142) 32 71 79
Foreign currency translation adjustmentsUnrealized foreign currency translation gains (losses) 3,542 (2,116) (203) 5,982 1,819Net foreign currency translation gains (losses) from hedging activities (1,771) 1,096 166 (3,280) (1,115)Reclassification of losses (gains) on foreign currency translation to income (4) (167) 47 (182) 44Reclassification of losses (gains) on net investment hedging activities to income – 59 – 69 3
1,767 (1,128) 10 2,589 751
Net change in cash flow hedgesNet gains (losses) on derivatives designated as cash flow hedges (236) 36 2 (582) (76)Reclassification of losses (gains) on derivatives designated as cash flow hedges to
income 46 79 (3) 276 (8)
(190) 115 (1) (306) (84)
Items that will not be reclassified subsequently to income:Remeasurements of employee benefit plans (Note 9) 203 413 (178) 126 (84)Net fair value change due to credit risk on financial liabilities designated as at fair
value through profit or loss 165 (79) (28) 161 (110)
368 334 (206) 287 (194)
Total other comprehensive income (loss), net of taxes 1,950 (821) (165) 2,641 552
Total comprehensive income $ 4,425 $ 1,681 $ 2,213 $ 10,074 $ 7,223
Total comprehensive income attributable to:Shareholders $ 4,392 $ 1,657 $ 2,187 $ 9,985 $ 7,146Non-controlling interests 33 24 26 89 77
$ 4,425 $ 1,681 $ 2,213 $ 10,074 $ 7,223
The income tax effect on the Interim Condensed Consolidated Statements of Comprehensive Income is shown in the table below.
For the three months ended For the nine months ended
(Millions of Canadian dollars)
July 31
2015April 30
2015July 31
2014July 31
2015July 31
2014
Income taxes on other comprehensive incomeNet unrealized gains (losses) on available-for-sale securities $ 14 $ (35) $ 26 $ 47 $ 56Reclassification of net losses (gains) on available-for- sale securities to income (4) (5) (3) (7) (6)Unrealized foreign currency translation gains (losses) 4 (3) – 7 4Net foreign currency translation gains (losses) from hedging activities (625) 387 59 (1,160) (395)Reclassification of losses (gains) on net investment hedging activities to income – 19 – 23 1Net gains (losses) on derivatives designated as cash flow hedges (85) 14 1 (208) (27)Reclassification of losses (gains) on derivatives designated as cash flow hedges to
income 16 28 (2) 98 (3)Remeasurements of employee benefit plans 70 147 (64) 44 (34)Net fair value change due to credit risk on financial liabilities designated as at fair
value through profit or loss 61 (29) (10) 60 (40)
Total income tax (recoveries) expenses $ (549) $ 523 $ 7 $ (1,096) $ (444)
The accompanying notes are an integral part of these Interim Condensed Consolidated Financial Statements.

Royal Bank of Canada Third Quarter 2015 59
Inte
rim
Cond
ense
dCo
nsol
idat
edS
tate
men
tsof
Chan
ges
inEq
uity
(una
udit
ed)
Oth
erco
mpo
nent
sof
equi
ty
(Mill
ions
ofCa
nadi
ando
llars
)Pr
efer
red
shar
esCo
mm
onsh
ares
Trea
sury
shar
es–
pref
erre
d
Trea
sury
shar
es–
com
mon
Reta
ined
earn
ings
Ava
ilabl
e-fo
r-sa
lese
curi
ties
Fore
ign
curr
ency
tran
slat
ion
Cash
flow
hedg
es
Tota
loth
erco
mpo
nent
sof
equi
ty
Equi
tyat
trib
utab
leto
shar
ehol
ders
Non
-con
trol
ling
inte
rest
sTo
tale
quit
y
Bala
nce
atAp
ril3
0,20
14$
4,25
0$
14,4
58$
–$
73$
29,4
89$
394
$1,
427
$92
$1,
913
$50
,183
$1,
793
$51
,976
Chan
ges
ineq
uity
Issu
esof
shar
eca
pita
l50
019
––
(7)
––
––
512
–51
2Co
mm
onsh
ares
purc
hase
dfo
rcan
cella
tion
–(2
)–
–(1
1)–
––
–(1
3)–
(13)
Sal
esof
trea
sury
shar
es–
–49
1,74
6–
––
––
1,79
5–
1,79
5Pu
rcha
ses
oftr
easu
rysh
ares
––
(50)
(1,8
09)
––
––
–(1
,859
)–
(1,8
59)
Sha
re-b
ased
com
pens
atio
naw
ards
––
––
(1)
––
––
(1)
–(1
)D
ivid
ends
onco
mm
onsh
ares
––
––
(1,0
25)
––
––
(1,0
25)
–(1
,025
)D
ivid
ends
onpr
efer
red
shar
esan
dot
her
––
––
(55)
––
––
(55)
(47)
(102
)O
ther
––
––
(10)
––
––
(10)
111
Net
inco
me
––
––
2,35
2–
––
–2,
352
262,
378
Tota
loth
erco
mpr
ehen
sive
inco
me
(los
s),n
etof
taxe
s–
––
–(2
06)
3210
(1)
41(1
65)
–(1
65)
Bala
nce
atJu
ly31
,201
4$
4,75
0$
14,4
75$
(1)
$10
$30
,526
$42
6$
1,43
7$
91$
1,95
4$
51,7
14$
1,78
3$
53,4
97
Bala
nce
atJa
nuar
y31
,201
5$
4,35
0$
14,5
31$
1$
(57)
$32
,505
$64
0$
3,83
1$
(136
)$
4,33
5$
55,6
65$
1,75
6$
57,4
21Ch
ange
sin
equi
tyIs
sues
ofsh
are
capi
tal
300
25–
–(6
)–
––
–31
9–
319
Sal
esof
trea
sury
shar
es–
–56
1,88
7–
––
––
1,94
3–
1,94
3Pu
rcha
ses
oftr
easu
rysh
ares
––
(55)
(1,9
34)
––
––
–(1
,989
)–
(1,9
89)
Sha
re-b
ased
com
pens
atio
naw
ards
––
––
(2)
––
––
(2)
–(2
)D
ivid
ends
onco
mm
onsh
ares
––
––
(1,1
11)
––
––
(1,1
11)
–(1
,111
)D
ivid
ends
onpr
efer
red
shar
esan
dot
her
––
––
(47)
––
––
(47)
–(4
7)O
ther
––
––
(4)
––
––
(4)
3632
Net
inco
me
––
––
2,47
3–
––
–2,
473
292,
502
Tota
loth
erco
mpr
ehen
sive
inco
me
(los
s),n
etof
taxe
s–
––
–33
4(1
42)
(1,1
23)
115
(1,1
50)
(816
)(5
)(8
21)
Bala
nce
atAp
ril3
0,20
15$
4,65
0$
14,5
56$
2$
(104
)$
34,1
42$
498
$2,
708
$(2
1)$
3,18
5$
56,4
31$
1,81
6$
58,2
47Ch
ange
sin
equi
tyIs
sues
ofsh
are
capi
tal
300
5–
–(5
)–
––
–30
0–
300
Sal
esof
trea
sury
shar
es–
–26
1,49
5–
––
––
1,52
1–
1,52
1Pu
rcha
ses
oftr
easu
rysh
ares
––
(28)
(1,3
54)
––
––
–(1
,382
)–
(1,3
82)
Sha
re-b
ased
com
pens
atio
naw
ards
––
––
––
––
––
––
Div
iden
dson
com
mon
shar
es–
––
–(1
,110
)–
––
–(1
,110
)–
(1,1
10)
Div
iden
dson
pref
erre
dsh
ares
and
othe
r–
––
–(5
0)–
––
–(5
0)(4
6)(9
6)O
ther
––
––
1–
––
–1
(8)
(7)
Net
inco
me
––
––
2,44
9–
––
–2,
449
262,
475
Tota
loth
erco
mpr
ehen
sive
inco
me
(los
s),n
etof
taxe
s–
––
–36
85
1,76
0(1
90)
1,57
51,
943
71,
950
Bala
nce
atJu
ly31
,201
5$
4,95
0$
14,5
61$
–$
37$
35,7
95$
503
$4,
468
$(2
11)
$4,
760
$60
,103
$1,
795
$61
,898

60 Royal Bank of Canada Third Quarter 2015
Oth
erco
mpo
nent
sof
equi
ty
(Mill
ions
ofCa
nadi
ando
llars
)Pr
efer
red
shar
esCo
mm
onsh
ares
Trea
sury
shar
es–
pref
erre
d
Trea
sury
shar
es–
com
mon
Reta
ined
earn
ings
Ava
ilabl
e-fo
r-sa
lese
curi
ties
Fore
ign
curr
ency
tran
slat
ion
Cash
flow
hedg
es
Tota
loth
erco
mpo
nent
sof
equi
ty
Equi
tyat
trib
utab
leto
shar
ehol
ders
Non
-con
trol
ling
inte
rest
sTo
tale
quit
y
Bala
nce
atO
ctob
er31
,201
3$
4,60
0$
14,3
77$
1$
41$
27,4
38$
347
$68
6$
175
$1,
208
$47
,665
$1,
795
$49
,460
Chan
ges
ineq
uity
Issu
esof
shar
eca
pita
l1,
000
114
––
(14)
––
––
1,10
0–
1,10
0Co
mm
onsh
ares
purc
hase
dfo
rcan
cella
tion
–(1
6)–
–(9
7)–
––
–(1
13)
–(1
13)
Pref
erre
dsh
ares
rede
emed
(850
)–
––
––
––
–(8
50)
–(8
50)
Sal
esof
trea
sury
shar
es–
–10
03,
848
––
––
–3,
948
–3,
948
Purc
hase
sof
trea
sury
shar
es–
–(1
02)
(3,8
79)
––
––
–(3
,981
)–
(3,9
81)
Sha
re-b
ased
com
pens
atio
naw
ards
––
––
(6)
––
––
(6)
–(6
)D
ivid
ends
onco
mm
onsh
ares
––
––
(3,0
16)
––
––
(3,0
16)
–(3
,016
)D
ivid
ends
onpr
efer
red
shar
esan
dot
her
––
––
(169
)–
––
–(1
69)
(94)
(263
)O
ther
––
––
(10)
––
––
(10)
5(5
)N
etin
com
e–
––
–6,
594
––
––
6,59
477
6,67
1To
talo
ther
com
preh
ensi
vein
com
e(l
oss)
,net
ofta
xes
––
––
(194
)79
751
(84)
746
552
–55
2
Bala
nce
atJu
ly31
,201
4$
4,75
0$
14,4
75$
(1)
$10
$30
,526
$42
6$
1,43
7$
91$
1,95
4$
51,7
14$
1,78
3$
53,4
97
Bala
nce
atO
ctob
er31
,201
4$
4,07
5$
14,5
11$
–$
71$
31,6
15$
432
$1,
891
$95
$2,
418
$52
,690
$1,
813
$54
,503
Chan
ges
ineq
uity
Issu
esof
shar
eca
pita
l1,
200
50–
–(1
8)–
––
–1,
232
–1,
232
Pref
erre
dsh
ares
rede
emed
(325
)–
––
––
––
–(3
25)
–(3
25)
Sal
esof
trea
sury
shar
es–
–97
5,16
3–
––
––
5,26
0–
5,26
0Pu
rcha
ses
oftr
easu
rysh
ares
––
(97)
(5,1
97)
––
––
–(5
,294
)–
(5,2
94)
Sha
re-b
ased
com
pens
atio
naw
ards
––
––
––
––
––
––
Div
iden
dson
com
mon
shar
es–
––
–(3
,302
)–
––
–(3
,302
)–
(3,3
02)
Div
iden
dson
pref
erre
dsh
ares
and
othe
r–
––
–(1
37)
––
––
(137
)(9
2)(2
29)
Oth
er–
––
–(6
)–
––
–(6
)(1
5)(2
1)N
etin
com
e–
––
–7,
356
––
––
7,35
677
7,43
3To
talo
ther
com
preh
ensi
vein
com
e(l
oss)
,net
ofta
xes
––
––
287
712,
577
(306
)2,
342
2,62
912
2,64
1
Bala
nce
atJu
ly31
,201
5$
4,95
0$
14,5
61$
–$
37$
35,7
95$
503
$4,
468
$(2
11)
$4,
760
$60
,103
$1,
795
$61
,898
The
acco
mpa
nyin
gno
tes
are
anin
tegr
alpa
rtof
thes
eIn
teri
mCo
nden
sed
Cons
olid
ated
Fina
ncia
lSta
tem
ents
.

Royal Bank of Canada Third Quarter 2015 61
Interim Condensed Consolidated Statements of Cash Flows (unaudited)
For the three months ended For the nine months ended
(Millions of Canadian dollars)
July 31
2015April 30
2015July 31
2014July 31
2015July 31
2014Cash flows from operating activities
Net income $ 2,475 $ 2,502 $ 2,378 $ 7,433 $ 6,671Adjustments for non-cash items and others
Provision for credit losses 270 282 283 822 819Depreciation 127 134 125 388 367Deferred income taxes (54) 98 (177) 49 (24)Amortization and Impairment of other intangibles 179 184 173 538 492Impairment of investments in joint ventures and associates 5 9 5 20 17Loss (gain) on sale of premises and equipment 5 (1) 8 (34) 13Loss (gain) on available-for-sale securities (64) (60) (39) (165) (156)Loss (gain) on disposition of business (4) 23 40 19 100Impairment of available-for-sale securities 10 18 2 42 17Share of loss (profit) in joint ventures and associates (28) (39) (44) (109) (128)
Adjustments for net changes in operating assets and liabilitiesInsurance claims and policy benefit liabilities 22 (67) 310 831 439Net change in accrued interest receivable and payable (172) 262 (133) (228) 77Current income taxes (107) 738 434 (512) (132)Derivative assets (5,459) 43,560 (190) (25,061) 1,999Derivative liabilities 3,879 (40,650) 1,890 27,116 (1,649)Trading securities (2,569) 11,231 (4,380) (21,083) (8,629)Loans, net of securitizations (15,048) (1,380) (9,108) (29,497) (21,969)Assets purchased under reverse repurchase agreements and securities
borrowed (9,291) 205 (1,224) (37,079) (17,688)Deposits, net of securitizations 44,991 (1,610) 10,732 83,988 39,930Obligations related to assets sold under repurchase agreements and
securities loaned 2,029 (94) 1,633 18,905 5,007Obligations related to securities sold short 1,342 (5,171) 1,631 5,311 4,942Brokers and dealers receivable and payable (794) (538) (631) (162) (628)Other (4,336) (4,573) 978 (10,853) (809)
Net cash from (used in) operating activities 17,408 5,063 4,696 20,679 9,078Cash flows from investing activities
Change in interest-bearing deposits with banks (6,688) (581) (173) (2,497) 3,656Proceeds from sale of available-for-sale securities 2,579 2,824 703 7,630 3,776Proceeds from maturity of available-for-sale securities 8,047 8,365 10,383 24,718 27,941Purchases of available-for-sale securities (18,288) (15,826) (14,381) (42,295) (38,173)Proceeds from maturity of held-to-maturity securities 16 – 73 16 285Purchases of held-to-maturity securities (103) (122) (367) (1,832) (552)Net acquisitions of premises and equipment and other intangibles (449) (218) (290) (948) (832)Proceeds from dispositions 63 – 91 63 91
Net cash from (used in) investing activities (14,823) (5,558) (3,961) (15,145) (3,808)Cash flows from financing activities
Redemption of trust capital securities – – – – (900)Issue of subordinated debentures 1,000 – 1,000 1,000 1,000Repayment of subordinated debentures (1,500) – (600) (1,700) (1,600)Issue of common shares 5 25 19 50 114Common shares purchased for cancellation – – (13) – (113)Issue of preferred shares 300 300 500 1,200 1,000Redemption of preferred shares – – – (325) (850)Sales of treasury shares 1,521 1,943 1,795 5,260 3,948Purchase of treasury shares (1,382) (1,989) (1,859) (5,294) (3,981)Dividends paid (1,158) (1,121) (1,077) (3,404) (3,131)Issuance costs (5) (6) (7) (18) (14)Dividends/distributions paid to non-controlling interests (46) – (47) (92) (94)Change in short-term borrowings of subsidiaries (17) (111) (20) (104) (18)
Net cash from (used in) financing activities (1,282) (959) (309) (3,427) (4,639)Effect of exchange rate changes on cash and due from banks 280 (180) (8) 448 116Net change in cash and due from banks 1,583 (1,634) 418 2,555 747Cash and due from banks at beginning of period (1) 18,393 20,027 15,879 17,421 15,550Cash and due from banks at end of period (1) $ 19,976 $ 18,393 $ 16,297 $ 19,976 $ 16,297Cash flows from operating activities include:
Amount of interest paid $ 1,882 $ 1,588 $ 1,999 $ 5,502 $ 5,656Amount of interest received 5,370 5,349 5,169 15,885 15,570Amount of dividend received 542 483 537 1,430 1,290Amount of income taxes paid 296 586 360 1,447 1,591
(1) We are required to maintain balances with central banks and other regulatory authorities. The total balances were $2.9 billion as at July 31, 2015 (April 30, 2015 – $2.3 billion;January 31, 2015 – $2.8 billion; October 31, 2014 – $2.0 billion; July 31, 2014 – $2.3 billion; April 30, 2014 – $2.3 billion; October 31, 2013 – $2.6 billion).
The accompanying notes are an integral part of these Interim Condensed Consolidated Financial Statements.

62 Royal Bank of Canada Third Quarter 2015
Note 1 General information
Our unaudited Interim Condensed Consolidated Financial Statements (Condensed Financial Statements) are presented in compliancewith International Accounting Standard (IAS) 34 Interim Financial Reporting. The Condensed Financial Statements do not include allthe information and disclosures required in the annual financial statements and should be read in conjunction with our audited 2014Annual Consolidated Financial Statements and the accompanying notes included on pages 108 to 196 in our 2014 Annual Report.Tabular information is stated in millions of Canadian dollars, except per share amounts and percentages. On August 25, 2015, theBoard of Directors authorized the Condensed Financial Statements for issue.
Note 2 Summary of significant accounting policies, estimates and judgments
Except as indicated below, the Condensed Financial Statements have been prepared using the same accounting policies andmethods used in preparation of our audited 2014 Annual Consolidated Financial Statements.
Changes in accounting policiesDuring the first quarter, we adopted the following new accounting pronouncements:
IAS 32 Financial Instruments: Presentation (IAS 32)Amendments to IAS 32 clarify the existing requirements for offsetting financial assets and financial liabilities. The standard providesclarifications on the legal right to offset transactions, and when transactions settled through a gross settlement system would meetthe simultaneous settlement criteria. We retrospectively adopted the amendments on November 1, 2014. The adoption of theseamendments did not have an impact on our consolidated financial statements.
International Financial Reporting Standards (IFRS) Interpretations Committee IFRIC Interpretation 21 Levies (IFRIC 21)IFRIC 21 provides guidance on when to recognize a liability to pay a levy that is accounted for in accordance with IAS 37 Provisions,Contingent Liabilities and Contingent Assets. It also addresses the accounting for a liability to pay a levy whose timing and amount iscertain. The interpretation clarifies that the obligating event that gives rise to a liability to pay a levy is the activity described in therelevant legislation that triggers the payment of the levy. We prospectively adopted the standard on November 1, 2014. We did notrestate our quarterly or annual results for periods before November 1, 2014 as the amounts were not significant. The adoption of thisinterpretation did not have a material impact on our consolidated financial statements.
Future changes in accounting policy and disclosureThe following are developments in new accounting standards that took place during the nine months to date:
IFRS 15 Revenue from Contracts with Customers (IFRS 15)In July 2015, the International Accounting Standards Board (IASB) announced a one-year deferral of the IFRS 15 effective date. Thestandard provides a single, principles based five-step model for revenue recognition to be applied to all contracts with customers.The formal amendment to the standard, specifying the new effective date, is expected to be issued in September 2015. IFRS 15 will beeffective for us on November 1, 2018.
IFRS 9 Financial Instruments (IFRS 9)In January 2015, the Office of the Superintendent of Financial Institutions (OSFI) issued an advisory with respect to the early adoptionof IFRS 9 for Domestic Systemically Important Banks (D-SIBs), requiring D-SIBs to adopt IFRS 9 for the annual period beginning onNovember 1, 2017. As a D-SIB, we will be required to adopt IFRS 9 beginning on November 1, 2017, with the exception of the owncredit provisions which we adopted in the second quarter of 2014.

Royal Bank of Canada Third Quarter 2015 63
Note 3 Fair value of financial instruments
Carrying value and fair value of selected financial instrumentsThe following tables provide a comparison of the carrying and fair values for each classification of financial instruments. Refer toNote 2 and Note 3 of our audited 2014 Annual Consolidated Financial Statements for a description of the valuation techniques andinputs used in the fair value measurement of our financial instruments. There have been no significant changes to our determinationof fair value during the quarter.
As at July 31, 2015
Carrying value and fair value Carrying value Fair value
(Millions of Canadian dollars)
Financialinstrumentsclassified as
at FVTPL
Financialinstruments
designated asat FVTPL
Available-for-sale
instrumentsmeasured at
fair value
Financialinstrumentsmeasured at
amortized cost
Financialinstrumentsmeasured at
amortized costTotal carrying
amountTotal
fair value
Financial assetsSecurities
Trading $ 162,060 $ 10,310 $ – $ – $ – $ 172,370 $ 172,370Available-for-sale (1) – – 59,842 3,303 3,524 63,145 63,366
162,060 10,310 59,842 3,303 3,524 235,515 235,736
Assets purchased under reverse repurchaseagreements and securities borrowed – 105,393 – 67,266 67,282 172,659 172,675
LoansRetail – – – 342,223 343,941 342,223 343,941Wholesale 1,895 1,674 – 116,807 116,059 120,376 119,628
1,895 1,674 – 459,030 460,000 462,599 463,569
OtherDerivatives 112,459 – – – – 112,459 112,459Other assets (2) – 979 – 44,867 44,867 45,846 45,846
Financial liabilitiesDeposits
Personal $ 78 $ 17,763 $ 200,788 $ 201,219 $ 218,629 $ 219,060Business and government (3) – 82,242 367,155 368,875 449,397 451,117Bank (4) – 8,201 18,009 18,014 26,210 26,215
78 108,206 585,952 588,108 694,236 696,392
OtherObligations related to securities sold short 55,656 – – – 55,656 55,656Obligations related to assets sold under
repurchase agreements and securitiesloaned – 74,474 8,762 8,762 83,236 83,236
Derivatives 116,083 – – – 116,083 116,083Other liabilities (5) 132 11 42,597 42,550 42,740 42,693
Subordinated debentures – 110 7,264 7,198 7,374 7,308
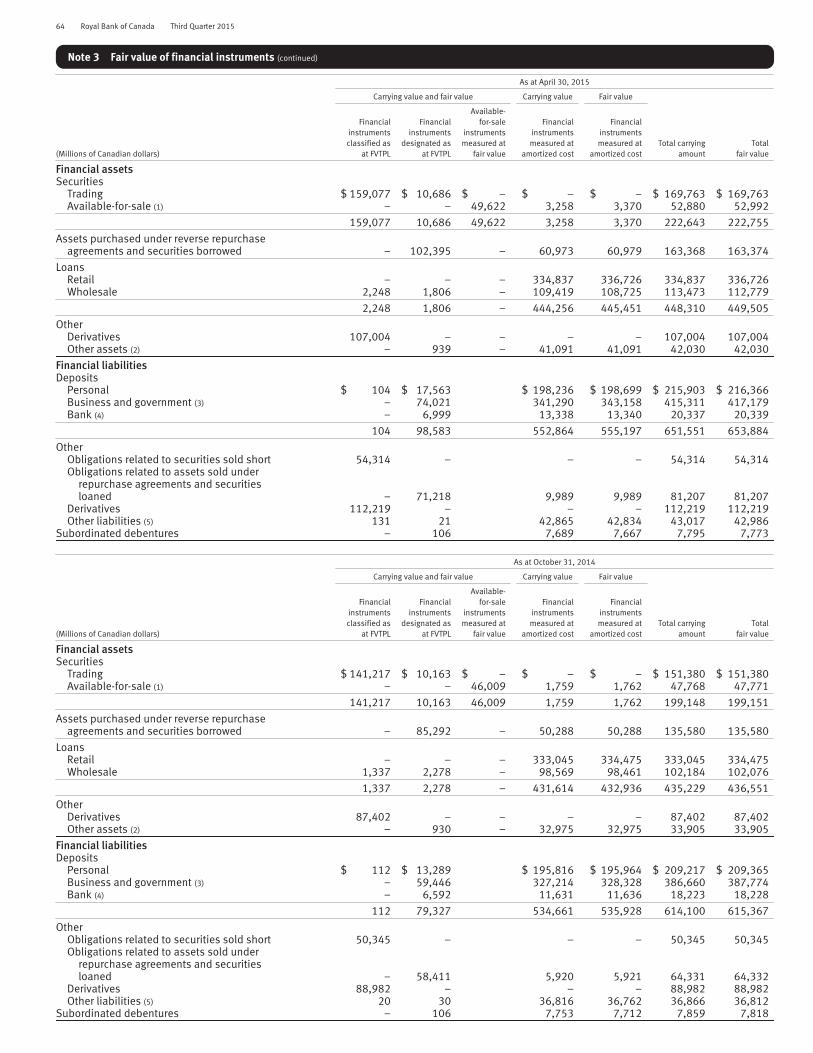
64 Royal Bank of Canada Third Quarter 2015
Note 3 Fair value of financial instruments (continued)
As at April 30, 2015
Carrying value and fair value Carrying value Fair value
(Millions of Canadian dollars)
Financialinstrumentsclassified as
at FVTPL
Financialinstruments
designated asat FVTPL
Available-for-sale
instrumentsmeasured at
fair value
Financialinstrumentsmeasured at
amortized cost
Financialinstrumentsmeasured at
amortized costTotal carrying
amountTotal
fair value
Financial assetsSecurities
Trading $ 159,077 $ 10,686 $ – $ – $ – $ 169,763 $ 169,763Available-for-sale (1) – – 49,622 3,258 3,370 52,880 52,992
159,077 10,686 49,622 3,258 3,370 222,643 222,755
Assets purchased under reverse repurchaseagreements and securities borrowed – 102,395 – 60,973 60,979 163,368 163,374
LoansRetail – – – 334,837 336,726 334,837 336,726Wholesale 2,248 1,806 – 109,419 108,725 113,473 112,779
2,248 1,806 – 444,256 445,451 448,310 449,505
OtherDerivatives 107,004 – – – – 107,004 107,004Other assets (2) – 939 – 41,091 41,091 42,030 42,030
Financial liabilitiesDeposits
Personal $ 104 $ 17,563 $ 198,236 $ 198,699 $ 215,903 $ 216,366Business and government (3) – 74,021 341,290 343,158 415,311 417,179Bank (4) – 6,999 13,338 13,340 20,337 20,339
104 98,583 552,864 555,197 651,551 653,884
OtherObligations related to securities sold short 54,314 – – – 54,314 54,314Obligations related to assets sold under
repurchase agreements and securitiesloaned – 71,218 9,989 9,989 81,207 81,207
Derivatives 112,219 – – – 112,219 112,219Other liabilities (5) 131 21 42,865 42,834 43,017 42,986
Subordinated debentures – 106 7,689 7,667 7,795 7,773
As at October 31, 2014
Carrying value and fair value Carrying value Fair value
(Millions of Canadian dollars)
Financialinstrumentsclassified as
at FVTPL
Financialinstruments
designated asat FVTPL
Available-for-sale
instrumentsmeasured at
fair value
Financialinstrumentsmeasured at
amortized cost
Financialinstrumentsmeasured at
amortized costTotal carrying
amountTotal
fair value
Financial assetsSecurities
Trading $ 141,217 $ 10,163 $ – $ – $ – $ 151,380 $ 151,380Available-for-sale (1) – – 46,009 1,759 1,762 47,768 47,771
141,217 10,163 46,009 1,759 1,762 199,148 199,151
Assets purchased under reverse repurchaseagreements and securities borrowed – 85,292 – 50,288 50,288 135,580 135,580
LoansRetail – – – 333,045 334,475 333,045 334,475Wholesale 1,337 2,278 – 98,569 98,461 102,184 102,076
1,337 2,278 – 431,614 432,936 435,229 436,551
OtherDerivatives 87,402 – – – – 87,402 87,402Other assets (2) – 930 – 32,975 32,975 33,905 33,905
Financial liabilitiesDeposits
Personal $ 112 $ 13,289 $ 195,816 $ 195,964 $ 209,217 $ 209,365Business and government (3) – 59,446 327,214 328,328 386,660 387,774Bank (4) – 6,592 11,631 11,636 18,223 18,228
112 79,327 534,661 535,928 614,100 615,367
OtherObligations related to securities sold short 50,345 – – – 50,345 50,345Obligations related to assets sold under
repurchase agreements and securitiesloaned – 58,411 5,920 5,921 64,331 64,332
Derivatives 88,982 – – – 88,982 88,982Other liabilities (5) 20 30 36,816 36,762 36,866 36,812
Subordinated debentures – 106 7,753 7,712 7,859 7,818
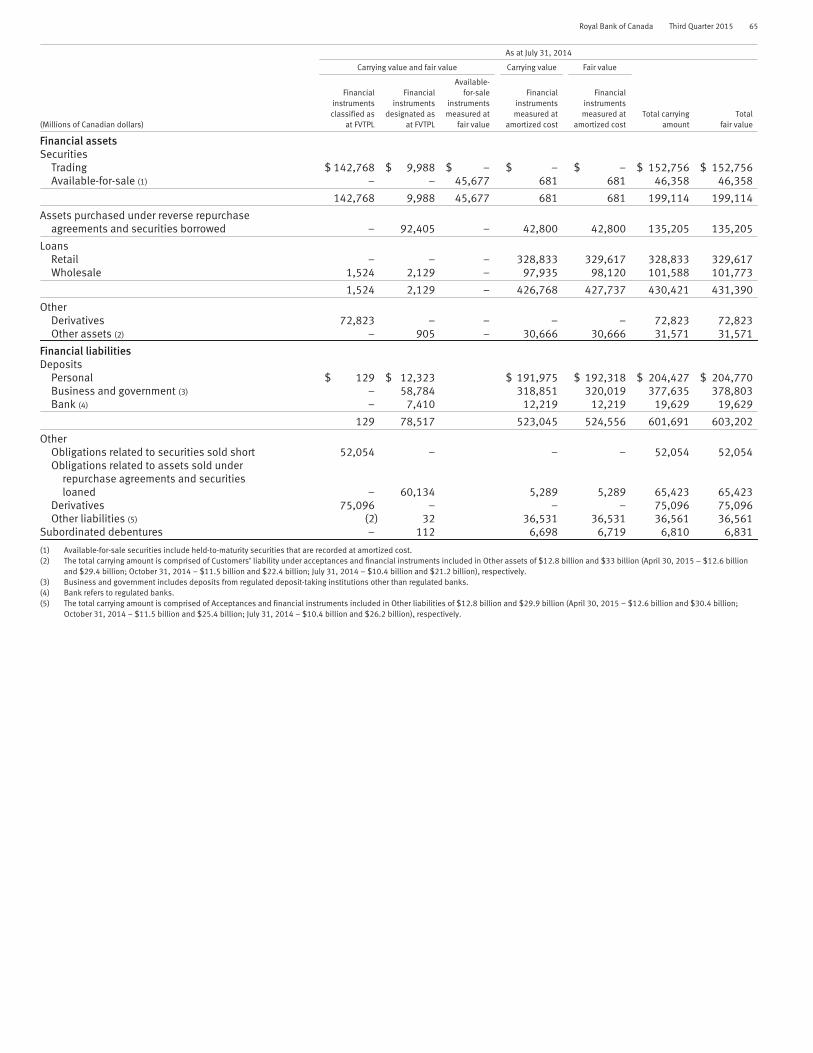
Royal Bank of Canada Third Quarter 2015 65
As at July 31, 2014
Carrying value and fair value Carrying value Fair value
(Millions of Canadian dollars)
Financialinstrumentsclassified as
at FVTPL
Financialinstruments
designated asat FVTPL
Available-for-sale
instrumentsmeasured at
fair value
Financialinstrumentsmeasured at
amortized cost
Financialinstrumentsmeasured at
amortized costTotal carrying
amountTotal
fair value
Financial assetsSecurities
Trading $ 142,768 $ 9,988 $ – $ – $ – $ 152,756 $ 152,756Available-for-sale (1) – – 45,677 681 681 46,358 46,358
142,768 9,988 45,677 681 681 199,114 199,114
Assets purchased under reverse repurchaseagreements and securities borrowed – 92,405 – 42,800 42,800 135,205 135,205
LoansRetail – – – 328,833 329,617 328,833 329,617Wholesale 1,524 2,129 – 97,935 98,120 101,588 101,773
1,524 2,129 – 426,768 427,737 430,421 431,390
OtherDerivatives 72,823 – – – – 72,823 72,823Other assets (2) – 905 – 30,666 30,666 31,571 31,571
Financial liabilitiesDeposits
Personal $ 129 $ 12,323 $ 191,975 $ 192,318 $ 204,427 $ 204,770Business and government (3) – 58,784 318,851 320,019 377,635 378,803Bank (4) – 7,410 12,219 12,219 19,629 19,629
129 78,517 523,045 524,556 601,691 603,202
OtherObligations related to securities sold short 52,054 – – – 52,054 52,054Obligations related to assets sold under
repurchase agreements and securitiesloaned – 60,134 5,289 5,289 65,423 65,423
Derivatives 75,096 – – – 75,096 75,096Other liabilities (5) (2) 32 36,531 36,531 36,561 36,561
Subordinated debentures – 112 6,698 6,719 6,810 6,831
(1) Available-for-sale securities include held-to-maturity securities that are recorded at amortized cost.(2) The total carrying amount is comprised of Customers’ liability under acceptances and financial instruments included in Other assets of $12.8 billion and $33 billion (April 30, 2015 – $12.6 billion
and $29.4 billion; October 31, 2014 – $11.5 billion and $22.4 billion; July 31, 2014 – $10.4 billion and $21.2 billion), respectively.(3) Business and government includes deposits from regulated deposit-taking institutions other than regulated banks.(4) Bank refers to regulated banks.(5) The total carrying amount is comprised of Acceptances and financial instruments included in Other liabilities of $12.8 billion and $29.9 billion (April 30, 2015 – $12.6 billion and $30.4 billion;
October 31, 2014 – $11.5 billion and $25.4 billion; July 31, 2014 – $10.4 billion and $26.2 billion), respectively.

66 Royal Bank of Canada Third Quarter 2015
Note 3 Fair value of financial instruments (continued)
Fair value of assets and liabilities measured on a recurring basis and classified using the fair value hierarchyThe following tables present the financial instruments that are measured at fair value on a recurring basis and classified by the fairvalue hierarchy.
As at
July 31, 2015 April 30, 2015
Fair value measurements using Totalgross fair
valueNetting
adjustments
Assets/liabilities
at fair value
Fair value measurements using Totalgross fair
valueNetting
adjustments
Assets/liabilities
at fair value(Millions of Canadian dollars) Level 1 Level 2 Level 3 Level 1 Level 2 Level 3
Financial assetsInterest bearing deposits with banks $ – $ 4,917 $ – $ 4,917 $ $ 4,917 $ – $ 728 $ – $ 728 $ $ 728
SecuritiesTrading
Canadian government debt (1)Federal 10,024 7,457 – 17,481 17,481 10,468 7,090 – 17,558 17,558Provincial and municipal – 13,565 – 13,565 13,565 – 12,797 – 12,797 12,797
U.S. state, municipal and agenciesdebt (1) 3,442 34,106 12 37,560 37,560 5,368 31,456 1 36,825 36,825
Other OECD government debt (2) 5,338 9,657 – 14,995 14,995 4,619 10,026 – 14,645 14,645Mortgage-backed securities (1) – 2,823 6 2,829 2,829 – 3,038 9 3,047 3,047Asset-backed securities
CDOs (3) – 11 64 75 75 – 17 54 71 71Non-CDO securities – 2,583 29 2,612 2,612 – 1,809 41 1,850 1,850
Corporate debt and other debt 24 30,127 65 30,216 30,216 21 28,396 166 28,583 28,583Equities 49,912 2,995 130 53,037 53,037 50,312 3,900 175 54,387 54,387
68,740 103,324 306 172,370 172,370 70,788 98,529 446 169,763 169,763
Available-for-sale (4)Canadian government debt (1)
Federal 324 11,363 – 11,687 11,687 319 11,421 – 11,740 11,740Provincial and municipal – 1,372 – 1,372 1,372 – 1,044 – 1,044 1,044
U.S. state, municipal and agenciesdebt (1) – 11,718 878 12,596 12,596 – 7,506 682 8,188 8,188
Other OECD government debt 7,152 8,130 13 15,295 15,295 6,619 6,995 12 13,626 13,626Mortgage-backed securities (1) – 460 – 460 460 – 124 – 124 124Asset-backed securities
CDOs – 1,148 – 1,148 1,148 – 925 30 955 955Non-CDO securities – 575 198 773 773 – 441 165 606 606
Corporate debt and other debt – 12,961 1,675 14,636 14,636 – 9,824 1,734 11,558 11,558Equities 426 320 1,014 1,760 1,760 146 502 1,010 1,658 1,658Loan substitute securities 100 – – 100 100 83 25 – 108 108
8,002 48,047 3,778 59,827 59,827 7,167 38,807 3,633 49,607 49,607
Assets purchased under reverse repurchaseagreements and securities borrowed – 105,393 – 105,393 105,393 – 102,395 – 102,395 102,395
Loans – 2,901 668 3,569 3,569 – 3,437 617 4,054 4,054Other
DerivativesInterest rate contracts 10 143,797 384 144,191 144,191 88 143,875 441 144,404 144,404Foreign exchange contracts – 49,164 93 49,257 49,257 – 45,569 54 45,623 45,623Credit derivatives – 88 6 94 94 – 127 8 135 135Other contracts 2,949 5,954 638 9,541 9,541 2,678 4,661 423 7,762 7,762Valuation adjustments (5) – (1,080) (39) (1,119) (1,119) – (910) (36) (946) (946)
Total gross derivatives 2,959 197,923 1,082 201,964 201,964 2,766 193,322 890 196,978 196,978Netting adjustments (89,505) (89,505) (89,974) (89,974)
Total derivatives 112,459 107,004Other assets 725 254 – 979 979 730 209 – 939 939
$ 80,426 $ 462,759 $ 5,834 $ 549,019 $ (89,505) $ 459,514 $ 81,451 $ 437,427 $ 5,586 $ 524,464 $ (89,974) $ 434,490
Financial LiabilitiesDeposits
Personal $ – $ 17,205 $ 636 $ 17,841 $ $ 17,841 $ – $ 17,032 $ 635 $ 17,667 $ $ 17,667Business and government – 82,234 8 82,242 82,242 – 73,938 83 74,021 74,021Bank – 8,201 – 8,201 8,201 – 6,999 – 6,999 6,999
OtherObligations related to securities
sold short 36,733 18,923 – 55,656 55,656 35,910 18,404 – 54,314 54,314Obligations related to assets sold under
repurchase agreements andsecurities loaned – 74,474 – 74,474 74,474 – 71,218 – 71,218 71,218
DerivativesInterest rate contracts 1 137,443 841 138,285 138,285 70 137,484 899 138,453 138,453Foreign exchange contracts – 54,602 41 54,643 54,643 – 52,075 30 52,105 52,105Credit derivatives – 199 7 206 206 – 256 9 265 265Other contracts 2,983 8,902 877 12,762 12,762 2,561 7,667 914 11,142 11,142Valuation adjustments (5) – (160) 15 (145) (145) – (42) 15 (27) (27)
Total gross derivatives 2,984 200,986 1,781 205,751 205,751 2,631 197,440 1,867 201,938 201,938Netting adjustments (89,668) (89,668) (89,719) (89,719)
Total derivatives 116,083 112,219Other liabilities 100 11 32 143 143 89 21 42 152 152Subordinated debentures – 110 – 110 110 – 106 – 106 106
$ 39,817 $ 402,144 $ 2,457 $ 444,418 $ (89,668) $ 354,750 $ 38,630 $ 385,158 $ 2,627 $ 426,415 $ (89,719) $ 336,696
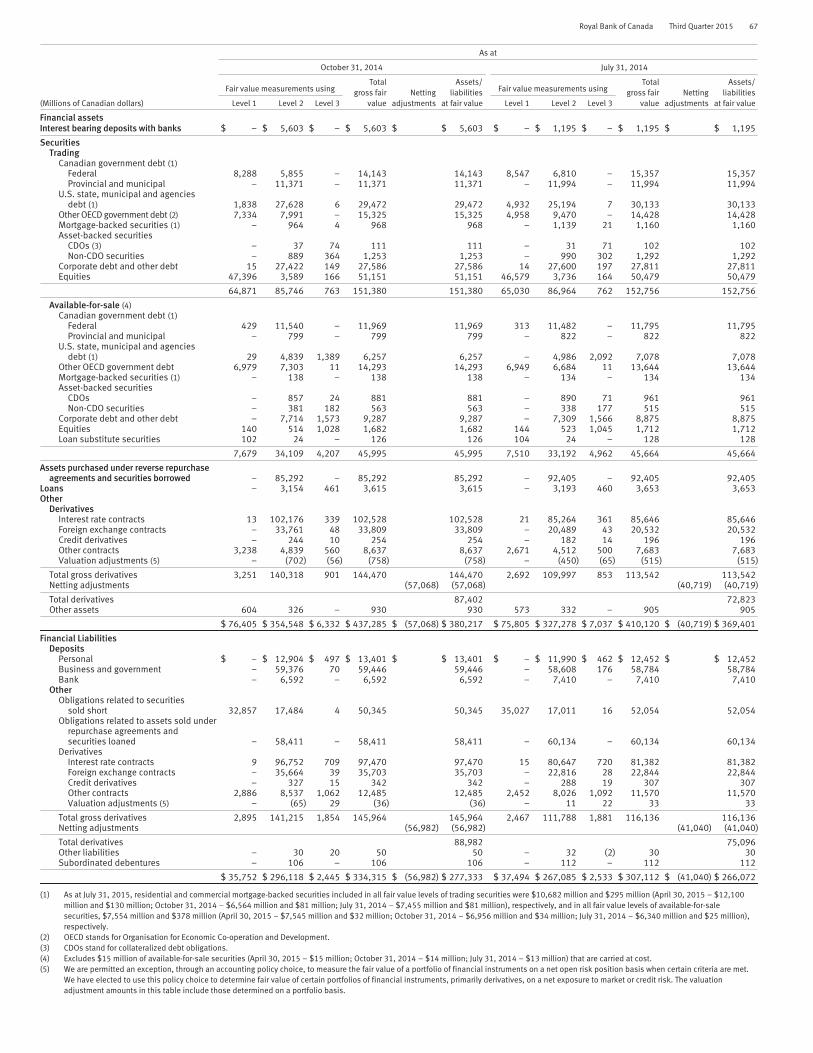
Royal Bank of Canada Third Quarter 2015 67
As at
October 31, 2014 July 31, 2014
Fair value measurements usingTotal
gross fairvalue
Nettingadjustments
Assets/liabilities
at fair value
Fair value measurements usingTotal
gross fairvalue
Nettingadjustments
Assets/liabilities
at fair value(Millions of Canadian dollars) Level 1 Level 2 Level 3 Level 1 Level 2 Level 3
Financial assetsInterest bearing deposits with banks $ – $ 5,603 $ – $ 5,603 $ $ 5,603 $ – $ 1,195 $ – $ 1,195 $ $ 1,195
SecuritiesTrading
Canadian government debt (1)Federal 8,288 5,855 – 14,143 14,143 8,547 6,810 – 15,357 15,357Provincial and municipal – 11,371 – 11,371 11,371 – 11,994 – 11,994 11,994
U.S. state, municipal and agenciesdebt (1) 1,838 27,628 6 29,472 29,472 4,932 25,194 7 30,133 30,133
Other OECD government debt (2) 7,334 7,991 – 15,325 15,325 4,958 9,470 – 14,428 14,428Mortgage-backed securities (1) – 964 4 968 968 – 1,139 21 1,160 1,160Asset-backed securities
CDOs (3) – 37 74 111 111 – 31 71 102 102Non-CDO securities – 889 364 1,253 1,253 – 990 302 1,292 1,292
Corporate debt and other debt 15 27,422 149 27,586 27,586 14 27,600 197 27,811 27,811Equities 47,396 3,589 166 51,151 51,151 46,579 3,736 164 50,479 50,479
64,871 85,746 763 151,380 151,380 65,030 86,964 762 152,756 152,756
Available-for-sale (4)Canadian government debt (1)
Federal 429 11,540 – 11,969 11,969 313 11,482 – 11,795 11,795Provincial and municipal – 799 – 799 799 – 822 – 822 822
U.S. state, municipal and agenciesdebt (1) 29 4,839 1,389 6,257 6,257 – 4,986 2,092 7,078 7,078
Other OECD government debt 6,979 7,303 11 14,293 14,293 6,949 6,684 11 13,644 13,644Mortgage-backed securities (1) – 138 – 138 138 – 134 – 134 134Asset-backed securities
CDOs – 857 24 881 881 – 890 71 961 961Non-CDO securities – 381 182 563 563 – 338 177 515 515
Corporate debt and other debt – 7,714 1,573 9,287 9,287 – 7,309 1,566 8,875 8,875Equities 140 514 1,028 1,682 1,682 144 523 1,045 1,712 1,712Loan substitute securities 102 24 – 126 126 104 24 – 128 128
7,679 34,109 4,207 45,995 45,995 7,510 33,192 4,962 45,664 45,664
Assets purchased under reverse repurchaseagreements and securities borrowed – 85,292 – 85,292 85,292 – 92,405 – 92,405 92,405
Loans – 3,154 461 3,615 3,615 – 3,193 460 3,653 3,653Other
DerivativesInterest rate contracts 13 102,176 339 102,528 102,528 21 85,264 361 85,646 85,646Foreign exchange contracts – 33,761 48 33,809 33,809 – 20,489 43 20,532 20,532Credit derivatives – 244 10 254 254 – 182 14 196 196Other contracts 3,238 4,839 560 8,637 8,637 2,671 4,512 500 7,683 7,683Valuation adjustments (5) – (702) (56) (758) (758) – (450) (65) (515) (515)
Total gross derivatives 3,251 140,318 901 144,470 144,470 2,692 109,997 853 113,542 113,542Netting adjustments (57,068) (57,068) (40,719) (40,719)
Total derivatives 87,402 72,823Other assets 604 326 – 930 930 573 332 – 905 905
$ 76,405 $ 354,548 $ 6,332 $ 437,285 $ (57,068) $ 380,217 $ 75,805 $ 327,278 $ 7,037 $ 410,120 $ (40,719) $ 369,401
Financial LiabilitiesDeposits
Personal $ – $ 12,904 $ 497 $ 13,401 $ $ 13,401 $ – $ 11,990 $ 462 $ 12,452 $ $ 12,452Business and government – 59,376 70 59,446 59,446 – 58,608 176 58,784 58,784Bank – 6,592 – 6,592 6,592 – 7,410 – 7,410 7,410
OtherObligations related to securities
sold short 32,857 17,484 4 50,345 50,345 35,027 17,011 16 52,054 52,054Obligations related to assets sold under
repurchase agreements andsecurities loaned – 58,411 – 58,411 58,411 – 60,134 – 60,134 60,134
DerivativesInterest rate contracts 9 96,752 709 97,470 97,470 15 80,647 720 81,382 81,382Foreign exchange contracts – 35,664 39 35,703 35,703 – 22,816 28 22,844 22,844Credit derivatives – 327 15 342 342 – 288 19 307 307Other contracts 2,886 8,537 1,062 12,485 12,485 2,452 8,026 1,092 11,570 11,570Valuation adjustments (5) – (65) 29 (36) (36) – 11 22 33 33
Total gross derivatives 2,895 141,215 1,854 145,964 145,964 2,467 111,788 1,881 116,136 116,136Netting adjustments (56,982) (56,982) (41,040) (41,040)
Total derivatives 88,982 75,096Other liabilities – 30 20 50 50 – 32 (2) 30 30Subordinated debentures – 106 – 106 106 – 112 – 112 112
$ 35,752 $ 296,118 $ 2,445 $ 334,315 $ (56,982) $ 277,333 $ 37,494 $ 267,085 $ 2,533 $ 307,112 $ (41,040) $ 266,072
(1) As at July 31, 2015, residential and commercial mortgage-backed securities included in all fair value levels of trading securities were $10,682 million and $295 million (April 30, 2015 – $12,100million and $130 million; October 31, 2014 – $6,564 million and $81 million; July 31, 2014 – $7,455 million and $81 million), respectively, and in all fair value levels of available-for-salesecurities, $7,554 million and $378 million (April 30, 2015 – $7,545 million and $32 million; October 31, 2014 – $6,956 million and $34 million; July 31, 2014 – $6,340 million and $25 million),respectively.
(2) OECD stands for Organisation for Economic Co-operation and Development.(3) CDOs stand for collateralized debt obligations.(4) Excludes $15 million of available-for-sale securities (April 30, 2015 – $15 million; October 31, 2014 – $14 million; July 31, 2014 – $13 million) that are carried at cost.(5) We are permitted an exception, through an accounting policy choice, to measure the fair value of a portfolio of financial instruments on a net open risk position basis when certain criteria are met.
We have elected to use this policy choice to determine fair value of certain portfolios of financial instruments, primarily derivatives, on a net exposure to market or credit risk. The valuationadjustment amounts in this table include those determined on a portfolio basis.
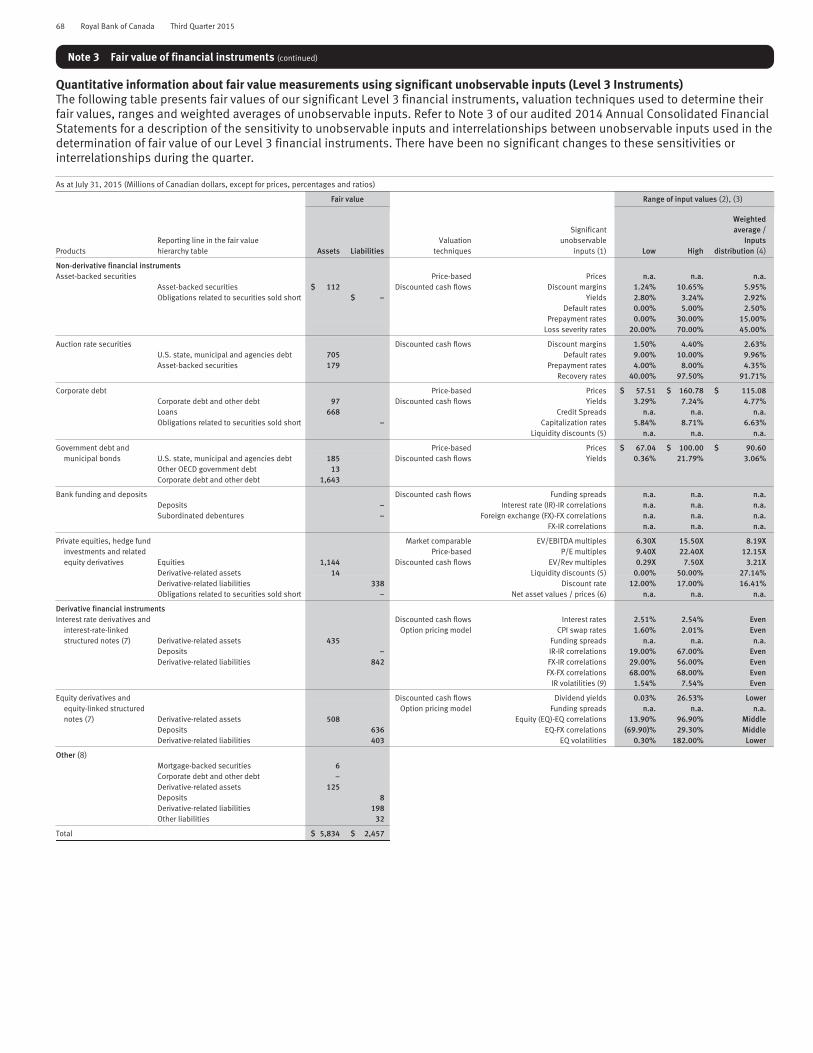
68 Royal Bank of Canada Third Quarter 2015
Note 3 Fair value of financial instruments (continued)
Quantitative information about fair value measurements using significant unobservable inputs (Level 3 Instruments)The following table presents fair values of our significant Level 3 financial instruments, valuation techniques used to determine theirfair values, ranges and weighted averages of unobservable inputs. Refer to Note 3 of our audited 2014 Annual Consolidated FinancialStatements for a description of the sensitivity to unobservable inputs and interrelationships between unobservable inputs used in thedetermination of fair value of our Level 3 financial instruments. There have been no significant changes to these sensitivities orinterrelationships during the quarter.
As at July 31, 2015 (Millions of Canadian dollars, except for prices, percentages and ratios)
Fair value Range of input values (2), (3)
ProductsReporting line in the fair valuehierarchy table Assets Liabilities
Valuationtechniques
Significantunobservable
inputs (1) Low High
Weightedaverage /
Inputsdistribution (4)
Non-derivative financial instrumentsAsset-backed securities Price-based Prices n.a. n.a. n.a.
Asset-backed securities $ 112 Discounted cash flows Discount margins 1.24% 10.65% 5.95%Obligations related to securities sold short $ – Yields 2.80% 3.24% 2.92%
Default rates 0.00% 5.00% 2.50%Prepayment rates 0.00% 30.00% 15.00%
Loss severity rates 20.00% 70.00% 45.00%
Auction rate securities Discounted cash flows Discount margins 1.50% 4.40% 2.63%U.S. state, municipal and agencies debt 705 Default rates 9.00% 10.00% 9.96%Asset-backed securities 179 Prepayment rates 4.00% 8.00% 4.35%
Recovery rates 40.00% 97.50% 91.71%
Corporate debt Price-based Prices $ 57.51 $ 160.78 $ 115.08Corporate debt and other debt 97 Discounted cash flows Yields 3.29% 7.24% 4.77%Loans 668 Credit Spreads n.a. n.a. n.a.Obligations related to securities sold short – Capitalization rates 5.84% 8.71% 6.63%
Liquidity discounts (5) n.a. n.a. n.a.
Government debt and Price-based Prices $ 67.04 $ 100.00 $ 90.60municipal bonds U.S. state, municipal and agencies debt 185 Discounted cash flows Yields 0.36% 21.79% 3.06%
Other OECD government debt 13Corporate debt and other debt 1,643
Bank funding and deposits Discounted cash flows Funding spreads n.a. n.a. n.a.Deposits – Interest rate (IR)-IR correlations n.a. n.a. n.a.Subordinated debentures – Foreign exchange (FX)-FX correlations n.a. n.a. n.a.
FX-IR correlations n.a. n.a. n.a.
Private equities, hedge fund Market comparable EV/EBITDA multiples 6.30X 15.50X 8.19Xinvestments and related Price-based P/E multiples 9.40X 22.40X 12.15Xequity derivatives Equities 1,144 Discounted cash flows EV/Rev multiples 0.29X 7.50X 3.21X
Derivative-related assets 14 Liquidity discounts (5) 0.00% 50.00% 27.14%Derivative-related liabilities 338 Discount rate 12.00% 17.00% 16.41%Obligations related to securities sold short – Net asset values / prices (6) n.a. n.a. n.a.
Derivative financial instrumentsInterest rate derivatives and Discounted cash flows Interest rates 2.51% 2.54% Even
interest-rate-linked Option pricing model CPI swap rates 1.60% 2.01% Evenstructured notes (7) Derivative-related assets 435 Funding spreads n.a. n.a. n.a.
Deposits – IR-IR correlations 19.00% 67.00% EvenDerivative-related liabilities 842 FX-IR correlations 29.00% 56.00% Even
FX-FX correlations 68.00% 68.00% EvenIR volatilities (9) 1.54% 7.54% Even
Equity derivatives and Discounted cash flows Dividend yields 0.03% 26.53% Lowerequity-linked structured Option pricing model Funding spreads n.a. n.a. n.a.notes (7) Derivative-related assets 508 Equity (EQ)-EQ correlations 13.90% 96.90% Middle
Deposits 636 EQ-FX correlations (69.90)% 29.30% MiddleDerivative-related liabilities 403 EQ volatilities 0.30% 182.00% Lower
Other (8)Mortgage-backed securities 6Corporate debt and other debt –Derivative-related assets 125Deposits 8Derivative-related liabilities 198Other liabilities 32
Total $ 5,834 $ 2,457

Royal Bank of Canada Third Quarter 2015 69
As at April 30, 2015 (Millions of Canadian dollars, except for prices, percentages and ratios)
Fair value Range of input values (2), (3)
ProductsReporting line in the fair valuehierarchy table Assets Liabilities
Valuationtechniques
Significantunobservable
inputs (1) Low High
Weightedaverage /
Inputsdistribution (4)
Non-derivative financial instrumentsAsset-backed securities Price-based Prices $ 37.53 $ 37.53 $ 37.53
Asset-backed securities $ 143 Discounted cash flows Discount margins 1.32% 20.67% 11.00%Obligations related to securities sold short $ – Yields 2.84% 2.99% 2.88%
Default rates 0.00% 5.00% 2.50%Prepayment rates 0.00% 30.00% 15.00%
Loss severity rates 20.00% 70.00% 45.00%
Auction rate securities Discounted cash flows Discount margins 1.38% 4.25% 2.37%U.S. state, municipal and agencies debt 639 Default rates 9.00% 10.00% 9.96%Asset-backed securities 147 Prepayment rates 4.00% 8.00% 4.37%
Recovery rates 40.00% 97.50% 91.29%
Corporate debt Price-based Prices $ 57.66 $ 157.79 $ 99.30Corporate debt and other debt 151 Discounted cash flows Yields 5.22% 7.50% 6.23%Loans 617 Credit spreads n.a. n.a. n.a.Obligations related to securities sold short – Capitalization rates 5.72% 9.20% 6.86%
Liquidity discounts (5) n.a. n.a. n.a.
Government debt and Price-based Prices $ 67.15 $ 100.00 $ 82.77municipal bonds U.S. state, municipal and agencies debt 44 Discounted cash flows Yields 0.02% 34.89% 2.68%
Other OECD government debt 12Corporate debt and other debt 1,712
Bank funding and deposits Discounted cash flows Funding spreads n.a. n.a. n.a.Deposits – Interest rate (IR)-IR correlations n.a. n.a. n.a.Subordinated debentures – Foreign exchange (FX)-FX correlations n.a. n.a. n.a.
FX-IR correlations n.a. n.a. n.a.
Private equities, hedge fund Market comparable EV/EBITDA multiples 5.00X 15.50X 8.05Xinvestments and related Price-based P/E multiples 9.40X 22.40X 12.21Xequity derivatives Equities 1,185 Discounted cash flows EV/Rev multiples 0.29X 7.50X 3.07X
Derivative-related assets 52 Liquidity discounts (5) 0.00% 50.00% 27.12%Derivative-related liabilities 500 Discount rate 12.00% 17.00% 16.41%Obligations related to securities sold short – Net asset values / prices (6) n.a. n.a. n.a.
Derivative financial instrumentsInterest rate derivatives and Discounted cash flows Interest rates 2.56% 2.56% Even
interest-rate-linked Option pricing model CPI swap rates 1.40% 2.23% Evenstructured notes (7) Derivative-related assets 468 Funding spreads n.a. n.a. n.a.
Deposits – IR-IR correlations 19.00% 67.00% EvenDerivative-related liabilities 902 FX-IR correlations 29.00% 56.00% Even
FX-FX correlations 68.00% 68.00% EvenIR volatilities (9) 1.19% 7.19% Even
Equity derivatives and Discounted cash flows Dividend yields 0.02% 14.09% Lowerequity-linked structured Option pricing model Funding spreads n.a. n.a. n.a.notes (7) Derivative-related assets 254 Equity (EQ)-EQ correlations (0.70)% 96.60% Middle
Deposits 635 EQ-FX correlations (74.50)% 41.70% MiddleDerivative-related liabilities 305 EQ volatilities 0.30% 169.00% Lower
Other (8)Mortgage-backed securities 9Corporate debt and other debt 37Derivative-related assets 116Deposits 83Derivative-related liabilities 160Other liabilities 42
Total $ 5,586 $ 2,627

70 Royal Bank of Canada Third Quarter 2015
Note 3 Fair value of financial instruments (continued)
As at October 31, 2014 (Millions of Canadian dollars, except for prices, percentages and ratios)
Fair value Range of input values (2), (3)
ProductsReporting line in the fair valuehierarchy table Assets Liabilities
Valuationtechniques
Significantunobservable
inputs (1) Low High
Weightedaverage /
Inputsdistribution (4)
Non-derivative financial instrumentsAsset-backed securities Price-based Prices $ 53.70 $ 90.50 $ 75.92
Asset-backed securities $ 478 Discounted cash flows Discount margins 0.70% 9.48% 5.09%Obligations related to securities sold short $ – Yields 2.84% 5.36% 3.52%
Default rates 1.00% 5.00% 2.00%Prepayment rates 15.00% 30.00% 20.00%
Loss severity rates 30.00% 70.00% 50.00%
Auction rate securities Discounted cash flows Discount margins 1.32% 4.63% 2.26%U.S. state, municipal and agencies debt 979 Default rates 9.00% 10.00% 9.80%Asset-backed securities 166 Prepayment rates 4.00% 8.00% 4.76%
Recovery rates 40.00% 97.50% 93.51%
Corporate debt Price-based Prices $ 2.50 $ 119.52 $ 97.86Corporate debt and other debt 100 Discounted cash flows Yields 2.75% 7.50% 3.84%Loans 461 Credit spreads n.a. n.a. n.a.Obligations related to securities sold short 4 Capitalization rates 6.43% 9.47% 7.95%
Liquidity discounts (5) 10.00% 10.00% 10.00%
Government debt andmunicipal bonds
Price-based Prices $ 67.38 $ 100.00 $ 96.24U.S. state, municipal and agencies debt 416 Discounted cash flows Yields 0.17% 30.15% 3.06%Other OECD government debt 11Corporate debt and other debt 1,616
Bank funding and deposits Discounted cash flows Funding spreads n.a. n.a. n.a.Deposits 70 Interest rate (IR)-IR correlations 19.00% 67.00% EvenSubordinated debentures – Foreign exchange (FX)-FX correlations 68.00% 68.00% Even
FX-IR correlations 29.00% 56.00% Even
Private equities, hedge fundinvestments and relatedequity derivatives
Market comparable EV/EBITDA multiples 4.00X 10.80X 8.73XPrice-based P/E multiples 8.79X 15.70X 11.79X
Equities 1,194 Discounted cash flows EV/Rev multiples 0.45X 7.50X 4.97XDerivative-related assets 11 Liquidity discounts (5) 0.00% 50.00% 26.92%Derivative-related liabilities 434 Discount rate 12.00% 17.00% 14.78%Obligations related to securities sold short – Net asset values / prices (6) n.a. n.a. n.a.
Derivative financial instrumentsInterest rate derivatives and
interest-rate-linkedstructured notes (7)
Discounted cash flows Interest rates 2.96% 2.98% EvenOption pricing model CPI swap rates 1.73% 2.30% Even
Derivative-related assets 348 Funding spreads n.a. n.a. n.a.Deposits – IR-IR correlations 19.00% 67.00% EvenDerivative-related liabilities 732 FX-IR correlations 29.00% 56.00% Even
FX-FX correlations 68.00% 68.00% EvenIR volatilities 26.28% 28.80% Even
Equity derivatives andequity-linked structurednotes (7)
Discounted cash flows Dividend yields 0.04% 18.11% LowerOption pricing model Funding spreads n.a. n.a. n.a.
Derivative-related assets 442 Equity (EQ)-EQ correlations 0.50% 97.20% MiddleDeposits 497 EQ-FX correlations (72.80)% 53.20% MiddleDerivative-related liabilities 529 EQ volatilities 1.00% 172.00% Lower
Other (8)Mortgage-backed securities 4Corporate debt and other debt 6Derivative-related assets 100Deposits –Derivative-related liabilities 159Other liabilities 20
Total $ 6,332 $ 2,445
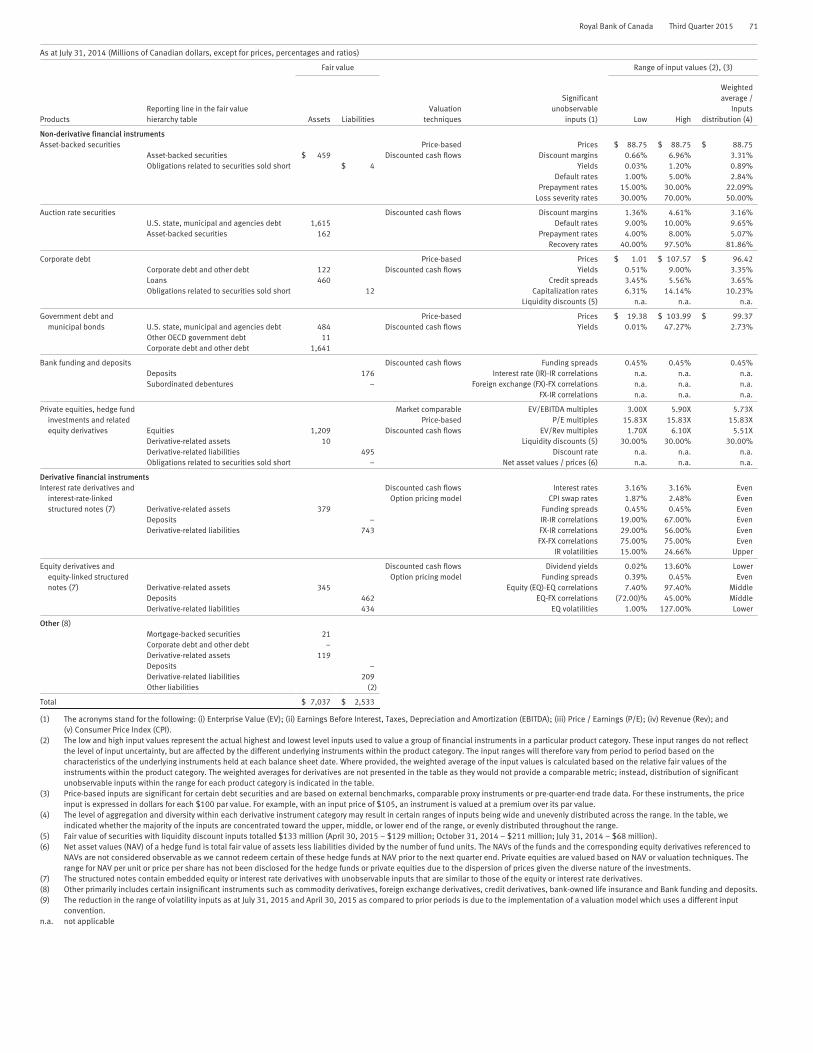
Royal Bank of Canada Third Quarter 2015 71
As at July 31, 2014 (Millions of Canadian dollars, except for prices, percentages and ratios)
Fair value Range of input values (2), (3)
ProductsReporting line in the fair valuehierarchy table Assets Liabilities
Valuationtechniques
Significantunobservable
inputs (1) Low High
Weightedaverage /
Inputsdistribution (4)
Non-derivative financial instrumentsAsset-backed securities Price-based Prices $ 88.75 $ 88.75 $ 88.75
Asset-backed securities $ 459 Discounted cash flows Discount margins 0.66% 6.96% 3.31%Obligations related to securities sold short $ 4 Yields 0.03% 1.20% 0.89%
Default rates 1.00% 5.00% 2.84%Prepayment rates 15.00% 30.00% 22.09%
Loss severity rates 30.00% 70.00% 50.00%
Auction rate securities Discounted cash flows Discount margins 1.36% 4.61% 3.16%U.S. state, municipal and agencies debt 1,615 Default rates 9.00% 10.00% 9.65%Asset-backed securities 162 Prepayment rates 4.00% 8.00% 5.07%
Recovery rates 40.00% 97.50% 81.86%
Corporate debt Price-based Prices $ 1.01 $ 107.57 $ 96.42Corporate debt and other debt 122 Discounted cash flows Yields 0.51% 9.00% 3.35%Loans 460 Credit spreads 3.45% 5.56% 3.65%Obligations related to securities sold short 12 Capitalization rates 6.31% 14.14% 10.23%
Liquidity discounts (5) n.a. n.a. n.a.
Government debt andmunicipal bonds
Price-based Prices $ 19.38 $ 103.99 $ 99.37U.S. state, municipal and agencies debt 484 Discounted cash flows Yields 0.01% 47.27% 2.73%Other OECD government debt 11Corporate debt and other debt 1,641
Bank funding and deposits Discounted cash flows Funding spreads 0.45% 0.45% 0.45%Deposits 176 Interest rate (IR)-IR correlations n.a. n.a. n.a.Subordinated debentures – Foreign exchange (FX)-FX correlations n.a. n.a. n.a.
FX-IR correlations n.a. n.a. n.a.
Private equities, hedge fundinvestments and relatedequity derivatives
Market comparable EV/EBITDA multiples 3.00X 5.90X 5.73XPrice-based P/E multiples 15.83X 15.83X 15.83X
Equities 1,209 Discounted cash flows EV/Rev multiples 1.70X 6.10X 5.51XDerivative-related assets 10 Liquidity discounts (5) 30.00% 30.00% 30.00%Derivative-related liabilities 495 Discount rate n.a. n.a. n.a.Obligations related to securities sold short – Net asset values / prices (6) n.a. n.a. n.a.
Derivative financial instrumentsInterest rate derivatives and
interest-rate-linkedstructured notes (7)
Discounted cash flows Interest rates 3.16% 3.16% EvenOption pricing model CPI swap rates 1.87% 2.48% Even
Derivative-related assets 379 Funding spreads 0.45% 0.45% EvenDeposits – IR-IR correlations 19.00% 67.00% EvenDerivative-related liabilities 743 FX-IR correlations 29.00% 56.00% Even
FX-FX correlations 75.00% 75.00% EvenIR volatilities 15.00% 24.66% Upper
Equity derivatives andequity-linked structurednotes (7)
Discounted cash flows Dividend yields 0.02% 13.60% LowerOption pricing model Funding spreads 0.39% 0.45% Even
Derivative-related assets 345 Equity (EQ)-EQ correlations 7.40% 97.40% MiddleDeposits 462 EQ-FX correlations (72.00)% 45.00% MiddleDerivative-related liabilities 434 EQ volatilities 1.00% 127.00% Lower
Other (8)Mortgage-backed securities 21Corporate debt and other debt –Derivative-related assets 119Deposits –Derivative-related liabilities 209Other liabilities (2)
Total $ 7,037 $ 2,533
(1) The acronyms stand for the following: (i) Enterprise Value (EV); (ii) Earnings Before Interest, Taxes, Depreciation and Amortization (EBITDA); (iii) Price / Earnings (P/E); (iv) Revenue (Rev); and(v) Consumer Price Index (CPI).
(2) The low and high input values represent the actual highest and lowest level inputs used to value a group of financial instruments in a particular product category. These input ranges do not reflectthe level of input uncertainty, but are affected by the different underlying instruments within the product category. The input ranges will therefore vary from period to period based on thecharacteristics of the underlying instruments held at each balance sheet date. Where provided, the weighted average of the input values is calculated based on the relative fair values of theinstruments within the product category. The weighted averages for derivatives are not presented in the table as they would not provide a comparable metric; instead, distribution of significantunobservable inputs within the range for each product category is indicated in the table.
(3) Price-based inputs are significant for certain debt securities and are based on external benchmarks, comparable proxy instruments or pre-quarter-end trade data. For these instruments, the priceinput is expressed in dollars for each $100 par value. For example, with an input price of $105, an instrument is valued at a premium over its par value.
(4) The level of aggregation and diversity within each derivative instrument category may result in certain ranges of inputs being wide and unevenly distributed across the range. In the table, weindicated whether the majority of the inputs are concentrated toward the upper, middle, or lower end of the range, or evenly distributed throughout the range.
(5) Fair value of securities with liquidity discount inputs totalled $133 million (April 30, 2015 – $129 million; October 31, 2014 – $211 million; July 31, 2014 – $68 million).(6) Net asset values (NAV) of a hedge fund is total fair value of assets less liabilities divided by the number of fund units. The NAVs of the funds and the corresponding equity derivatives referenced to
NAVs are not considered observable as we cannot redeem certain of these hedge funds at NAV prior to the next quarter end. Private equities are valued based on NAV or valuation techniques. Therange for NAV per unit or price per share has not been disclosed for the hedge funds or private equities due to the dispersion of prices given the diverse nature of the investments.
(7) The structured notes contain embedded equity or interest rate derivatives with unobservable inputs that are similar to those of the equity or interest rate derivatives.(8) Other primarily includes certain insignificant instruments such as commodity derivatives, foreign exchange derivatives, credit derivatives, bank-owned life insurance and Bank funding and deposits.(9) The reduction in the range of volatility inputs as at July 31, 2015 and April 30, 2015 as compared to prior periods is due to the implementation of a valuation model which uses a different input
convention.n.a. not applicable

72 Royal Bank of Canada Third Quarter 2015
Note 3 Fair value of financial instruments (continued)
Changes in fair value measurement for instruments measured on a recurring basis and categorized in Level 3The following tables present the changes in fair value measurements on a recurring basis for instruments included in Level 3 of thefair value hierarchy.
For the three months ended July 31, 2015
(Millions of Canadian dollars)
Fair valueMay 1,
2015
Totalrealized/
unrealizedgains
(losses)included in
earnings
Totalunrealized
gains (losses)included in
othercomprehensive
income (1)
Purchasesof assets/issuances
of liabilities
Sales ofassets/
settlementsof liabilities
and other (2)
Transfersinto
Level 3
Transfersout of
Level 3
Fair valueJuly 31,
2015
Changes inunrealized gains(losses) included
in earnings forassets and
liabilities for theperiod endedJuly 31, 2015for positions
still held
AssetsSecurities
TradingU.S. state, municipal and agencies
debt $ 1 $ – $ – $ 13 $ (2) $ – $ – $ 12 $ –Other OECD government debt – – – – – – – – –Mortgage-backed securities 9 (2) 1 – (2) – – 6 –Asset-backed securities
CDOs 54 – (4) 50 (32) – (4) 64 –Non-CDO securities 41 (2) 3 29 (43) 7 (6) 29 (2)
Corporate debt and other debt 166 – 5 21 (59) – (68) 65 –Equities 175 (16) 13 – (24) 1 (19) 130 (16)
446 (20) 18 113 (162) 8 (97) 306 (18)
Available-for-saleU.S. state, municipal and agencies
debt 682 – 44 136 16 – – 878 n.a.Other OECD government debt 12 – – 2 (1) – – 13 n.a.Asset-backed securities
CDOs 30 – 2 – – – (32) – n.a.Non-CDO securities 165 – 26 – 7 – – 198 n.a.
Corporate debt and other debt 1,734 – 148 555 (762) – – 1,675 n.a.Equities 1,010 36 48 11 (60) 17 (48) 1,014 n.a.
3,633 36 268 704 (800) 17 (80) 3,778 n.a.
Loans – Wholesale 617 24 16 78 (68) 1 – 668 –Other
Net derivative balances (3)
Interest rate contracts (458) (20) (4) 21 4 4 (4) (457) (21)Foreign exchange contracts 24 25 3 5 – (1) (4) 52 26Credit derivatives (1) (1) – – 1 – – (1) (1)Other contracts (491) 31 (40) 88 27 57 89 (239) 30Valuation adjustments (51) (3) (1) 1 – – – (54) (3)
Other assets – – – – – – – – –
$ 3,719 $ 72 $ 260 $ 1,010 $ (998) $ 86 $ (96) $ 4,053 $ 13
LiabilitiesDeposits
Personal $ (635) $ 32 $ (27) $ (125) $ 35 $ (106) $ 190 $ (636) $ 32Business and government (83) (1) – – 1 – 75 (8) (1)
OtherObligations related to securities sold
short – – – – – (1) 1 – –Other liabilities (42) 13 (4) – 1 – – (32) 13Subordinated debentures – – – – – – – – –
$ (760) $ 44 $ (31) $ (125) $ 37 $ (107) $ 266 $ (676) $ 44
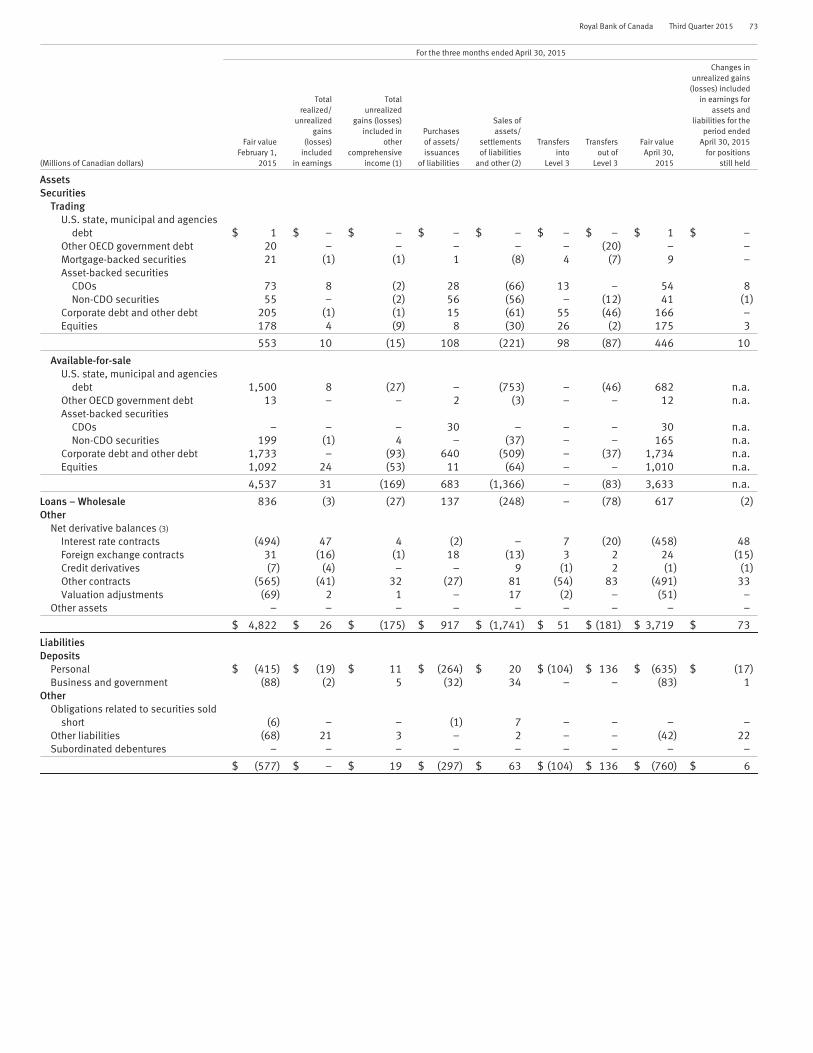
Royal Bank of Canada Third Quarter 2015 73
For the three months ended April 30, 2015
(Millions of Canadian dollars)
Fair valueFebruary 1,
2015
Totalrealized/
unrealizedgains
(losses)included
in earnings
Totalunrealized
gains (losses)included in
othercomprehensive
income (1)
Purchasesof assets/issuances
of liabilities
Sales ofassets/
settlementsof liabilities
and other (2)
Transfersinto
Level 3
Transfersout of
Level 3
Fair valueApril 30,
2015
Changes inunrealized gains
(losses) includedin earnings for
assets andliabilities for the
period endedApril 30, 2015
for positionsstill held
AssetsSecurities
TradingU.S. state, municipal and agencies
debt $ 1 $ – $ – $ – $ – $ – $ – $ 1 $ –Other OECD government debt 20 – – – – – (20) – –Mortgage-backed securities 21 (1) (1) 1 (8) 4 (7) 9 –Asset-backed securities
CDOs 73 8 (2) 28 (66) 13 – 54 8Non-CDO securities 55 – (2) 56 (56) – (12) 41 (1)
Corporate debt and other debt 205 (1) (1) 15 (61) 55 (46) 166 –Equities 178 4 (9) 8 (30) 26 (2) 175 3
553 10 (15) 108 (221) 98 (87) 446 10
Available-for-saleU.S. state, municipal and agencies
debt 1,500 8 (27) – (753) – (46) 682 n.a.Other OECD government debt 13 – – 2 (3) – – 12 n.a.Asset-backed securities
CDOs – – – 30 – – – 30 n.a.Non-CDO securities 199 (1) 4 – (37) – – 165 n.a.
Corporate debt and other debt 1,733 – (93) 640 (509) – (37) 1,734 n.a.Equities 1,092 24 (53) 11 (64) – – 1,010 n.a.
4,537 31 (169) 683 (1,366) – (83) 3,633 n.a.
Loans – Wholesale 836 (3) (27) 137 (248) – (78) 617 (2)Other
Net derivative balances (3)
Interest rate contracts (494) 47 4 (2) – 7 (20) (458) 48Foreign exchange contracts 31 (16) (1) 18 (13) 3 2 24 (15)Credit derivatives (7) (4) – – 9 (1) 2 (1) (1)Other contracts (565) (41) 32 (27) 81 (54) 83 (491) 33Valuation adjustments (69) 2 1 – 17 (2) – (51) –
Other assets – – – – – – – – –
$ 4,822 $ 26 $ (175) $ 917 $ (1,741) $ 51 $ (181) $ 3,719 $ 73
LiabilitiesDeposits
Personal $ (415) $ (19) $ 11 $ (264) $ 20 $ (104) $ 136 $ (635) $ (17)Business and government (88) (2) 5 (32) 34 – – (83) 1
OtherObligations related to securities sold
short (6) – – (1) 7 – – – –Other liabilities (68) 21 3 – 2 – – (42) 22Subordinated debentures – – – – – – – – –
$ (577) $ – $ 19 $ (297) $ 63 $ (104) $ 136 $ (760) $ 6

74 Royal Bank of Canada Third Quarter 2015
Note 3 Fair value of financial instruments (continued)
For the three months ended July 31, 2014
(Millions of Canadian dollars)
Fair valueMay 1,
2014
Totalrealized/
unrealizedgains
(losses)included
in earnings
Totalunrealized
gains (losses)included in
othercomprehensive
income (1)
Purchasesof assets/issuances
of liabilities
Sales ofassets/
settlementsof liabilities
and other (2)
Transfersinto
Level 3
Transfersout of
Level 3
Fair valueJuly 31,
2014
Changes inunrealized gains
(losses) includedin earnings for
assets andliabilities for the
period endedJuly 31, 2014for positions
still held
AssetsSecurities
TradingU.S. state, municipal and agencies
debt $ 21 $ – $ – $ 3 $ (16) $ – $ (1) $ 7 $ –Other OECD government debt – – – – – – – – –Mortgage-backed securities 36 (1) – 16 (24) – (6) 21 –Asset-backed securities
CDOs 18 6 (4) 58 (7) – – 71 4Non-CDO securities 433 – (3) 342 (467) – (3) 302 –
Corporate debt and other debt 455 (1) (3) 53 (299) – (8) 197 –Equities 218 1 (1) 16 (10) 1 (61) 164 (1)
1,181 5 (11) 488 (823) 1 (79) 762 3
Available-for-saleU.S. state, municipal and agencies
debt 2,119 – 28 – (55) – – 2,092 n.a.Other OECD government debt – – – – 11 – – 11 n.a.Asset-backed securities
CDOs 81 – – – (8) – (2) 71 n.a.Non-CDO securities 169 – 8 – – – – 177 n.a.
Corporate debt and other debt 1,577 – 5 698 (714) – – 1,566 n.a.Equities 1,103 27 (16) 11 (80) – – 1,045 n.a.
5,049 27 25 709 (846) – (2) 4,962 n.a.
Loans – Wholesale 464 (1) (2) – (1) – – 460 –Other
Net derivative balances (3)
Interest rate contracts (548) (21) 3 14 (1) 82 112 (359) (40)Foreign exchange contracts 24 (7) – – (1) – (1) 15 (7)Credit derivatives (5) (8) – – 8 – – (5) (1)Other contracts (636) (54) 4 (17) 29 (36) 118 (592) (59)Valuation adjustments (124) (4) 1 – 41 – (1) (87) (6)
Other assets – – – – – – – – –
$ 5,405 $ (63) $ 20 $ 1,194 $ (1,594) $ 47 $ 147 $ 5,156 $ (110)
LiabilitiesDeposits
Personal $ (531) $ (13) $ 4 $ (136) $ 46 $ (44) $ 212 $ (462) $ 1Business and government (5,072) (24) 10 (169) 159 – 4,920 (176) (3)
OtherObligations related to securities sold
short (25) – – (45) 54 – – (16) –Other liabilities (1) (2) – – 5 – – 2 2Subordinated debentures (112) 1 (1) – – – 112 – 1
$ (5,741) $ (38) $ 13 $ (350) $ 264 $ (44) $ 5,244 $ (652) $ 1

Royal Bank of Canada Third Quarter 2015 75
For the nine months ended July 31, 2015
(Millions of Canadian dollars)
Fair valueNovember 1,
2014
Totalrealized/
unrealizedgains
(losses)included
in earnings
Totalunrealized
gains (losses)included in
othercomprehensive
income (1)
Purchasesof assets/issuances
of liabilities
Sales ofassets/
settlementsof liabilities
and other (2)
Transfersinto
Level 3
Transfersout of
Level 3
Fair valueJuly 31,
2015
Changes inunrealized gains(losses) included
in earnings forassets and
liabilities for theperiod endedJuly 31, 2015for positions
still held
AssetsSecurities
TradingU.S. state, municipal and agencies
debt $ 6 $ – $ 1 $ 13 $ (8) $ – $ – $ 12 $ –Other OECD government debt – – – – – 20 (20) – –Mortgage-backed securities 4 (4) – 23 (26) 16 (7) 6 –Asset-backed securities
CDOs 74 24 (18) 102 (113) 13 (18) 64 6Non-CDO securities 364 (4) 47 129 (322) 12 (197) 29 (3)
Corporate debt and other debt 149 – 5 39 (128) 119 (119) 65 –Equities 166 (22) 24 13 (72) 45 (24) 130 (21)
763 (6) 59 319 (669) 225 (385) 306 (18)
Available-for-saleU.S. state, municipal and agencies
debt 1,389 8 161 136 (770) – (46) 878 n.a.Other OECD government debt 11 – – 4 (2) – – 13 n.a.Asset-backed securities
CDOs 24 – 3 30 – – (57) – n.a.Non-CDO securities 182 (1) 36 – (19) – – 198 n.a.
Corporate debt and other debt 1,573 – 256 1,717 (1,871) 37 (37) 1,675 n.a.Equities 1,028 78 74 38 (166) 17 (55) 1,014 n.a.
4,207 85 530 1,925 (2,828) 54 (195) 3,778 n.a.
Loans – Wholesale 461 21 47 537 (321) 1 (78) 668 –Other
Net derivative balances (3)
Interest rate contracts (370) (71) (2) 30 (5) (11) (28) (457) (46)Foreign exchange contracts 9 47 6 32 (7) 2 (37) 52 35Credit derivatives (5) (15) (1) – 19 (1) 2 (1) (3)Other contracts (502) (96) (77) 54 181 (83) 284 (239) 80Valuation adjustments (85) (4) (2) 1 39 (3) – (54) (3)
Other assets – – – – – – – – –
$ 4,478 $ (39) $ 560 $ 2,898 $ (3,591) $ 184 $ (437) $ 4,053 $ 45
LiabilitiesDeposits
Personal $ (497) $ 43 $ (41) $ (500) $ 68 $ (272) $ 563 $ (636) $ 31Business and government (70) (5) 1 (78) 51 – 93 (8) (1)
OtherObligations related to securities sold
short (4) – – (11) 15 (1) 1 – –Other liabilities (20) (9) (6) – 3 – – (32) (7)Subordinated debentures – – – – – – – – –
$ (591) $ 29 $ (46) $ (589) $ 137 $ (273) $ 657 $ (676) $ 23

76 Royal Bank of Canada Third Quarter 2015
Note 3 Fair value of financial instruments (continued)
For the nine months ended July 31, 2014
(Millions of Canadian dollars)
Fair valueNovember 1,
2013
Totalrealized/
unrealizedgains
(losses)included
in earnings
Totalunrealized
gains (losses)included in
othercomprehensive
income (1)
Purchasesof assets/issuances
of liabilities
Sales ofassets/
settlementsof liabilities
and other (2)
Transfersinto
Level 3
Transfersout of
Level 3
Fair valueJuly 31,
2014
Changes inunrealized gains
(losses) includedin earnings for
assets andliabilities for the
period endedJuly 31, 2014for positions
still held
AssetsSecurities
TradingU.S. state, municipal and agencies
debt $ 22 $ – $ 1 $ 34 $ (51) $ 5 $ (4) $ 7 $ –Other OECD government debt 370 – (4) – – – (366) – –Mortgage-backed securities 28 (1) 1 82 (62) 1 (28) 21 –Asset-backed securities
CDOs 31 14 (4) 74 (36) 7 (15) 71 4Non-CDO securities 260 2 9 1,651 (1,624) 16 (12) 302 –
Corporate debt and other debt 415 (3) 30 285 (480) – (50) 197 (2)Equities 183 6 9 79 (61) 9 (61) 164 (11)
1,309 18 42 2,205 (2,314) 38 (536) 762 (9)
Available-for-saleU.S. state, municipal and agencies
debt 2,014 – 159 – (72) – (9) 2,092 n.a.Other OECD government debt – – – – 11 – – 11 n.a.Asset-backed securities
CDOs 103 – 11 – (33) – (10) 71 n.a.Non-CDO securities 180 (4) 20 – (19) – – 177 n.a.
Corporate debt and other debt 1,673 – 75 1,221 (1,334) – (69) 1,566 n.a.Equities 969 74 105 33 (136) – – 1,045 n.a.
4,939 70 370 1,254 (1,583) – (88) 4,962 n.a.
Loans – Wholesale 414 2 18 27 (1) – – 460 (29)Other
Net derivative balances (3)
Interest rate contracts (458) (74) (2) 29 (13) 82 77 (359) (111)Foreign exchange contracts (117) (15) – – 1 (2) 148 15 (11)Credit derivatives (5) (23) (2) – 25 – – (5) (4)Other contracts (869) 5 (36) (50) 90 (129) 397 (592) (52)Valuation adjustments (105) 5 (1) – (65) – 79 (87) (7)
Other assets 11 – – – – – (11) – –
$ 5,119 $ (12) $ 389 $ 3,465 $ (3,860) $ (11) $ 66 $ 5,156 $ (223)
LiabilitiesDeposits
Personal $ (1,043) $ (14) $ (52) $ (443) $ 171 $ (160) $ 1,079 $ (462) $ (2)Business and government (3,933) (177) (186) (1,551) 261 – 5,410 (176) (20)
OtherObligations related to securities sold
short (16) 1 (1) (147) 147 – – (16) –Other liabilities (3) 51 – – (50) – 4 2 –Subordinated debentures (109) – (3) – – – 112 – –
$ (5,104) $ (139) $ (242) $ (2,141) $ 529 $ (160) $ 6,605 $ (652) $ (22)
(1) These amounts include the foreign currency translation gains or losses arising on consolidation of foreign subsidiaries relating to the Level 3 instruments, where applicable. The unrealized gains onavailable-for-sale securities recognized in other comprehensive income were $1 million for the three months ended July 31, 2015 (April 30, 2015 – $38 million; July 31, 2014 – $38 million) andgains of $9 million for the nine months ended July 31, 2015 (July 31, 2014 – $142 million), excluding the translation gains or losses arising on consolidation.
(2) Other includes amortization of premiums or discounts recognized in net income.(3) Net derivatives as at July 31, 2015 included derivative assets of $1,082 million (April 30, 2015 – $890 million; October 31, 2014 – $901 million; July 31, 2014 – $853 million) and derivative
liabilities of $1,781 million (April 30, 2015 – $1,867 million; October 31, 2014 – $1,854 million; July 31, 2014 – $1,881 million)).n.a. not applicable
Transfers between fair value hierarchy levels for instruments carried at fair value on a recurring basisTransfers between Level 1 and Level 2, and transfers into and out of Level 3 are assumed to occur at the end of the period. For anasset or a liability that transfers into Level 3 during the period, the entire change in fair value for the period is excluded from the Totalrealized/unrealized gains (losses) included in earnings column of the above reconciliation, whereas for transfers out of Level 3 duringthe period, the entire change in fair value for the period is included in the same column of the above reconciliation.
Transfers between Level 1 and Level 2 are dependent on whether fair value is obtained on the basis of quoted market prices inactive markets (Level 1) as opposed to fair value estimated using observable inputs in a discounted cash flow method (Level 2).During the three months ended July 31, 2015, $457 million of U.S. state, municipal and agencies debt reported in Trading weretransferred from Level 1 to Level 2. During the three months ended July 31, 2015, significant transfers from Level 2 to thecorresponding Level 1 balances included $128 million of Canadian government debt reported in Trading and $584 million of Equitiesreported in Trading and Available-for-sale.

Royal Bank of Canada Third Quarter 2015 77
During the three months ended April 30, 2015, $421 million of U.S. state, municipal and agencies debt reported in Trading andAvailable-for-sale were transferred from Level 1 to the corresponding Level 2 balances. In addition, for the three months endedJanuary 31, 2015, $284 million of Canadian government debt reported in Trading and $337 million of Obligations related to securitiessold short were transferred from Level 1 to the corresponding Level 2 balances.
During the three months ended July 31, 2015, significant transfers out of Level 3 to Level 2 included: (i) $89 million (net) primarilyrelating to over-the-counter equity options in Other contracts as certain unobservable inputs did not significantly affect their valuesand due to increased observability of pricing in the underlying investments ($275 million of derivative-related assets and $364million derivative-related liabilities) and (ii) $190 million of equity-linked structured notes in Personal Deposits as the unobservableinputs did not significantly affect their values. During the three months ended July 31, 2015, significant transfers out of Level 2 toLevel 3 included: (i) $57 million (net) primarily relating to over-the-counter equity options in Other contracts due to decreasedobservability of the volatility input ($261 million of derivative-related assets and $204 million derivative-related liabilities) and (ii)$106 million equity-linked structured notes in Personal Deposits as the unobservable inputs significantly affected their values.
During the three months ended April 30, 2015, significant transfers out of Level 3 to Level 2 included: (i) $136 million of equity-linked structured notes in Personal Deposits as the unobservable inputs did not significantly affect their values and (ii) $83 million(net) of over-the-counter equity options in Other contracts due to increased observability of the volatility input ($311 million ofderivative-related assets and $394 million of derivative-related liabilities). During the three months ended April 30, 2015, significanttransfers into Level 3 included $104 million of equity-linked structured notes in Personal Deposits as the unobservable inputssignificantly affected their values.
During the three months ended January 31, 2015, significant transfers out of Level 3 to Level 2 included: $179 million ofcollateralized loan obligations in Non-CDO securities due to improved price transparency, $87 million (net) of over-the-counter equityoptions in Other contracts due to increased observability of the volatility input ($97 million of derivative-related assets and$184 million derivative-related liabilities), and $237 million of equity-linked structured notes in Personal deposits where theunobservable inputs did not significantly affect their fair values.
Total realized/unrealized gains (losses) of Level 3 instruments recognized in earningsFor the three months ended
July 31, 2015 April 30, 2015 July 31, 2014
(Millions of Canadian dollars) Assets Liabilities Total Assets Liabilities Total Assets Liabilities Total
Non-interest incomeInsurance premiums, investment and fee income $ (1) $ – $ (1) $ (1) $ – $ (1) $ – $ – $ –Trading revenue 174 (92) 82 51 (47) 4 165 (282) (117)Net gain on available-for-sale securities 36 – 36 32 – 32 26 – 26Credit fees and Other (1) – (1) (1) (8) (9) (1) (9) (10)
$ 208 $ (92) $116 $ 81 $ (55) $ 26 $ 190 $ (291) $(101)
For the nine months ended
July 31, 2015 July 31, 2014
(Millions of Canadian dollars) Assets Liabilities Total Assets Liabilities Total
Non-interest incomeInsurance premiums, investment and fee income $ (1) $ – $ (1) $ 1 $ – $ 1Trading revenue 530 (609) (79) 642 (835) (193)Net gain on available-for-sale securities 85 – 85 69 – 69Credit fees and Other (3) (12) (15) (3) (25) (28)
$ 611 $ (621) $ (10) $ 709 $ (860) $(151)
Changes in unrealized gains (losses) recognized in earnings for assets and liabilities still held at period endsFor the three months ended
July 31, 2015 April 30, 2015 July 31, 2014
(Millions of Canadian dollars) Assets Liabilities Total Assets Liabilities Total Assets Liabilities Total
Non-interest incomeTrading revenue $ 150 $ (92) $ 58 $ (55) $ 135 $ 80 $ 60 $ (168) $ (108)Credit fees and Other (1) – (1) (1) – (1) (1) – (1)
$ 149 $ (92) $ 57 $ (56) $ 135 $ 79 $ 59 $ (168) $ (109)
For the nine months ended
July 31, 2015 July 31, 2014
(Millions of Canadian dollars) Assets Liabilities Total Assets Liabilities Total
Non-interest incomeTrading revenue $ 349 $ (279) $ 70 $ 105 $ (347) $ (242)Credit fees and Other (3) 1 (2) (2) (1) (3)
$ 346 $ (278) $ 68 $ 103 $ (348) $ (245)
Positive and negative fair value movement of Level 3 financial instruments from using reasonably possible alternative assumptionsA financial instrument is classified as Level 3 in the fair value hierarchy if one or more of its unobservable inputs may significantlyaffect the measurement of its fair value. In preparing the financial statements, appropriate levels for these unobservable inputparameters are chosen so that they are consistent with prevailing market evidence or management judgment. Due to theunobservable nature of the prices or rates, there may be uncertainty about valuation of these Level 3 financial instruments.

78 Royal Bank of Canada Third Quarter 2015
Note 3 Fair value of financial instruments (continued)
The following table summarizes the impact to fair values of Level 3 financial instruments using reasonably possible alternativeassumptions. This sensitivity disclosure is intended to illustrate the potential impact of the relative uncertainty in the fair value ofLevel 3 financial instruments. In reporting the sensitivities below, we offset balances in instances where: (i) the move in valuationfactor caused an offsetting positive and negative fair value movement, (ii) both offsetting instruments are in Level 3, and (iii) whenexposures are managed and reported on a net basis. With respect to overall sensitivity, it is unlikely in practice that all reasonablypossible alternative assumptions would be simultaneously realized.
As at
July 31, 2015 April 30, 2015
(Millions of Canadian dollars) Level 3 fair value
Positive fair valuemovement from
using reasonablypossible
alternatives
Negative fair valuemovement from
using reasonablypossible
alternatives Level 3 fair value
Positive fair valuemovement from
using reasonablypossible
alternatives
Negative fair valuemovement from
using reasonablypossible
alternatives
SecuritiesTrading
U.S. state, municipal and agencies debt $ 12 $ 1 $ (1) $ 1 $ – $ –Mortgage-backed securities 6 1 (1) 9 1 (1)Asset-backed securities 93 7 (7) 95 2 (3)Corporate debt and other debt 65 2 (2) 166 6 (6)Equities 130 – – 175 – –
Available-for-saleU.S. state, municipal and agencies debt 878 18 (35) 682 12 (30)Other OECD government debt 13 – – 12 – –Asset-backed securities 198 11 (16) 195 11 (16)Corporate debt and other debt 1,675 11 (11) 1,734 9 (8)Equities 1,014 75 (31) 1,010 77 (24)
Loans 668 21 (44) 617 24 (34)Derivatives 1,082 24 (9) 890 20 (18)
$ 5,834 $ 171 $ (157) $ 5,586 $ 162 $ (140)
Deposits (644) 18 (18) (718) 17 (17)Derivatives (1,781) 30 (43) (1,867) 27 (43)Other, securities sold short, other liabilities and
subordinated debentures (32) – – (42) – –
$ (2,457) $ 48 $ (61) $ (2,627) $ 44 $ (60)
As at
October 31, 2014 July 31, 2014
(Millions of Canadian dollars) Level 3 fair value
Positive fair valuemovement from
using reasonablypossible
alternatives
Negative fair valuemovement from
using reasonablypossible
alternatives Level 3 fair value
Positive fair valuemovement from
using reasonablypossible
alternatives
Negative fair valuemovement from
using reasonablypossible
alternatives
SecuritiesTrading
U.S. state, municipal and agencies debt $ 6 $ – $ – $ 7 $ – $ –Mortgage-backed securities 4 1 (1) 21 2 (2)Asset-backed securities 438 10 (14) 373 11 (12)Corporate debt and other debt 149 2 (2) 197 4 (4)Equities 166 – – 164 – –
Available-for-saleU.S. state, municipal and agencies debt 1,389 23 (57) 2,092 42 (74)Other OECD government debt 11 – – 11 – –Asset-backed securities 206 12 (18) 248 12 (17)Corporate debt and other debt 1,573 12 (10) 1,566 10 (10)Equities 1,028 92 (23) 1,045 21 (20)
Loans 461 12 (11) 460 9 (9)Derivatives 901 23 (21) 853 29 (22)
$ 6,332 $ 187 $ (157) $ 7,037 $ 140 $ (170)
Deposits (567) 14 (14) (638) 11 (11)Derivatives (1,854) 38 (59) (1,881) 38 (57)Other, securities sold short, other liabilities and
subordinated debentures (24) – – (14) – –
$ (2,445) $ 52 $ (73) $ (2,533) $ 49 $ (68)
Sensitivity resultsAs at July 31, 2015, the effects of applying other reasonably possible alternative assumptions to the Level 3 asset positions would bean increase of $171 million and a reduction of $157 million in fair value, of which $115 million and $86 million would be recorded inOther components of equity, respectively. The effects of applying these assumptions to the Level 3 liability positions would result in adecrease of $48 million and an increase of $61 million in fair value.

Royal Bank of Canada Third Quarter 2015 79
Level 3 valuation inputs and approaches to developing reasonably possible alternative assumptionsThe following is a summary of the unobservable inputs used in the valuation of the Level 3 instruments and our approaches todeveloping reasonably possible alternative assumptions used to determine sensitivity.
Financial assets or liabilities Sensitivity methodologyAsset-backed securities, corporate debt,
government debt and municipal bondsSensitivities are determined based on adjusting, plus or minus one standard deviation, the bid-offer spreads or input prices if a sufficient number of prices is received, or using high and lowvendor prices as reasonably possible alternative assumptions.
Auction rate securities Sensitivity of auction rate securities is determined by decreasing the discount margin between11% and 15% and increasing the discount margin between 19% and 37%, depending on thespecific reasonable range of fair value uncertainty for each particular financial instrument’smarket. Changes to the discount margin reflect historic monthly movements in the student loanasset-backed securities market.
Private equities, hedge fund investments andrelated equity derivatives
Sensitivity of direct private equity investments is determined by (i) adjusting the discount rateby 2% when discounted cash flow method is used to determine fair value, (ii) adjusting theprice multiples based on the range of multiples of comparable companies when price-basedmodels are used, or (iii) using an alternative valuation approach. Net asset values of the privateequity funds, hedge funds and related equity derivatives are provided by the fund managers,and as a result, there are no other reasonably possible alternative assumptions for theseinvestments.
Interest rate derivatives Sensitivities of interest rate and cross currency swaps are derived using plus or minus onestandard deviation of these inputs, and an amount based on model and parameter uncertainty,where applicable.
Equity derivatives Sensitivity of the Level 3 position will be determined by shifting the unobservable model inputsby plus or minus one standard deviation of the pricing service market data including volatility,dividends or correlations, as applicable.
Bank funding and deposits Sensitivities of deposits are calculated by shifting the funding curve by plus or minus certainbasis points.
Structured notes Sensitivities for interest-rate-linked and equity-linked structured notes are derived by adjustinginputs by plus or minus one standard deviation, and for other deposits, by estimating areasonable move in the funding curve by plus or minus certain basis points.
Note 4 Securities
Unrealized gains and losses on available-for-sale securities (1)
As at
July 31, 2015 April 30, 2015
(Millions of Canadian dollars)
Cost/Amortized
cost
Grossunrealized
gains
Grossunrealized
lossesFair
value
Cost/Amortized
cost
Grossunrealized
gains
Grossunrealized
lossesFair
value
Canadian government debtFederal $ 11,198 $ 490 $ (1) $ 11,687 $ 11,291 $ 449 $ – $ 11,740Provincial and municipal 1,357 16 (1) 1,372 1,028 17 (1) 1,044
U.S. state, municipal and agencies debt (2) 12,651 21 (76) 12,596 8,271 10 (93) 8,188Other OECD government debt 15,269 33 (7) 15,295 13,590 38 (2) 13,626Mortgage-backed securities 456 5 (1) 460 120 4 – 124Asset-backed securities
CDOs 1,135 16 (3) 1,148 939 18 (2) 955Non-CDO securities 834 7 (68) 773 677 7 (78) 606
Corporate debt and other debt 14,607 59 (30) 14,636 11,504 69 (15) 11,558Equities 1,460 325 (10) 1,775 1,345 334 (6) 1,673Loan substitute securities 101 – (1) 100 108 – – 108
$ 59,068 $ 972 $ (198) $ 59,842 $ 48,873 $ 946 $ (197) $ 49,622
As at
October 31, 2014 July 31, 2014
(Millions of Canadian dollars)
Cost/Amortized
cost
Grossunrealized
gains
Grossunrealized
lossesFair
value
Cost/Amortized
cost
Grossunrealized
gains
Grossunrealized
lossesFair
value
Canadian government debtFederal $ 11,633 $ 338 $ (2) $ 11,969 $ 11,456 $ 340 $ (1) $ 11,795Provincial and municipal 792 8 (1) 799 817 6 (1) 822
U.S. state, municipal and agencies debt (2) 6,330 9 (82) 6,257 7,169 24 (115) 7,078Other OECD government debt 14,275 19 (1) 14,293 13,633 13 (2) 13,644Mortgage-backed securities 133 5 – 138 128 6 – 134Asset-backed securities
CDOs 857 26 (2) 881 932 31 (2) 961Non-CDO securities 634 5 (76) 563 581 5 (71) 515
Corporate debt and other debt 9,249 49 (11) 9,287 8,840 50 (15) 8,875Equities 1,333 369 (6) 1,696 1,368 375 (18) 1,725Loan substitute securities 124 2 – 126 125 4 (1) 128
$ 45,360 $ 830 $ (181) $ 46,009 $ 45,049 $ 854 $ (226) $ 45,677
(1) Excludes $3,303 million of held-to-maturity securities as at July 31, 2015 (April 30, 2015 – $3,258 million; October 31, 2014 – $1,759 million; July 31, 2014 – $681 million) that are carried atamortized cost.
(2) Includes securities issued by U.S. non-agencies backed by government insured assets, mortgage-backed securities and asset-backed securities issued by U.S. government agencies.
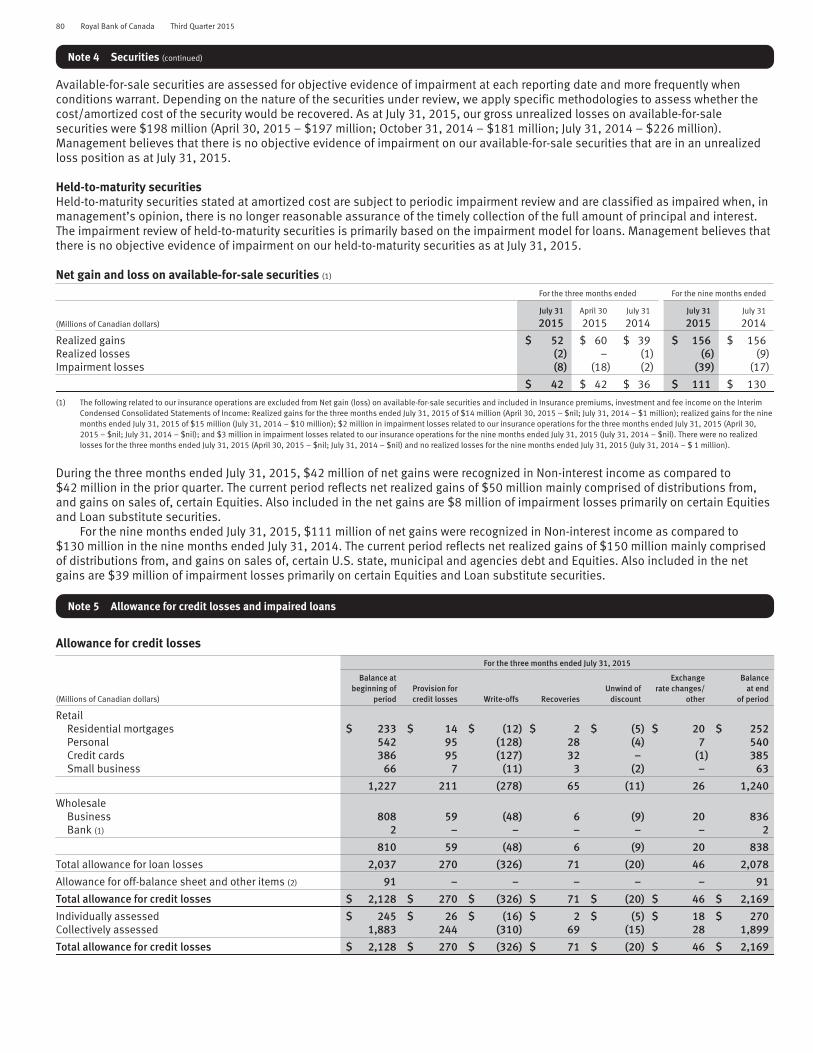
80 Royal Bank of Canada Third Quarter 2015
Note 4 Securities (continued)
Available-for-sale securities are assessed for objective evidence of impairment at each reporting date and more frequently whenconditions warrant. Depending on the nature of the securities under review, we apply specific methodologies to assess whether thecost/amortized cost of the security would be recovered. As at July 31, 2015, our gross unrealized losses on available-for-salesecurities were $198 million (April 30, 2015 – $197 million; October 31, 2014 – $181 million; July 31, 2014 – $226 million).Management believes that there is no objective evidence of impairment on our available-for-sale securities that are in an unrealizedloss position as at July 31, 2015.
Held-to-maturity securitiesHeld-to-maturity securities stated at amortized cost are subject to periodic impairment review and are classified as impaired when, inmanagement’s opinion, there is no longer reasonable assurance of the timely collection of the full amount of principal and interest.The impairment review of held-to-maturity securities is primarily based on the impairment model for loans. Management believes thatthere is no objective evidence of impairment on our held-to-maturity securities as at July 31, 2015.
Net gain and loss on available-for-sale securities (1)
For the three months ended For the nine months ended
(Millions of Canadian dollars)
July 31
2015April 30
2015July 31
2014July 31
2015July 31
2014
Realized gains $ 52 $ 60 $ 39 $ 156 $ 156Realized losses (2) – (1) (6) (9)Impairment losses (8) (18) (2) (39) (17)
$ 42 $ 42 $ 36 $ 111 $ 130
(1) The following related to our insurance operations are excluded from Net gain (loss) on available-for-sale securities and included in Insurance premiums, investment and fee income on the InterimCondensed Consolidated Statements of Income: Realized gains for the three months ended July 31, 2015 of $14 million (April 30, 2015 – $nil; July 31, 2014 – $1 million); realized gains for the ninemonths ended July 31, 2015 of $15 million (July 31, 2014 – $10 million); $2 million in impairment losses related to our insurance operations for the three months ended July 31, 2015 (April 30,2015 – $nil; July 31, 2014 – $nil); and $3 million in impairment losses related to our insurance operations for the nine months ended July 31, 2015 (July 31, 2014 – $nil). There were no realizedlosses for the three months ended July 31, 2015 (April 30, 2015 – $nil; July 31, 2014 – $nil) and no realized losses for the nine months ended July 31, 2015 (July 31, 2014 – $ 1 million).
During the three months ended July 31, 2015, $42 million of net gains were recognized in Non-interest income as compared to$42 million in the prior quarter. The current period reflects net realized gains of $50 million mainly comprised of distributions from,and gains on sales of, certain Equities. Also included in the net gains are $8 million of impairment losses primarily on certain Equitiesand Loan substitute securities.
For the nine months ended July 31, 2015, $111 million of net gains were recognized in Non-interest income as compared to$130 million in the nine months ended July 31, 2014. The current period reflects net realized gains of $150 million mainly comprisedof distributions from, and gains on sales of, certain U.S. state, municipal and agencies debt and Equities. Also included in the netgains are $39 million of impairment losses primarily on certain Equities and Loan substitute securities.
Note 5 Allowance for credit losses and impaired loans
Allowance for credit losses
For the three months ended July 31, 2015
(Millions of Canadian dollars)
Balance atbeginning of
periodProvision forcredit losses Write-offs Recoveries
Unwind ofdiscount
Exchangerate changes/
other
Balanceat end
of period
RetailResidential mortgages $ 233 $ 14 $ (12) $ 2 $ (5) $ 20 $ 252Personal 542 95 (128) 28 (4) 7 540Credit cards 386 95 (127) 32 – (1) 385Small business 66 7 (11) 3 (2) – 63
1,227 211 (278) 65 (11) 26 1,240
WholesaleBusiness 808 59 (48) 6 (9) 20 836Bank (1) 2 – – – – – 2
810 59 (48) 6 (9) 20 838
Total allowance for loan losses 2,037 270 (326) 71 (20) 46 2,078
Allowance for off-balance sheet and other items (2) 91 – – – – – 91
Total allowance for credit losses $ 2,128 $ 270 $ (326) $ 71 $ (20) $ 46 $ 2,169
Individually assessed $ 245 $ 26 $ (16) $ 2 $ (5) $ 18 $ 270Collectively assessed 1,883 244 (310) 69 (15) 28 1,899
Total allowance for credit losses $ 2,128 $ 270 $ (326) $ 71 $ (20) $ 46 $ 2,169

Royal Bank of Canada Third Quarter 2015 81
For the three months ended April 30, 2015
(Millions of Canadian dollars)
Balance atbeginning of
periodProvision forcredit losses Write-offs Recoveries
Unwind ofdiscount
Exchangerate changes/
other
Balanceat end
of period
RetailResidential mortgages $ 248 $ 9 $ (15) $ 2 $ (6) $ (5) $ 233Personal 553 103 (127) 25 (5) (7) 542Credit cards 386 95 (125) 30 – – 386Small business 65 9 (10) 2 – – 66
1,252 216 (277) 59 (11) (12) 1,227
WholesaleBusiness 803 66 (46) 11 (9) (17) 808Bank (1) 2 – – – – – 2
805 66 (46) 11 (9) (17) 810
Total allowance for loan losses 2,057 282 (323) 70 (20) (29) 2,037
Allowance for off-balance sheet and other items (2) 91 – – – – – 91
Total allowance for credit losses $ 2,148 $ 282 $ (323) $ 70 $ (20) $ (29) $ 2,128
Individually assessed $ 241 $ 42 $ (28) $ 7 $ (6) $ (11) $ 245Collectively assessed 1,907 240 (295) 63 (14) (18) 1,883
Total allowance for credit losses $ 2,148 $ 282 $ (323) $ 70 $ (20) $ (29) $ 2,128
For the three months ended July 31, 2014
(Millions of Canadian dollars)
Balance atbeginning of
periodProvision forcredit losses Write-offs Recoveries
Unwind ofdiscount
Exchangerate changes/
other
Balanceat end
of period
RetailResidential mortgages $ 167 $ 10 $ (7) $ 1 $ (7) $ 18 $ 182Personal 534 111 (133) 26 (5) – 533Credit cards 386 89 (119) 29 – – 385Small business 66 8 (10) 3 – (1) 66
1,153 218 (269) 59 (12) 17 1,166
WholesaleBusiness 728 65 (30) 14 (8) (11) 758Bank (1) 2 – – – – – 2
730 65 (30) 14 (8) (11) 760
Total allowance for loan losses 1,883 283 (299) 73 (20) 6 1,926
Allowance for off-balance sheet and other items (2) 91 – – – – – 91
Total allowance for credit losses $ 1,974 $ 283 $ (299) $ 73 $ (20) $ 6 $ 2,017
Individually assessed $ 147 $ 39 $ (6) $ 9 $ (5) $ 5 $ 189Collectively assessed 1,827 244 (293) 64 (15) 1 1,828
Total allowance for credit losses $ 1,974 $ 283 $ (299) $ 73 $ (20) $ 6 $ 2,017
For the nine months ended July 31, 2015
(Millions of Canadian dollars)
Balance atbeginning of
periodProvision forcredit losses Write-offs Recoveries
Unwind ofdiscount
Exchangerate changes/
other
Balanceat end
of period
RetailResidential mortgages $ 240 $ 36 $ (47) $ 5 $ (17) $ 35 $ 252Personal 535 291 (369) 78 (11) 16 540Credit cards 385 284 (374) 90 – – 385Small business 64 25 (32) 8 (2) – 63
1,224 636 (822) 181 (30) 51 1,240
WholesaleBusiness 768 187 (142) 24 (27) 26 836Bank (1) 2 (1) – 1 – – 2
770 186 (142) 25 (27) 26 838
Total allowance for loan losses 1,994 822 (964) 206 (57) 77 2,078
Allowance for off-balance sheet and other items (2) 91 – – – – – 91
Total allowance for credit losses $ 2,085 $ 822 $ (964) $ 206 $ (57) $ 77 $ 2,169
Individually assessed $ 214 $ 103 $ (71) $ 13 $ (17) $ 28 $ 270Collectively assessed 1,871 719 (893) 193 (40) 49 1,899
Total allowance for credit losses $ 2,085 $ 822 $ (964) $ 206 $ (57) $ 77 $ 2,169

82 Royal Bank of Canada Third Quarter 2015
Note 5 Allowance for credit losses and impaired loans (continued)
For the nine months ended July 31, 2014
(Millions of Canadian dollars)
Balance atbeginning of
periodProvision forcredit losses Write-offs Recoveries
Unwind ofdiscount
Exchangerate changes/
other
Balanceat end
of period
RetailResidential mortgages $ 151 $ 31 $ (20) $ 1 $ (20) $ 39 $ 182Personal 583 341 (438) 78 (17) (14) 533Credit cards 385 265 (349) 83 – 1 385Small business 61 33 (33) 7 (1) (1) 66
1,180 670 (840) 169 (38) 25 1,166
WholesaleBusiness 777 149 (152) 26 (28) (14) 758Bank (1) 2 – – – – – 2
779 149 (152) 26 (28) (14) 760
Total allowance for loan losses 1,959 819 (992) 195 (66) 11 1,926
Allowance for off-balance sheet and other items (2) 91 – – – – – 91
Total allowance for credit losses $ 2,050 $ 819 $ (992) $ 195 $ (66) $ 11 $ 2,017
Individually assessed $ 240 $ 97 $ (149) $ 13 $ (18) $ 6 $ 189Collectively assessed 1,810 722 (843) 182 (48) 5 1,828
Total allowance for credit losses $ 2,050 $ 819 $ (992) $ 195 $ (66) $ 11 $ 2,017
(1) Bank refers primarily to regulated deposit-taking institutions and securities firms.(2) The allowance for off-balance sheet and other items is reported separately in Other liabilities.
Loans past due but not impairedAs at
July 31, 2015 April 30, 2015
(Millions of Canadian dollars) 1 to 29 days 30 to 89 days90 days
and greater Total 1 to 29 days 30 to 89 days90 days
and greater Total
Retail $ 3,133 $ 1,217 $ 302 $ 4,652 $ 2,937 $ 1,320 $ 309 $ 4,566Wholesale 519 217 – 736 413 214 – 627
$ 3,652 $ 1,434 $ 302 $ 5,388 $ 3,350 $ 1,534 $ 309 $ 5,193
As at
October 31, 2014 July 31, 2014
(Millions of Canadian dollars) 1 to 29 days 30 to 89 days90 days
and greater Total 1 to 29 days 30 to 89 days90 days
and greater Total
Retail $ 3,055 $ 1,284 $ 316 $ 4,655 $ 3,201 $ 1,292 $ 299 $ 4,792Wholesale 431 322 – 753 555 251 – 806
$ 3,486 $ 1,606 $ 316 $ 5,408 $ 3,756 $ 1,543 $ 299 $ 5,598
Gross carrying value of loans individually determined to be impaired (1)
As at
(Millions of Canadian dollars)
July 31
2015April 30
2015October 31
2014July 31
2014
Retail $ – $ – $ – $ –Wholesale
Business 1,006 766 631 633Bank (2) 2 2 2 2
$ 1,008 $ 768 $ 633 $ 635
(1) The average balance of gross individually assessed impaired loans for the three months ended July 31, 2015 was $888 million (April 30, 2015 – $757 million; October 31, 2014 – $634 million;July 31, 2014 – $603 million). For the nine months ended July 31, 2015, the average balance of gross individually assessed impaired loans was $789 million (July 31, 2014 – $704 million).
(2) Bank refers primarily to regulated deposit-taking institutions and securities firms.
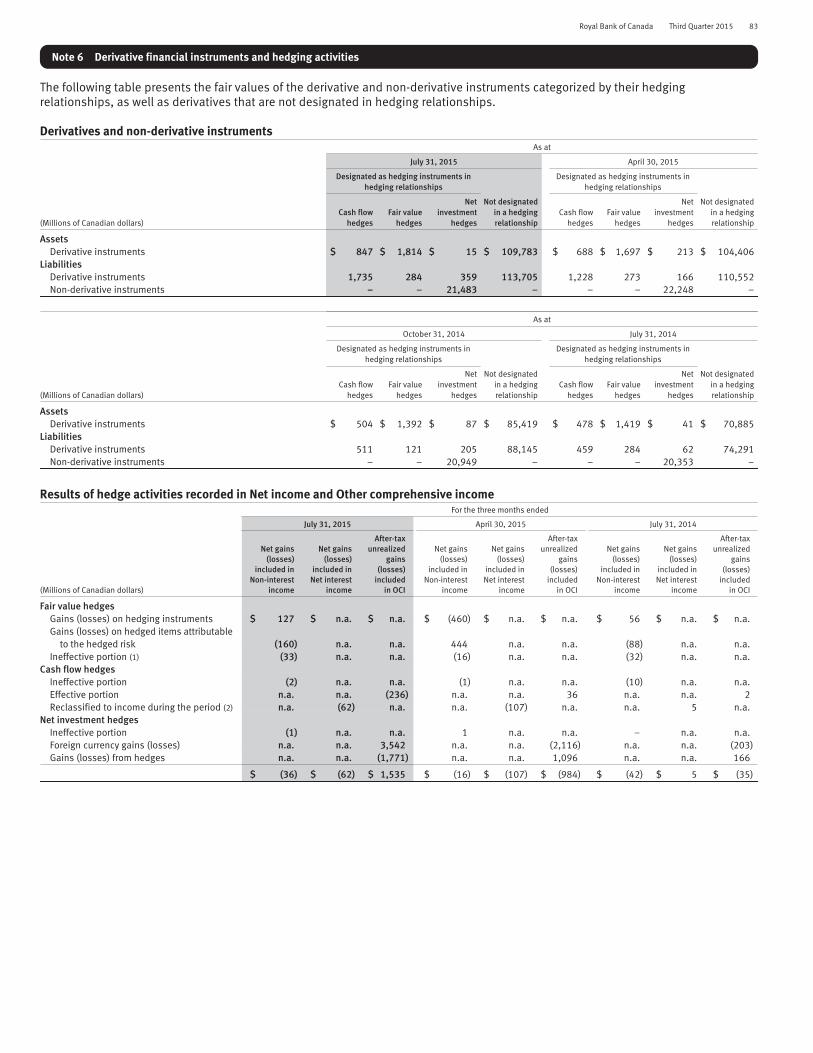
Royal Bank of Canada Third Quarter 2015 83
Note 6 Derivative financial instruments and hedging activities
The following table presents the fair values of the derivative and non-derivative instruments categorized by their hedgingrelationships, as well as derivatives that are not designated in hedging relationships.
Derivatives and non-derivative instrumentsAs at
July 31, 2015 April 30, 2015
Designated as hedging instruments inhedging relationships
Designated as hedging instruments inhedging relationships
(Millions of Canadian dollars)Cash flow
hedgesFair value
hedges
Netinvestment
hedges
Not designatedin a hedgingrelationship
Cash flowhedges
Fair valuehedges
Netinvestment
hedges
Not designatedin a hedgingrelationship
AssetsDerivative instruments $ 847 $ 1,814 $ 15 $ 109,783 $ 688 $ 1,697 $ 213 $ 104,406
LiabilitiesDerivative instruments 1,735 284 359 113,705 1,228 273 166 110,552Non-derivative instruments – – 21,483 – – – 22,248 –
As at
October 31, 2014 July 31, 2014
Designated as hedging instruments inhedging relationships
Designated as hedging instruments inhedging relationships
(Millions of Canadian dollars)Cash flow
hedgesFair value
hedges
Netinvestment
hedges
Not designatedin a hedgingrelationship
Cash flowhedges
Fair valuehedges
Netinvestment
hedges
Not designatedin a hedgingrelationship
AssetsDerivative instruments $ 504 $ 1,392 $ 87 $ 85,419 $ 478 $ 1,419 $ 41 $ 70,885
LiabilitiesDerivative instruments 511 121 205 88,145 459 284 62 74,291Non-derivative instruments – – 20,949 – – – 20,353 –
Results of hedge activities recorded in Net income and Other comprehensive incomeFor the three months ended
July 31, 2015 April 30, 2015 July 31, 2014
(Millions of Canadian dollars)
Net gains(losses)
included inNon-interest
income
Net gains(losses)
included inNet interest
income
After-taxunrealized
gains(losses)
includedin OCI
Net gains(losses)
included inNon-interest
income
Net gains(losses)
included inNet interest
income
After-taxunrealized
gains(losses)
includedin OCI
Net gains(losses)
included inNon-interest
income
Net gains(losses)
included inNet interest
income
After-taxunrealized
gains(losses)
includedin OCI
Fair value hedgesGains (losses) on hedging instruments $ 127 $ n.a. $ n.a. $ (460) $ n.a. $ n.a. $ 56 $ n.a. $ n.a.Gains (losses) on hedged items attributable
to the hedged risk (160) n.a. n.a. 444 n.a. n.a. (88) n.a. n.a.Ineffective portion (1) (33) n.a. n.a. (16) n.a. n.a. (32) n.a. n.a.
Cash flow hedgesIneffective portion (2) n.a. n.a. (1) n.a. n.a. (10) n.a. n.a.Effective portion n.a. n.a. (236) n.a. n.a. 36 n.a. n.a. 2Reclassified to income during the period (2) n.a. (62) n.a. n.a. (107) n.a. n.a. 5 n.a.
Net investment hedgesIneffective portion (1) n.a. n.a. 1 n.a. n.a. – n.a. n.a.Foreign currency gains (losses) n.a. n.a. 3,542 n.a. n.a. (2,116) n.a. n.a. (203)Gains (losses) from hedges n.a. n.a. (1,771) n.a. n.a. 1,096 n.a. n.a. 166
$ (36) $ (62) $ 1,535 $ (16) $ (107) $ (984) $ (42) $ 5 $ (35)

84 Royal Bank of Canada Third Quarter 2015
Note 6 Derivative financial instruments and hedging activities (continued)
For the nine months ended
July 31, 2015 July 31, 2014
(Millions of Canadian dollars)
Net gains(losses)
included inNon-interest
income
Net gains(losses)
included inNet interest
income
After-taxunrealized
gains(losses)
includedin OCI
Net gains(losses)
included inNon-interest
income
Net gains(losses)
included inNet interest
income
After-taxunrealized
gains(losses)
includedin OCI
Fair value hedgesGains (losses) on hedging instruments $ 410 $ n.a. $ n.a. $ 57 $ n.a. $ n.a.Gains (losses) on hedged items attributable to the hedged risk (497) n.a. n.a. (147) n.a. n.a.Ineffective portion (1) (87) n.a. n.a. (90) n.a. n.a.
Cash flow hedgesIneffective portion 2 n.a. n.a. (9) n.a. n.a.Effective portion n.a. n.a. (582) n.a. n.a. (76)Reclassified to income during the period (2) n.a. (374) n.a. n.a. 11 n.a.
Net investment hedgesIneffective portion (2) n.a. n.a. 1 n.a. n.a.Foreign currency gains (losses) n.a. n.a. 5,982 n.a. n.a. 1,819Gains (losses) from hedges n.a. n.a. (3,280) n.a. n.a. (1,115)
$ (87) $ (374) $ 2,120 $ (98) $ 11 $ 628
(1) Includes losses of $23 million for the three months ended July 31, 2015 (April 30, 2015 – $25 million; July 31, 2014 – $32 million) and losses of $76 million for the nine month ended July 31, 2015(July 31, 2014 – $87 million) that are excluded from the assessment of hedge effectiveness. These amounts are recorded in Non-interest income and are offset by other economic hedges.
(2) After-tax losses of $46 million were reclassified from Other components of equity to income during the three months ended July 31, 2015 (April 30, 2015 – $79 million; July 31, 2014 – gains of$3 million) and losses of $276 million were reclassified during the nine months ended July 31, 2015 (July 31, 2014 – gains of $8 million).
n.a. not applicable
Fair value of derivative instruments by term to maturity
As at
July 31, 2015 April 30, 2015
(Millions of Canadian dollars)Less than
1 year1 to
5 yearsOver
5 years TotalLess than
1 year1 to
5 yearsOver
5 years Total
Derivative assets $ 29,505 $ 36,786 $ 46,168 $ 112,459 $ 25,428 $ 33,731 $ 47,845 $ 107,004Derivative liabilities 30,537 42,327 43,219 116,083 27,301 39,875 45,043 112,219
As at
October 31, 2014 July 31, 2014
(Millions of Canadian dollars)Less than
1 year1 to
5 yearsOver
5 years TotalLess than
1 year1 to
5 yearsOver
5 years Total
Derivative assets $ 19,485 $ 29,838 $ 38,079 $ 87,402 $ 13,832 $ 25,052 $ 33,939 $ 72,823Derivative liabilities 19,980 32,640 36,362 88,982 15,793 26,695 32,608 75,096
Note 7 Significant acquisitions and dispositions
AcquisitionWealth ManagementOn January 22, 2015, we announced a definitive agreement to acquire City National Corporation (City National), the holding companyfor City National Bank. City National Bank provides banking, investment and trust services throughout the United States andcomprises substantially all of the business of City National. Total consideration includes US$2.7 billion in cash and 44 million RoyalBank of Canada common shares. We will also issue US$268 million of first preferred shares upon the cancellation of the outstandingCity National preferred shares. If the transaction closed on July 31, 2015, total consideration, including preferred shares, would havebeen $7.1 billion (US$5.5 billion).
The transaction is subject to customary closing conditions, including regulatory approvals and is expected to close in the firstquarter of 2016. The results of the acquired business will be consolidated from the date of close.
DispositionsPersonal & Commercial BankingOn July 31, 2015, we completed the sale of RBC Royal Bank (Suriname) N.V. (RBC Suriname). As a result of the transaction, whichwas announced on April 1, 2015, we recorded a total loss on disposal of $19 million (before and after-tax), consisting of a loss of$23 million in the second quarter included in Non-interest expense – Other, and a gain of $4 million in the third quarter primarilyrelating to foreign currency translation gains reclassified from Other components of equity.
Wealth ManagementOn July 14, 2015, we announced that we have entered into a definitive agreement to sell Royal Bank of Canada (Suisse) SA (RBCSuisse). The transaction is expected to close in the fourth quarter and is subject to customary closing conditions, including regulatoryapprovals. As a result of the disposition, the assets and liabilities of RBC Suisse are classified as held for sale, measured at the lowerof their carrying amount and fair value less costs to sell and presented in Other assets and Other liabilities.

Royal Bank of Canada Third Quarter 2015 85
The major classes of assets, liabilities and equity that are included in the disposal group as held for sale include:
(Millions of Canadian dollars) As at July 31, 2015
AssetsCash and deposits with banks $ 1,754Securities 43Loans, net of allowance 523Other assets 173
Total assets of disposal group included in Other assets 2,493
LiabilitiesDeposits $ 2,306Other liabilities 43
Total liabilities of disposal group included in Other liabilities 2,349
Total Other components of equity of the disposal group $ 1
Note 8 Deposits
The following table details our deposit liabilities:
As at
July 31, 2015 April 30, 2015
(Millions of Canadian dollars) Demand (1) Notice (2) Term (3) Total Demand (1) Notice (2) Term (3) Total
Personal $ 125,470 $ 19,312 $ 73,847 $ 218,629 $ 122,535 $ 18,825 $ 74,543 $ 215,903Business and government 175,308 6,766 267,323 449,397 166,152 5,177 243,982 415,311Bank 8,442 16 17,752 26,210 6,138 22 14,177 20,337
$ 309,220 $ 26,094 $ 358,922 $ 694,236 $ 294,825 $ 24,024 $ 332,702 $ 651,551
Non-interest-bearing (4)
Canada $ 72,633 $ 3,660 $ – $ 76,293 $ 68,063 $ 3,793 $ – $ 71,856United States 880 44 – 924 776 49 – 825Europe (5) 1,536 – – 1,536 3,435 1 – 3,436Other International 6,577 297 – 6,874 5,938 450 – 6,388
Interest-bearing (4)
Canada 187,219 13,072 270,859 471,150 180,220 12,204 255,033 447,457United States 3,828 4,214 65,260 73,302 3,561 3,199 56,536 63,296Europe (5) 32,830 647 14,186 47,663 29,581 507 12,485 42,573Other International 3,717 4,160 8,617 16,494 3,251 3,821 8,648 15,720
$ 309,220 $ 26,094 $ 358,922 $ 694,236 $ 294,825 $ 24,024 $ 332,702 $ 651,551
As at
October 31, 2014 July 31, 2014
(Millions of Canadian dollars) Demand (1) Notice (2) Term (3) Total Demand (1) Notice (2) Term (3) Total
Personal $ 120,444 $ 17,793 $ 70,980 $ 209,217 $ 117,263 $ 17,271 $ 69,893 $ 204,427Business and government 162,988 3,038 220,634 386,660 154,793 2,257 220,585 377,635Bank 5,771 11 12,441 18,223 5,755 10 13,864 19,629
$ 289,203 $ 20,842 $ 304,055 $ 614,100 $ 277,811 $ 19,538 $ 304,342 $ 601,691
Non-interest-bearing (4)
Canada $ 65,774 $ 3,478 $ – $ 69,252 $ 63,594 $ 3,521 $ – $ 67,115United States 1,777 15 – 1,792 1,788 9 – 1,797Europe (5) 3,314 1 – 3,315 3,915 2 – 3,917Other International 5,057 279 – 5,336 5,009 299 – 5,308
Interest-bearing (4)
Canada 175,172 10,895 241,902 427,969 168,275 10,649 240,391 419,315United States 3,497 2,144 45,359 51,000 3,355 1,331 46,248 50,934Europe (5) 31,118 418 9,282 40,818 29,017 183 10,137 39,337Other International 3,494 3,612 7,512 14,618 2,858 3,544 7,566 13,968
$ 289,203 $ 20,842 $ 304,055 $ 614,100 $ 277,811 $ 19,538 $ 304,342 $ 601,691
(1) Deposits payable on demand include all deposits for which we do not have the right to notice of withdrawal. These deposits include both savings and chequing accounts.(2) Deposits payable after notice include all deposits for which we can legally require notice of withdrawal. These deposits are primarily savings accounts.(3) Term deposits include deposits payable on a fixed date. These deposits include term deposits, guaranteed investment certificates and similar instruments. As at July 31, 2015, the balance of
term deposits also includes senior deposit notes we have issued to provide long-term funding of $179 billion (April 30, 2015 – $163 billion; October 31, 2014 – $150 billion; July 31, 2014 –$147 billion).
(4) The geographical splits of the deposits are based on the point of origin of the deposits and where the revenue is recognized. As at July 31, 2015, deposits denominated in U.S. dollars, Sterling,Euro and other foreign currencies were $238 billion, $14 billion, $27 billion and $27 billion, respectively (April 30, 2015 – $209 billion, $12 billion, $24 billion and $25 billion; October 31, 2014 –$183 billion, $11 billion, $23 billion and $22 billion; July 31, 2014 – $174 billion, $12 billion, $24 billion and $22 billion).
(5) Europe includes the United Kingdom, Luxembourg and the Channel Islands.

86 Royal Bank of Canada Third Quarter 2015
Note 8 Deposits (continued)
The following table presents the contractual maturities of our term deposit liabilities.
As at
(Millions of Canadian dollars)
July 31
2015April 30
2015October 31
2014July 31
2014
Within 1 year:less than 3 months $ 75,852 $ 66,298 $ 57,840 $ 53,4523 to 6 months 48,525 32,203 32,880 21,8746 to 12 months 64,864 67,303 50,300 42,204
1 to 2 years 49,067 53,508 54,354 70,2292 to 3 years 37,175 30,541 31,559 32,2353 to 4 years 29,613 29,696 28,946 29,5424 to 5 years 25,191 27,516 24,673 26,090Over 5 years 28,635 25,637 23,503 28,716
$ 358,922 $ 332,702 $ 304,055 $ 304,342
Aggregate amount of term deposits in denominations of one hundred thousand dollars or more $ 326,000 $ 300,000 $ 270,000 $ 270,000
Note 9 Employee benefits – Pension and other post-employment benefits
We offer a number of defined benefits and defined contribution plans which provide pension and post-employment benefits toeligible employees. The following tables present the composition of our pension and other post-employment benefit expense and thecomposition of our remeasurements recorded in other comprehensive income.
Pension and other post-employment benefit expenseFor the three months ended
Pension plans Other post-employment benefit plans
(Millions of Canadian dollars)
July 31
2015April 30
2015July 31
2014July 31
2015April 30
2015July 31
2014
Current service costs $ 86 $ 86 $ 79 $ 9 $ 8 $ 7Past service costs – – 5 – – –Net interest expense 7 8 4 19 19 20Settlement gain (2) – – – – –Remeasurements of other long term benefits – – – (3) 6 3Administrative expense 3 3 3 – – –
Defined benefit pension expense $ 94 $ 97 $ 91 $ 25 $ 33 $ 30Defined contribution pension expense 41 37 33 – – –
$ 135 $ 134 $ 124 $ 25 $ 33 $ 30
For the nine months ended
Pension plansOther post-employment
benefit plans
(Millions of Canadian dollars)
July 31
2015July 31
2014July 31
2015July 31
2014
Current service costs $ 259 $ 236 $ 26 $ 23Past service costs – 5 – –Net interest expense 23 11 56 60Settlement gain (2) – – –Remeasurements of other long term benefits – – 4 6Administrative expense 9 9 – –
Defined benefit pension expense $ 289 $ 261 $ 86 $ 89Defined contribution pension expense 123 103 – –
$ 412 $ 364 $ 86 $ 89
Remeasurements of employee benefit plans (1)
For the three months ended
Defined benefit pension plans Other post-employment benefit plans
(Millions of Canadian dollars)
July 31
2015April 30
2015July 31
2014July 31
2015April 30
2015July 31
2014
Actuarial (gains) losses:Changes in demographic assumptions $ 8 $ – $ – $ – $ – $ –Changes in financial assumptions (191) (571) 411 (1) (79) 58Experience adjustments – – – (1) (4) –
Return on plan assets (excluding interest based on discount rate) (86) 94 (227) (2) – –
$ (269) $ (477) $ 184 $ (4) $ (83) $ 58

Royal Bank of Canada Third Quarter 2015 87
For the nine months ended
Defined benefit pension plans Other post-employment benefit plans
(Millions of Canadian dollars)
July 31
2015July 31
2014July 31
2015July 31
2014Actuarial (gains) losses:
Changes in demographic assumptions $ 8 $ – $ – $ –Changes in financial assumptions 435 677 74 95Experience adjustments 2 – (9) –
Return on plan assets (excluding interest based on discount rate) (678) (654) (2) –
$ (233) $ 23 $ 63 $ 95(1) Market based assumptions, including Changes in financial assumptions and Return on plan assets, are reviewed on a quarterly basis. All other assumptions are updated during our annual review of
plan assumptions.
Note 10 Significant capital and funding transactions
Subordinated debenturesOn June 15, 2015, we redeemed all $1.5 billion outstanding 4.35% subordinated debentures due June 15, 2020 for 100% of theirprincipal amount plus accrued interest to the redemption date.
On June 4, 2015, we issued $1 billion of subordinated debentures. The notes bear interest at a fixed rate of 2.48% per annumuntil June 4, 2020, and at the three-month Banker’s acceptance rate plus 1.10% thereafter until their maturity on June 4, 2025.
On November 14, 2014, all $200 million outstanding 10% subordinated debentures matured. The principal plus accrued interestwere paid to the noteholders on the maturity date.
Preferred sharesOn July 22, 2015, we issued 6 million Non-Cumulative First Preferred Shares Series BI (BI) for gross proceeds of $150 million. On June5, 2015, we issued 6 million Non-Cumulative First Preferred Shares Series BH (BH) for gross proceeds of $150 million. The BI and BHshares pay quarterly cash dividends, if declared, at a rate of 4.9% per annum. Subject to the consent of OSFI and the requirements ofthe Bank Act (Canada), on and after November 24, 2020, we may redeem the shares in whole or in part for cash at a price per share of$25 plus a premium if redeemed before November 24, 2024. The shares include non-viability contingent capital (NVCC) provisionswhich are necessary for the shares to qualify as Tier 1 regulatory capital.
On March 13, 2015, we issued 12 million Non-Cumulative 5-Year Rate Reset First Preferred Shares Series BF (BF) for gross proceedsof $300 million. For the initial five year period to the earliest redemption date of November 24, 2020, the shares pay quarterly cashdividends, if declared, at a rate of 3.60% per annum. The dividend rate will reset on the earliest redemption date and every fifth yearthereafter at a rate equal to the 5-year Government of Canada bond yield plus a premium of 2.62%. Holders have the option to converttheir shares into Non-Cumulative Floating Rate First Preferred Shares Series BG, subject to certain conditions, on the earliestredemption date and every fifth year thereafter at a rate equal to the 3-month Government of Canada Treasury Bill yield plus 2.62%.
On January 30, 2015, we issued 24 million Non-Cumulative 5-Year Rate Reset First Preferred Shares Series BD (BD) for grossproceeds of $600 million. For the initial five year period to the earliest redemption date of May 24, 2020, the shares pay quarterlycash dividends, if declared, at a rate of 3.60% per annum. The dividend rate will reset on the earliest redemption date and every fifthyear thereafter at a rate equal to the 5-year Government of Canada bond yield plus a premium of 2.74%. Holders have the option toconvert their shares into Non-Cumulative Floating Rate First Preferred Shares Series BE, subject to certain conditions, on the earliestredemption date and every fifth year thereafter at a rate equal to the 3-month Government of Canada Treasury Bill yield plus 2.74%.
Subject to the consent of OSFI and the requirements of the Bank Act (Canada), we may redeem the BF and BD shares in whole orin part for cash at a price per share of $25 on the earliest redemption date and every fifth year thereafter. The shares include NVCCprovisions which are necessary for the shares to qualify as Tier 1 regulatory capital.
On November 24, 2014, we redeemed all 13 million issued and outstanding Non-Cumulative 5-Year Rate Reset First PreferredShares, Series AX for cash at a redemption price of $25 per share.
Common shares issued (1)
For the three months ended
July 31, 2015 April 30, 2015 July 31, 2014
(Millions of Canadian dollars, except number of shares)
Number ofshares
(thousands) Amount
Number ofshares
(thousands) Amount
Number ofshares
(thousands) Amount
Stock options exercised (2) 90 $ 5 510 $ 25 352 $ 19Purchased for cancellation (3) – – – – (165) (2)
90 $ 5 510 $ 25 187 $ 17
For the nine months ended
July 31, 2015 July 31, 2014
(Millions of Canadian dollars, except number of shares)
Number ofshares
(thousands) Amount
Number ofshares
(thousands) Amount
Stock options exercised (2) 959 $ 50 2,026 $ 114Purchased for cancellation (3) – – (1,546) (16)
959 $ 50 480 $ 98(1) The requirements of our dividend reinvestment plan (DRIP) are satisfied through either open market share purchases or shares issued from treasury. During the nine months ended July 31, 2015,
and July 31, 2014, our DRIP’s requirements were satisfied through open market share purchases.(2) Amounts include cash received for stock options exercised during the period and the fair value adjustment to stock options.(3) During the three months ended July 31, 2014, we purchased for cancellation common shares at an average cost of $74.62 per share, with an average book value of $10.03 per share. During the
nine months ended July 31, 2014, we purchased for cancellation common shares at an average cost of $72.64 per share, with an average book value of $10.03 per share.

88 Royal Bank of Canada Third Quarter 2015
Note 11 Earnings per share
For the three months ended For the nine months ended
(Millions of Canadian dollars, except share and per share amounts)July 312015
April 302015
July 312014
July 312015
July 312014
Basic earnings per shareNet income $ 2,475 $ 2,502 $ 2,378 $ 7,433 $ 6,671Dividends on preferred shares (50) (47) (55) (137) (169)Net income attributable to non-controlling interest (26) (29) (26) (77) (77)
Net income available to common shareholders 2,399 2,426 2,297 7,219 6,425
Weighted average number of common shares (in thousands) 1,443,052 1,442,078 1,442,312 1,442,579 1,442,615Basic earnings per share (in dollars) $ 1.66 $ 1.68 $ 1.59 $ 5.00 $ 4.45
Diluted earnings per shareNet income available to common shareholders $ 2,399 $ 2,426 $ 2,297 $ 7,219 $ 6,425Dilutive impact of exchangeable shares 4 3 3 11 17
Net income available to common shareholders including dilutiveimpact of exchangeable shares 2,403 2,429 2,300 7,230 6,442
Weighted average number of common shares (in thousands) 1,443,052 1,442,078 1,442,312 1,442,579 1,442,615Stock options (1) 2,405 2,470 2,966 2,569 2,871Exchangeable shares (2) 4,083 4,103 4,177 4,058 7,382
Average number of diluted common shares (in thousands) 1,449,540 1,448,651 1,449,455 1,449,206 1,452,868Diluted earnings per share (in dollars) $ 1.66 $ 1.68 $ 1.59 $ 4.99 $ 4.43
(1) The dilutive effect of stock options was calculated using the treasury stock method. When the exercise price of options outstanding is greater than the average market price of our common shares,the options are excluded from the calculation of diluted earnings per share. For the three months ended July 31, 2015, 799,372 average options outstanding with an exercise price of $78.59 wereexcluded from the calculation of diluted earnings per share (April 30, 2015 – 800,522; July 31, 2014– no outstanding options were excluded). For the nine months ended July 31, 2015, 671,603average options outstanding with an exercise price of $78.59 were excluded from the calculation of diluted earnings per share (July 31, 2014 – no outstanding options were excluded).
(2) Includes exchangeable preferred shares and trust capital securities.
Note 12 Litigation
We are a large global institution that is subject to many different complex legal and regulatory requirements that continue to evolve.As a result, Royal Bank of Canada and its subsidiaries are and have been subject to a variety of legal proceedings, including civilclaims and lawsuits, regulatory examinations, investigations, audits and requests for information by various governmental regulatoryagencies and law enforcement authorities in various jurisdictions. Some of these matters may involve novel legal theories andinterpretations and may be advanced under criminal as well as civil statutes, and some proceedings could result in the imposition ofcivil, regulatory enforcement or criminal penalties. Management reviews the status of all proceedings on an ongoing basis and willexercise its judgment in resolving them in such manner as management believes to be in the Bank’s best interest. This is an area ofsignificant judgment and uncertainty and the extent of our financial and other exposure to these proceedings could be material to ourresults of operations in any particular period.
Our significant legal proceedings include all of the matters disclosed in Note 27 to our audited 2014 Annual ConsolidatedFinancial Statements as updated below:
CFTC litigationRoyal Bank of Canada and the Commodity Futures Trading Commission (CFTC) signed a Consent Order to settle the civil lawsuitbrought by the CFTC which was approved by the court in December 2014. The Consent Order requires Royal Bank of Canada, amongother things, to pay a civil monetary penalty of US$35 million. Royal Bank of Canada has paid this amount and the matter is closed.
Rural/Metro litigationA final judgment was entered on February 19, 2015 in the amount of US$93 million. Royal Bank of Canada has appealed the DelawareCourt of Chancery’s determination of liability and quantum of damages, and the plaintiffs have cross-appealed the court’s ruling onthe attorneys’ fees application.
LIBOR litigationOn August 4, 2015, the U.S. District Court for the Southern District of New York (the Court) issued an additional decision ruling onvarious motions to dismiss the individual plaintiff claims in the multi-district litigation proceeding. Based on the Court’s decisions todate, many of the claims against Royal Bank of Canada have been dismissed; however a number of these claims are subject to appealor may be refiled based upon the content of the decisions. The parties are currently working with the Court to confirm the cases whichremain active.
Royal Bank of Canada Trust Company (Bahamas) Limited ProceedingsOn April 13, 2015, a French investigating judge notified Royal Bank of Canada Trust Limited (RBC Bahamas) of the issuance of anordonnance de renvoi referring RBC Bahamas and other unrelated persons to the French tribunal correctionnel to face the charge ofcomplicity in estate tax fraud relating to actions taken relating to a trust for which RBC Bahamas serves as trustee. The trial for thismatter is expected to commence in January 2016. RBC Bahamas believes that its actions did not violate French law and intends tocontest the charge in the French court. Based on the facts currently known, it is not possible to predict the ultimate outcome of thisproceeding; however, management believes that its ultimate resolution will not have a material effect on our consolidated financialposition, although it may be material to our results of operations in the period it occurs.

Royal Bank of Canada Third Quarter 2015 89
Interchange fees litigationSince 2011, seven proposed class actions have been commenced in Canada: Bancroft-Snell v. Visa Canada Corporation, et al., 9085-4886 Quebec Inc. v. Visa Canada Corporation, et al., Coburn and Watson’s Metropolitan Home v. Bank of America Corporation, et al.(Watson), Macaronies Hair Club and Laser Centre Inc. v. BofA Canada Bank, et al., 1023926 Alberta Ltd. v. Bank of AmericaCorporation, et al., The Crown & Hand Pub Ltd. v. Bank of America Corporation, et al., and Hello Baby Equipment Inc. v. BofA CanadaBank, et al. The defendants in each action are VISA Canada Corporation (Visa), MasterCard International Incorporated (MasterCard),Royal Bank of Canada and other financial institutions. The plaintiff class members are Canadian merchants who accept Visa and/orMasterCard branded credit cards for payment. The actions allege, among other things, that from March 2001 to the present, Visa andMasterCard conspired with their issuing banks and acquirers to set default interchange rates and merchant discount fees and thatcertain rules (Honour All Cards and No Surcharge) have the effect of increasing the merchant discount fees. The actions include claimsof civil conspiracy, breach of the Competition Act, interference with economic relations and unjust enrichment. The claims seekunspecified general and punitive damages. In Watson, a decision to partially certify the action as a class proceeding was released onMarch 27, 2014, and was appealed. On August 19, 2015, the Court of Appeal struck the plaintiff class representative’s cause of actionunder section 45 of the Competition Act and reinstated the plaintiff class representative’s cause of action in civil conspiracy byunlawful means, among other rulings. Based on the facts currently known, it is not possible at this time for us to predict the ultimateoutcome of this proceeding or the timing of its resolution.
Foreign exchange mattersOn July 2, 2015, the Brazilian civil antitrust authority Administrative Council for Economic Defense (CADE) initiated an administrativeproceeding to investigate possible violations of Brazilian antitrust law by a number of banks, including Royal Bank of Canada,regarding foreign exchange trading. The matter is in its initial stages.
On July 31, 2015, RBC Capital Markets, LLC was added as a new defendant in a pending putative class action initially filed inNovember 2013 in the United States District Court for the Southern District of New York. The action is brought against multiple foreignexchange dealers and alleges collusive behaviour, among other allegations, in foreign exchange trading. The action is in its initialstages as it relates to the new defendants, including RBC Capital Markets, LLC.
Based on the facts currently known, it is not possible to predict the ultimate outcome of the foreign exchange matters or thetiming of their ultimate resolution.
Note 13 Results by business segment
For the three months ended July 31, 2015
(Millions of Canadian dollars)
Personal &Commercial
BankingWealth
Management Insurance
Investor &TreasuryServices
CapitalMarkets (1)
CorporateSupport (1) Total
Net interest income (2), (3) $ 2,543 $ 129 $ – $ 204 $ 1,016 $ (109) $ 3,783Non-interest income 1,083 1,579 1,021 352 1,030 (20) 5,045Total revenue 3,626 1,708 1,021 556 2,046 (129) 8,828Provision for credit losses 257 – – – 15 (2) 270Insurance policyholder benefits, claims and
acquisition expense – – 656 – – – 656Non-interest expense 1,648 1,302 153 331 1,187 14 4,635Net income (loss) before income taxes 1,721 406 212 225 844 (141) 3,267Income taxes (recoveries) 440 121 39 58 299 (165) 792Net income $ 1,281 $ 285 $ 173 $ 167 $ 545 $ 24 $ 2,475Non-interest expense includes:
Depreciation and amortization $ 88 $ 41 $ 4 $ 14 $ 6 $ 154 $ 307Restructuring provisions – 2 – – – – 2
Total assets $ 391,687 $ 29,933 $ 14,243 $ 132,619 $ 491,420 $ 25,271 $ 1,085,173Total liabilities $ 391,712 $ 29,913 $ 14,244 $ 132,565 $ 491,340 $ (36,499) $ 1,023,275
For the three months ended April 30, 2015
(Millions of Canadian dollars)
Personal &Commercial
BankingWealth
Management Insurance
Investor &TreasuryServices
CapitalMarkets (1)
CorporateSupport (1) Total
Net interest income (2), (3) $ 2,399 $ 122 $ – $ 198 $ 940 $ (102) $ 3,557Non-interest income 1,073 1,626 806 330 1,307 131 5,273Total revenue 3,472 1,748 806 528 2,247 29 8,830Provision for credit losses 235 32 – – 15 – 282Insurance policyholder benefits, claims and
acquisition expense – – 493 – – – 493Non-interest expense 1,618 1,340 156 312 1,280 30 4,736Net income (loss) before income taxes 1,619 376 157 216 952 (1) 3,319Income taxes (recoveries) 419 105 34 57 327 (125) 817Net income $ 1,200 $ 271 $ 123 $ 159 $ 625 $ 124 $ 2,502Non-interest expense includes:
Depreciation and amortization $ 87 $ 39 $ 4 $ 13 $ 7 $ 162 $ 312Restructuring provisions – 20 – – – – 20
Total assets $ 383,278 $ 28,835 $ 13,753 $ 119,198 $ 465,304 $ 21,804 $ 1,032,172Total liabilities $ 383,266 $ 28,825 $ 13,757 $ 119,126 $ 465,280 $ (36,329) $ 973,925

90 Royal Bank of Canada Third Quarter 2015
Note 13 Results by business segment (continued)
For the three months ended July 31, 2014
(Millions of Canadian dollars)
Personal &Commercial
BankingWealth
Management Insurance
Investor &TreasuryServices
CapitalMarkets (1)
CorporateSupport (1) Total
Net interest income (2), (3) $ 2,475 $ 117 $ – $ 182 $ 999 $ (126) $ 3,647Non-interest income 987 1,468 1,383 298 1,186 21 5,343
Total revenue 3,462 1,585 1,383 480 2,185 (105) 8,990Provision for credit losses 284 – – – 1 (2) 283Insurance policyholder benefits, claims and
acquisition expense – – 1,009 – – – 1,009Non-interest expense 1,632 1,191 143 330 1,269 37 4,602
Net income (loss) before income taxes 1,546 394 231 150 915 (140) 3,096Income taxes (recoveries) 408 109 17 40 274 (130) 718
Net income $ 1,138 $ 285 $ 214 $ 110 $ 641 $ (10) $ 2,378
Non-interest expense includes:Depreciation and amortization $ 85 $ 36 $ 4 $ 14 $ 7 $ 150 $ 296Restructuring provisions – – – – – – –
Total assets $ 372,061 $ 26,522 $ 12,503 $ 97,662 $ 387,205 $ 17,917 $ 913,870
Total liabilities $ 372,002 $ 26,459 $ 12,562 $ 97,646 $ 387,003 $ (35,299) $ 860,373
For the nine months ended July 31, 2015
(Millions of Canadian dollars)
Personal &Commercial
BankingWealth
Management Insurance
Investor &TreasuryServices
CapitalMarkets (1)
CorporateSupport (1) Total
Net interest income (2), (3) $ 7,435 $ 375 $ – $ 598 $ 2,872 $ (309) $ 10,971Non-interest income 3,229 4,747 3,719 992 3,454 190 16,331
Total revenue 10,664 5,122 3,719 1,590 6,326 (119) 27,302Provision for credit losses 744 45 – (1) 35 (1) 822Insurance policyholder benefits, claims and
acquisition expense – – 2,671 – – – 2,671Non-interest expense 4,894 3,975 455 959 3,624 84 13,991
Net income (loss) before income taxes 5,026 1,102 593 632 2,667 (202) 9,818Income taxes (recoveries) 1,290 316 112 164 903 (400) 2,385
Net income $ 3,736 $ 786 $ 481 $ 468 $ 1,764 $ 198 $ 7,433
Non-interest expense includes:Depreciation and amortization $ 261 $ 118 $ 12 $ 41 $ 21 $ 467 $ 920Restructuring provisions – 59 – – – – 59
Total assets $ 391,687 $ 29,933 $ 14,243 $ 132,619 $ 491,420 $ 25,271 $ 1,085,173
Total liabilities $ 391,712 $ 29,913 $ 14,244 $ 132,565 $ 491,340 $ (36,499) $ 1,023,275
For the nine months ended July 31, 2014
(Millions of Canadian dollars)
Personal &Commercial
BankingWealth
Management Insurance
Investor &TreasuryServices
CapitalMarkets (1)
CorporateSupport (1) Total
Net interest income (2), (3) $ 7,296 $ 346 $ – $ 549 $ 2,608 $ (243) $ 10,556Non-interest income 2,883 4,328 3,790 859 3,259 51 15,170
Total revenue 10,179 4,674 3,790 1,408 5,867 (192) 25,726Provision for credit losses 789 19 – – 12 (1) 819Insurance policyholder benefits, claims and
acquisition expense – – 2,821 – – – 2,821Non-interest expense 4,877 3,555 430 965 3,445 49 13,321
Net income (loss) before income taxes 4,513 1,100 539 443 2,410 (240) 8,765Income taxes (recoveries) 1,189 302 14 115 757 (283) 2,094
Net income $ 3,324 $ 798 $ 525 $ 328 $ 1,653 $ 43 $ 6,671
Non-interest expense includes:Depreciation and amortization $ 250 $ 111 $ 12 $ 44 $ 21 $ 419 $ 857Restructuring provisions 3 – – – – – 3
Total assets $ 372,061 $ 26,522 $ 12,503 $ 97,662 $ 387,205 $ 17,917 $ 913,870
Total liabilities $ 372,002 $ 26,459 $ 12,562 $ 97,646 $ 387,003 $ (35,299) $ 860,373
(1) Taxable equivalent basis (Teb). The Teb adjustment for the three months ended July 31, 2015 was $133 million (April 30, 2015 – $115 million, July 31, 2014 – $174 million) and for the nine monthsended July 31, 2015 was $357 million (July 31, 2014 – $391 million).
(2) Inter-segment revenue and share of profits in joint ventures and associates are not material.(3) Interest revenue is reported net of interest expense as management relies primarily on net interest income as a performance measure.

Royal Bank of Canada Second Quarter 2015 91
Note 14 Capital management
Regulatory capital and capital ratiosOSFI formally establishes risk-based capital and leverage targets for deposit-taking institutions in Canada. Beginning this year, theasset-to-capital ratio has been replaced by a leverage ratio. The leverage ratio is calculated by dividing Tier 1 capital by an exposuremeasure. The exposure measure consists of total assets (excluding items deducted from Tier 1 capital) and certain off-balance sheetitems converted into credit exposure equivalents. Adjustments are also made to derivatives and secured financing transactions toreflect credit and other risks. During the third quarter of 2015, we complied with all capital and leverage requirements imposed byOSFI.
As at
(Millions of Canadian dollars, except percentage and multiple amounts)July 312015
April 302015
October 312014
July 312014
Capital (1)
Common Equity Tier 1 capital $ 42,405 $ 39,608 $ 36,406 $ 34,967Tier 1 capital 49,049 45,989 42,202 41,408Total capital 56,553 53,932 50,020 48,188
Risk-weighted assets used in calculation of capital ratios (1), (2)
Common Equity Tier 1 capital ratio 419,484 396,874 368,594 368,320Tier 1 capital ratio 420,789 398,014 369,976 369,772Total capital ratio 421,908 398,992 372,050 371,949
Total capital risk-weighted assets (1)
Credit risk $ 330,577 $ 306,831 $ 286,327 $ 281,684Market risk 41,322 42,915 38,460 44,042Operational risk 50,009 49,246 47,263 46,223
$ 421,908 $ 398,992 $ 372,050 $ 371,949
Capital ratios, leverage ratios and multiples (1)
Common Equity Tier 1 capital ratio 10.1% 10.0% 9.9% 9.5%Tier 1 capital ratio 11.7% 11.6% 11.4% 11.2%Total capital ratio 13.4% 13.5% 13.4% 13.0%Leverage ratio (3) 4.2% 4.0% n.a. n.a.Assets-to-capital multiple (4) n.a. n.a. 17.0X 17.3X
(1) Capital, risk-weighted assets and capital ratios and multiples are calculated using OSFI Capital Adequacy Requirements. Leverage ratio is calculated using OSFI Leverage Requirements.(2) Effective the third quarter of 2014, the credit valuation adjustment to our risk-weighted asset calculation implemented in the first quarter of 2014, must reflect different percentages for each tier of
capital. This change reflects a phase-in of credit valuation adjustments ending in the fourth quarter of 2018. During this phase-in period, risk-weighted assets for Common Equity Tier 1, Tier 1 andTotal capital ratios will be subject to different annual credit valuation adjustment percentages.
(3) Exposure measure as at July 31, 2015 was $1,178 billion (April 30, 2015 – $1,138 billion).(4) Beginning this year, the asset-to-capital multiple has been replaced by a leverage ratio. Gross adjusted assets as at October 31, 2014 and July 31, 2014 were $885 billion and $868 billion,
respectively.n.a. not applicable
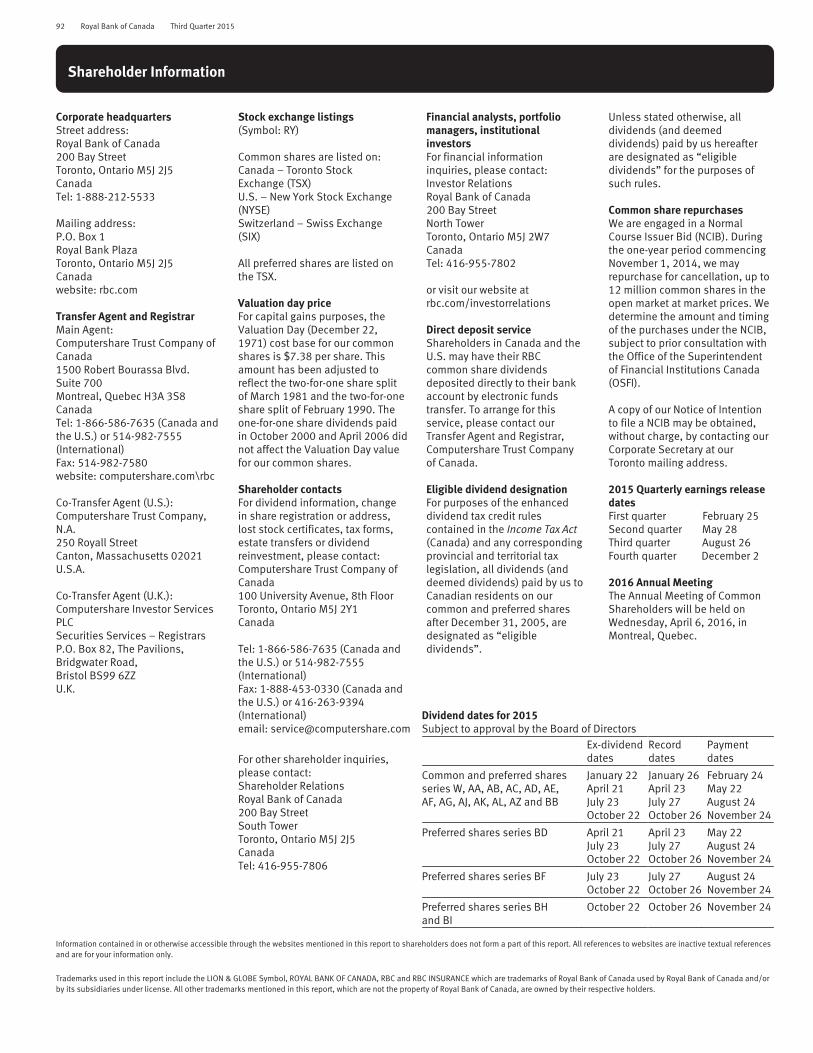
92 Royal Bank of Canada Third Quarter 2015
Shareholder Information
Corporate headquartersStreet address:Royal Bank of Canada200 Bay StreetToronto, Ontario M5J 2J5CanadaTel: 1-888-212-5533
Mailing address:P.O. Box 1Royal Bank PlazaToronto, Ontario M5J 2J5Canadawebsite: rbc.com
Transfer Agent and RegistrarMain Agent:Computershare Trust Company ofCanada1500 Robert Bourassa Blvd.Suite 700Montreal, Quebec H3A 3S8CanadaTel: 1-866-586-7635 (Canada andthe U.S.) or 514-982-7555(International)Fax: 514-982-7580website: computershare.com\rbc
Co-Transfer Agent (U.S.):Computershare Trust Company,N.A.250 Royall StreetCanton, Massachusetts 02021U.S.A.
Co-Transfer Agent (U.K.):Computershare Investor ServicesPLCSecurities Services – RegistrarsP.O. Box 82, The Pavilions,Bridgwater Road,Bristol BS99 6ZZU.K.
Stock exchange listings(Symbol: RY)
Common shares are listed on:Canada – Toronto StockExchange (TSX)U.S. – New York Stock Exchange(NYSE)Switzerland – Swiss Exchange(SIX)
All preferred shares are listed onthe TSX.
Valuation day priceFor capital gains purposes, theValuation Day (December 22,1971) cost base for our commonshares is $7.38 per share. Thisamount has been adjusted toreflect the two-for-one share splitof March 1981 and the two-for-oneshare split of February 1990. Theone-for-one share dividends paidin October 2000 and April 2006 didnot affect the Valuation Day valuefor our common shares.
Shareholder contactsFor dividend information, changein share registration or address,lost stock certificates, tax forms,estate transfers or dividendreinvestment, please contact:Computershare Trust Company ofCanada100 University Avenue, 8th FloorToronto, Ontario M5J 2Y1Canada
Tel: 1-866-586-7635 (Canada andthe U.S.) or 514-982-7555(International)Fax: 1-888-453-0330 (Canada andthe U.S.) or 416-263-9394
Financial analysts, portfoliomanagers, institutionalinvestorsFor financial informationinquiries, please contact:Investor RelationsRoyal Bank of Canada200 Bay StreetNorth TowerToronto, Ontario M5J 2W7CanadaTel: 416-955-7802
or visit our website atrbc.com/investorrelations
Direct deposit serviceShareholders in Canada and theU.S. may have their RBCcommon share dividendsdeposited directly to their bankaccount by electronic fundstransfer. To arrange for thisservice, please contact ourTransfer Agent and Registrar,Computershare Trust Companyof Canada.
Eligible dividend designationFor purposes of the enhanceddividend tax credit rulescontained in the Income Tax Act(Canada) and any correspondingprovincial and territorial taxlegislation, all dividends (anddeemed dividends) paid by us toCanadian residents on ourcommon and preferred sharesafter December 31, 2005, aredesignated as “eligibledividends”.
Unless stated otherwise, alldividends (and deemeddividends) paid by us hereafterare designated as “eligibledividends” for the purposes ofsuch rules.
Common share repurchasesWe are engaged in a NormalCourse Issuer Bid (NCIB). Duringthe one-year period commencingNovember 1, 2014, we mayrepurchase for cancellation, up to12 million common shares in theopen market at market prices. Wedetermine the amount and timingof the purchases under the NCIB,subject to prior consultation withthe Office of the Superintendentof Financial Institutions Canada(OSFI).
A copy of our Notice of Intentionto file a NCIB may be obtained,without charge, by contacting ourCorporate Secretary at ourToronto mailing address.
2015 Quarterly earnings releasedatesFirst quarter February 25Second quarter May 28Third quarter August 26Fourth quarter December 2
2016 Annual MeetingThe Annual Meeting of CommonShareholders will be held onWednesday, April 6, 2016, inMontreal, Quebec.
(International)email: [email protected]
Dividend dates for 2015Subject to approval by the Board of Directors
For other shareholder inquiries,please contact:Shareholder RelationsRoyal Bank of Canada200 Bay StreetSouth TowerToronto, Ontario M5J 2J5CanadaTel: 416-955-7806
Ex-dividenddates
Recorddates
Paymentdates
Common and preferred sharesseries W, AA, AB, AC, AD, AE,AF, AG, AJ, AK, AL, AZ and BB
January 22April 21July 23October 22
January 26April 23July 27October 26
February 24May 22August 24November 24
Preferred shares series BD April 21July 23October 22
April 23July 27October 26
May 22August 24November 24
Preferred shares series BF July 23October 22
July 27October 26
August 24November 24
Preferred shares series BHand BI
October 22 October 26 November 24
Information contained in or otherwise accessible through the websites mentioned in this report to shareholders does not form a part of this report. All references to websites are inactive textual referencesand are for your information only.
Trademarks used in this report include the LION & GLOBE Symbol, ROYAL BANK OF CANADA, RBC and RBC INSURANCE which are trademarks of Royal Bank of Canada used by Royal Bank of Canada and/orby its subsidiaries under license. All other trademarks mentioned in this report, which are not the property of Royal Bank of Canada, are owned by their respective holders.