Roxadustat (ASP1517) 1517-CL-0304 CONFIDENTIAL Name …
21
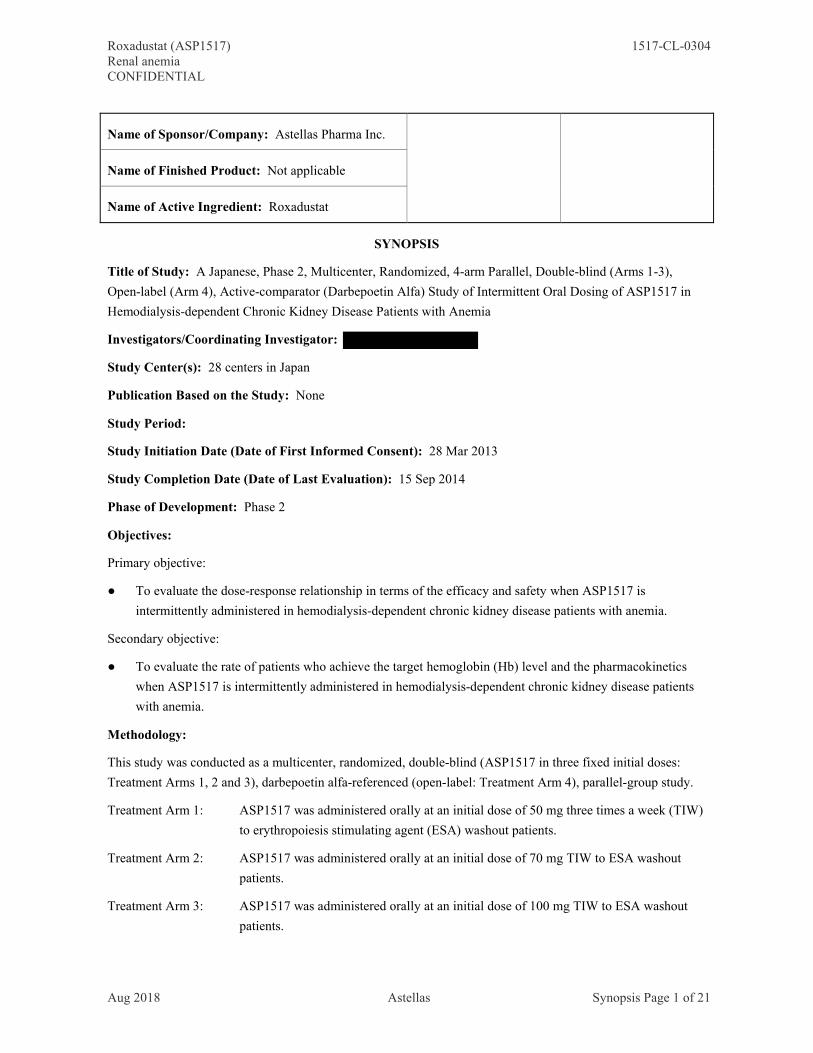
Roxadustat (ASP1517) 1517-CL-0304 Renal anemia CONFIDENTIAL Aug 2018 Astellas Synopsis Page 1 of 21 Name of Sponsor/Company: Astellas Pharma Inc. Name of Finished Product: Not applicable Name of Active Ingredient: Roxadustat SYNOPSIS Title of Study: A Japanese, Phase 2, Multicenter, Randomized, 4-arm Parallel, Double-blind (Arms 1-3), Open-label (Arm 4), Active-comparator (Darbepoetin Alfa) Study of Intermittent Oral Dosing of ASP1517 in Hemodialysis-dependent Chronic Kidney Disease Patients with Anemia Investigators/Coordinating Investigator: Study Center(s): 28 centers in Japan Publication Based on the Study: None Study Period: Study Initiation Date (Date of First Informed Consent): 28 Mar 2013 Study Completion Date (Date of Last Evaluation): 15 Sep 2014 Phase of Development: Phase 2 Objectives: Primary objective: ● To evaluate the dose-response relationship in terms of the efficacy and safety when ASP1517 is intermittently administered in hemodialysis-dependent chronic kidney disease patients with anemia. Secondary objective: ● To evaluate the rate of patients who achieve the target hemoglobin (Hb) level and the pharmacokinetics when ASP1517 is intermittently administered in hemodialysis-dependent chronic kidney disease patients with anemia. Methodology: This study was conducted as a multicenter, randomized, double-blind (ASP1517 in three fixed initial doses: Treatment Arms 1, 2 and 3), darbepoetin alfa-referenced (open-label: Treatment Arm 4), parallel-group study. Treatment Arm 1: ASP1517 was administered orally at an initial dose of 50 mg three times a week (TIW) to erythropoiesis stimulating agent (ESA) washout patients. Treatment Arm 2: ASP1517 was administered orally at an initial dose of 70 mg TIW to ESA washout patients. Treatment Arm 3: ASP1517 was administered orally at an initial dose of 100 mg TIW to ESA washout patients.
Transcript of Roxadustat (ASP1517) 1517-CL-0304 CONFIDENTIAL Name …
Roxadustat (ASP1517) 1517-CL-0304Renal anemiaCONFIDENTIAL
Aug 2018 Astellas Synopsis Page 1 of 21
Name of Sponsor/Company: Astellas Pharma Inc.
Name of Finished Product: Not applicable
Name of Active Ingredient: Roxadustat
SYNOPSIS
Title of Study: A Japanese, Phase 2, Multicenter, Randomized, 4-arm Parallel, Double-blind (Arms 1-3),
Open-label (Arm 4), Active-comparator (Darbepoetin Alfa) Study of Intermittent Oral Dosing of ASP1517 in
Hemodialysis-dependent Chronic Kidney Disease Patients with Anemia
Investigators/Coordinating Investigator:
Study Center(s): 28 centers in Japan
Publication Based on the Study: None
Study Period:
Study Initiation Date (Date of First Informed Consent): 28 Mar 2013
Study Completion Date (Date of Last Evaluation): 15 Sep 2014
Phase of Development: Phase 2
Objectives:
Primary objective:
● To evaluate the dose-response relationship in terms of the efficacy and safety when ASP1517 is
intermittently administered in hemodialysis-dependent chronic kidney disease patients with anemia.
Secondary objective:
● To evaluate the rate of patients who achieve the target hemoglobin (Hb) level and the pharmacokinetics
when ASP1517 is intermittently administered in hemodialysis-dependent chronic kidney disease patients
with anemia.
Methodology:
This study was conducted as a multicenter, randomized, double-blind (ASP1517 in three fixed initial doses:
Treatment Arms 1, 2 and 3), darbepoetin alfa-referenced (open-label: Treatment Arm 4), parallel-group study.
Treatment Arm 1: ASP1517 was administered orally at an initial dose of 50 mg three times a week (TIW)
to erythropoiesis stimulating agent (ESA) washout patients.
Treatment Arm 2: ASP1517 was administered orally at an initial dose of 70 mg TIW to ESA washout
patients.
Treatment Arm 3: ASP1517 was administered orally at an initial dose of 100 mg TIW to ESA washout
patients.

Roxadustat (ASP1517) 1517-CL-0304Renal anemiaCONFIDENTIAL
Aug 2018 Astellas Synopsis Page 2 of 21
Treatment Arm 4: Darbepoetin alfa was intravenously administered at an initial dose of 20 μg once a
week (QW) to ESA washout patients.
After obtaining written informed consent from patients, screening assessment was performed on the day of
dialysis after the longest dialysis interval. After confirming that the patients met the criteria for first registration,
first registration was conducted within 8 days of the screening assessment.
ESA washout was to be started on the day of dialysis after the longest dialysis interval in patients who had
completed first registration. The ESA washout period was a minimum of 5 weeks (35 days) in patients who had
been receiving epoetin beta pegol, a minimum of 3 weeks (21 days) in patients who had been receiving
darbepoetin alfa, and a minimum of 2 weeks (14 days) in patients who had been receiving recombinant human
erythropoietin. During the washout period, the specified tests were performed each time before dialysis after
the longest dialysis interval. An Hb test was also performed before dialysis on the other days of the week, if
necessary. The investigator(s) confirmed that the Hb level and other parameters met the criteria for second
registration, and if it was ensured, completed the second registration within 8 days of the test, and then
proceeded to the treatment period. Second registration was to be conducted within 10 weeks of the screening
assessment.
The fixed dose period was defined as the period from the start of treatment to the start of dialysis at the Week-6
visit. The titration period was defined as the period from after the start of dialysis at the Week-6 visit to the end
of the post-dialysis assessment at the Week-24 visit.
The investigator(s) prescribed ASP1517, which was taken starting from the day of dialysis after the latest
longest dialysis interval, including the day of second registration, under double-blind conditions to patients
assigned to Treatment Arms 1, 2 and 3 based on the drug number that was randomly assigned to Treatment
Arms 1 to 4 and notified by the web registration system at the time of second registration. The investigator(s)
administered darbepoetin alfa to patients assigned to Treatment Arm 4 under open-label conditions.
The study treatment was administered for a maximum of 24 weeks. After the end of the treatment period,
follow-up observations were performed for 4 weeks. Patients who discontinued the study underwent follow-up
observations as far as possible.

Roxadustat (ASP1517) 1517-CL-0304Renal anemiaCONFIDENTIAL
Aug 2018 Astellas Synopsis Page 3 of 21
Number of Patients (Planned, Enrolled and Analyzed): The planned sample size was 30 patients per group,
120 patients in total, as the number of patients to be treated with the study treatment. A total of 130 patients
were randomized. Of the 130 randomized patients, 129 (99.2%) were included in the safety analysis set (SAF),
127 (97.7%) were included in the full analysis set (FAS) and pharmacokinetic analysis set (PKAS) and 86
(66.2%) were included in the per protocol set (PPS).
Diagnosis and Main Criteria for Inclusion: Patients had chronic kidney disease on stable maintenance
hemodialysis and renal anemia receiving ESA with Hb level before dialysis of ≥ 10.0 g/dL, age of ≥ 20 years
and < 75 years and body weight after the end of dialysis of ≥ 40.0 kg and < 80.0 kg.
Test Product, Dose and Mode of Administration, Batch Numbers: ASP1517 20-mg capsule (lot number:
), ASP1517 50-mg capsule (lot number: , ) and ASP1517 capsule placebo (lot number:
, )
Duration of Treatment (or Duration of Study, if applicable): 24 weeks
Reference Product, Dose and Mode of Administration, Batch Numbers: Darbepoetin alfa 10 μg (lot
number: ), darbepoetin alfa 15 μg (lot number: ), darbepoetin alfa 20 μg (lot number: ),
darbepoetin alfa 30 μg (lot number: ), darbepoetin alfa 40 μg (lot number: ) and darbepoetin
alfa 60 μg (lot number: )
Criteria for Evaluation:
Efficacy
Primary variable:
● Rate of rise in Hb (g/dL/week) from baseline to the final assessment in the fixed dose period (at Week 6,
time of discontinuation, or time of dose adjustment)
Within 10 weeks
Study period
Pre-investigational period Treatment period Follow-up period
Washout period
Fixed dose period (6 weeks)
Titration period(18 weeks)
Treatment Arm 1 (initial dose: ASP1517 50 mg three times a week)
Treatment Arm 2 (initial dose: ASP1517 70 mg three times a week)
Treatment Arm 3 (initial dose: ASP1517 100 mg three times a week)
Follow-upperiod
Follow-upperiod
Follow-upperiod
Follow-upperiod
Follow-upperiod
(4 weeks)
Within 1 week
Info
rmed
con
sent
acq
uisi
tio
n
Scr
een
ing
asse
ssm
ent
Fir
stre
gis
trat
ion
Sta
rt o
f w
asho
ut
Sec
ond
reg
istr
atio
n/ra
ndo
miz
atio
n
Do
uble
-bli
nd
Op
en-l
abel
Treatment Arm 4 (initial dose: darbepoetin alfa 20 μg once a week)

Roxadustat (ASP1517) 1517-CL-0304Renal anemiaCONFIDENTIAL
Aug 2018 Astellas Synopsis Page 4 of 21
Secondary variables:
● Cumulative response rate during the period from the start of the titration period to the end of treatment (a
responder is defined as a patient whose Hb is ≥ 10.0 g/dL and who achieve an increase in Hb of ≥ 1.0 g/dL
from baseline)
● Percentage of measurement time points at which each patient maintains the target Hb level (10.0 to
12.0 g/dL) after achieving Hb of ≥ 10.0 g/dL
● Rate of patients who achieve the target Hb level (10.0 to 12.0 g/dL) at each week
● The number and percentage of patients who achieve Hb ≥ 10.0 g/dL, and time to first achieving the lower
limit of the target Hb level (10.0 g/dL)
● Change in Hb from baseline at each week
Additional variables:
● Cumulative response rate during the overall treatment period (a responder is defined as a patient whose Hb
is ≥ 10.0 g/dL and who achieve an increase in Hb of ≥ 1.0 g/dL from baseline)
● Average Hb of Weeks 18 to 24
● Hb change from baseline to the average Hb of Weeks 18 to 24
● Maintenance rate (Hb response defined as an average Hb during Weeks 18 to 24 within the target range of
10.0 to 12.0 g/dL)
● Maintenance rate (Hb response defined as all Hb during Weeks 18 to 24 within the target range of 10.0 to
12.0 g/dL)
● Average dose-response relationship in Weeks 18 to 24
● Time course of Hb by prior and concomitant iron therapy
● Time course of Hb in Weeks 18 to 24 by average ferritin and TSAT category
● Time course of Hb by prior and concomitant phosphate binder use
Pharmacokinetics
● Plasma concentration of unchanged ASP1517
Safety
● Adverse events (AEs)
● Laboratory data
● Vital signs (blood pressure, pulse rate)
● Standard 12-lead electrocardiogram (ECG) (including QT assessment at baseline and at Week 24 or the
time of discontinuation)
● X-ray (cardiothoracic ratio)
● Ophthalmological examination (fluorescein fundus angiography, fundus photography, optical coherence
tomography, and visual acuity test)
Statistical Methods:
Efficacy
The primary efficacy analysis was performed for the FAS. The primary variable, which was the rate of rise in
Hb (g/dL/week) from baseline to the final assessment in the fixed dose period (at Week 6, time of
discontinuation, or time of dose adjustment), was summarized using descriptive statistics by randomization arm

Roxadustat (ASP1517) 1517-CL-0304Renal anemiaCONFIDENTIAL
Aug 2018 Astellas Synopsis Page 5 of 21
and pooled ASP1517 TIW, and analyzed by the contrast test to evaluate three types of dose-response
relationship, using a regression model with treatment group (ASP1517 dose groups [50, 70 and 100 mg]) as a
factor, and Hb at baseline and ESA dose before ESA washout as covariates.
● Linear: C1 = (−1, 0, 1)
● Initial rise at 100 mg: C2 = (−1, −1, 2)
● Plateau at 70 mg: C3 = (−2, 1, 1)
Statistical tests were conducted with a two-sided 0.05 significance level, with statistical adjustment for
multiplicity using the resampling-based method.
The secondary and additional efficacy variables were analyzed descriptively.
Pharmacokinetics
Individual concentrations and elapsed time from dosing as well as their summary statistics were presented. To
consider the P-binders effect for pharmacokinetics, concomitant use of P-binders or not was used for categorical
value to summarize the concentration and to draw the figures.
Safety
Treatment-emergent adverse event (TEAE) was defined as any AE that started or worsened in severity after
initial dose of study treatment through the follow-up period. The coding dictionary for this study was
MedDRA. It was used to summarize TEAEs by SOC and PT. Summary tables were provided for the number
and percentage of patients with TEAEs, drug-related TEAEs, deaths, serious TEAEs and TEAEs leading to
discontinuation of study treatment. Cumulative incidence curves of patients with TEAEs were presented
graphically using Kaplan-Meier method.
Other safety variables were analyzed descriptively.
Ophthalmological examination
Regular ophthalmological imaging was performed and corresponding images were collected and centrally
assessed in a masked manner. No aggregate analysis of this data was planned or performed, and these
centralized assessments were performed on a patient-by-patient basis. The outcomes of these assessments were
sent to study sites for the investigators’ subjective decision-making on adverse events, whether to report as an
adverse event or not based upon general protocol instructions for reporting adverse events. Due to an apparent
imbalance between the occurrence of reported adverse events (a greater proportion [9.3%] of patients in the
pooled ASP1517 group compared with the darbepoetin alfa group [0%] was reported with a retinal hemorrhage
event), it was decided to conduct a descriptive aggregate analysis of the same ophthalmological images
following centralized and masked grading by experienced graders.
Summary of Results/Conclusions:
Study Population: A total of 251 patients gave informed consent and 121 patients discontinued before
randomization due to screen failures. A total of 130 patients were randomized [Table 1]. Of these, 129 patients
were treated with the study treatment and 1 patient in the ASP1517 100 mg group discontinued before the first
dose of study treatment due to the withdrawal of consent.
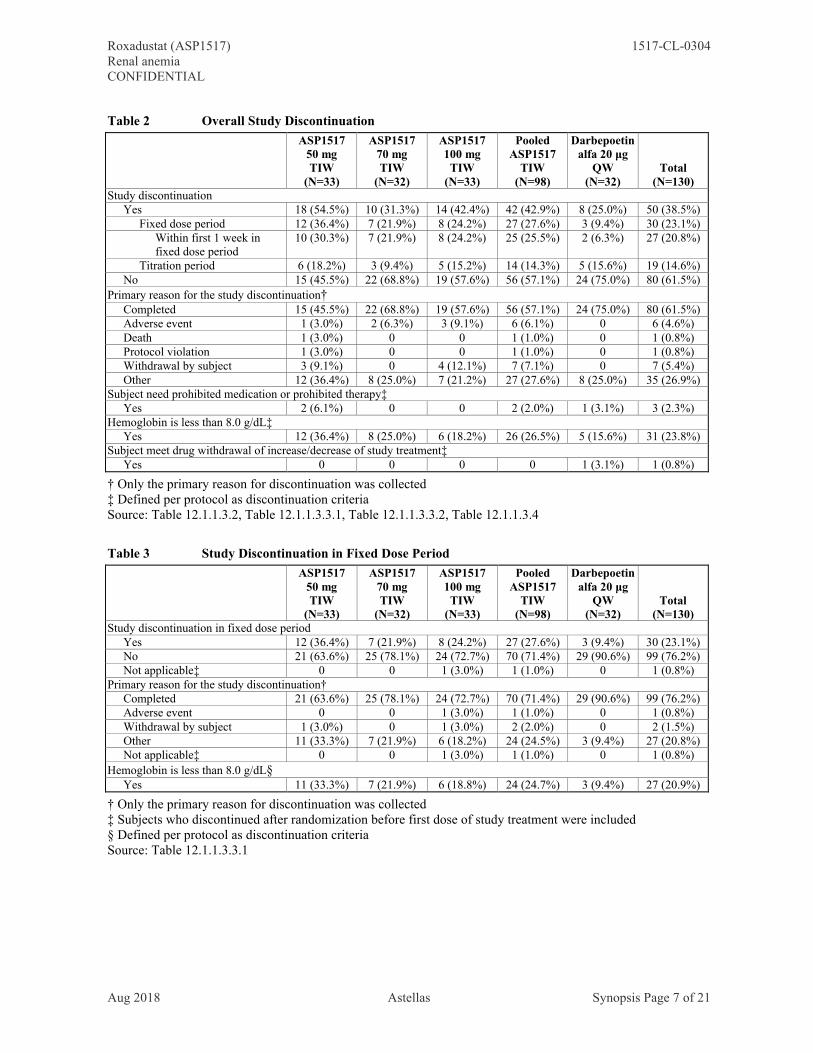
A total of 80 (61.5%) patients completed the study and 50 (38.5%) patients discontinued [Table 2]. A total of
30 (23.1%) patients discontinued during the fixed dose period and most of them (27 patients) discontinued

Roxadustat (ASP1517) 1517-CL-0304Renal anemiaCONFIDENTIAL
Aug 2018 Astellas Synopsis Page 6 of 21
within first 1 week in the fixed dose period. The frequency of study discontinuation during the fixed dose
period was higher in the pooled ASP1517 group (27.6%) compared with the darbepoetin alfa group (9.4%).
The frequency of study discontinuation during the titration period was similar between the pooled ASP1517
(14.3%) and darbepoetin alfa (15.6%) groups [Table 4].
The most common reason for the study discontinuation was the discontinuation criterion of Hb being < 8.0 g/dL
(31 patients, 23.8%) and most of them (27 patients) were reported during the fixed dose period [Table 3]. A
total of 6 (4.6%) patients discontinued due to AEs and all of them were reported in the ASP1517 groups. Most
of study discontinuation due to AEs (5 patients) were reported in the titration period [Table 4].
Of the 130 randomized patients, 129 (99.2%) were included in the SAF, 127 (97.7%) were included in the FAS
and PKAS and 86 (66.2%) were included in the PPS.
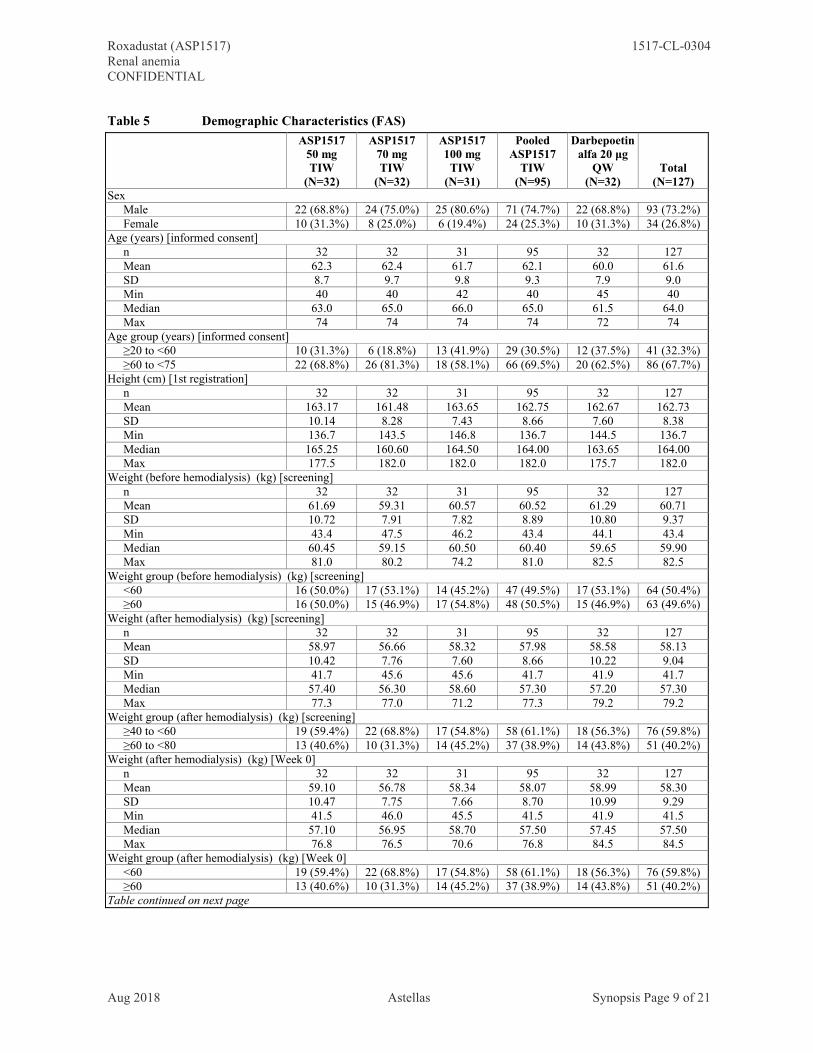
Of the 127 patients included in the FAS, 93 (73.2%) patients were male and 34 (26.8%) patients were female
[Table 5]. The mean age was 61.6 years and the mean weight after hemodialysis was 58.13 kg. The mean
duration of chronic kidney disease with anemia and duration of hemodialysis were longer in the darbepoetin
alfa group compared with the ASP1517 groups. The proportion of patients with concomitant iron therapy (oral)
was slightly higher in the darbepoetin alfa group compared with the ASP1517 groups. Other demographic
characteristics were similar between the treatment groups.
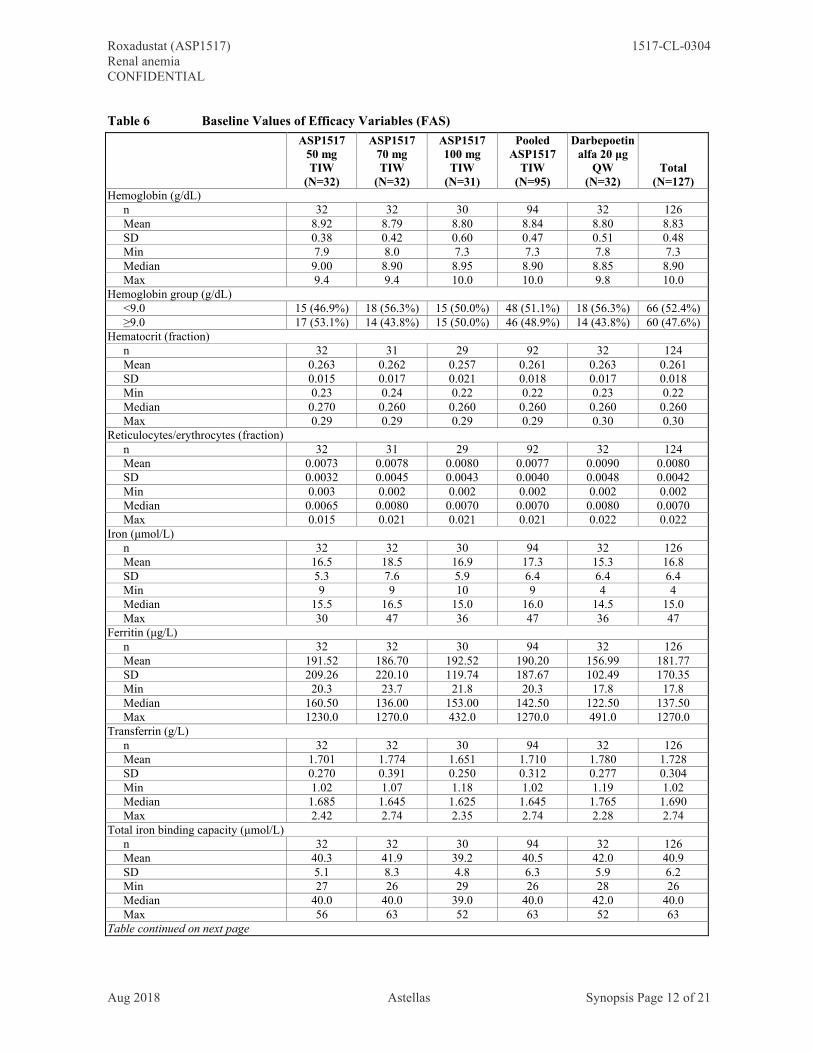
The baseline values of efficacy variables were similar between the treatment groups [Table 6]. The mean Hb
ranged from 8.79 to 8.92 g/dL across the treatment groups.
Table 1 Analysis Sets
Analysis Set
ASP151750 mgTIW
(N=33)
ASP151770 mgTIW
(N=32)
ASP1517100 mg
TIW(N=33)
PooledASP1517
TIW(N=98)
Darbepoetinalfa 20 μg
QW(N=32)
Total(N=130)
Randomized 33 (100.0%) 32 (100.0%) 33 (100.0%) 98 (100.0%) 32 (100.0%) 130 (100.0%)Discontinued after randomization before first dose of study treatment
0 0 1 (3.0%) 1 (1.0%) 0 1 (0.8%)
Received study treatment 33 (100.0%) 32 (100.0%) 32 (97.0%) 97 (99.0%) 32 (100.0%) 129 (99.2%)Safety analysis set† 33 (100.0%) 32 (100.0%) 32 (97.0%) 97 (99.0%) 32 (100.0%) 129 (99.2%)Full analysis set‡ 32 (97.0%) 32 (100.0%) 31 (93.9%) 95 (96.9%) 32 (100.0%) 127 (97.7%)Per protocol set§ 19 (57.6%) 24 (75.0%) 21 (63.6%) 64 (65.3%) 22 (68.8%) 86 (66.2%)Pharmacokinetics analysis set¶ 32 (97.0%) 32 (100.0%) 31 (93.9%) 95 (96.9%) 32 (100.0%) 127 (97.7%)
† All subjects who received at least one dose of the study treatment.‡ All subjects who received at least one dose of the study treatment and who have data of at least one efficacy variable measured after the start of the study treatment.§ All subjects in the FAS who satisfy the requirements (refer to protocol).¶ All subjects who received at least one dose of ASP1517 and whose samples for drug concentration measurement were collected at one or more time points after the start of the study treatment.Source: Table 12.1.1.2
Roxadustat (ASP1517) 1517-CL-0304Renal anemiaCONFIDENTIAL
Aug 2018 Astellas Synopsis Page 7 of 21
Table 2 Overall Study Discontinuation
ASP151750 mgTIW
(N=33)
ASP151770 mgTIW
(N=32)
ASP1517100 mg
TIW(N=33)
PooledASP1517
TIW(N=98)
Darbepoetinalfa 20 μg
QW(N=32)
Total(N=130)
Study discontinuationYes 18 (54.5%) 10 (31.3%) 14 (42.4%) 42 (42.9%) 8 (25.0%) 50 (38.5%)
Fixed dose period 12 (36.4%) 7 (21.9%) 8 (24.2%) 27 (27.6%) 3 (9.4%) 30 (23.1%)Within first 1 week in fixed dose period
10 (30.3%) 7 (21.9%) 8 (24.2%) 25 (25.5%) 2 (6.3%) 27 (20.8%)
Titration period 6 (18.2%) 3 (9.4%) 5 (15.2%) 14 (14.3%) 5 (15.6%) 19 (14.6%)No 15 (45.5%) 22 (68.8%) 19 (57.6%) 56 (57.1%) 24 (75.0%) 80 (61.5%)
Primary reason for the study discontinuation†Completed 15 (45.5%) 22 (68.8%) 19 (57.6%) 56 (57.1%) 24 (75.0%) 80 (61.5%)Adverse event 1 (3.0%) 2 (6.3%) 3 (9.1%) 6 (6.1%) 0 6 (4.6%)Death 1 (3.0%) 0 0 1 (1.0%) 0 1 (0.8%)Protocol violation 1 (3.0%) 0 0 1 (1.0%) 0 1 (0.8%)Withdrawal by subject 3 (9.1%) 0 4 (12.1%) 7 (7.1%) 0 7 (5.4%)Other 12 (36.4%) 8 (25.0%) 7 (21.2%) 27 (27.6%) 8 (25.0%) 35 (26.9%)
Subject need prohibited medication or prohibited therapy‡Yes 2 (6.1%) 0 0 2 (2.0%) 1 (3.1%) 3 (2.3%)
Hemoglobin is less than 8.0 g/dL‡Yes 12 (36.4%) 8 (25.0%) 6 (18.2%) 26 (26.5%) 5 (15.6%) 31 (23.8%)
Subject meet drug withdrawal of increase/decrease of study treatment‡Yes 0 0 0 0 1 (3.1%) 1 (0.8%)
† Only the primary reason for discontinuation was collected‡ Defined per protocol as discontinuation criteriaSource: Table 12.1.1.3.2, Table 12.1.1.3.3.1, Table 12.1.1.3.3.2, Table 12.1.1.3.4
Table 3 Study Discontinuation in Fixed Dose Period
ASP151750 mgTIW
(N=33)
ASP151770 mgTIW
(N=32)
ASP1517100 mg
TIW(N=33)
PooledASP1517
TIW(N=98)
Darbepoetinalfa 20 μg
QW(N=32)
Total(N=130)
Study discontinuation in fixed dose periodYes 12 (36.4%) 7 (21.9%) 8 (24.2%) 27 (27.6%) 3 (9.4%) 30 (23.1%)No 21 (63.6%) 25 (78.1%) 24 (72.7%) 70 (71.4%) 29 (90.6%) 99 (76.2%)Not applicable‡ 0 0 1 (3.0%) 1 (1.0%) 0 1 (0.8%)
Primary reason for the study discontinuation†Completed 21 (63.6%) 25 (78.1%) 24 (72.7%) 70 (71.4%) 29 (90.6%) 99 (76.2%)Adverse event 0 0 1 (3.0%) 1 (1.0%) 0 1 (0.8%)Withdrawal by subject 1 (3.0%) 0 1 (3.0%) 2 (2.0%) 0 2 (1.5%)Other 11 (33.3%) 7 (21.9%) 6 (18.2%) 24 (24.5%) 3 (9.4%) 27 (20.8%)Not applicable‡ 0 0 1 (3.0%) 1 (1.0%) 0 1 (0.8%)
Hemoglobin is less than 8.0 g/dL§Yes 11 (33.3%) 7 (21.9%) 6 (18.8%) 24 (24.7%) 3 (9.4%) 27 (20.9%)
† Only the primary reason for discontinuation was collected‡ Subjects who discontinued after randomization before first dose of study treatment were included§ Defined per protocol as discontinuation criteriaSource: Table 12.1.1.3.3.1

Roxadustat (ASP1517) 1517-CL-0304Renal anemiaCONFIDENTIAL
Aug 2018 Astellas Synopsis Page 8 of 21
Table 4 Study Discontinuation in Titration Period
ASP151750 mgTIW
(N=33)
ASP151770 mgTIW
(N=32)
ASP1517100 mg
TIW(N=33)
PooledASP1517
TIW(N=98)
Darbepoetinalfa 20 μg
QW(N=32)
Total(N=130)
Study discontinuation in titration periodYes 6 (18.2%) 3 (9.4%) 5 (15.2%) 14 (14.3%) 5 (15.6%) 19 (14.6%)No 15 (45.5%) 22 (68.8%) 19 (57.6%) 56 (57.1%) 24 (75.0%) 80 (61.5%)Not applicable‡ 12 (36.4%) 7 (21.9%) 9 (27.3%) 28 (28.6%) 3 (9.4%) 31 (23.8%)
Primary reason for the study discontinuation†Completed 15 (45.5%) 22 (68.8%) 19 (57.6%) 56 (57.1%) 24 (75.0%) 80 (61.5%)Adverse event 1 (3.0%) 2 (6.3%) 2 (6.1%) 5 (5.1%) 0 5 (3.8%)Death 1 (3.0%) 0 0 1 (1.0%) 0 1 (0.8%)Protocol violation 1 (3.0%) 0 0 1 (1.0%) 0 1 (0.8%)Withdrawal by subject 2 (6.1%) 0 2 (6.1%) 4 (4.1%) 0 4 (3.1%)Other 1 (3.0%) 1 (3.1%) 1 (3.0%) 3 (3.1%) 5 (15.6%) 8 (6.2%)Not applicable‡ 12 (36.4%) 7 (21.9%) 9 (27.3%) 28 (28.6%) 3 (9.4%) 31 (23.8%)
Subject need prohibited medication or prohibited therapy§Yes 2 (9.5%) 0 0 2 (2.9%) 1 (3.4%) 3 (3.0%)
Hemoglobin is less than 8.0 g/dL§Yes 1 (4.8%) 1 (4.0%) 0 2 (2.9%) 2 (6.9%) 4 (4.0%)
Subject meet drug withdrawal of increase/decrease of study treatment§Yes 0 0 0 0 1 (3.4%) 1 (1.0%)
† Only the primary reason for discontinuation was collected‡ Subjects who discontinued after randomization before first dose of study treatment or in fixed dose period were included§ Defined per protocol as discontinuation criteriaSource: Table 12.1.1.3.4
Roxadustat (ASP1517) 1517-CL-0304Renal anemiaCONFIDENTIAL
Aug 2018 Astellas Synopsis Page 9 of 21
Table 5 Demographic Characteristics (FAS)
ASP151750 mgTIW
(N=32)
ASP151770 mgTIW
(N=32)
ASP1517100 mg
TIW(N=31)
PooledASP1517
TIW(N=95)
Darbepoetinalfa 20 μg
QW(N=32)
Total(N=127)
SexMale 22 (68.8%) 24 (75.0%) 25 (80.6%) 71 (74.7%) 22 (68.8%) 93 (73.2%)Female 10 (31.3%) 8 (25.0%) 6 (19.4%) 24 (25.3%) 10 (31.3%) 34 (26.8%)
Age (years) [informed consent]n 32 32 31 95 32 127Mean 62.3 62.4 61.7 62.1 60.0 61.6SD 8.7 9.7 9.8 9.3 7.9 9.0Min 40 40 42 40 45 40Median 63.0 65.0 66.0 65.0 61.5 64.0Max 74 74 74 74 72 74
Age group (years) [informed consent]≥20 to <60 10 (31.3%) 6 (18.8%) 13 (41.9%) 29 (30.5%) 12 (37.5%) 41 (32.3%)≥60 to <75 22 (68.8%) 26 (81.3%) 18 (58.1%) 66 (69.5%) 20 (62.5%) 86 (67.7%)
Height (cm) [1st registration]n 32 32 31 95 32 127Mean 163.17 161.48 163.65 162.75 162.67 162.73SD 10.14 8.28 7.43 8.66 7.60 8.38Min 136.7 143.5 146.8 136.7 144.5 136.7Median 165.25 160.60 164.50 164.00 163.65 164.00Max 177.5 182.0 182.0 182.0 175.7 182.0
Weight (before hemodialysis) (kg) [screening]n 32 32 31 95 32 127Mean 61.69 59.31 60.57 60.52 61.29 60.71SD 10.72 7.91 7.82 8.89 10.80 9.37Min 43.4 47.5 46.2 43.4 44.1 43.4Median 60.45 59.15 60.50 60.40 59.65 59.90Max 81.0 80.2 74.2 81.0 82.5 82.5
Weight group (before hemodialysis) (kg) [screening]<60 16 (50.0%) 17 (53.1%) 14 (45.2%) 47 (49.5%) 17 (53.1%) 64 (50.4%)≥60 16 (50.0%) 15 (46.9%) 17 (54.8%) 48 (50.5%) 15 (46.9%) 63 (49.6%)
Weight (after hemodialysis) (kg) [screening]n 32 32 31 95 32 127Mean 58.97 56.66 58.32 57.98 58.58 58.13SD 10.42 7.76 7.60 8.66 10.22 9.04Min 41.7 45.6 45.6 41.7 41.9 41.7Median 57.40 56.30 58.60 57.30 57.20 57.30Max 77.3 77.0 71.2 77.3 79.2 79.2
Weight group (after hemodialysis) (kg) [screening]≥40 to <60 19 (59.4%) 22 (68.8%) 17 (54.8%) 58 (61.1%) 18 (56.3%) 76 (59.8%)≥60 to <80 13 (40.6%) 10 (31.3%) 14 (45.2%) 37 (38.9%) 14 (43.8%) 51 (40.2%)
Weight (after hemodialysis) (kg) [Week 0]n 32 32 31 95 32 127Mean 59.10 56.78 58.34 58.07 58.99 58.30SD 10.47 7.75 7.66 8.70 10.99 9.29Min 41.5 46.0 45.5 41.5 41.9 41.5Median 57.10 56.95 58.70 57.50 57.45 57.50Max 76.8 76.5 70.6 76.8 84.5 84.5
Weight group (after hemodialysis) (kg) [Week 0]<60 19 (59.4%) 22 (68.8%) 17 (54.8%) 58 (61.1%) 18 (56.3%) 76 (59.8%)≥60 13 (40.6%) 10 (31.3%) 14 (45.2%) 37 (38.9%) 14 (43.8%) 51 (40.2%)
Table continued on next page

Roxadustat (ASP1517) 1517-CL-0304Renal anemiaCONFIDENTIAL
Aug 2018 Astellas Synopsis Page 10 of 21
ASP151750 mgTIW
(N=32)
ASP151770 mgTIW
(N=32)
ASP1517100 mg
TIW(N=31)
PooledASP1517
TIW(N=95)
Darbepoetinalfa 20 μg
QW(N=32)
Total(N=127)
BMI (after hemodialysis) (kg/m2) [1st registration]n 32 32 31 95 32 127Mean 22.09 21.70 21.81 21.87 22.12 21.93SD 2.85 2.34 2.82 2.66 3.44 2.86Min 17.2 18.0 16.4 16.4 16.7 16.4Median 22.31 21.50 21.26 21.44 21.66 21.62Max 27.3 27.4 27.4 27.4 30.6 30.6
Primary cause of chronic kidney disease [1st Registration]Chronic glomerular nephritis 17 (53.1%) 17 (53.1%) 10 (32.3%) 44 (46.3%) 13 (40.6%) 57 (44.9%)Diabetic nephropathy 8 (25.0%) 9 (28.1%) 9 (29.0%) 26 (27.4%) 9 (28.1%) 35 (27.6%)Chronic pyelonephritis 0 0 0 0 0 0Polycystic kidney 1 (3.1%) 1 (3.1%) 3 (9.7%) 5 (5.3%) 2 (6.3%) 7 (5.5%)Nephrosclerosis 4 (12.5%) 4 (12.5%) 6 (19.4%) 14 (14.7%) 3 (9.4%) 17 (13.4%)Other 2 (6.3%) 1 (3.1%) 3 (9.7%) 6 (6.3%) 5 (15.6%) 11 (8.7%)
Duration of chronic kidney disease with anemia (months) [1st registration]n 28 28 28 84 27 111Mean 98.75 78.61 90.18 89.18 124.70 97.82SD 82.29 60.98 73.22 72.29 78.29 75.00Min 9.0 12.0 3.0 3.0 8.0 3.0Median 74.50 66.50 65.00 68.50 114.00 76.00Max 281.0 216.0 301.0 301.0 276.0 301.0
Duration of chronic kidney disease with anemia group (months) [1st registration]<6 0 0 1 (3.2%) 1 (1.1%) 0 1 (0.8%)≥6 to <12 2 (6.3%) 0 0 2 (2.1%) 1 (3.1%) 3 (2.4%)≥12 to <36 8 (25.0%) 9 (28.1%) 6 (19.4%) 23 (24.2%) 3 (9.4%) 26 (20.5%)≥36 to <60 2 (6.3%) 3 (9.4%) 6 (19.4%) 11 (11.6%) 3 (9.4%) 14 (11.0%)≥60 to <120 6 (18.8%) 11 (34.4%) 9 (29.0%) 26 (27.4%) 8 (25.0%) 34 (26.8%)≥120 to <240 8 (25.0%) 5 (15.6%) 5 (16.1%) 18 (18.9%) 8 (25.0%) 26 (20.5%)≥240 2 (6.3%) 0 1 (3.2%) 3 (3.2%) 4 (12.5%) 7 (5.5%)Unknown 4 (12.5%) 4 (12.5%) 3 (9.7%) 11 (11.6%) 5 (15.6%) 16 (12.6%)
Duration of chronic kidney disease (months) [1st registration]n 31 31 29 91 29 120Mean 179.55 159.55 169.38 169.49 186.24 173.54SD 141.12 123.57 114.06 125.87 120.42 124.29Min 25.0 14.0 23.0 14.0 15.0 14.0Median 123.00 113.00 144.00 120.00 154.00 121.50Max 528.0 456.0 480.0 528.0 437.0 528.0
Duration of chronic kidney disease group (months) [1st registration]<6 0 0 0 0 0 0≥6 to <12 0 0 0 0 0 0≥12 to <36 4 (12.5%) 2 (6.3%) 2 (6.5%) 8 (8.4%) 2 (6.3%) 10 (7.9%)≥36 to <60 3 (9.4%) 5 (15.6%) 2 (6.5%) 10 (10.5%) 2 (6.3%) 12 (9.4%)≥60 to <120 7 (21.9%) 11 (34.4%) 9 (29.0%) 27 (28.4%) 9 (28.1%) 36 (28.3%)≥120 to <240 7 (21.9%) 5 (15.6%) 8 (25.8%) 20 (21.1%) 5 (15.6%) 25 (19.7%)≥240 10 (31.3%) 8 (25.0%) 8 (25.8%) 26 (27.4%) 11 (34.4%) 37 (29.1%)Unknown 1 (3.1%) 1 (3.1%) 2 (6.5%) 4 (4.2%) 3 (9.4%) 7 (5.5%)
Duration of hemodialysis (months) [1st registration]n 32 32 31 95 32 127Mean 83.47 76.41 88.16 82.62 133.41 95.42SD 71.95 61.01 80.02 70.72 108.50 84.37Min 5.0 8.0 4.0 4.0 12.0 4.0Median 62.50 53.50 67.00 62.00 113.00 71.00Max 282.0 221.0 304.0 304.0 424.0 424.0
Table continued on next page

Roxadustat (ASP1517) 1517-CL-0304Renal anemiaCONFIDENTIAL
Aug 2018 Astellas Synopsis Page 11 of 21
ASP151750 mgTIW
(N=32)
ASP151770 mgTIW
(N=32)
ASP1517100 mg
TIW(N=31)
PooledASP1517
TIW(N=95)
Darbepoetinalfa 20 μg
QW(N=32)
Total(N=127)
Duration of hemodialysis group (months) [1st registration]<6 1 (3.1%) 0 1 (3.2%) 2 (2.1%) 0 2 (1.6%)≥6 to <12 3 (9.4%) 2 (6.3%) 4 (12.9%) 9 (9.5%) 0 9 (7.1%)≥12 to <36 7 (21.9%) 8 (25.0%) 7 (22.6%) 22 (23.2%) 4 (12.5%) 26 (20.5%)≥36 to <60 3 (9.4%) 7 (21.9%) 1 (3.2%) 11 (11.6%) 6 (18.8%) 17 (13.4%)≥60 to <120 10 (31.3%) 9 (28.1%) 9 (29.0%) 28 (29.5%) 9 (28.1%) 37 (29.1%)≥120 to <240 7 (21.9%) 6 (18.8%) 8 (25.8%) 21 (22.1%) 8 (25.0%) 29 (22.8%)≥240 1 (3.1%) 0 1 (3.2%) 2 (2.1%) 5 (15.6%) 7 (5.5%)Unknown 0 0 0 0 0 0
Prior iron therapy (oral) useYes 0 2 (6.3%) 2 (6.5%) 4 (4.2%) 1 (3.1%) 5 (3.9%)No 32 (100.0%) 30 (93.8%) 29 (93.5%) 91 (95.8%) 31 (96.9%) 122 (96.1%)
Prior iron therapy (intravenous) useYes 9 (28.1%) 7 (21.9%) 5 (16.1%) 21 (22.1%) 10 (31.3%) 31 (24.4%)No 23 (71.9%) 25 (78.1%) 26 (83.9%) 74 (77.9%) 22 (68.8%) 96 (75.6%)
Concomitant iron therapy (oral) useYes 4 (12.5%) 4 (12.5%) 3 (9.7%) 11 (11.6%) 7 (21.9%) 18 (14.2%)No 28 (87.5%) 28 (87.5%) 28 (90.3%) 84 (88.4%) 25 (78.1%) 109 (85.8%)
Concomitant iron therapy (intravenous) useYes 2 (6.3%) 2 (6.3%) 3 (9.7%) 7 (7.4%) 0 7 (5.5%)No 30 (93.8%) 30 (93.8%) 28 (90.3%) 88 (92.6%) 32 (100.0%) 120 (94.5%)
Prior statin useYes 5 (15.6%) 6 (18.8%) 6 (19.4%) 17 (17.9%) 5 (15.6%) 22 (17.3%)No 27 (84.4%) 26 (81.3%) 25 (80.6%) 78 (82.1%) 27 (84.4%) 105 (82.7%)
Concomitant statin useYes 5 (15.6%) 6 (18.8%) 6 (19.4%) 17 (17.9%) 5 (15.6%) 22 (17.3%)No 27 (84.4%) 26 (81.3%) 25 (80.6%) 78 (82.1%) 27 (84.4%) 105 (82.7%)
Prior phosphate binder useYes 27 (84.4%) 25 (78.1%) 29 (93.5%) 81 (85.3%) 28 (87.5%) 109 (85.8%)No 5 (15.6%) 7 (21.9%) 2 (6.5%) 14 (14.7%) 4 (12.5%) 18 (14.2%)
Concomitant phosphate binder useYes 27 (84.4%) 25 (78.1%) 29 (93.5%) 81 (85.3%) 28 (87.5%) 109 (85.8%)No 5 (15.6%) 7 (21.9%) 2 (6.5%) 14 (14.7%) 4 (12.5%) 18 (14.2%)
Concomitant phosphate binder use in fixed periodYes 27 (84.4%) 25 (78.1%) 29 (93.5%) 81 (85.3%) 28 (87.5%) 109 (85.8%)No 5 (15.6%) 7 (21.9%) 2 (6.5%) 14 (14.7%) 4 (12.5%) 18 (14.2%)
Washout period (weeks)n 32 32 31 95 32 127Mean 6.30 6.25 6.06 6.21 6.21 6.21SD 1.77 1.40 1.79 1.65 1.59 1.63Min 2.1 3.1 3.1 2.1 3.1 2.1Median 6.36 6.50 6.14 6.29 6.29 6.29Max 9.1 9.1 9.1 9.1 9.1 9.1
Washout period (weeks)≤5 8 (25.0%) 6 (18.8%) 7 (22.6%) 21 (22.1%) 6 (18.8%) 27 (21.3%)>5 24 (75.0%) 26 (81.3%) 24 (77.4%) 74 (77.9%) 26 (81.3%) 100 (78.7%)
Source: Table 12.1.2.1.2
Roxadustat (ASP1517) 1517-CL-0304Renal anemiaCONFIDENTIAL
Aug 2018 Astellas Synopsis Page 12 of 21
Table 6 Baseline Values of Efficacy Variables (FAS)
ASP151750 mgTIW
(N=32)
ASP151770 mgTIW
(N=32)
ASP1517100 mg
TIW(N=31)
PooledASP1517
TIW(N=95)
Darbepoetinalfa 20 μg
QW(N=32)
Total(N=127)
Hemoglobin (g/dL)n 32 32 30 94 32 126Mean 8.92 8.79 8.80 8.84 8.80 8.83SD 0.38 0.42 0.60 0.47 0.51 0.48Min 7.9 8.0 7.3 7.3 7.8 7.3Median 9.00 8.90 8.95 8.90 8.85 8.90Max 9.4 9.4 10.0 10.0 9.8 10.0
Hemoglobin group (g/dL)<9.0 15 (46.9%) 18 (56.3%) 15 (50.0%) 48 (51.1%) 18 (56.3%) 66 (52.4%)≥9.0 17 (53.1%) 14 (43.8%) 15 (50.0%) 46 (48.9%) 14 (43.8%) 60 (47.6%)
Hematocrit (fraction)n 32 31 29 92 32 124Mean 0.263 0.262 0.257 0.261 0.263 0.261SD 0.015 0.017 0.021 0.018 0.017 0.018Min 0.23 0.24 0.22 0.22 0.23 0.22Median 0.270 0.260 0.260 0.260 0.260 0.260Max 0.29 0.29 0.29 0.29 0.30 0.30
Reticulocytes/erythrocytes (fraction)n 32 31 29 92 32 124Mean 0.0073 0.0078 0.0080 0.0077 0.0090 0.0080SD 0.0032 0.0045 0.0043 0.0040 0.0048 0.0042Min 0.003 0.002 0.002 0.002 0.002 0.002Median 0.0065 0.0080 0.0070 0.0070 0.0080 0.0070Max 0.015 0.021 0.021 0.021 0.022 0.022
Iron (μmol/L)n 32 32 30 94 32 126Mean 16.5 18.5 16.9 17.3 15.3 16.8SD 5.3 7.6 5.9 6.4 6.4 6.4Min 9 9 10 9 4 4Median 15.5 16.5 15.0 16.0 14.5 15.0Max 30 47 36 47 36 47
Ferritin (μg/L)n 32 32 30 94 32 126Mean 191.52 186.70 192.52 190.20 156.99 181.77SD 209.26 220.10 119.74 187.67 102.49 170.35Min 20.3 23.7 21.8 20.3 17.8 17.8Median 160.50 136.00 153.00 142.50 122.50 137.50Max 1230.0 1270.0 432.0 1270.0 491.0 1270.0
Transferrin (g/L)n 32 32 30 94 32 126Mean 1.701 1.774 1.651 1.710 1.780 1.728SD 0.270 0.391 0.250 0.312 0.277 0.304Min 1.02 1.07 1.18 1.02 1.19 1.02Median 1.685 1.645 1.625 1.645 1.765 1.690Max 2.42 2.74 2.35 2.74 2.28 2.74
Total iron binding capacity (μmol/L)n 32 32 30 94 32 126Mean 40.3 41.9 39.2 40.5 42.0 40.9SD 5.1 8.3 4.8 6.3 5.9 6.2Min 27 26 29 26 28 26Median 40.0 40.0 39.0 40.0 42.0 40.0Max 56 63 52 63 52 63
Table continued on next page

Roxadustat (ASP1517) 1517-CL-0304Renal anemiaCONFIDENTIAL
Aug 2018 Astellas Synopsis Page 13 of 21
ASP151750 mgTIW
(N=32)
ASP151770 mgTIW
(N=32)
ASP1517100 mg
TIW(N=31)
PooledASP1517
TIW(N=95)
Darbepoetinalfa 20 μg
QW(N=32)
Total(N=127)
Soluble transferrin receptor (nmol/L)n 32 32 30 94 32 126Mean 9.163 9.066 10.363 9.513 12.006 10.146SD 3.916 4.232 5.025 4.393 5.886 4.913Min 4.50 5.30 5.00 4.50 5.10 4.50Median 8.650 8.800 9.150 8.800 10.100 9.000Max 23.20 30.30 24.90 30.30 31.10 31.10
Transferrin saturation (%)n 32 32 30 94 32 126Mean 42.37 44.76 43.87 43.66 37.26 42.04SD 16.78 15.85 15.79 16.01 16.06 16.20Min 17.5 17.6 25.9 17.5 9.1 9.1Median 39.80 42.30 40.10 41.30 33.15 39.40Max 86.2 89.9 86.7 89.9 76.0 89.9
Hemoglobin in reticulocytes (pg)n 32 31 29 92 32 124Mean 35.78 35.68 35.77 35.74 36.33 35.89SD 1.56 1.94 2.12 1.86 2.18 1.95Min 32.4 32.0 29.5 29.5 32.4 29.5Median 35.65 35.90 35.50 35.65 36.40 35.90Max 39.1 39.0 39.9 39.9 41.5 41.5
Erythropoietin (IU/L)n 32 32 30 94 32 126Mean 5.591 4.525 5.373 5.159 5.803 5.322SD 3.082 2.419 3.030 2.863 3.289 2.977Min 1.90 1.80 2.70 1.80 1.40 1.40Median 5.200 3.800 3.950 4.200 4.900 4.350Max 17.70 14.40 13.10 17.70 13.30 17.70
SF-36 Physical Functioning subscoren 32 32 31 95 32 127Mean 73.91 81.88 84.68 80.11 75.94 79.06SD 25.07 18.48 15.33 20.39 18.90 20.04Min 15.0 35.0 45.0 15.0 40.0 15.0Median 85.00 90.00 90.00 90.00 80.00 85.00Max 100.0 100.0 100.0 100.0 100.0 100.0
SF-36 Vitality subscoren 32 32 31 95 32 127Mean 59.18 63.87 68.55 63.82 61.33 63.19SD 21.30 18.77 16.26 19.10 23.57 20.25Min 12.5 25.0 37.5 12.5 6.3 6.3Median 65.63 62.50 75.00 68.75 62.50 62.50Max 87.5 100.0 100.0 100.0 100.0 100.0
SF-36 Physical Component scoren 32 32 31 95 32 127Mean 38.59 45.23 45.92 43.22 39.20 42.21SD 19.31 10.49 12.16 14.75 12.05 14.18Min -7.5 21.3 11.2 -7.5 14.2 -7.5Median 47.87 49.52 50.48 49.75 38.18 46.20Max 60.0 57.2 59.8 60.0 58.0 60.0
Table continued on next page

Roxadustat (ASP1517) 1517-CL-0304Renal anemiaCONFIDENTIAL
Aug 2018 Astellas Synopsis Page 14 of 21
ASP151750 mgTIW
(N=32)
ASP151770 mgTIW
(N=32)
ASP1517100 mg
TIW(N=31)
PooledASP1517
TIW(N=95)
Darbepoetinalfa 20 μg
QW(N=32)
Total(N=127)
SF-36 Mental Component scoren 32 32 31 95 32 127Mean 51.37 52.62 53.68 52.54 53.40 52.76SD 7.74 6.43 8.03 7.40 9.15 7.85Min 38.4 39.9 35.3 35.3 31.7 31.7Median 53.12 52.94 55.71 53.45 52.02 53.32Max 64.2 66.2 69.2 69.2 67.2 69.2
Source: Table 12.1.2.2.1
Efficacy Results: For the primary variable, rate of rise in Hb from baseline to the final assessment in the fixed
dose period, a statistically significant dose-response relationship was observed in all 3 types of contrast test for
ASP1517 (“Linear”, “Initial rise at 100 mg” and “Plateau at 70 mg”) in the FAS [Table 7].
In subsequent sensitivity analyses in the PPS, the point estimates of rate of rise in Hb were higher than those in
the FAS [Table 8].
With regard to Hb rate of rise, negative mean values of slope were observed in the ASP1517 50 mg and 70 mg
groups in the FAS but not for the medians. By contrast, all the ASP1517 groups in the PPS (50 mg, 70 mg and
100 mg) showed positive mean and median values of slope.
There was more variability in Hb rate of rise observed within the ASP1517 groups compared with the
darbepoetin alfa group in the FAS.
It is considered that early withdrawals due to low Hb values in the early fixed-treatment period may explain the
discrepancy between the FAS and PPS.
In subgroup analyses, the rate of rise in Hb during the fixed dose period was higher in patients with low dose of
ESA treatment before washout compared with patients with high dose of ESA treatment before washout in the
FAS. In the PPS, the rate of rise in Hb during the fixed dose period was higher in patients with weight of ≥ 40
to < 60 kg compared with patients with weight of ≥ 60 to < 80 kg at Week 0 after hemodialysis. The rate of rise
in Hb during the fixed dose period was higher in patients without concomitant phosphate binder use compared
with patients with concomitant phosphate binder use in the ASP1517 groups.
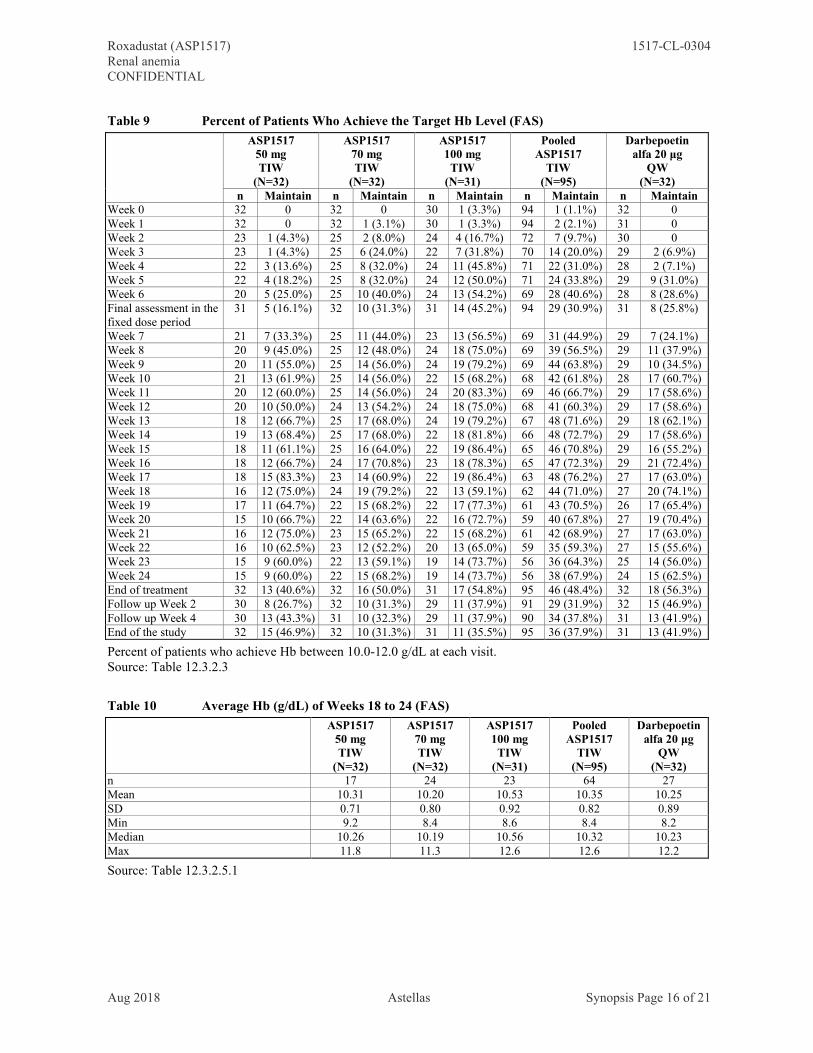
For the secondary variables, the rate of patients who achieved the target Hb level (10.0 to 12.0 g/dL) in the
darbepoetin alfa group was generally lower compared with the pooled ASP1517 group during the study
[Table 9]. The mean time to first achieving the lower limit of the target Hb level in the FAS decreased with
dose of ASP1517.
For the average Hb of Weeks 18 to 24 in the FAS, the results of all treatment groups appeared to be similar
[Table 10].
For the Hb change from baseline to the average Hb of Weeks 18 to 24 in the FAS, the results of all
randomization arms appeared to be similar [Table 11].

Roxadustat (ASP1517) 1517-CL-0304Renal anemiaCONFIDENTIAL
Aug 2018 Astellas Synopsis Page 15 of 21
Table 7 Summary of Rate of Rise in Hb and Result of Contrast Test in Fixed Dose Period (FAS)
ASP151750 mgTIW
(N=32)
ASP151770 mgTIW
(N=32)
ASP1517100 mg
TIW(N=31)
PooledASP1517
TIW(N=95)
Darbepoetinalfa 20 μg
QW(N=32)
Slope of the Hb change from baseline (g/dL/week)†n 32 32 30 94 32Mean -0.219 -0.046 0.112 -0.054 0.112SD 0.585 0.581 0.513 0.572 0.174Min -1.70 -2.20 -1.40 -2.20 -0.40Median 0.020 0.096 0.205 0.105 0.123Max 0.34 0.52 1.05 1.05 0.41
Type of dose-response relationship (contrast coefficient)‡
P-value§
Linear: C1 = (−1, 0, 1) <0.001Initial rise at 100 mg: C2 = (−1, −1, 2) <0.001Plateau at 70 mg: C3 = (−2, 1, 1) <0.001
† Subject who had no data for baseline Hb value was excluded from this analysis.By applying a linear regression line for each subject using all Hb data collected during the period from baselineto the final assessment in the fixed dose period (Week 6, time of discontinuation, or time of dose adjustment), the rate of rise in Hb (change in Hb per week [g/dL/week]) was calculated as the slope of the line.‡ Subject who had no data for baseline Hb value or ESA dose before ESA washout was excluded from this analysis.Model: Slope = Group + Baseline Hb + ESA dose before ESA washout§ Multiplicity adjusted p-value based on the bootstrap re-sampling method.Source: Table 12.3.1.2.1, Table 12.3.1.3.1
Table 8 Summary of Rate of Rise in Hb and Result of Contrast Test in Fixed Dose Period (PPS)
ASP151750 mgTIW
(N=19)
ASP151770 mgTIW
(N=24)
ASP1517100 mg
TIW(N=21)
PooledASP1517
TIW(N=64)
Darbepoetinalfa 20 μg
QW(N=22)
Slope of the Hb change from baseline (g/dL/week)†n 19 24 21 64 22Mean 0.099 0.211 0.280 0.200 0.132SD 0.155 0.169 0.235 0.200 0.136Min -0.23 -0.05 -0.12 -0.23 -0.05Median 0.114 0.164 0.271 0.180 0.116Max 0.34 0.52 0.77 0.77 0.41
Type of dose-response relationship (contrast coefficient)‡
P-value§
Linear: C1 = (−1, 0, 1) <0.001Initial rise at 100 mg: C2 = (−1, −1, 2) <0.001Plateau at 70 mg: C3 = (−2, 1, 1) <0.001
† Subject who had no data for baseline Hb value was excluded from this analysis.By applying a linear regression line for each subject using all Hb data collected during the period from baselineto the final assessment in the fixed dose period (Week 6, time of discontinuation, or time of dose adjustment), the rate of rise in Hb (change in Hb per week [g/dL/week]) was calculated as the slope of the line.‡ Subject who had no data for baseline Hb value or ESA dose before ESA washout was excluded from this analysis.Model: Slope = Group + Baseline Hb + ESA dose before ESA washout§ Multiplicity adjusted p-value based on the bootstrap re-sampling method.Source: Table 12.3.1.2.2, Table 12.3.1.3.2
Roxadustat (ASP1517) 1517-CL-0304Renal anemiaCONFIDENTIAL
Aug 2018 Astellas Synopsis Page 16 of 21
Table 9 Percent of Patients Who Achieve the Target Hb Level (FAS)
ASP151750 mgTIW
(N=32)
ASP151770 mgTIW
(N=32)
ASP1517100 mg
TIW(N=31)
PooledASP1517
TIW(N=95)
Darbepoetinalfa 20 μg
QW(N=32)
n Maintain n Maintain n Maintain n Maintain n MaintainWeek 0 32 0 32 0 30 1 (3.3%) 94 1 (1.1%) 32 0Week 1 32 0 32 1 (3.1%) 30 1 (3.3%) 94 2 (2.1%) 31 0Week 2 23 1 (4.3%) 25 2 (8.0%) 24 4 (16.7%) 72 7 (9.7%) 30 0Week 3 23 1 (4.3%) 25 6 (24.0%) 22 7 (31.8%) 70 14 (20.0%) 29 2 (6.9%)Week 4 22 3 (13.6%) 25 8 (32.0%) 24 11 (45.8%) 71 22 (31.0%) 28 2 (7.1%)Week 5 22 4 (18.2%) 25 8 (32.0%) 24 12 (50.0%) 71 24 (33.8%) 29 9 (31.0%)Week 6 20 5 (25.0%) 25 10 (40.0%) 24 13 (54.2%) 69 28 (40.6%) 28 8 (28.6%)Final assessment in the fixed dose period
31 5 (16.1%) 32 10 (31.3%) 31 14 (45.2%) 94 29 (30.9%) 31 8 (25.8%)
Week 7 21 7 (33.3%) 25 11 (44.0%) 23 13 (56.5%) 69 31 (44.9%) 29 7 (24.1%)Week 8 20 9 (45.0%) 25 12 (48.0%) 24 18 (75.0%) 69 39 (56.5%) 29 11 (37.9%)Week 9 20 11 (55.0%) 25 14 (56.0%) 24 19 (79.2%) 69 44 (63.8%) 29 10 (34.5%)Week 10 21 13 (61.9%) 25 14 (56.0%) 22 15 (68.2%) 68 42 (61.8%) 28 17 (60.7%)Week 11 20 12 (60.0%) 25 14 (56.0%) 24 20 (83.3%) 69 46 (66.7%) 29 17 (58.6%)Week 12 20 10 (50.0%) 24 13 (54.2%) 24 18 (75.0%) 68 41 (60.3%) 29 17 (58.6%)Week 13 18 12 (66.7%) 25 17 (68.0%) 24 19 (79.2%) 67 48 (71.6%) 29 18 (62.1%)Week 14 19 13 (68.4%) 25 17 (68.0%) 22 18 (81.8%) 66 48 (72.7%) 29 17 (58.6%)Week 15 18 11 (61.1%) 25 16 (64.0%) 22 19 (86.4%) 65 46 (70.8%) 29 16 (55.2%)Week 16 18 12 (66.7%) 24 17 (70.8%) 23 18 (78.3%) 65 47 (72.3%) 29 21 (72.4%)Week 17 18 15 (83.3%) 23 14 (60.9%) 22 19 (86.4%) 63 48 (76.2%) 27 17 (63.0%)Week 18 16 12 (75.0%) 24 19 (79.2%) 22 13 (59.1%) 62 44 (71.0%) 27 20 (74.1%)Week 19 17 11 (64.7%) 22 15 (68.2%) 22 17 (77.3%) 61 43 (70.5%) 26 17 (65.4%)Week 20 15 10 (66.7%) 22 14 (63.6%) 22 16 (72.7%) 59 40 (67.8%) 27 19 (70.4%)Week 21 16 12 (75.0%) 23 15 (65.2%) 22 15 (68.2%) 61 42 (68.9%) 27 17 (63.0%)Week 22 16 10 (62.5%) 23 12 (52.2%) 20 13 (65.0%) 59 35 (59.3%) 27 15 (55.6%)Week 23 15 9 (60.0%) 22 13 (59.1%) 19 14 (73.7%) 56 36 (64.3%) 25 14 (56.0%)Week 24 15 9 (60.0%) 22 15 (68.2%) 19 14 (73.7%) 56 38 (67.9%) 24 15 (62.5%)End of treatment 32 13 (40.6%) 32 16 (50.0%) 31 17 (54.8%) 95 46 (48.4%) 32 18 (56.3%)Follow up Week 2 30 8 (26.7%) 32 10 (31.3%) 29 11 (37.9%) 91 29 (31.9%) 32 15 (46.9%)Follow up Week 4 30 13 (43.3%) 31 10 (32.3%) 29 11 (37.9%) 90 34 (37.8%) 31 13 (41.9%)End of the study 32 15 (46.9%) 32 10 (31.3%) 31 11 (35.5%) 95 36 (37.9%) 31 13 (41.9%)
Percent of patients who achieve Hb between 10.0-12.0 g/dL at each visit.Source: Table 12.3.2.3
Table 10 Average Hb (g/dL) of Weeks 18 to 24 (FAS)
ASP151750 mgTIW
(N=32)
ASP151770 mgTIW
(N=32)
ASP1517100 mg
TIW(N=31)
PooledASP1517
TIW(N=95)
Darbepoetinalfa 20 μg
QW(N=32)
n 17 24 23 64 27Mean 10.31 10.20 10.53 10.35 10.25SD 0.71 0.80 0.92 0.82 0.89Min 9.2 8.4 8.6 8.4 8.2Median 10.26 10.19 10.56 10.32 10.23Max 11.8 11.3 12.6 12.6 12.2
Source: Table 12.3.2.5.1

Roxadustat (ASP1517) 1517-CL-0304Renal anemiaCONFIDENTIAL
Aug 2018 Astellas Synopsis Page 17 of 21
Table 11 Hb (g/dL) Change From Baseline to Average Hb of Weeks 18 to 24 (FAS)
ASP151750 mgTIW
(N=32)
ASP151770 mgTIW
(N=32)
ASP1517100 mg
TIW(N=31)
PooledASP1517
TIW(N=95)
Darbepoetinalfa 20 μg
QW(N=32)
n 17 24 22 63 27Mean 1.33 1.37 1.57 1.43 1.42SD 0.81 0.93 0.98 0.91 1.02Min -0.2 -0.7 -0.5 -0.7 -0.7Median 1.30 1.51 1.51 1.46 1.50Max 2.9 2.9 3.5 3.5 2.9
Source: Table 12.3.2.5.2
Figure 1 Mean-Standard Deviation Plot of Hemoglobin (FAS)
SC: screening, FU2: follow up Week 2, FU4: follow up Week 4, EOF: final assessment in the fixed dose period, EOT: end of treatment, EOS: end of studySource: Figure 12.3.1.3.1
Pharmacokinetic Results: The mean plasma concentration of ASP1517 at Week 6 (end of the fixed dose
period) was 249.523, 469.285 and 567.443 ng/mL in the ASP1517 50 mg, 70 mg and 100 mg groups,
respectively [Table 12]. The mean plasma concentration of ASP1517 at Week 6 (end of the fixed dose period)
was lower in the patients who were concomitantly treated with phosphate binder in all ASP1517 groups.
Table 12 Plasma Concentration (ng/mL) of ASP1517 at Week 6
ASP1517 50 mg TIW ASP1517 70 mg TIW ASP1517 100 mg TIWAll P-binder + P-binder − All P-binder + P-binder − All P-binder + P-binder −
Week 6n 21 18 3 25 19 6 24 22 2Mean 249.523 244.734 278.257 469.285 447.733 537.533 567.443 535.081 923.425SD 243.047 257.017 166.685 486.911 518.527 403.371 530.485 529.415 556.924
Source: Table 12.4.1.1, Table 12.4.1.2, Table 12.4.1.3
Safety Results: The proportion of patients experiencing TEAEs was similar among all treatment groups
[Table 13].

Roxadustat (ASP1517) 1517-CL-0304Renal anemiaCONFIDENTIAL
Aug 2018 Astellas Synopsis Page 18 of 21
The proportion of patients experiencing drug-related TEAEs and serious TEAEs in the ASP1517 groups was
higher than that in the darbepoetin alfa group.
The common (incidence > 5%) TEAEs in the pooled ASP1517 group included nasopharyngitis, vomiting,
nausea, retinal haemorrhage†
constipation, and diarrhoea [Table 14].
The common (incidence > 5%) TEAEs in the darbepoetin alfa group included nasopharyngitis, procedural
hypotension, hyperparathyroidism secondary, constipation, diarrhoea, vomiting, excoriation, and back pain.
The common (incidence > 1%) drug-related TEAEs included vomiting, nausea, retinal haemorrhage†,
hypertension and blood pressure increased in the pooled ASP1517 group and macular fibrosis and hypertension
in the darbepoetin alfa group.
One patient in the ASP1517 50 mg group died of embolism venous and the event was considered unrelated to
the study treatment. Other than this patient, the outcome of patients with serious TEAEs was reported as
recovered or recovering.
Drug-related TEAEs leading to discontinuation of study treatment were reported in 2 (6.3%) patients each in the
ASP1517 70 mg and 100 mg groups.
A potential drug-induced liver injury case was reported in 1 patient, which was considered unrelated to the
study treatment because both AST and ALT remained within normal ranges during the study treatment and the
event occurred approximately 2 weeks after discontinuation of the study treatment. No notable safety concerns
were reported in other clinical laboratory evaluations, vital signs, ECGs or other safety-related observations.
Due to an apparent imbalance between the occurrences of retinal hemorrhage†
events reported as adverse events
[Table 13], it was decided to conduct a descriptive aggregate analysis of the same ophthalmological images
following centralized and masked grading by experienced graders. When interpreting treatment outcomes, one
needs to consider that the ASP1517 and darbepoetin treatment groups were generally well balanced in terms of
factors related to the efficacy of ASP1517 at baseline. Differences between groups were present in terms of
factors that predicted new retinal pathology including longer dialysis vintage duration and a higher number of
subjects with a status of laser therapy prior to treatment in the darbepoetin treated patients. At screening retinal
hemorrhages were seen in 15.5% of the study population prior to any study intervention in the analysis. During
treatment, a total of 9 (10.1%) patients in the pooled ASP1517 group and 2 (6.5%) patients in the darbepoetin
group displayed new or worsening retinal hemorrhage. For the group of patients without hemorrhages at
baseline, the incidence of new or worsening retinal hemorrhages after the start of treatment was comparable
between pooled ASP1517 and darbepoetin treatment groups, 8.0% vs 7.1%, respectively. When new or
worsening retinal hemorrhage assessments were presented by baseline status, low patient numbers in the group
with retinal hemorrhages at baseline made it difficult to interpret the data but the incidence prior to and during
treatment appeared similar. No change in retinal thickness was observed over the course of the study in the
ASP1517 and darbepoetin alfa treatment groups.
† Investigators’ subjective decision making whether to report as an adverse event based upon general protocol instructions for reporting adverse events.

Roxadustat (ASP1517) 1517-CL-0304Renal anemiaCONFIDENTIAL
Aug 2018 Astellas Synopsis Page 19 of 21
Table 13 Overview of Treatment-emergent Adverse Events
ASP151750 mgTIW
(N=33)n (%)
ASP151770 mgTIW
(N=32)n (%)
ASP1517100 mg
TIW(N=32)n (%)
PooledASP1517
TIW(N=97)n (%)
Darbepoetinalfa 20 μg
QW(N=32)n (%)
Total(N=129)n (%)
TEAEs 24 (72.7%) 26 (81.3%) 27 (84.4%) 77 (79.4%) 25 (78.1%) 102 (79.1%)Drug-related† TEAEs 8 (24.2%) 7 (21.9%) 12 (37.5%) 27 (27.8%) 2 (6.3%) 29 (22.5%)Deaths 1 (3.0%) 0 0 1 (1.0%) 0 1 (0.8%)Serious TEAEs 4 (12.1%) 7 (21.9%) 4 (12.5%) 15 (15.5%) 2 (6.3%) 17 (13.2%)Drug-related† serious TEAEs 0 2 (6.3%) 1 (3.1%) 3 (3.1%) 0 3 (2.3%)TEAEs leading to discontinuation of study treatment
2 (6.1%) 2 (6.3%) 3 (9.4%) 7 (7.2%) 0 7 (5.4%)
Drug-related† TEAEs leading to discontinuation of study treatment
0 2 (6.3%) 2 (6.3%) 4 (4.1%) 0 4 (3.1%)
† Possible or probable, as assessed by the investigator, or records where relationship is missing.Source: Table 12.6.1.1
Table 14 Common (> 5% in Pooled ASP1517 Group) Treatment-emergent Adverse Events
MedDRA Version 15.1System Organ Class
Preferred Term
ASP151750 mgTIW
(N=33)n (%)
ASP151770 mgTIW
(N=32)n (%)
ASP1517100 mg
TIW(N=32)n (%)
PooledASP1517
TIW(N=97)n (%)
Darbepoetinalfa 20 μg
QW(N=32)n (%)
Total(N=129)n (%)
Overall 24 (72.7%) 26 (81.3%) 27 (84.4%) 77 (79.4%) 25 (78.1%) 102 (79.1%)Eye disorders 3 (9.1%) 2 (6.3%) 8 (25.0%) 13 (13.4%) 4 (12.5%) 17 (13.2%)
Retinal haemorrhage† 2 (6.1%) 2 (6.3%) 5 (15.6%) 9 (9.3%) 0 (0.0%) 9 (7.0%)Gastrointestinal disorders 7 (21.2%) 11 (34.4%) 13 (40.6%) 31 (32.0%) 9 (28.1%) 40 (31.0%)
Constipation 1 (3.0%) 2 (6.3%) 2 (6.3%) 5 (5.2%) 2 (6.3%) 7 (5.4%)Diarrhoea 2 (6.1%) 1 (3.1%) 2 (6.3%) 5 (5.2%) 2 (6.3%) 7 (5.4%)Nausea 3 (9.1%) 2 (6.3%) 4 (12.5%) 9 (9.3%) 1 (3.1%) 10 (7.8%)Vomiting 2 (6.1%) 2 (6.3%) 7 (21.9%) 11 (11.3%) 2 (6.3%) 13 (10.1%)
Infections and infestations 12 (36.4%) 12 (37.5%) 9 (28.1%) 33 (34.0%) 15 (46.9%) 48 (37.2%)Nasopharyngitis 10 (30.3%) 10 (31.3%) 8 (25.0%) 28 (28.9%) 14 (43.8%) 42 (32.6%)
† Investigators’ subjective decision making whether to report as an adverse event based upon general protocol instructions for reporting adverse events.
Source: Table 12.6.1.16

Roxadustat (ASP1517) 1517-CL-0304Renal anemiaCONFIDENTIAL
Aug 2018 Astellas Synopsis Page 20 of 21
Table 15 Serious Treatment-emergent Adverse Events
MedDRA Version 15.1System Organ Class
Preferred Term
ASP151750 mgTIW
(N=33)n (%)
ASP151770 mgTIW
(N=32)n (%)
ASP1517100 mg
TIW(N=32)n (%)
PooledASP1517
TIW(N=97)n (%)
Darbepoetinalfa 20 μg
QW(N=32)n (%)
Total(N=129)n (%)
Overall 4 (12.1%) 7 (21.9%) 4 (12.5%) 15 (15.5%) 2 (6.3%) 17 (13.2%)Cardiac disorders 2 (6.1%) 0 2 (6.3%) 4 (4.1%) 0 4 (3.1%)
Cardiac failure congestive 1 (3.0%) 0 2 (6.3%) 3 (3.1%) 0 3 (2.3%)Myocardial ischaemia 1 (3.0%) 0 0 1 (1.0%) 0 1 (0.8%)
Gastrointestinal disorders 0 1 (3.1%) 1 (3.1%) 2 (2.1%) 1 (3.1%) 3 (2.3%)Gastric ulcer haemorrhage 0 0 0 0 1 (3.1%) 1 (0.8%)Ileus 0 0 1 (3.1%) 1 (1.0%) 0 1 (0.8%)Vomiting 0 1 (3.1%) 0 1 (1.0%) 0 1 (0.8%)
General disorders andadministration site conditions
0 0 1 (3.1%) 1 (1.0%) 0 1 (0.8%)
Gait disturbance 0 0 1 (3.1%) 1 (1.0%) 0 1 (0.8%)Infections and infestations 1 (3.0%) 1 (3.1%) 0 2 (2.1%) 0 2 (1.6%)
Pneumonia bacterial 1 (3.0%) 0 0 1 (1.0%) 0 1 (0.8%)Viral upper respiratory tract infection
0 1 (3.1%) 0 1 (1.0%) 0 1 (0.8%)
Injury, poisoning and procedural complications
1 (3.0%) 0 0 1 (1.0%) 0 1 (0.8%)
Vascular graft occlusion 1 (3.0%) 0 0 1 (1.0%) 0 1 (0.8%)Investigations 1 (3.0%) 1 (3.1%) 0 2 (2.1%) 0 2 (1.6%)
Haemoglobin decreased 1 (3.0%) 0 0 1 (1.0%) 0 1 (0.8%)Liver function test abnormal 0 1 (3.1%) 0 1 (1.0%) 0 1 (0.8%)
Metabolism and nutritiondisorders
0 0 1 (3.1%) 1 (1.0%) 0 1 (0.8%)
Decreased appetite 0 0 1 (3.1%) 1 (1.0%) 0 1 (0.8%)Nervous system disorders 0 2 (6.3%) 1 (3.1%) 3 (3.1%) 0 3 (2.3%)
Cerebral infarction 0 1 (3.1%) 0 1 (1.0%) 0 1 (0.8%)Dizziness 0 1 (3.1%) 0 1 (1.0%) 0 1 (0.8%)Lacunar infarction 0 0 1 (3.1%) 1 (1.0%) 0 1 (0.8%)
Respiratory, thoracic andmediastinal disorders
0 1 (3.1%) 0 1 (1.0%) 0 1 (0.8%)
Pneumonia aspiration 0 1 (3.1%) 0 1 (1.0%) 0 1 (0.8%)Surgical and medical procedures 0 2 (6.3%) 0 2 (2.1%) 0 2 (1.6%)
Gastric polypectomy 0 1 (3.1%) 0 1 (1.0%) 0 1 (0.8%)Intestinal polypectomy 0 2 (6.3%) 0 2 (2.1%) 0 2 (1.6%)
Vascular disorders 1 (3.0%) 0 0 1 (1.0%) 1 (3.1%) 2 (1.6%)Embolism venous 1 (3.0%) 0 0 1 (1.0%) 0 1 (0.8%)Haematoma 0 0 0 0 1 (3.1%) 1 (0.8%)
Source: Table 12.6.1.7
CONCLUSIONS:
Oral ASP1517 (50, 70 and 100 mg TIW) increased Hb levels in a dose dependent manner in Japanese
hemodialysis-dependent chronic kidney disease patients with anemia who had been withdrawn from ESA
therapy prior to receiving ASP1517. A consequence of the ESA washout study design is that Hb levels were
still falling from baseline when patients received ASP1517 and explains the negative rate of rises in the lower
ASP1517 dose groups. Despite the falling Hb, ASP1517 restored Hb levels comparable with those of the
darbepoetin alfa reference control during the course of the study.
In the present Phase 2 study with Japanese hemodialysis-dependent chronic kidney disease patients with anemia,
the common TEAEs in the ASP1517 groups were reported in the SOC categories of ‘eye disorders’,
‘gastrointestinal disorders’ and ‘infections and infestations’.

Roxadustat (ASP1517) 1517-CL-0304Renal anemiaCONFIDENTIAL
Aug 2018 Astellas Synopsis Page 21 of 21
Regular ophthalmological imaging was performed and corresponding images were collected and centrally
assessed in a masked manner. No aggregate analysis of this data was planned or performed, and these
centralized assessments were performed on a patient-by-patient basis. The outcomes of these assessments were
sent to study sites for the investigators’ subjective decision-making on adverse events, whether to report as an
adverse event or not based upon general protocol instructions for reporting adverse events. Due to an imbalance
in retinal hemorrhage event reporting had been noticed in this study which triggered further analyses involving
a more targeted methodology. Outcomes of these analyses do not suggest a relationship between ASP1517 and
a risk of retinal hemorrhage. More detailed methods and conclusions of aggregate ocular images assessment
and analysis were summarized in the separate report. [1517-CL-0304 Clinical Study Report addendum]
In conclusion, the efficacy data generated in the present Japanese Phase 2 study are consistent with advancing
ASP1517 to Phase 3 development in Japan. ASP1517 was effective and had no major safety concerns in
Japanese hemodialysis-dependent chronic kidney disease patients with anemia.
Date of Report: 06 Aug 2018