The Role of Big Data Analytics in Predicting Power System ...

The Role of Analytics in
Routing, Network Performance and SDN
Cengiz Alaettinoglu

It all started with a Jitter study (2000)
Studied jitter on 3 US and 1 European backbones for several weeksFor 99.99% packets, measured jitter < 1ms
Copyright © 2015 Packet Design 2

However, 0.01% of Jitter was severe
Copyright © 2015 Packet Design 3
10+ seconds packet drops
7 seconds jitter
Severe packet reordering

Theory: Packets being spewed out from
an unwinding routing loop…
Did we really have long routing loops in the network?Did ISIS really take 10+ seconds to converge?So, we analyzed routing along with jitter
Copyright © 2015 Packet Design 4
Test host is
passive peer,
sends no routes
IP
BackboneR
traceroute
every 5s
ISIS
hellos +
tcpdump
traffic
Test Host
packettracefile
sk
gig-
ether
Test Host
R
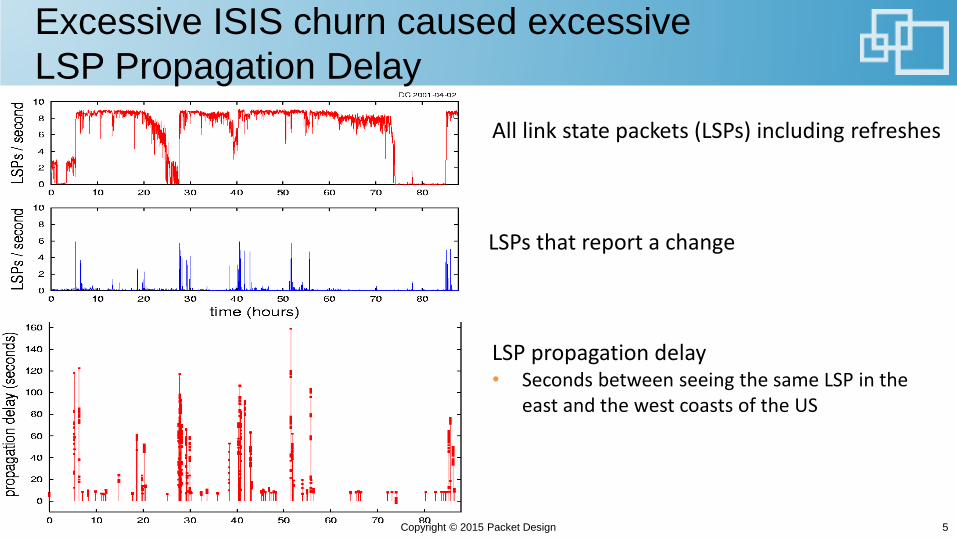
Excessive ISIS churn caused excessive
LSP Propagation Delay
Copyright © 2015 Packet Design 5
All link state packets (LSPs) including refreshes
LSPs that report a change
LSP propagation delay• Seconds between seeing the same LSP in the
east and the west coasts of the US

Explanation
Link state databases were not in sync:• Very large LSP databases• High churn rate caused many LSPs to flood• LSP rate-control slowed down flooding• SPF updates may also have been delayed by rate limits• Any topology change could result in a loop under these conditions
We realized being able to look at routing was key for powerful network performance analysisToday, we see very high churn in very large TE databases using auto-bandwidth with large number of tunnels
Copyright © 2015 Packet Design 6
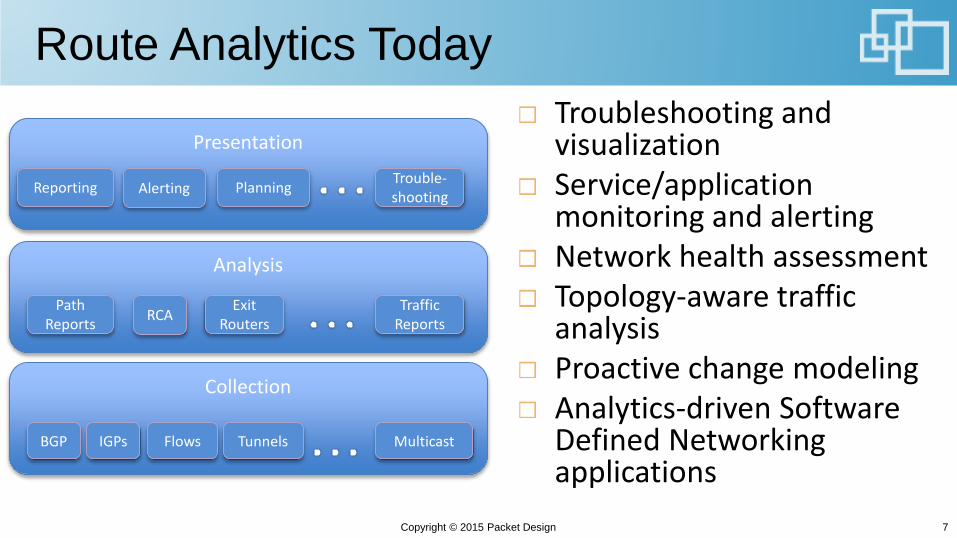
Route Analytics Today
Copyright © 2015 Packet Design 7
Collection
Analysis
Presentation
BGP IGPs Flows Multicast
Path Reports
RCAExit
RoutersTraffic
Reports
Tunnels
Reporting Alerting PlanningTrouble-shooting
Troubleshooting and visualizationService/application monitoring and alertingNetwork health assessmentTopology-aware traffic analysisProactive change modelingAnalytics-driven Software Defined Networking applications

Use Case: Diagnosing Black Holing
A peering router to a major service provider crashed• Hot swappable card was not quite so…
Traffic to the SP was black-holed network-wide• Traffic exiting all 6 locations was black-holed
About 3 minutes of routing outage• 3 minutes was too short to diagnose the issue at human
speed• Had a 45 minute impact on the services and ad revenues
• Users who could not use the service did something else
Copyright © 2015 Packet Design 8

Expected Exit-Points Before Incident
Copyright © 2015 Packet Design 9
6 Exit-Points (circled)Blue routers take the blue exit router…

The Incident
ISIS activity during incident
Copyright © 2015 Packet Design 10
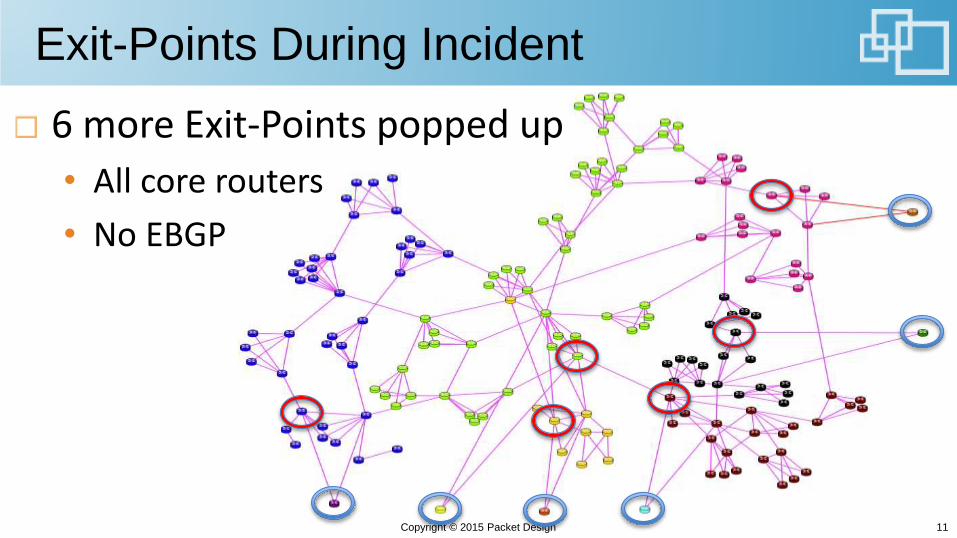
Exit-Points During Incident
Copyright © 2015 Packet Design 11
6 more Exit-Points popped up
• All core routers
• No EBGP

A Path Before and After the Incident
Copyright © 2015 Packet Design 12
Before After
Route Recursion
BGP Next hop resolution: before 128.9.129.1/32 in ISIS vs. after 128.9.128.0/19 in BGP

A Word on Recursive Route Resolution
BGP route for a destination prefix has a next hop attribute, an IP addressNext hop address indicates where to exit the network (egress interface)To get to this egress address, we must find a path to it• We use recursion for that and usually find a path in IGP• Or a series of BGP and IGP routes is also allowed (good use cases exist)• This is what happened here, unfortunately it was not intended, but why?
Copyright © 2015 Packet Design 13
Route Recursion
BGP Next hop resolution: before 128.9.129.1/32 in ISIS vs. after 128.9.128.0/19 in BGP

Cause of Black Holing
Every SP announces its address space externally in BGP• /19 BGP route is for this purpose
When the peering router crashed• IGP routes from that router were withdrawn in seconds• BGP routes from that router were not withdrawn
• 3 KEEPALIVEs of 60 seconds each – router rebooted before this
• These BGP routes were now resolved by this /19 prefix in BGP• Injected by 6 core routers – cost from any router to a core router is very low
We are good at designing networks when everything is up and running, but failure cases are often beyond our imagination• Analytics help us understand this behavior or even prevent it
Copyright © 2015 Packet Design 14

Remedy
Insert a really expensive static route for the /19 to ISIS • It should cost more than longest possible path in IGP• ISIS routes preferred over BGP routes and will hide the /19 BGP route
in recursion• Now, when a peering router crashes, the traffic will choose a true exit• See: http://www.nanog.org/meetings/nanog34/presentations/gill.pdf
Do not: Make IBGP session converge faster (like running BFD)• One may argue the root cause is that BGP was too slow to withdraw• You will lose the IBGP session each time the IGP path of the session
changes
Copyright © 2015 Packet Design 15

Challenges in Operating SDN
What governs whether or not these programmatic changes should be made? What will be their impact?
SDN makes networks programmable for• Network overlays• Bandwidth reservation• Demand placement• Service deployment• Etc.
-- but --
16
PHYSICAL & VIRTUAL
ROUTERS, SWITCHES &
NETWORK FUNCTIONS
APPLICATIONSBandwidth
CalendaringDemand
Placement
Service
DeploymentETC.
SDN CONTROLLERS
Southbound APIs: OpenFlow, i2RS, PCE, NETCONF, ForCES, SNMP, CLI, etc.
Northbound APIs
Copyright © 2015 Packet Design
Need for Analytics-Driven Applications
When major apps/services are introduced, planning groups validate capacity• Quality of Experience expectations
• Capacity planning
• Changes to the topology, CoS treatment, …
If the apps/services are being rolled out without operator intervention, how do you plan for them?• SDN analytics addresses this concern
Copyright © 2015 Packet Design 17

How Rich Analytics Help a Bandwidth
Scheduling Application
Bandwidth scheduling: can I move X bps from A to Bat time t ?Attractiveness: SPs have abundance of spare bandwidth• Most SP networks have less than 50% utilization
• Verizon: 46% average peak utilization
• Level 3: 46-56% peak utilization range
Can an SP profit from this spare capacity?
But there are good reasons for this spare bandwidth
18Copyright © 2015 Packet Design

A Naïve Implementation
Let’s collect link utilizations• This is near real time; and SPs already have it
We need utilizations at time t• Use historical link utilizations• Baseline: average same 5-minute or hour of the day for several
weeks• Add projections for growth and safety
Compute path from A to B and add X bps to the links• Go or no-go decision based on new link utilizations
If go, schedule the SDN controller to set up this path from A to B at time t, and tear it down afterwards
19Copyright © 2015 Packet Design

Reasons for Spare Bandwidth
Increased utilization increased delay and jitter• Delay vs. link utilization curve has a sharp knee
Network must accommodate failures• Network must have capacity to reroute the traffic
around failures• Large networks have one link down at any given time,
they must tolerate two link failures
Traffic is growing but adding capacity takes time
20Copyright © 2015 Packet Design

Addressing These Challenges
Increased delay• Cap the go/no-go decision at ~65-70%• For anything above that we must be moving bulk traffic
• Not suitable for uncompressed HD broadcast of an event• Not even suitable for best-effort traffic• Must deploy differentiated services
Protect against failures via simulation• Fail every (or two) link/router and see the impact on link
utilizations• Not sufficient to fail just the links/routers along the path
21Copyright © 2015 Packet Design

Failure Impact: Where will the traffic go?
We need to know where the traffic is entering the network, how much traffic there is, and where it is exiting the network
• Link utilizations don’t tell where the traffic is entering or exiting the network
We need to understand the network’s routing to compute the new paths
22Copyright © 2015 Packet Design

Need for a Traffic Demand Matrix
Traffic Matrix: • For each router pair (r1,r2), how much traffic entering at r1 is
exiting at r2?
Flow data tells the source and destination of traffic • Not the same as where the traffic is entering and exiting
• Source and destination IP addresses can be several ASs away
23Copyright © 2015 Packet Design

Route-Flow Fusion
Route-Flow Fusion yields traffic matrix• Find the path of each flow including:
• Source AS, upstream transit ASs, neighbor AS• Ingress router, routers along the core, egress router• Downstream neighbor AS, transit ASs, destination AS
• Use this to generate various traffic matrices• Ingress to egress routers• PoP to PoP / core to core• AS to AS
Approach works for any network• Not limited to full-mesh of RSVP-TE tunnels
24Copyright © 2015 Packet Design

Simulation and Impact of a Failure
For each flow on the failed link• Go to the ingress router and find the new path for the flow• Subtract flow’s bandwidth from the old links• Add flow’s bandwidth to the new links• Check to see if congestion crept in
We need an accurate routing model of the network• Route analytics provides this for IGP, BGP, RSVP-TE, VPNs…
25Copyright © 2015 Packet Design

Concluding Remarks
Routing impacts network performance• Availability and reachability• Sub-optimal paths with longer delays, jitter
Route analytics proves to be very effective in• Troubleshooting, monitoring, alerting• Reporting and network health assessment• Routing-aware traffic analysis
• BGP peering analysis• Traffic matrices
Rich analytics are key for successful SDN deployment and applications, including bandwidth scheduling
Copyright © 2015 Packet Design 26