Route management in Safer Transportation Network Planning · Route management in Safer...
52
Route management in Safer Transportation Network Planning Ton Hummel D-2001-11
Transcript of Route management in Safer Transportation Network Planning · Route management in Safer...

Route management inSafer Transportation Network Planning
Ton Hummel
D-2001-11


Route management inSafer Transportation Network Planning
Safety principles, planning framework and library information
D-2001-11Ton HummelLeidschendam, 2001SWOV Institute for Road Safety Research, The Netherlands

Report documentation
Number: D-2001-11Title: Route management in Safer Transportation Network PlanningSubtitle: Safety principles, planning framework and library informationAuthor(s): Ton HummelResearch theme: Road design and road safetyTheme leader: Atze DijkstraProject number SWOV: 33.310
Keywords: Itinerary, journey time, route guidance, perception, safety, roadnetwork, classification, planning, design (overall design), trafficcontrol, textbook, program (computer).
Contents of the project: The design tool - Safer Transportation Network Planning - isintended to guide network planners in designing safe transpor-tation networks. This report is one in a series of reports which willbe used in the development of the tool. The information in thisreport is intended to guide the structure and programming ofSafer Transportation Network Planning with respect to routemanagement.
Number of pages: 42 + 8 pp.Price: Dfl. 22,50Published by: SWOV, Leidschendam, 2001
SWOV Institute for Road Safety ResearchP.O. Box 10902260 BB LeidschendamThe NetherlandsTelephone 31703209323Telefax 31703201261

SWOV Publication D-2001-11 3
Summary
This report is one in a series of publications, used in the development of thenetwork planning tool ‘Safer Transportation Network Planning’ (Safer-TNP).The publications were used to guide the development of planning struc-tures, diagnostic tools, planning recommendations, and research infor-mation in the computer tool Safer-TNP. Safer-TNP is a design tool that guides network planners in designing safetransportation networks (or improving safety of existing transportationnetworks). It provides the practitioner with diagnostic tools, and guidinginformation. At the moment of publication of this report, Safer-TNP is stillbeing developed. Besides this ‘Route management report’, the following reports have beenpublished in this series:- Access management in Safer Transportation Network Planning
(Hummel, 2001a);- Land use planning in Safer Transportation Network Planning (Hummel,
2001b);- Intersection planning in Safer Transportation Network Planning
(Hummel, 2001c).
The information in this report will be used to guide the structure and theprogramming of different parts of the Safer-TNP tool with respect to routemanagement. Described is, in a step-by-step procedure, what information isneeded, and in what way the information should be processed. In the lastchapter of the report, background information is provided to give users ofthe tool guiding information. Because of the specific purpose of this report,its structure and style deviate somewhat from regular research reports.Because the different chapters are used in different stages of the develop-ment of Safer-TNP, there is some repetition of information. Furthermore,the information is written in telegraphic style, to simplify the electronicpackaging of information in Safer-TNP.
In this report, a method is described to persuade road users to use thesafest possible routes in the network. A diagnostic tool is described toanalyse the route-choice for the most important origin-destination relationsin the network. If the chosen routes are not the safest (or most functional)routes in the network, techniques are described to redirect traffic by eitherincreasing travel time on the undesired routes or by decreasing travel timeson the desired routes.

SWOV Publication D-2001-11 5
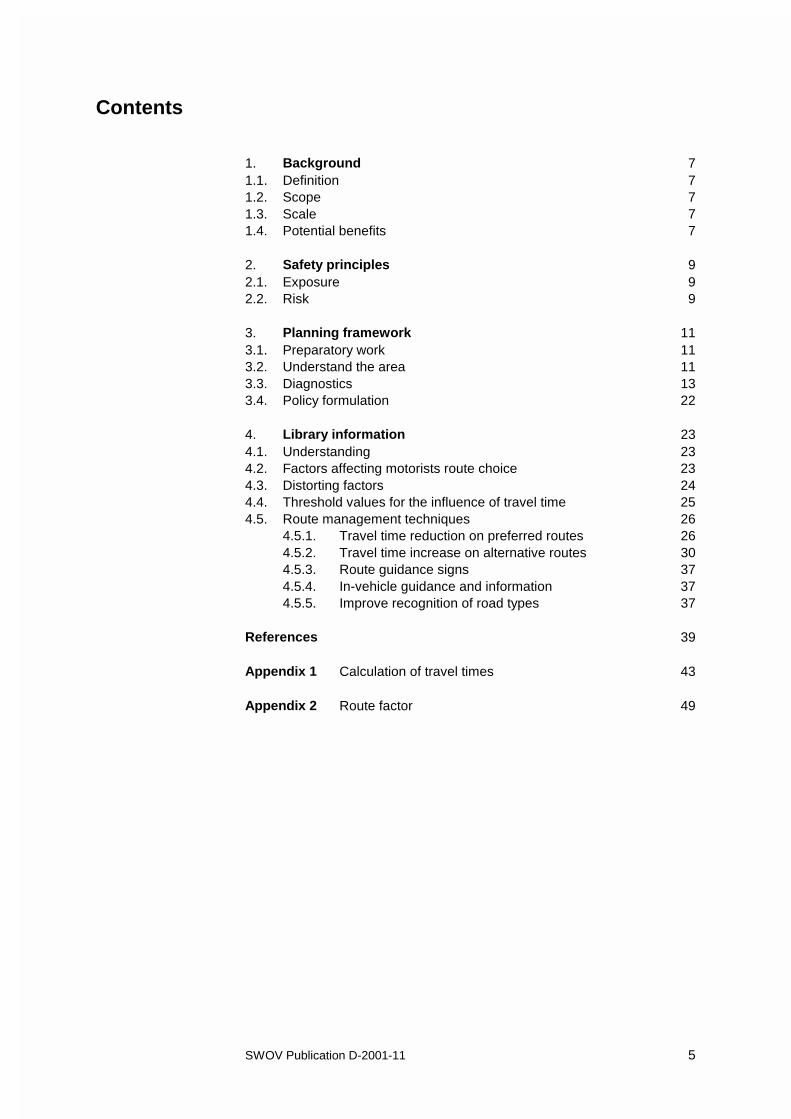
Contents
1. Background 71.1. Definition 71.2. Scope 71.3. Scale 71.4. Potential benefits 7
2. Safety principles 92.1. Exposure 92.2. Risk 9
3. Planning framework 113.1. Preparatory work 113.2. Understand the area 113.3. Diagnostics 133.4. Policy formulation 22
4. Library information 234.1. Understanding 234.2. Factors affecting motorists route choice 234.3. Distorting factors 244.4. Threshold values for the influence of travel time 254.5. Route management techniques 26
4.5.1. Travel time reduction on preferred routes 264.5.2. Travel time increase on alternative routes 304.5.3. Route guidance signs 374.5.4. In-vehicle guidance and information 374.5.5. Improve recognition of road types 37
References 39
Appendix 1 Calculation of travel times 43
Appendix 2 Route factor 49


SWOV Publication D-2001-11 7
1. Background
1.1. Definition
0 Route management is the practice of:- persuading road users to use the routes as intended by the designer
of the network.
0 The aim of route management is:- to match the use of the roads and routes in a network with the
function of those roads and routes.- to provide the roads and routes with one (and preferably not more
than one) of the three functions: flow function, distributor function andlocal access function.
1.2. Scope
Route management techniques can be applied in both existing and in newlyplanned situations.0 Existing:
If the actual use of roads and routes does not conform to the function ofthose roads and routes in the network, route management techniquescan be applied to redirect the traffic to the intended roads and routes.
0 New:Route management can be used to support the functional classificationof the network. The function is not to redirect traffic, but to improverecognition.
1.3. Scale
0 Route management techniques can be applied to the following twoscales of network planning:1. A regional network of roads connecting a number of communities.2. A network in a community or urban area.
1.4. Potential benefits
0 Route management supports compliance with the functionalclassification of the network. Route management can thus intensify orimprove the benefits of the functional classification:0 Exposure to risk:
In an efficient and functional network, routes are direct (no detours),and the shortest routes coincide with the safest routes, thus reducingoverall travel and exposure to risk.
0 Conflicts:- reduction of conflicts between continuously through-moving traffic
and discontinuously moving access-related traffic.- reduction of conflicts between fast moving vehicles and
vulnerable road users.- reduction of conflicts caused by route seeking and manoeuvre
obscurity or complexity.

8 SWOV Publication D-2001-11
0 Capacity:The part of the network with an exclusive flow function generallyguarantees a continuous and uninterrupted throughput.
0 Environment:A continuously moving traffic stream causes less environmentaldamage than a congested or frequently stopping traffic stream.
0 Quality of land use activities:Roads with an exclusive access function have ideal conditions forhigh-quality land use activities, such as in residential, recreationaland industrial areas.

SWOV Publication D-2001-11 9
2. Safety principles
0 The overall Transportation Network Planning approach is based on aframework of safety planning principles (i.e. as discussed in more detailin the ‘Learn’ Module).
0 Minimize Exposure- Promote efficient land use.- Provide efficient networks where the shortest/ quickest routes
coincide with the safest routes.- Promote alternative modes.
0 Minimize Risk- Promote functionality, by preventing unintended use of each road.- Provide homogeneity, by preventing large differences in vehicle
speed, mass, and direction of movement.- Provide predictability, thus preventing uncertainty amongst road
users by enhancing the predictability of the road’s course, andenabling the behaviour of other road users to be anticipated.
0 Minimize Consequences- Reduce speeds.- Provide a forgiving roadside.- Protect vulnerable road users.
0 This chapter discusses the interaction between these principles androute management. The principles printed in italic are not considered tobe relevant to route management and will therefore not be addressed inthis chapter.
2.1. Exposure
Efficient networks
0 In an efficient network, exposure is minimized by:- trips that are short and direct- the shortest/ quickest routes in a network are also the safest.
0 Route management can improve network efficiency:- by supporting the network classification (clear guidance improves
recognizability)- by redirecting traffic if the network efficiency is not optimal (shortest
or quickest is not safest).
2.2. Risk
Functionality
0 Route management can prevent unintended use of each road, bydirecting or redirecting traffic to the intended roads and routes (use ofroad in accordance with function of road).
0 The use of rat runs can be discouraged by turning restrictions orincreasing travel times on the rat runs by traffic calming measures.

10 SWOV Publication D-2001-11
0 The use of the intended routes can be encouraged by reducing traveltimes on these routes.
Homogeneity
0 Route management can stimulate road users to use road networks asintended, causing a more homogenous use of the different elements ofthe network (e.g. only through-traffic on arterials). Friction anddifferences in speed and in directions of moving are reduced.

SWOV Publication D-2001-11 11
3. Planning framework
3.1. Preparatory work
The following information should be available in order to be able toundertake route management:0 Map0 Origins and destinations (schematic)0 Road and intersection information:
- functional category of links and intersections- road form and intersection form- priority directions on priority intersections- speed limits- capacity of links and intersections- access density- level of service for intersections.
0 Traffic information:- volumes- presence of different types of road users- actual level of safety.
3.2. Understand the area
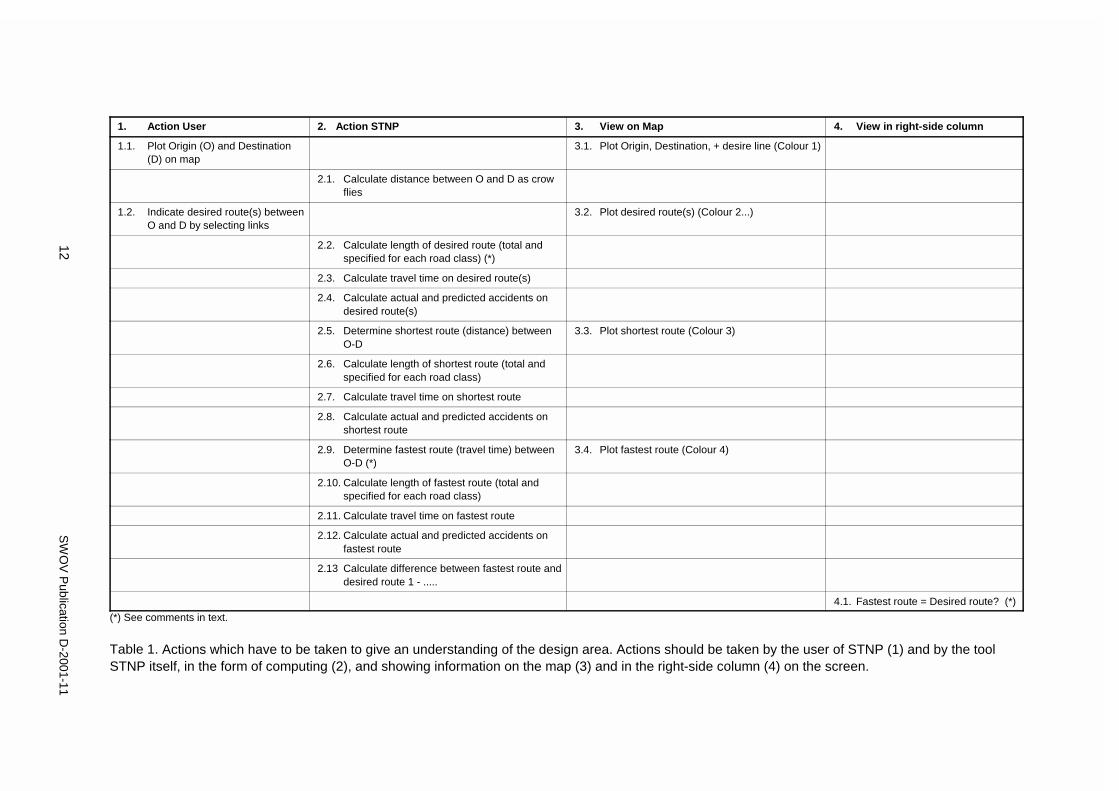
Table 1 shows the actions which have to be taken to give an understandingof the design area. These actions have to be taken by the user of STNP (1)and by the tool STNP itself, in the form of computing (2), and showinginformation on the map (3) and in the right-side column (4) on the screen.
Action 2.2/ 2.6/ 2.10:
Total length of route .....kmof which .....km on rural freeway
.....km on rural expressway
.....km on rural major distributor
.....km on rural minor distributor
.....km on rural local road
.....km on urban freeway
.....km on urban expressway
.....km on urban major distributor
.....km on urban minor distributor
.....km on urban local road
Leave out categories with length = 0
Action 2.9:
The method to calculate travel times on routes is described in Appendix 1‘Calculation of travel times’.
12S
WO
V P
ublication D-2001-11
1. Action User 2. Action STNP 3. View on Map 4. View in right-side column
1.1. Plot Origin (O) and Destination(D) on map
3.1. Plot Origin, Destination, + desire line (Colour 1)
2.1. Calculate distance between O and D as crowflies
1.2. Indicate desired route(s) betweenO and D by selecting links
3.2. Plot desired route(s) (Colour 2...)
2.2. Calculate length of desired route (total andspecified for each road class) (*)
2.3. Calculate travel time on desired route(s)
2.4. Calculate actual and predicted accidents ondesired route(s)
2.5. Determine shortest route (distance) betweenO-D
3.3. Plot shortest route (Colour 3)
2.6. Calculate length of shortest route (total andspecified for each road class)
2.7. Calculate travel time on shortest route
2.8. Calculate actual and predicted accidents onshortest route
2.9. Determine fastest route (travel time) betweenO-D (*)
3.4. Plot fastest route (Colour 4)
2.10. Calculate length of fastest route (total andspecified for each road class)
2.11. Calculate travel time on fastest route
2.12. Calculate actual and predicted accidents onfastest route
2.13 Calculate difference between fastest route anddesired route 1 - .....
4.1. Fastest route = Desired route? (*)
(*) See comments in text.
Table 1. Actions which have to be taken to give an understanding of the design area. Actions should be taken by the user of STNP (1) and by the toolSTNP itself, in the form of computing (2), and showing information on the map (3) and in the right-side column (4) on the screen.

SWOV Publication D-2001-11 13
Action 4.1:
Does the desired route coincide with fastest route?Yes: “Desired route .... appears to be the fastest route in the network
between the given Origin and Destination, indicating road users willprobably use this route”.
No: “Desired route ....does not coincide with the fastest route in thenetwork between the given Origin and Destination. The fastest routeis ....sec. shorter than desired route....”
3.3. Diagnostics
Table 2 shows the actions which have to be taken to diagnose the roadnetwork safety. These actions have to be taken by the user of STNP (1) andby the tool STNP itself, in the form of computing (2) and showinginformation on the map (3) and in the right-side column (4) on the screen.
Action 2.14:
Appendix 2, ‘Route Factor’, describes that a route factors higher than 1,6can be an indication for inefficient routes. Pilot studies have to provewhether this threshold value of 1,6 is useable.
Action 2.17:
After the start of the trip, cars should use higher category roads as soon aspossible, and should preferably use the highest category as much aspossible.In a functional route, traffic should only use local roads at the beginning orat the end of a trip. The use of local roads on other sections of the routethan beginning or end can be described as rat runs. E.g.: “Local - local - distributor - expressway - distributor - local” is alright.
“Local - distributor - local - ....” or “.... - distributor - local - distributor -local” is not desirable.
The beginning and the end of a trip can be local. If apart from beginningand end a higher category is followed by a local road, this should bedetected and indicated to the user.
Action 2.20:
An example of a time-path diagram is shown under the explanation ofAction 4.19 (see Figure 1).Time-path diagrams not only show immediately which route is the mostfunctional route, but can also show deficiencies in routes (like large delays,frequently changing of road category, too many intersections etc.).

14S
WO
V P
ublication D-2001-11
1. Action user 2. Action STNP 3. View on map 4. View in right-side column
3.5. O+D, desire line, desired route(s), fastestroute, shortest route
4.2. Fact sheet for desired route(s), fastestroute, and shortest route (*)
1.3. Choose route(s) to analyse in moredetail (tick routes as shown on map)
1.4. Tick Route efficiency 2.14. Compare Route factor with thresholdvalue (1.6) (*)
2.15. Route factor > 1.6 4.3. “This route is [route factor] times aslong as the direct distance, indicatinga less efficient connection for thestudied O-D-pair. Is this a problem?Yes/No/Comments”.
2.16. Route factor � 1.6 4.4. “This route provides an efficientconnection for the studied O-D-pair”.
1.5. Tick Route functionality 2.17. Detect use of local roads in route chain,other than at beginning and/or end ofchain (*)
2.18. No undesired use of local roads? 4.5. No message
2.19. Undesired use of local roads? 3.6. Highlight detected undesirable local roadsections.
4.6 “Highlighted local road sections areundesirable in that stage of the route.Is this a problem? Yes/ No/Comments”.
2.20. Derive Time - Path diagrams for allroutes (desired, fastest, shortest) (*)
4.7. Show Time - Path diagrams
2.21. Select route of which time-path diagramhas smallest angle of inclination
3.7. Highlight route with smallest angle ofinclination.
2.22. Selected route is desired route.... 4.8. “Desired route is most functionalroute”.
2.23. Selected route is not one of desiredroutes
4.9. “The most functional route is not oneof the routes you described asdesired. Is this a problem? Yes/ No/Comments”.
(*) See comments in text.
Table 2. Actions which have to be taken to diagnose the road network safety. Actions should be taken by the user of STNP (1) and by the tool STNP itself,in the form of computing (2), and showing information on the map (3) and in the right-side column (4) on the screen.

SW
OV
Publication D
-2001-1115
1. Action user 2. Action STNP 3. View on map 4. View in right-side column
1.6. Tick travel times 2.24. Is desired route...fastest route?
2.25. 2.24= Yes 4.10. “Desired route is the fastest route, indicatingroad users probably will use this route”.
2.26. 2.24.= No 3.9. Highlight fastest route
2.27. If No, is difference larger than 10 min.? (*)
2.28. 2.27= No 4.11. “Desired route is not the fastest route. Thedifference in travel time however is small(...min.). Traffic diverting to the faster routeis questionable”.
2.29. 2.27= Yes 4.12. “Desired route is not the fastest route. Thehighlighted route is ....min. faster, indicatingthat road users will use this route instead ofthe desired route”.Is this a problem? Yes/ No / Comm.
1.7. Tick route safety 2.30. Is desired route...the safest route? (Usepredicted accidents!!) (*)
2.31. 2.30.= Yes 4.13. “Desired route ... is also the safest routebetween studied O and D”.
2.32. 2.30.= No
2.33. Calculate difference in predicted accidentsbetween desired route and safest route.
3.10. Highlight safest route. 4.14. “Desired route ... is not the safest route. Onthe safest possible route (highlighted) ...lessaccidents per year are expected.”Is this a problem? Yes/ No/ Comm.
2.34. Calculate difference between actual accidentsand predicted accidents for desired route(s).
2.35. Actual accidents lower than predicted 4.15. No message
(*) See comments in text.
Table 2 continued.

16S
WO
V P
ublication D-2001-11
1. Action user 2. Action STNP 3. View on map 4. View in right-side column
2.36. Actual accidents higher thanpredicted
3.11. Highlight sections in desired route(s)where actual accidents is higher thanpredicted.
4.16. “The reported number of accidents on theroute is higher than should normally beexpected. On this route ....accidents arereported, whereas the predicted numberof accidents is....This could be an indication of deficienciesin the road form, or the presence of blackspots. The sections with more reportedthan predicted accidents are highlighted”.Is there a problem? Y/N/CReport possible problems to engineeringdepartment.
1.8. Tick summary of results 4.15. Desired route.....:-Efficient/ Not efficient-Undesirable use local roads./ No.....-Most functional/ Not most functional-Fastest/ Not fastest-Safest/ Not safest
2.37. Is 4.6, 4.9, 4.12, or 4.14 answeredwith yes?
2.38. No 4.16. End Route management
2.39. Yes 4.17. “Do you want to change routeing oftraffic?”
2.40. If 4.17 is no 4.18. “Sure??”
2.41. If 4.17 is yes, go to 1.9.
1.9. Possible route man. techniques:-change driving speeds-add links-directional closures-closures
Table 2 continued.

SW
OV
Publication D
-2001-1117
1. Action user 2. Action STNP 3. View on map 4. View in right-side column
1.10. Change driving speeds 3.12. Show desired route(s), and fastest route 4.19. Show time - path diagrams and changingtable (*)
2.42. Take user through changes (seeexplanation of 4.19.)
2.43. Recalculate (repeat step 1.3. through1.8.)
4.20. “Do you still want to change anything? Ifyes, go back to 1.9 and choose anotherroute management technique”.
1.11. Add link(s)
1.12. Manually reassign traffic volumes 2.44. Go through 1.3. to 1.8. again
4.21. “Do you still want to change anything? Ifyes, go back to 1.9 and choose anotherroute management technique”.
1.13. Directional closure(s)
1.14. Manually reassign traffic volumes 2.45. Go through 1.3. to 1.8. again
4.22. “Do you still want to change anything? Ifyes, go back to 1.9 and choose anotherroute management technique”.
1.15. Closure(s)
1.16. Manually reassign traffic volumes 2.46. Go through 1.3. to 1.8. again
4.23. “Do you still want to change anything? Ifyes, go back to 1.9 and choose anotherroute management technique”.
4.24. If no, end route management.
(*) See comments text.
Table 2 continued.
18 SWOV Publication D-2001-11
Action 2.27:
Research indicates that motorists do not easily divert to other routes ifdifferences in travel times are smaller than 10 minutes (Khatak, Schofer &Koppelman, 1991). If the difference in travel time between the fastest routeand the desired route is smaller than 10 minutes, it can therefore notautomatically be stated that all traffic will divert to the fastest route. Theonly conclusion that can be drawn is that the desired route is not the fastestroute, but that the time difference is that small that it is not certain if, andhow many, motorists will divert to the faster route.
Action 2.30:
For the calculation of the level of safety of desired routes (“is the desiredroute also the safest route”) only the predicted accidents on links andintersections should be used. The use of actual accidents could includeaccident prone locations or black spots. Those deficiencies should besolved, but should not obscure the selection of the safest route.
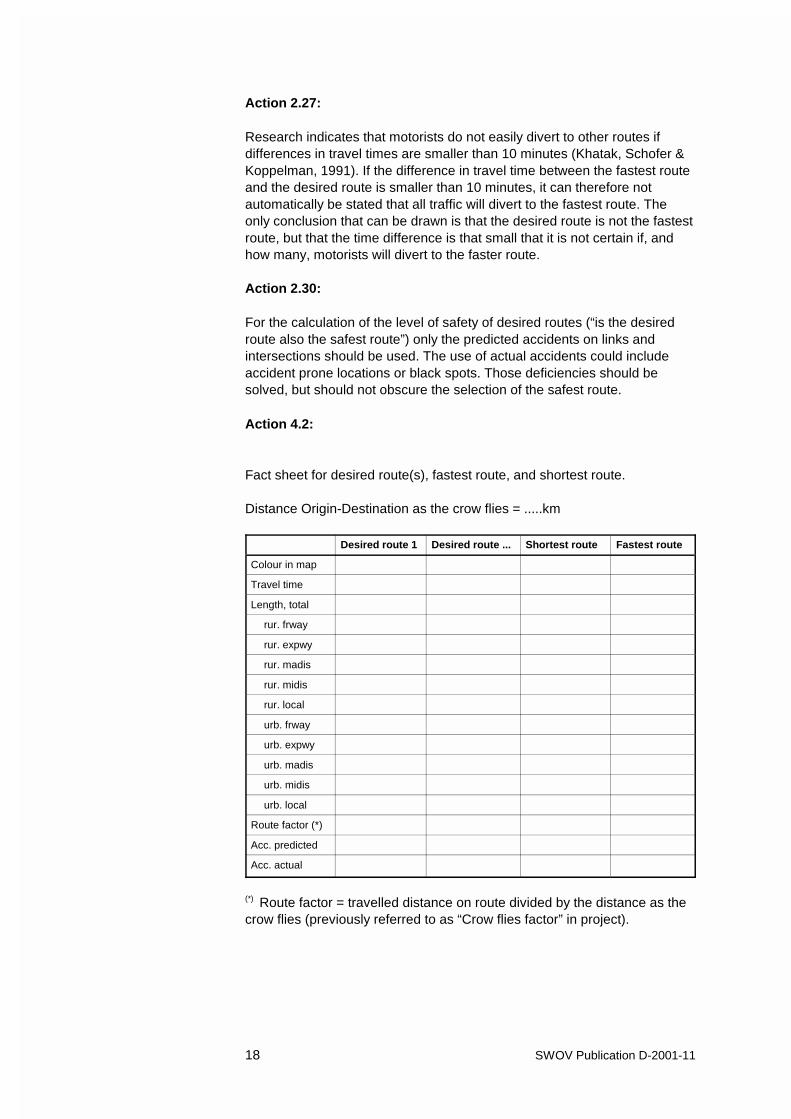
Action 4.2:
Fact sheet for desired route(s), fastest route, and shortest route.
Distance Origin-Destination as the crow flies = .....km
Desired route 1 Desired route ... Shortest route Fastest route
Colour in map
Travel time
Length, total
rur. frway
rur. expwy
rur. madis
rur. midis
rur. local
urb. frway
urb. expwy
urb. madis
urb. midis
urb. local
Route factor (*)
Acc. predicted
Acc. actual
(*) Route factor = travelled distance on route divided by the distance as thecrow flies (previously referred to as “Crow flies factor” in project).

SWOV Publication D-2001-11 19
route 3: y = 107.5x
route 4:y = 99.586x
crow flight: y = 51.429x
route 5: y = 83.396x
0
100
200
300
400
500
600
0 1 2 3 4 5 6 7 8
Distance in miles
Tim
e in
sec
on
ds
route 3
route 4
route 5
crow fligth
Action 4.19:
To change driving speeds and delays on routes, the user has to see boththe routes on the maps and the time-path diagrams (see Figure 1). A time-path diagram shows the use of different road categories as linesections with different angles of inclination. Delays at intersections arerepresented by vertical line sections. The diagram with the smallest overallangle of inclination (smallest angle of linear regression line) uses thehighest share of high-category roads, and/ or has the smallest delays atintersections and is therefore the most functional route. The diagrams notonly show immediately which route is the most functional route, but canalso show deficiencies in routes (like large delays, frequently changing ofroad category, too many intersections etc.).
On the screen, the routes on the map and the time-path diagram have tocorrespond, so if the users clicks on a link or an intersection, thecorresponding element in the diagram should blink.
Figure 1. Example of a time-path diagram.
For each link or intersection on a route the user clicks, one of the followingtables is presented below the time-path diagrams:
Selected section: Intersection #.....Type (signalised,priority, all-waystop, roundabout)
Volume Level of Service (A-B, C-D, E-F)
Delay
Original
Revised
Selected section: Link #.....Road category Volume Posted speed Access density
Original
Revised

20 SWOV Publication D-2001-11
The user can tick on the ‘revised’ cells and change the value. (If he changesType or Road Category, the other values should change automatically).Every change in the table should directly give a recalculation of traveltimes, and show the results automatically in the time-path diagrams, so thatthe user immediately gets a feeling for how the time and path are changing.If the user changes values to impossible or unwise values (e.g. chosenintersection type cannot deal with the volumes, or volume-capacity ratio isotherwise higher than 0.85), the user should be warned.
If eventually the changes in the time-path diagrams confirm the user that heprobably reached his target, the user should be able to click a ‘Recalculate’button, after which the whole route management process from action 1.3.through 1.8 is repeated.
User information:
The difference in travel time for the used route and for the desired routegives an indication of measures to be taken.The applicability of route management can be studied by comparing theactual (average) driving speeds for the studied routes. Actions:a. Determine whether the actual driving speed on the undesired route can
be increased (travel time can be increased).b. Determine whether the actual driving speed on the desired route can be
decreased (travel time can be decreased).c. Change driving speed in the input of the model, and recalculate the
travel times on the studied routes.d. Determine if the change of driving speeds on the studied links is
sufficient to redirect traffic (travel times on desired routes should beshorter than travel times on undesired routes).Research of Khattak, Schofer & Koppelman (1991) indicates thatmotorists do not easily divert to another route, if travel time savings aresmaller than 10 minutes. If, however, friction and discomfort areincreased (e.g. as the result of traffic calming measures) this thresholdvalue could possibly be lower than 10 minutes.
e. If the adjustment of travel speeds is not sufficient to create a significantdifference in travel times between desired and undesired routes,physical route management techniques can be applied (e.g. roadclosures, turning restrictions, one-way traffic), or new links have to beintroduced in the network.
User information; Possible measures:
Measures in this section are discussed in more detail in section 4.5 ‘Routemanagement techniques’.
0 Decrease travel times on desired routes. Possible measures:- higher speed limits (and corresponding design)- reduction of delays at intersections:- reduction of the number of intersections- use of intersection types with smaller delays- traffic signal coordination- reduction of friction (and improving capacity)- reduction of number of accesses

SWOV Publication D-2001-11 21
- restriction/ reduction of turning movements- reduction of number of crossings- restriction/ reduction of roadside parking- adding traffic lanes- separating different road users- increasing capacity of intersections- providing bus bays at bus stops.The measures described above also improve the reliability of traveltimes.
0 Increase travel times on undesired routes. This option comes down to downgrading a road to a category with alower speed limit. To support this lower speed limit, the design of theroad has to be adjusted (see road form), and traffic calming measureshave to be implemented. Possible traffic calming measures are:- narrowing cross section- vertical deflection- raised crosswalk- raised intersection- rumble strip- sidewalk extension- speed hump- textured crosswalk- horizontal deflection- chicane - one lane- chicane - two lanes- curb extension- curb radius reduction- on-street parking- raised median island- traffic circle.The tools described should not be used separately and in isolation. Theeffects of isolated implementation of speed reducing measures is verylow. If the choice for increasing travel times on certain routes is made orconsidered, the designer has to chose to which design speed the speedshould be lowered (for example from 50 km/h to 30 km/h). To lower thedesign speed, a number of the mentioned measures should beimplemented.
0 Physical redirection of traffic. Assuring undesired routes:a. have longer travel times than the desired routes, or even excluding
undesired routes, or,b. cannot be used because of a:- directional closure- diverter- full closure- intersection channelization- raised median through intersection- right-in/ right-out island.

22 SWOV Publication D-2001-11
0 Route guidance signs.The effectiveness of this route management technique is doubtful. Roadusers with knowledge of the local network will not take longer routes.This measure will only be effective for road users without knowledge ofthe network.
0 Improved recognition of road types.The road form should clearly reflect the function of the road. In this waythe choice of routes with a function too ow for the trip is prevented.
3.4. Policy formulation
0 General policies:- Use of roads should be in accordance with the function of the roads
(i.e. volumes on residential roads should be low, residential streetsshould only be used by traffic with either origin or destination in thatparticular street, flow traffic should make use of the highest availableroad category).
- The fastest route between a specific origin-destination pair shouldalso be the safest route.
0 More specific policies:e.g. ‘Preferred level of service’ on arterials and collectors.
SWOV Publication D-2001-11 23
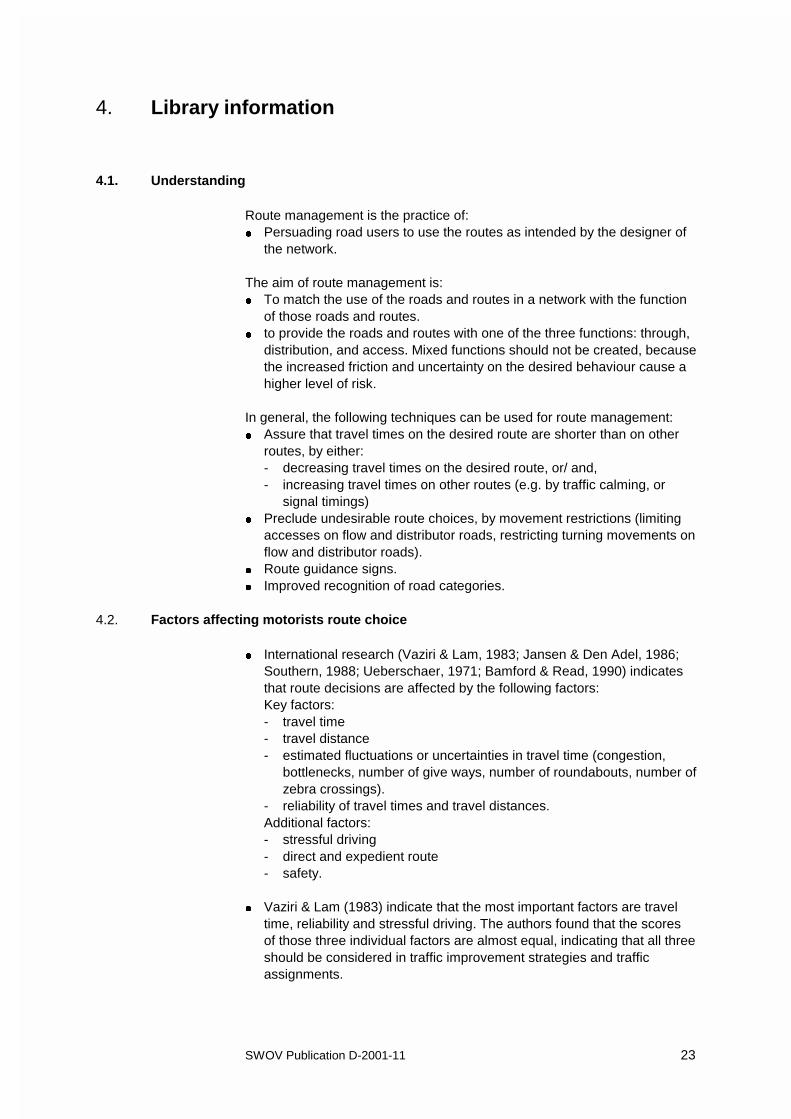
4. Library information
4.1. Understanding
Route management is the practice of:0 Persuading road users to use the routes as intended by the designer of
the network.
The aim of route management is:0 To match the use of the roads and routes in a network with the function
of those roads and routes.0 to provide the roads and routes with one of the three functions: through,
distribution, and access. Mixed functions should not be created, becausethe increased friction and uncertainty on the desired behaviour cause ahigher level of risk.
In general, the following techniques can be used for route management:0 Assure that travel times on the desired route are shorter than on other
routes, by either:- decreasing travel times on the desired route, or/ and,- increasing travel times on other routes (e.g. by traffic calming, or
signal timings)0 Preclude undesirable route choices, by movement restrictions (limiting
accesses on flow and distributor roads, restricting turning movements onflow and distributor roads).
0 Route guidance signs.0 Improved recognition of road categories.
4.2. Factors affecting motorists route choice
0 International research (Vaziri & Lam, 1983; Jansen & Den Adel, 1986;Southern, 1988; Ueberschaer, 1971; Bamford & Read, 1990) indicatesthat route decisions are affected by the following factors:Key factors:- travel time- travel distance- estimated fluctuations or uncertainties in travel time (congestion,
bottlenecks, number of give ways, number of roundabouts, number ofzebra crossings).
- reliability of travel times and travel distances.Additional factors:- stressful driving- direct and expedient route- safety.
0 Vaziri & Lam (1983) indicate that the most important factors are traveltime, reliability and stressful driving. The authors found that the scoresof those three individual factors are almost equal, indicating that all threeshould be considered in traffic improvement strategies and trafficassignments.

24 SWOV Publication D-2001-11
The remaining factors are only included in the route choice, if the threemost important factors do not result in one conclusive resulting route.
0 Southern (1988) found that distance and time are indicators of route-choice for nearly 80% of trips. The remaining 20% was not explained byeither time or distance.
0 Ueberschaer (1971) found that 86.3% of all route choices wereexplained by travel time. If travel distance is used as criterion, thispercentage of explained route choices dropped to 65.0%.
0 Vaziri and Lam (1983) found that drivers did not always rank the routechoice reasons with the same weight for trips to work, as for trips fromwork. This leaves some uncertainties in the relative importance of theroute choice criteria.
0 During the trip, motorists can adapt their chosen route to changing roadand traffic conditions. Adaptations are mostly based on radio trafficinformation or variable message signing. Most motorists judge the radiotraffic information as more reliable than other types of information.(Spyridakis et al., 1991).Bonsall, Whelan & Page (1995) describe the results of a statedpreference experiment, in which up to 88% of all drivers changed toalternative routes when they received a radio message indicating a 10minutes delay on the primary chosen route.
0 Research by Bovy & Bradley (1985) showed that the route choice ofbicyclists is more sensitive to fluctuations in road and traffic conditions.For cyclists travel time is also the most important route choice criterion,directly followed by surface type and the presence of separated bicyclefacilities. Results show that improvements in surface (from rough tosmooth) and facility (from none to separated path) can compensate fortravel time losses of up to 30%.
4.3. Distorting factors
0 Stated preference research in the Netherlands showed that motoristshave a limited knowledge of the possible routes to their destination. 75%of the respondents know no more than 2 or 3 alternative routes (Jansen& den Adel, 1986).
0 The choice of a route is based on the expectation of relevant routecharacteristics. Those expectations are often not correct. Bovy (1986)found that only 50% of the motorists who claim to take the shortest routeactually indicate the shortest possible route.
0 Research by Wenger et al. (1990) indicated that once commuters havechosen a route, they are very reluctant to change to alternative routes.Those commuters who changed their familiar route, reported higherlevels of stress during their trip. Similarly the results showed thatcommuters rarely changed mode of transportation or time of departureon the basis of information received before the departure.

SWOV Publication D-2001-11 25
4.4. Threshold values for the influence of travel time
0 Research of the en-route route changes in response to delay (Khattak,Schofer & Koppelman, 1991) showed that increasing delays on thepreferred route cause more drivers to divert (see Figure 2).
Figure 2. Percentage drivers diverting in response to various lengths ofdelay (Khattak, Schofer & Koppelman., 1991).
The decreasing percentage for delays longer than 41 minutes isexplained by the authors with the fact that delay is perceivedincrementally. Furthermore the number of observations for the largerdelays was rather small.Other variables such as weather conditions affect the decreasingnumber of diverted motorists at the upper end of the delay distribution. Ifdelays are long because of bad weather conditions, no alternative routeis likely to be more appealing.The study indicated a reduced sensitivity to units of delay as trip timeincreases; a given percentage increase in the length of delay has thesame effect on diversion, regardless of the current value of delay. Forexample, a 5 minute increase in a 10 minute delay, has the same effecton driver decisions as adding a 15 min to a 30 min delay.
In the study of Khattak, Schofer & Koppelman (1991), drivers needed aminimum travel time saving before diverting to another route. In thestudy this threshold value for travel time saving was 10 minutes.This indicates that travel time on the desired route should at least be 10minutes shorter than on the alternative route, to be able to divertmotorists from the alternative to the desired route.In the determination of this threshold value, only travel time increasesdue to delay were considered. If the amount of friction and discomfort ona route increases (e.g. as a result of traffic calming measures), thisthreshold value of 10 minutes could possibly be lower.

26 SWOV Publication D-2001-11
4.5. Route management techniques
As described in the previous sections, travel time and reliability of traveltime are the most important criteria for route choice. Furthermore theknowledge of the network, and the expectation/ recognition of relevant routecharacteristics are important conditions in the route choice.
Route management tools are:- Travel time reduction on preferred route- Travel time increase on other (alternative) routes- Improve reliability of travel times on preferred routes.- Physical route guidance- Route guidance signs- Improve recognition of road types.
The aim of route management techniques is to match the use of the roadsin a network with the function of the network.In a properly designed network the fastest route and the safest routecoincide, and there are no rat runs through residential areas. If in anexisting network this is not the case, route management techniques can beused to redirect traffic from undesirable routes to desirable routes.
4.5.1. Travel time reduction on preferred routes
0 Reduction of travel times on through-roads/ through-routes can beestablished by:A. higher speed limits (and corresponding design speeds)B. reduction of delays on intersectionsC. reduction of frictionD. direct connection without detours.
A. Higher speed limits (and corresponding design speeds)
0 See Road Form Library information.
B. Reduction of delays at intersections
0 Reduction of number of intersections.Generally the delay at intersections is considerably higher than on roadsegments (lower passing speeds, lower capacities). A larger number ofintersections therefore increases delays (see Table 3).

SWOV Publication D-2001-11 27
Signals per mile Percent increase in travel times(compared with 2 signals per mile)
20 0
30 9
40 16
50 23
60 29
70 34
80 39
Table 3. Percentage increases in travel times as signal density increases(Gluck, Levinson & Stover, 1999).
0 Use of intersections types with higher capacity, so that smaller delaysoccur (see Table 4).
Intersection type Capacity in vehicles/ day
Uncontrolled (priority to the right) 1,000 - 1,500
2-way stop/ 2-way yield 5,000 - 12,000
4-way stop 12,000 - 18,000
Roundabout single lane 20,000 - 28,000
multilane 35,000 - ? (1)
Signalized 20,000 - 80,000 (2)
(1) Varies from country to country(2) Depends on the number of lanes for the different movements
Table 4. Maximum capacity of different intersection types (May, 1997).
0 Adding left-turn lanes (see Figure 3).Right-turn lanes are generally not recommended on non-signalizedintersections, because they limit (or even block) visibility of straightgoing cars. The increase in capacity caused by right-turn lanes ismarginal.
The capacity of a shared lane is generally less than that of a through-lane, and under typical urban or suburban conditions might be about 40to 60 percent of a through-lane. Thus, along a four-lane arterial,provision of left-turn lanes would increase the capacity from about 1.5 to2.5 lanes in each direction - a 33 percent increase.

28 SWOV Publication D-2001-11
Figure 3. Delay savings of left-turn lanes on two-lane rural highways(Gluck, Levinson & Stover, 1999).
0 Traffic signal coordination on signalized intersectionsThe increase in capacity and reduction of delays is highly dependenton the type of coordination used.
C. Reduction of friction
0 Reduction of number of accesses (see Table 5).
Access density(access/km)
Running speedadjustment factor
0 1.00
5 0.96
10 0.93
15 0.90
20 0.86
25 0.83
30 0.79
Table 5. Speed adjustments for access density: British Columbia (Gluck,Levinson & Stover, 1999).
0 Restriction/ reduction of turning movements.A reduction or restriction of left-turn movements (at intersections oraccesses) can reduce delays.For an opposing volume of 800 vehicles per hour, and a through-volumeof 800 vehicles per hour, the percentages of through-traffic delayed andstopped were estimated as in Table 6.

SWOV Publication D-2001-11 29
Percent of left-turns Percent delayed Percent stopped
20 33 72
50 70 182
100 110 379
150 122 544
200 96 684
Table 6. The percentages of through-traffic delayed and stopped atdifferent percentages of left turns (800 vehicles per hour through, 800vehicles per hour opposing; Gluck, Levinson & Stover, 1999).
For an opposing volume of 200 vehicles per hour and a through-volume of 800 vehicles per hour, the percentages of through-vehiclesaffected were as in Table 7.
Percent of left-turns Percent delayed Percent stopped
20 6 11
50 18 28
100 27 67
150 38 95
200 52 122
Table 7. The percentages of through-traffic delayed and stopped atdifferent percentages of left turns (800 vehicles per hour through, 200vehicles per hour opposing; Gluck, Levinson & Stover, 1999).
0 Reduction of the number of crossingsReduction of delays and increase of capacity highly dependent ontype of crossing and volumes of crossing traffic.
0 Reduction/ restriction of roadside parking (no quantitative effectsavailable).
0 Other measures to improve capacity on links:- adding lanes- separating different types of road users- providing bus bays at bus stops.
D. Direct connection without detours
0 Travel times can be reduced by providing direct connections withoutdetours.

30 SWOV Publication D-2001-11
4.5.2. Travel time increase on alternative routes
0 Travel times on through-roads (flow and distributor) should be smallerthan travel times on alternative routes, to prevent motorists taking shortcuts. This can be established by lowering travel speeds on thealternative routes (traffic calming).
0 Tools to increase travel times (TAC, 1998):
Measure Effect on speed reduction
A. Narrowing cross-section Substantial, especially withoncoming traffic
B. Vertical deflection- Raised crosswalk Substantial- Raised intersection Substantial- Sidewalk extension Minor- Speed hump Substantial
C. Horizontal deflection- Chicane - one lane Substantial- Chicane - two lane Minor- Curb extension Minor- Curb radius reduction Minor- On-street parking Minor- Raised median island Minor- Traffic circle Substantial
Assuring undesired routes have longer travel times than the desiredroute: D. Physical redirection of traffic
- directional closure Substantial- diverter Substantial- full closure Substantial- intersection channelization Substantial- raised median through inters. Substantial- right-in/ right-out island Substantial
E. Signing- Maximum speed Minor- Traffic-calmed neighbourhood No effect
0 The tools described should not be used separately and in isolation. Theeffects of isolated implementation of speed reducing measures is verylow. If the choice for increasing travel times on certain routes is made orconsidered, the designer has to chose to which design speed the speedshould be lowered (for example from 50 km/h to 30 km/h). To lower thedesign speed, a number of the mentioned measures should beimplemented.

SWOV Publication D-2001-11 31
A. Narrowing cross-section
B. Vertical deflection
Raised crosswalk:

32 SWOV Publication D-2001-11
Raised intersection:
Sidewalk extension:
Speed hump:

SWOV Publication D-2001-11 33
C. Horizontal deflection
Chicane:
Curb extension:
Curb radius reduction:

34 SWOV Publication D-2001-11
On-street parking:
Raised median island:
Traffic circle:

SWOV Publication D-2001-11 35
D. Physical redirection of traffic
Directional closure:
Diverter:
Full closure:
36 SWOV Publication D-2001-11
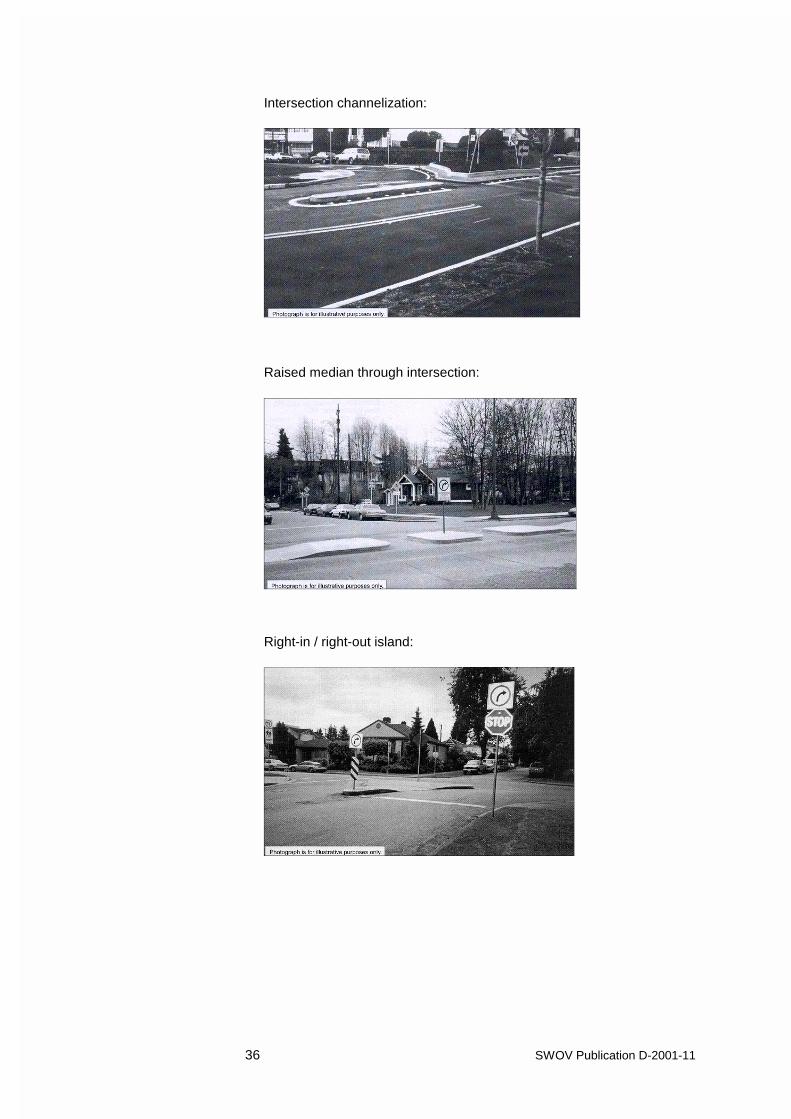
Intersection channelization:
Raised median through intersection:
Right-in / right-out island:

SWOV Publication D-2001-11 37
4.5.3. Route guidance signs
0 Theeuwes & Godthelp (1992) estimate that 5-10% of all vehiclekilometres are caused by getting lost.
0 The use of route signs can:- guide traffic on desired routes in the network- reduce the amount of travel caused by getting lost.
0 Information display techniques (Alexander & Lunenfeld, 1990):a. Spreading: Spreading reduces the chance for overload at
high processing demand locations by movinglower primacy information sources upstream ordownstream, thereby reducing processing load.
b. Coding: Coding increases drivers’ information handlingcapacity and reduces their reaction time.Codes include colours, shapes, and numbers.
c. Repetition: The short term memory span of most drivers is30 seconds - 2 minutes. If a time greater thanthis short term memory span intervenesbetween the receipt of information and itsaction, drivers may forget the message.Repetition can also prevent information beingmissed because of sight blockings.
d. Redundancy: Redundancy displays the same information onone or more information carriers, using two ormore display techniques.
4.5.4. In-vehicle guidance and information
0 Research in a simulated route-choice situation (Bonsall & Perry, 1991)proved that overall, about 70% of the advice was accepted. It wasobserved that the acceptance of route advice depended on the quality ofthe advice, the quality of previously received advice, the drivers’knowledge of the network and on the extent to which advice wascorroborated by other evidence.
0 In-vehicle guidance can have the same advantages as the use of routeinformation signs, namely: reduction of searching traffic, and guidanceto desired routes.
0 If the in-vehicle guidance system is traffic actuated, traffic can be guidedto take short cuts in case of blockings or congestion on main routes. Thiscould lead to conflicts between the function of roads and the actual useof those roads.
4.5.5. Improve recognition of road types
0 A clear and recognisable road classification is the most important andeffective route management technique.
0 The function of each road in the network should be clear by the design ofthe roads and the connecting intersections. Each road type andintersection type should have a uniform design.

38 SWOV Publication D-2001-11
0 Road user expectancies have an important influence on their behaviourand performance in traffic. The navigational task can therefore besimplified if road and route characteristics correspond with road userexpectancies.The use of the right (desired) road types is improved if the function ofthe roads is clearly recognisable by its design characteristics or indicatedby route signing (Alexander & Lunenfeld, 1990; Theeuwes & Godthelp,1992). To improve recognition, each road type and intersection typeshould have a uniform design, making its function clearly recognisable.
0 To improve recognition and predictability, the number of road categoriesshould be limited. Preferably no more than three functions andcorresponding road categories should be distinguished:- through-function- distributor function- access function.

SWOV Publication D-2001-11 39
References
Alexander, G.J. & Lunenfeld, H. (1990). A users’ guide to positive guidance.FHWA-SA-90-017. Federal Highway Administration, Washington, D.C.,USA.
Bamford, T.J.G. & Read, P. (1990). An empirical study of drivers’ routechoices. Contractor Report 197. Transport and Road Research Laboratory.Crowthorne, United Kingdom.
Blunden, W.R. & Bunton, R.B. (1962). An analysis of route factors for one-way and two-way street systems. In: Proceedings of 1st Conference ofAustralian Road Research Board ARRB, Melbourne, Australia.
Bonsall, P. & Perry, T. (1991). Using an interactive route-choice simulator toinvestigate drivers’ compliance with route guidance advice. In:Transportation Research Record 1306. Transportation Research Board,Washington, D.C., USA.
Bonsall, P., Whelan, G. & Page, M. (1995). Stated preference experimentsto determine the impact of information and guidance on drivers’ routechoice. In: Transportation planning methods. Proceedings of seminar E(P392) held at the 23th PTRC European Transport Forum, 11-15September 1995, Warwick. The Planning and Transport Research andComputation International Association PTRC, London, United Kingdom.
In: Transportation planning methods : proceedings of seminar E (P392) heldat the 23th PTRC European Transport Forum, University of Warwick,England, September 11-15, 1995, p. 287-306, 18 ref.
Bovy, P. (1986). Routekeuzegedrag. In: De Psycholoog XXI/12 December.The Netherlands. [In Dutch].
Bovy, P.H.L. & Bradley, M.A. (1985). Route choice analysed with stated-preference approaches. In: Transportation Research Record 1037.Transportation Research Board, Washington, D.C., USA.
Brilon, W. & Grossmann, M. (1991). The new German guideline for capacityof unsignalized intersections. In: Brilon, W. (Ed.), Intersections withoutTraffic Signals II. Proceedings of an International Workshop 18-19 July1991, Bochum, Germany.
Gluck, J., Levinson, H.S. & Stover, V. (1999). Impacts of AccessManagement Techniques. NCHRP Report 420. National CooperativeHighway Research Program. Transportation Research Board, Washington,D.C., USA.
Höglund, P.G. (1991). Case study. Performance effects of changing a trafficsignal intersection to roundabout. In: Brilon, W. (Ed.), Intersections withoutTraffic Signals II. Proceedings of an International Workshop 18-19 July1991, Bochum, Germany.

40 SWOV Publication D-2001-11
Hummel, T. (2001a). Access management in Safer Transportation NetworkPlanning. D-2001-10. SWOV Institute for Road Safety Research,Leidschendam, the Netherlands.
Hummel, T. (2001b). Land use planning in Safer Transportation NetworkPlanning. D-2001-12. SWOV Institute for Road Safety Research,Leidschendam, the Netherlands.
Hummel, T. (2001c). Intersection planning in Safer Transportation NetworkPlanning. D-2001-13. SWOV Institute for Road Safety Research,Leidschendam, the Netherlands.
Jansen, G.R.M. & Adel, D.N. den (1986). Routekeuze van automobilisten;Een onderzoek naar kwalitatieve keuzefactoren. Rapport nr. 59. Instituutvoor Stedebouwkundig Onderzoek, Technische Universiteit Delft, Delft, theNetherlands. [In Dutch].
Khattak, A.J., Schofer, J.L. & Koppelman, F.S. (1991). Factors influencingcommuters’ en route diversion behaviour in response to delay. In:Transportation Research Record 1318. Transportation Research Board,Washington, D.C., USA.
Kyte, M., Zegeer, J. & Lall, B.K. (1991). Empirical models for estimatingcapacity and delay at stop-controlled intersections in the United States. In:Brilon, W. (Ed.), Intersections without Traffic Signals II. Proceedings of anInternational Workshop 18-19 July 1991, Bochum, Germany.
May, A. (1997). Review of international practices used to evaluateunsignalized intersections. Transportation Research Circular no. 468.Transportation Research Board, Washington, D.C., USA.
Ministry of Transportation and Highways (1992). Economics analysesguidebook. Planning Services Branch, Ministry of Transport and Highways,Victoria, Canada.
Smeed, R.J. (1971). The effect of the design of road networks on theintensity of traffic movements in different parts of a town with specialreference to the effect of ring roads. Technical note 17. ConstructionIndustry Research and Information Association, London, United Kingdom.
Southern, A.C. (1988). Understanding driver route choice. In: 16th PTRCEuropean Transport and Planning Summer Annual Meeting, 12-16September 1988, Bath. The Planning and Transport Research andComputation International Association PTRC, London, United Kingdom.
Spyridakis, J., Barfield, W., Conquest, L., Haselkorn, M. & Isakson, C.(1991). Surveying commuter behaviour: designing motorist informationsystems. In: Transportation Research - A. Vol. 25A, No. 1, pp 17-30.
TAC (1998). Canadian guide to neighbourhood traffic calming.Transportation Association of Canada TAC, Institute of TransportationEngineering ITE, Ottawa, Canada.
SWOV Publication D-2001-11 41
Teply, S. & Evans, G.D. (1989). Evaluation of the quality of signalprogression by delay distributions. In: Transportation Research Record1225. Transportation Research Board, Washington, D.C., USA.
Theeuwes, J. & Godthelp, J. (1992). Begrijpelijkheid van de weg. TNOrapport IZF 1992 C-8. Instituut voor Zintuigfysiologie, TNO. Soesterberg,the Netherlands.
TRB (1985). Highway capacity manual. TRB Special Report 209.Transportation Research Board TRB, Washington D.C., USA.
Ueberschaer, M.H. (1971). Choice of routes on urban networks for thejourney to work. In: Highway Research Record no. 369, Choice of travelmode and considerations in travel forecasting. Highway Research Board,Washington, D.C., USA.
Vaughan, R.J. (1987). Urban spatial traffic patterns. Pion Ltd. London,United Kingdom.
Vaziri, M. & Lam, T.N. (1983). Perceived factors affecting driver routedecisions. In: Journal of Transportation Engineering, Vol. 109, No.3, pp.297-311.
Wenger, M.J., Spyridakis, J.H., Haselkorn, M.P., Barfield, W. & Conquest,L. (1990). Motorist behaviour and the design of motorist informationsystems. In: Transportation Research Record 1281. TransportationResearch Board, Washington, D.C., USA.

SWOV Publication D-2001-11 43
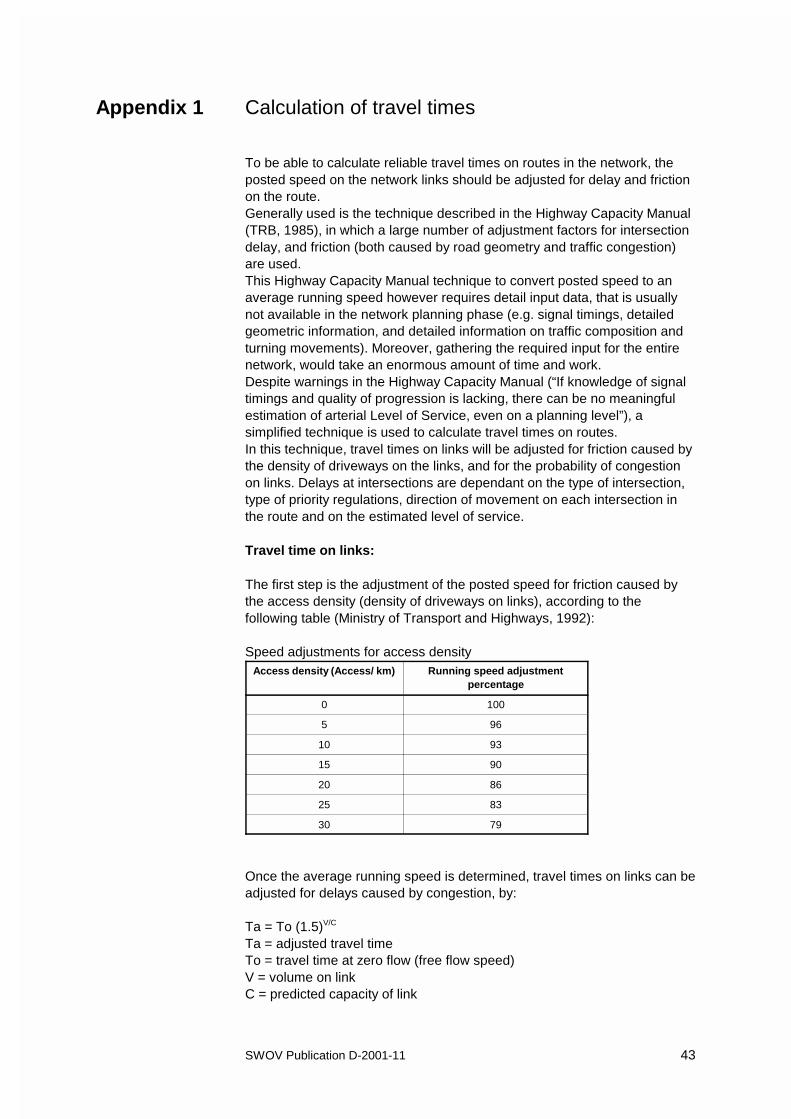
Appendix 1 Calculation of travel times
To be able to calculate reliable travel times on routes in the network, theposted speed on the network links should be adjusted for delay and frictionon the route.Generally used is the technique described in the Highway Capacity Manual(TRB, 1985), in which a large number of adjustment factors for intersectiondelay, and friction (both caused by road geometry and traffic congestion)are used.This Highway Capacity Manual technique to convert posted speed to anaverage running speed however requires detail input data, that is usuallynot available in the network planning phase (e.g. signal timings, detailedgeometric information, and detailed information on traffic composition andturning movements). Moreover, gathering the required input for the entirenetwork, would take an enormous amount of time and work.Despite warnings in the Highway Capacity Manual (“If knowledge of signaltimings and quality of progression is lacking, there can be no meaningfulestimation of arterial Level of Service, even on a planning level”), asimplified technique is used to calculate travel times on routes.In this technique, travel times on links will be adjusted for friction caused bythe density of driveways on the links, and for the probability of congestionon links. Delays at intersections are dependant on the type of intersection,type of priority regulations, direction of movement on each intersection inthe route and on the estimated level of service.
Travel time on links:
The first step is the adjustment of the posted speed for friction caused bythe access density (density of driveways on links), according to thefollowing table (Ministry of Transport and Highways, 1992):
Speed adjustments for access densityAccess density (Access/ km) Running speed adjustment
percentage
0 100
5 96
10 93
15 90
20 86
25 83
30 79
Once the average running speed is determined, travel times on links can beadjusted for delays caused by congestion, by:
Ta = To (1.5)V/C
Ta = adjusted travel timeTo = travel time at zero flow (free flow speed)V = volume on linkC = predicted capacity of link

44 SWOV Publication D-2001-11
Link capacities (vehicles per lane):
Freeway: 2000Expressway: 1800Major Distributor: 1200Minor Distributor: 1200Local: 1200
Delays at intersections:
Signalized intersections
Values based on Teply, S. & Evans, G.D. (1989).
Average delays (all directions) at signalized intersections:Delay Level of Service Average delay per vehicle (sec.)
Small A - B 10
Average C - D 15
Large E - F 25
Small delays: very low volumes or coordinated signals.
Priority intersections (both T-intersections and four legged intersections)
Values based on Brilon, W. & Grossmann, M. (1991).
Average delay at priority intersections:Direction, Level of Service Average delay per vehicle (sec.)
Priority vehicles 0
Non-priority vehicles, Level of ServiceA - B
15
Non-priority vehicles, Level of ServiceC - D
25
Non-priority vehicles, Level of ServiceE - F
45
All-way stop-controlled intersections (four-way stop and three-way stop)
Values based on: Kyte, Zegeer & Lall (1991).
Average delay (all directions) at all-way stop intersections:Level of Service Average delay per vehicle (sec.)
A - B 10
C - D 20
E - F 30

SWOV Publication D-2001-11 45
Roundabouts
Values based on Höglund (1991).
Average delay (all directions) at roundabouts:Level of Service Average delay per vehicle (sec.)
A - B 5
C - D 7
E - F 10
Input requirements Safer-TNP
The large differences in delay between priority and non-priority vehicles atpriority intersections, makes it necessary to indicate the priority direction atpriority intersections in the input of link and node information in Safer-TNP.E.g. node / is a priority intersection; the connecting links are a, b, c, and d;the priority direction is from link a to link c.Planet-GIS then has to take into consideration which direction is travel oneach intersection on the route (does the route follow the priority direction ornot).
Links require the following input information:- Link type (road category/ sub-category): Capacity can then have a
default value or, if requested, a user-specified value.- Posted speed (travel speed is calculated)- Access density (number of driveways per km).- Volume (average daily traffic and peak hour volume)- Number of lanes (capacity per road type is specified as peak hour
capacity per lane)- Link function (not directly needed for route man. and travel time)- Land use (not directly needed for route man. and travel time)
Intersections require the following input information:Step 1: Intersection type Step 2: Priority direction Step 3: Level of Service
a. Signalized Not relevant A - B(e.g. coordinated or shortcycle times)
C - D
E - F
b. Priority from link.... to link.... A - B
C - D
E - F
c. All-way stop Not relevant A - B
C - D
E - F
d. Roundabout Not relevant A - B
C - D
E - F

46 SWOV Publication D-2001-11
T-intersections and four-legged intersections can automatically be identifiedby Planet-GIS. Other intersection information is already specified in linkinformation
In the calculation of travel times and in the calculation of the fastest route,Planet GIS should also determine whether or not a certain route uses thepriority direction on a priority intersection!!!
Interrupted flow
If V/C ratio’s are higher than 0.85, the level of service is poor (Level ofService E or F). Flows are interrupted and travel speeds are reduced. Indesign this high levels should be avoided. In Safer-TNP, the V/C ratios inexisting situations and in situations after reassignment should therefore bechecked. If V/C ratio’s are higher than 0.85, the user should be warned forthe possibility of congestion or poor operations.Because the exact capacity can only be calculated in a detailed study of thespecific road section, Safer-TNP can not give the exact capacity for allnetwork elements. The user should be advised to check the networkelement in more detail of the V/C ratio is higher than 0.85 (“The V/C ratioon link/ intersection...... is very high. Are you sure the capacity is sufficientto accommodate the traffic volumes?”).
The following estimated values for the maximum capacity can be used(May, 1997; TRB, 1985).
Maximum capacity of different intersection types:Intersection type Capacity in vehicles/ day
Uncontrolled (priority to the right) 1,000 - 1,500
2-way stop/ 2-way yield 5,000 - 12,000
4-way stop 12,000 - 18,000
Roundabout single lane 20,000 - 28,000
multilane 35,000 - ? (1)
Signalized 20,000 - 80,000 (2)
(1) Varies from country to country(2) Depends on the number of lanes for the different movements
The abovementioned values are indications. The exact capacity ofintersections is highly dependant on the geometric design and thedistribution of volumes on the intersecting roads.The influence of the number of lanes on intersecting roads for yield- andstop-controlled intersections is small, because the capacity is mainlydetermined by gaps in the traffic stream on the major road.
Maximum link capacities (vehicles per lane, per hour):
Freeway: 2000Expressway: 1800Major Distributor: 1200Minor Distributor: 1200Local: 1200

SWOV Publication D-2001-11 47
To calculate the capacity in vehicles per hour, the abovementioned values(veh./day) can be divided by the peak hour factor (approximately 10). If theexact peak hour factor in a certain area is known, this value can be used. Ifthe exact value is not known a default value of 10 can be used.

SWOV Publication D-2001-11 49
Appendix 2 Route factor
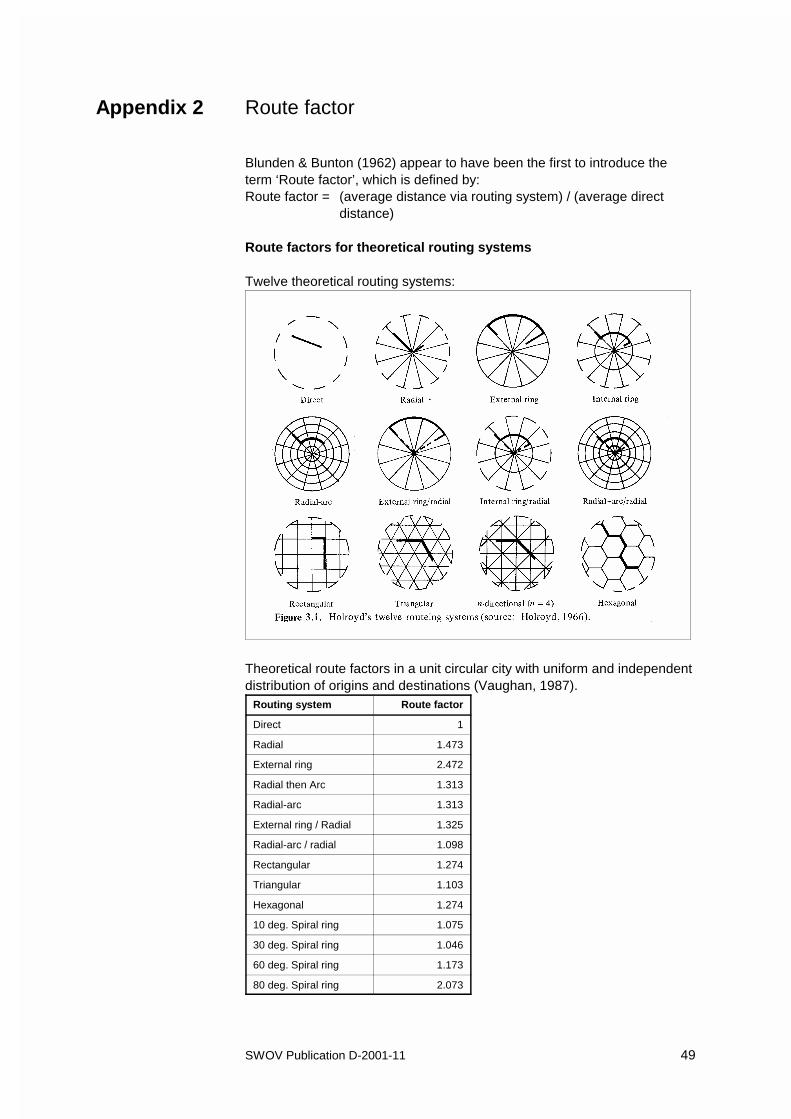
Blunden & Bunton (1962) appear to have been the first to introduce theterm ‘Route factor’, which is defined by:Route factor = (average distance via routing system) / (average direct
distance)
Route factors for theoretical routing systems
Twelve theoretical routing systems:
Theoretical route factors in a unit circular city with uniform and independentdistribution of origins and destinations (Vaughan, 1987).
Routing system Route factor
Direct 1
Radial 1.473
External ring 2.472
Radial then Arc 1.313
Radial-arc 1.313
External ring / Radial 1.325
Radial-arc / radial 1.098
Rectangular 1.274
Triangular 1.103
Hexagonal 1.274
10 deg. Spiral ring 1.075
30 deg. Spiral ring 1.046
60 deg. Spiral ring 1.173
80 deg. Spiral ring 2.073

50 SWOV Publication D-2001-11
Route factors for real networks (Smeed, 1971):
City / Cities Route factor
Central area London 1.27
Average for central area of Washington DCand six UK cities
1.27
Average for entire area of Washington DC andsix UK cities
1.27
Average for central area of six Australian cities 1.32
Average for entire area of six Australian cities 1.32
Preferred value of routing system or route:
From the examination of route factors, Vaughan (1987) concludes that arouting system or a specific route will have a chance of being realistic if ithas a route factor of about 1.3.This factor however is based on the average value of several randomlychosen origin-destination pairs. It can therefore be used as a preferredvalue for the network as a whole, but not for a preferred value for onespecific origin-destination relation.
Although it is difficult to judge when a single route can be called ineffective,the following table gives some indication.
Route factors for different tripsRouting system Internal trips Cross-cordon trips Through-trips
Direct 1 1 1
Radial 1.47 1.47 1.57
Internal ring
Rg= 0.50 1.42 1.36 1.4
Rg= 0.25 1.38 1.39 1.49
Rg= 0.00 1.47 1.47 1.57
Radial - arc 1.22 1.22 1.23
Radial - arc/ radial 1.1 1.1 1.07
Rectangular 1.27 1.27 1.27
If a calculated route factor for one specific route is larger than 1.57 (approx.0.6), one could say that the detour is larger than what can be expected onaverage.Proposed is to use the route factor value of 1.57 (approx. 0.6) as the valueabove which the user of Safer-TNP should be warned that the selectedroute could be ineffective. Whether this value is workable should bedetermined in pilot studies.