Roundup Ready Soybean Yield Drag, 1998
28
Evidence of the Magnitude and Consequences of the Roundup Ready Soybean Yield Drag from University- Based Varietal Trials in 1998 By Dr. Charles Benbrook Benbrook Consulting Services Sandpoint, Idaho Ag BioTech InfoNet Technical Paper Number 1 July 13, 1999
Transcript of Roundup Ready Soybean Yield Drag, 1998

Evidence of the Magnitude and Consequences of theRoundup Ready Soybean Yield Drag from University-
Based Varietal Trials in 1998
ByDr. Charles Benbrook
Benbrook Consulting ServicesSandpoint, Idaho
Ag BioTech InfoNet Technical Paper Number 1July 13, 1999

1
Ag BioTech InfoNet Technical Paper No 1
Executive Summary
Over half the soybeans planted in the United States in 1999 are varietiesgenetically engineered to tolerate applications of the broad-spectrum, contact herbicideglyphosate manufactured by Monsanto Company (Trade Name, Roundup). Just a smallfraction of soybeans produced in 1996 were “Roundup Ready” -- varieties able totolerate direct applications of glyphosate herbicide.
The rapid adoption of Roundup Ready (RR) soybeans has been unprecedented inthe history of American row-crop agriculture. No new genetic trait, nor any pesticide hasso dramatically gained market share in such a short period of time.
Roundup Ready soybeans have proven so popular with farmers because theygreatly simplify the task of managing weeds and help farmers avoid a variety of problemsassociated with other herbicide-based weed management systems. They have provenespecially popular among farmers who must complete weed management practices on atimely basis over hundreds to thousands of acres of soybeans.
The success of RR soybeans is remarkable in light of the magnitude of the so-called Roundup Ready “yield drag.” Under most conditions extensive evidence showsthat RR soybeans produce lower yields than possible if farmers planted comparable butnon-engineered varieties.
This report reviews the results of over 8,200 university-based soybean varietaltrials in 1998 and reaches the following conclusions regarding the magnitude of the RRsoybean yield drag –
• The yield drag between top RR varieties compared to top conventional varietiesaverages 4.6 bushels per acre, or 6.7 percent.
• When comparing average yields across the top 5 varieties tested in 8 states, theyield drag averages 4.1 bushels, or 6.1 percent.
• Across all varieties tested, the yield drag averages 3.1 bushels, or 5.3 percent.
• In some areas of the Midwest, the best conventional variety sold by seedcompanies produces yields on average 10 percent or more higher than comparableRoundup Ready varieties sold by the same seed companies.
It is important to place the RR soybean yield drag in perspective. From 1975 to1994 soybean yields rose on average about 0.5 bushels per year. In 1999 the RR soybeanyield drag could result in perhaps a 2.0 to 2.5 percent reduction in national averagesoybean yields, compared to what they would likely have been if seed companies had notdramatically shifted breeding priorities to focus on herbicide tolerance. If not reversedby future breeding enhancements, this downward shift in soybean yield potential couldemerge as the most significant decline in a major crop ever associated with a singlegenetic modification.
2
Ag BioTech InfoNet Technical Paper No 1
On whether RR soybean systems reduce pesticide use and increase grower profits,our analysis shows that –
• RR soybean systems are largely dependent on herbicides and hence are not likelyto reduce herbicide use or reliance. Claims otherwise are based on incompleteinformation or analytically flawed comparisons that do not tell the whole story.
• Farmers growing RR soybeans used 2 to 5 times more herbicide measured inpounds applied per acre, compared to the other popular weed managementsystems used on most soybean fields not planted to RR varieties in 1998. RRherbicide use exceeds the level on many farms using multitactic Integrated WeedManagement systems by a factor of 10 or more.
• There is clear evidence that Roundup use by farmers planting RR soybeans hasrisen markedly in 1999 because of the emergence of a degree of tolerance toRoundup in several key weed species, shifts in weeds toward those less sensitiveto Roundup, price cuts and aggressive marketing.
• Roundup use on soybeans may well double from 1998 levels within the next fewyears. But if current trends continue in the way RR technology is used, theefficacy and market share of Roundup may then fall just as quickly.
• The RR soybean yield drag and technology fee impose a sizable indirect tax onthe income of soybean producers, ranging from a few percent where RR varietieswork best to over 12 percent of gross income per acre.
The remarkable popularity of Roundup Ready soybeans, despite their cost and thesignificant yield drag associated with their use, is evidence of the difficulty and high costof today’s herbicide-dependent soybean weed management systems. The rapid evolutionof weeds better able to withstand applications of Roundup reinforces the need for moreintegrated, multiple tactic weed management systems.
3
Ag BioTech InfoNet Technical Paper No 1
A. Soybean Weed Management – A Never-Ending Challenge
Year in, year out dealing with weeds is the toughest pest management problemfacing soybean farmers. Perhaps the only tougher challenge facing growers is finding away to make a decent profit, especially in years like 1999 when surplus supplies and softdemand depresses prices.
Dr. Donald Wyse, a weed scientist at the University of Minnesota, highlights thedominant role weeds play in shaping Midwest row-crop farming systems --
“Weeds are the major deterrent to the development of more sustainableagriculture systems…[they] dictate most of the crop production practices (e.g.,tillage, herbicides, cultivation, row spacing)…It must be emphasized that currentcropping systems enhance weed populations, forcing farmers to use tillage orherbicide inputs to manage weed problems.” (Wyse, 1994)
Each year farmers have to deal with a few to a half-dozen species of grass weeds,and another few to half-dozen broadleaf weeds. It’s not a question of whether weeds willpose a threat to yields, but which ones and –
• How tough will they be to control?
• What impacts will control measures have, directly and indirectly, on the health ofsoybean plants and crop yields?
• What will weed management cost?
• How will weed management systems impact the environment and soil qualityboth near-term and over many years?
A poor weed management job in one year can make matters worse for years tocome. It takes years of careful attention to detail in weed management for farmers toreduce the number of weed seeds in the soil profile enough to make a significantdifference in the weed pressure in subsequent years. Even then, some weed seeds canmove great distances with the wind, so no farmer is in complete control of his or herweed management future.
Poor weed control costs farmers money and pride. There is nothing more visiblein a soybean field than a tall patch of foxtail or velvetleaf wafting in the breeze above thecrop canopy. When it comes time to harvest a field, patches of weeds can slow down thecombine and lead to uneven maturation and drying of the crop. Weeds also compete withthe growing crop for sunlight, water and nutrients. The greater the number of weeds,especially early in the season, the bigger the threat to yields.
4
Ag BioTech InfoNet Technical Paper No 1
Little Real Progress
Weeds pose roughly as much trouble for farmers in 1999 as they did in 1959,despite billions in expenditures on herbicides and hundreds of millions more invested inresearch, development and registration of new herbicides (Benbrook et al., 1996). Why?Because farms have gotten bigger and more specialized and many changes in agronomicpractices have actually tipped the playing field to the advantage of certain weeds.
To reduce soil erosion losses and to cover large acreage fast with minimaldemands on human labor, conventional farmers have all but abandoned some proven,non-chemical weed management tactics. For 40 years the USDA and soil conservationadvocates have supported the trend toward conservation or reduced tillage.
Primary tillage is carried out to kill or damage perennial weeds, bury weed seedsand prepare a seedbed but it also exposes the soil surface to the erosive effects of rainfalland wind, a disadvantage on highly erodible land. Tillage with lighter equipment, calledcultivation, is carried out after crops have emerged to help manage weeds. Cultivation isan effective, low-cost way to suppress weed populations and remains the back-bone ofnon-chemical weed management systems. Yet for a variety of reasons farmers havemoved away from even this sort of tillage. One of the major reasons is the trend towardnarrow row planting systems, solid seeded fields and no-tillage systems.
Another is that pulling steel across fields is expensive. It takes a lot of fuel andtillage equipment requires constant repair and maintenance. Plus, large machines areneeded to cover large farms quickly with limited labor inputs. The bigger the machine,the more capital tied up and the greater the pressure to cover more ground. It’s a viciouscircle that tends to lead farmers progressively away from multi tactic, non-chemical weedmanagement systems.
Integrated Weed Management systems are proven and profitable alternatives tosystems largely dependent on herbicides (Tillman, 1998; Drinkwater et al., 1998; see alsomultiple research reports from the Aldo Leopold Center for Sustainable Agriculture atIowa State University and annual progress reports from the Practical Farmers of Iowa,see http://www.agron.iastate.edu/pfi/). They can reduce reliance on herbicides and lowercosts with no loss of yields but they take planning, skill and commitment. Keycomponents for success include a proper rotation, tillage and planting systems designedto get crops off to a fast start, and mechanical cultivation to combat weeds when they aresmall and most vulnerable. Success depends on developing a good understanding of thebiological processes and cycles unfolding on the farm. Careful timing and considerableskill in the integration of multiple tactics is essential.
The human dimension is actually perhaps the dominant constraint. Individualswith the skill and experience needed to properly operate cultivation equipment do not yetqualify for the endangered species list, but their numbers are falling fast with no end insight. Money to pay wages is not the only issue since weed management costs haveclearly rising over the last 15 years. The $15.00 increase in per acre herbicide
5
Ag BioTech InfoNet Technical Paper No 1
expenditures on most farms would pay for two to three additional passes with acultivator.
Herbicides are the primary weed management tactic on 95 percent plus of the landgrowing soybeans because it has become easier to get the job done with herbicides thanwith multitactic systems. It has become easier because of years of public and privateinvestment in knowledge and infrastructure dedicated to the delivery and application ofherbicides, and years of relative neglect to research, education, and technologydevelopment dedicated to improving the ease and efficiency of non-chemical weedcontrol practices and systems. Priorities have not shifted in a vaccuum. Heavyadvertisement has reinforced the notion that “progress” equals applying the latestherbicide.
But even without much support from the private sector or public researchprograms, farmers practicing sustainable methods or producing for the organic markethave continued to refine non-chemical and reduced chemical weed management systemsand have cut the costs of weed management to half or less of some neighboring farmsusing herbicide-based systems (see the sections on weed management in PestManagement at the Crossroads, Benbrook, C. et al., 1996).
Moving Targets
Weeds have great capacity to adapt and evolve. Two Iowa State University weedscientists, Dr. Bob Hartzler and Dr. Doug Buhler, have studied one reason -- weedemergence patterns. In 1998 research, they found that different weeds emerge atdifferent points during the season.1 In Northeast Iowa, fall panicum first emerged 50days after initial emergence of giant ragweed. Across the state, there was almost a two-month span during which new weed species emerged.
The long period during which different species emerge for the first time is aspecial problem for farmers planting Roundup Ready soybeans. This is becauseRoundup works only on growing weeds. Farmers must wait for weeds to emerge toapply Roundup. But if they wait too long, weeds can get too big of a jump and some willonly be stunted by Roundup application, requiring a second treatment or application ofanother active ingredient.
Making matters worse, several weed species can germinate for a month or more,including some of the most difficult to control late season weeds like waterhemp andmorningglory. As a result, a properly timed early season application may miss soon-to-germinate weeds that can then cause problems later in the season.
Evolutionary changes in weeds have steadily pushed farmers to seek out “strongermedicine” in dealing with annual problem weeds. As a result, expenditures on herbicidesdoubled in the 1980s, rising from around $13.00 per acre in 1988 to over $26.00 per acre
1 For more information, see the extensive weed management resources on the Iowa State UniversityExtension weed management site at <http://www.weeds.iastate.edu/mgmt/qtr98-4/emergencepatterns.htm>.

6
Ag BioTech InfoNet Technical Paper No 1
(see “Table 1, Soybeans – Seed and Chemical Production Expenses in Corn Belt States,1975-1997,” Benbrook, 1999). Competition-driven price reductions starting in 1998 arelikely to keep expenditures on herbicides from rising for the next few years despiteincreased reliance and use.
Weed shifts and the emergence of tolerant and/or resistant weeds are the dominantmechanisms likely to undermine the long-term effectiveness of any herbicide-basedsystem that is relied upon too widely or intensively.2 Weed shifts reflect a change in therelative proportions of different weed species present in a field. The emergence of weedsresistant to a given herbicide, on the other hand, is a genetically-driven evolutionaryphenomenon which occurs within a species present in a field.
In the case of Roundup Ready soybeans, evidence has emerged already that suchshifts and natural adaptation are occurring. Iowa State University researchers havedocumented glyphosate resistance in waterhemp species (see footnote for source). Thisparticular species of weed is highlighted in the 1998 edition of the Weed Control Manualas the most worrisome “Up and Coming Weed” both nationwide and in the North Centralregion (Meister, 1998). Reasons why include the emergence of resistance to triazine andALS herbicides and its ability to withstand Roundup applications (for an up to dateoverview by Iowa weed scientist Bob Hartzler, see<http://www.weeds.iastate.edu/mgmt/qtr98-4/roundupfuture.htm>).
Soybean farmers in the Midwest are also reporting that velvetleaf and smartweedspecies are tolerating application rates of Roundup that were effective just last year.Over the next few years, weed scientists anticipate that the gradual shift toward weedspecies that can tolerate Roundup will continue, requiring farmers to change their mix ofpractices. If even a small percentage of growers respond instead by just increasing ratesof Roundup application and/or spraying more often, this could generate enough selectionpressure to lead to the emergence of genetically resistant strains of commonplace weeds.In all likelihood these strains would quickly spread and all growers would then have toswitch to other herbicides and control tactics.
Ironically the remarkable success of Roundup Ready soybeans in the marketplacesets the stage for problems in the field. Regardless of how well a given herbicide or weedmanagement system is working, tomorrow’s problem-weed is just around the corner. Themore uniform the weed management system in an area, the quicker new problem-weedsare likely to emerge. The greater a farmer’s reliance on herbicides, especially one or afew products, the more likely it becomes that resistance weed species will emerge. Theseare the lessons of weed management history that are not being adequately heeded as thebiotechnology revolution reshapes the American soybean industry.
2 For a good overview of these potential risks, see Dr. Mike Owen’s 1997 review of herbicide-toleranttechnology (Owen, 1998).

7
Ag BioTech InfoNet Technical Paper No 1
B. Methods to Compare Yields
Two major methods are used to compare the yields of Roundup Ready soybeanvarieties to the yields of non-engineered soybeans. One involves comparing averageyields across many different trials, or across many farms. The problem with suchcomparisons is that many variables are not controlled. Average yield differences mightbe explained by genetic difference or by other factors.
The most accurate method is to compare yields in properly conducted side-by-side trials carried out with near-isogenic lines3 that differ only in the possession of theglyphosate-tolerance gene. Such trials are the most reliable way to isolate theconsequences of genetic differences, all other things being equal.
Most land grant universities in states with significant acreage of soybeans carryout soybean yield trials to provide farmers with impartial, accurate data on theperformance of different varieties. (Internet-accessible sources of land grant universitysoybean trial data are listed in the references). The trials are typically conducted indifferent regions of a state and cover different maturity groups4. In some states, trials arecarried out using a variety of tillage and planting systems.
In this report we compare soybean yield trial data from university trials, the mostimpartial data available. We have drawn heavily on a University of Wisconsin analysisof over 8,200 soybean yield trials carried out in eight states in 1998. This definitiveassessment of the Roundup Ready soybean yield drag was done by Dr. E. S. Oplinger,Dr. M. J. Martinka, and Dr. K. A. Schmitz and is entitled “Performance of TransgenicSoybeans in the Northern U.S.” 5
State Varietal Trial Results
In Tables 1 and 2 we report the differences in the yields of Roundup Ready(“RR”) in contrast to conventional (“Conv”) varieties in eight states, drawing on the datareported in the Oplinger summary report. Each table offers three comparisons – trialmeans across all varieties, the mean of the top five varieties tested, and the top varietiestested.
Table 1 reports bushels harvested per acre and Table 2 presents the RR yield dragin two ways – the difference in bushels per acre between the Roundup Ready varietiesand conventional varieties, and second, as a percent of the yield of conventional varieties.
3 By “near identical isogenic lines” we mean two varieties that are nearly identical in terms of their geneticmakeup, except for the insertion of a specific gene or trait.4 Soybean varieties are often sold and studied within “maturity groups.” In general, the longer the maturityperiod for a variety, the higher the expected yields. It is therefor inappropriate to compare the yieldsharvested of a long season variety in contrast to a short season one.5 This paper is accessible online at http://www.biotech-info.net/soybean_performance.pdf. The summarytable from this paper is accessible at http://www.biotech-info.net/yield_performance.pdf. A slidepresentation by Dr. Oplinger further summarizing their findings is accessible athttp://www.uwex.edu/ces/soybean/slides/1998%20ASTA%20Expo/sld001.htm.

8
Ag BioTech InfoNet Technical Paper No 1
Oplinger data show that the –
• RR soybean yield drag ranges from 0 percent to 10 percent among the topvarieties and averages 7 percent, or 5 bushels per acre.
• Across the top 5 varieties tested, the yield drag ranges from 0 percent to 11percent, and averages 6 percent.
Conv RR Conv RR Conv RRIllinois 58 60 65 65 67 67Iowa 61 57 64 60 66 60Michigan 66 64 74 69 78 70Minnesota 66 61 73 67 74 69Nebraska 58 51 65 58 66 60Ohio 60 58 67 63 69 65South Dakota 49 44 54 50 56 51Wisconsin 71 69 85 82 87 84
Table 1. Roundup Ready (RR) Soybean Yield Compared to Conventional (Conv) Varieties in Eight States, 1998 [Bushels per Acre]
Source: 'Performance of Transgenic Soybeans - Northern U.S. ', E.S. Oplinger, M.J. Martinka, K.A. Schmitz. For details by State, see Table 1. Yield Performance of "Roundup Ready" vs. Conventional (CN) Soybean Varieties in the Northern U.S., 1998
Trial Mean Top Five Varieties Top VarietyStates

9
Ag BioTech InfoNet Technical Paper No 1
Oplinger and colleagues end their report with a prediction and straightforwardconclusion from their analysis of the RR soybean yield drag in 1998 –
“It is anticipated that soybean growers will continue to increase acresplanted to RR varieties and will sacrifice maximum yield for ease of weedcontrol.” (Oplinger et al., 1999).
2. Yield Drag Estimates by Seed Company
A second way to estimate the RR soybean yield drag is to compare the bestconventional variety offered by a given seed company in a given maturity group to thebest Roundup Ready variety in the same or a similar maturity group. In many cases, the
Trial MeanTop Five Varieties
Top Variety
Illinois 2.0 0.0 0.0Iowa -4.0 -4.0 -6.0Michigan -2.0 -5.0 -8.0Minnesota -5.0 -6.0 -5.0Nebraska -7.0 -7.0 -6.0Ohio -2.0 -4.0 -4.0South Dakota -5.0 -4.0 -5.0Wisconsin -2.0 -3.0 -3.0
Average Eight States
-3.1 -4.1 -4.6
Trial MeanTop Five Varieties
Top Variety
Illinois 3.4% 0.0% 0.0%Iowa -6.6% -6.3% -9.1%Michigan -3.0% -6.8% -10.3%Minnesota -7.6% -8.2% -6.8%Nebraska -12.1% -10.8% -9.1%Ohio -3.3% -6.0% -5.8%South Dakota -10.2% -7.4% -8.9%Wisconsin -2.8% -3.5% -3.4%
Average Eight States
-5.3% -6.1% -6.7%
Bushel per Acre Yield Difference, Conventional to RR Varieties --
Table 2. Roundup Ready (RR) Soybean and Conventional Variety Yields by State, 1998
Source: 'Performance of Transgenic Soybeans - Northern U.S.' , E.S. Oplinger, M.J. Martinka, K.A. Schmitz. For details by State, see Table 1. Yield Performance of "Roundup Ready" vs. Conventional (CN) Soybean Varieties in the Northern U.S., 1998
States
Percent Yield Drag per Acre --States

10
Ag BioTech InfoNet Technical Paper No 1
only difference between the two varieties is the insertion of the genetic material thatmakes the Roundup Ready variety able to survive applications of Roundup herbicide.This sort of comparison comes closest to isolating the physiological impacts of thegenetic transformation required to make the soybean plant tolerant to applications ofglyphosate herbicide. These impacts are the cause of RR soybean yield drag. Seed andbiotechnology companies are working hard now to find ways to retain tolerance toglyphosate without adversely effecting the ability of the soybean plant to grow andprotect itself against pathogens, insects and other sources of stress.
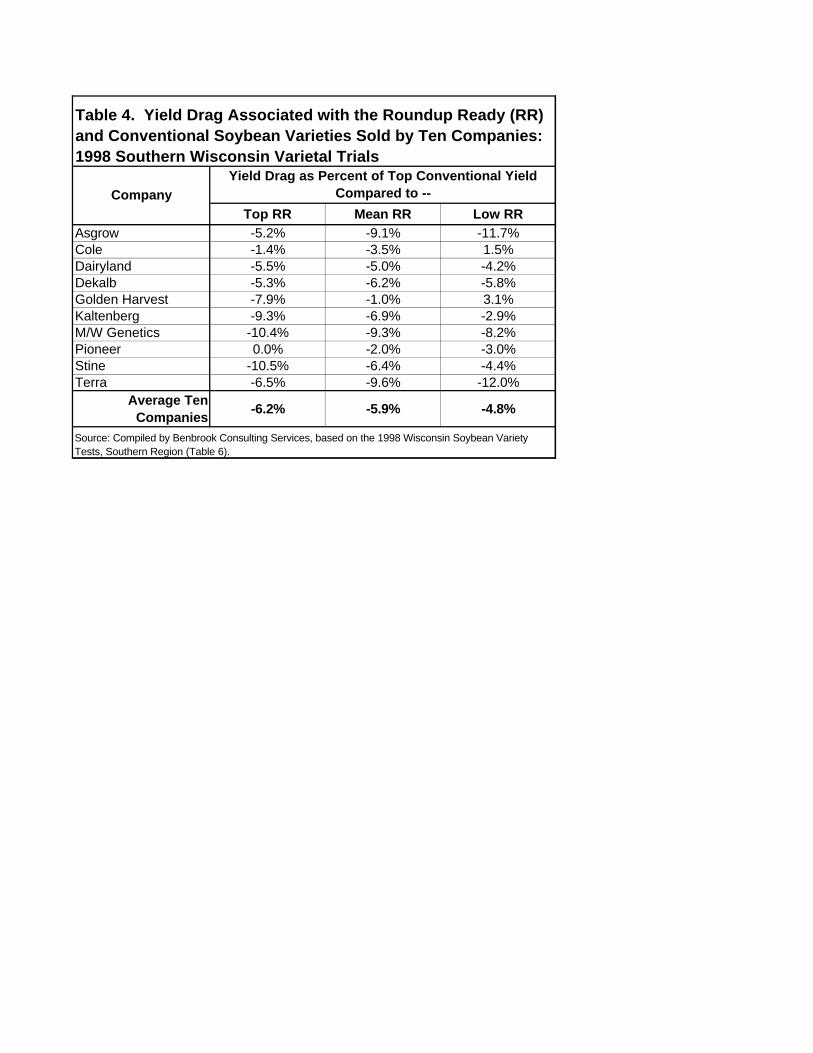
We reviewed detailed state trial data from tests carried out in Southern Wisconsin(Tables 3 and 4) and in central and southern Minnesota (Tables 5 and 6). For 10 seedcompanies selling both RR and conventional soybean varieties in Southern Wisconsin,Table 3 reports differences in yields for the top RR variety in contrast to the topconventional, the mean RR to the mean conventional, and the lowest yielding RRcompared to the lowest yielding conventional. Because of their size, Tables 3, 4, 5, 6 and7 appear at the end of this document.
The average Roundup Ready yield drag in Southern Wisconsin across these 10companies was –
• 4.7 bushels, or 6.2 percent in the case of the top RR and conventional variety;
• 4.4 bushels, or 5.9 percent in the case of the mean RR and conventional variety;and
• 3.5 bushels, or 4.8 percent at the low-end of the yields.
Note how consistent these findings are compared to the percentage differencesreported in Table 2. Yield comparisons across 8 states, and in Southern Wisconsin acrossthe soybean varieties offered by 10 companies tell the same story. The RR yield dragamong the top variety tested is 6-7 percent and the yield drag is consistently greateramong the higher yielding varieties in contrast to average ones.
Table 4 captures just the percent differences in yields across the 10 companiesbased on trials conducted in Southern Wisconsin.
In central Minnesota testing (see Table 5) the RR soybean yield drag averaged13.1 percent, or 9.3 bushels per acre across 14 comparisons. Again, the comparisons arebetween the highest yielding RR variety in a given maturity group to the highest yieldingconventional variety in the same or very similar maturity group. In 3 of 14 cases theyield drag exceeded 20 percent. In this part of Minnesota, the highest yield drag was 27percent and the lowest was 3 percent.
Table 6 reports the same data in southern Minnesota, a major soybean producingarea where many more varieties are offered for sale. This table again matches the top RRand conventional varieties by company within a maturity group. In this region theaverage yield drag was much smaller, only 2.8 percent across 50 comparisons.

11
Ag BioTech InfoNet Technical Paper No 1
Differences in yields were also much more variable, ranging from a yield advantage of 18percent to a yield drag of 15 percent. This variability suggests that in several casesgenetic characteristics other than tolerance to Roundup herbicide differed across thevarieties compared. Future comparative assessments of yield performance should striveto control for other genetic differences, a task that will require contacting individual seedcompanies to request information on the differences between varieties.
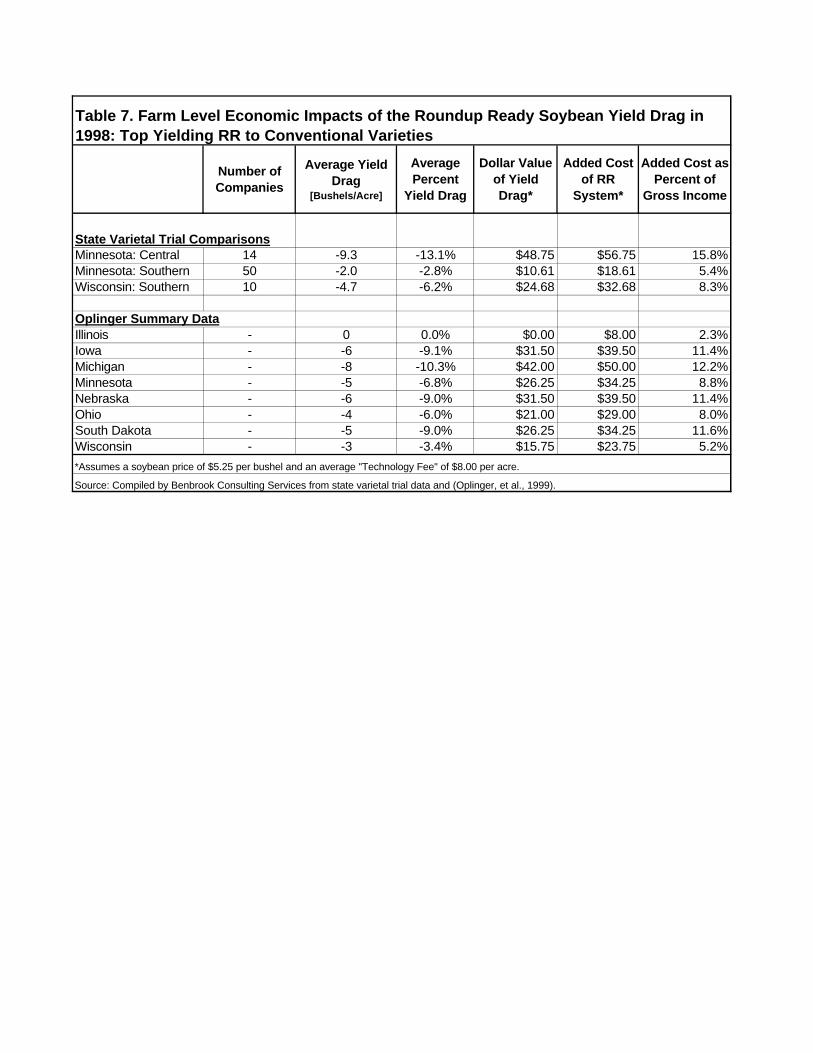
Economic Impacts of the RR Yield Drag
Table 7 projects the farm-level economic impacts of the yield drag associatedwith the planting of Roundup Ready soybean varieties. Note the table does not addressdifferences in herbicide expenditures or in other facets of weed management. It simplyplaces into perspective the two relatively easy-to-measure consequences of planting RRsoybeans – the yield drag and the technology fee.
The average yield drag in bushels per acre appears in the second column, and as apercent of conventional yields in the third. The dollar value of the yield drag is based ona soybean price of $5.25 per bushel. The “Added Cost of the RR System” is the sum ofthe “Dollar Value of Yield Drag” plus the average $8.00 technology fee associated withthe planting of an acre of RR soybeans. The last column expresses the added cost as apercent of gross income.
In four of eight states, farmers choosing to plant Roundup Ready soybeansincurred added costs equal to over 10 percent of gross income per acre. The added cost islowest in Illinois, where it averaged about 2.3 percent of gross income per acre, andhighest in Michigan, at $50.00 per acre or over 12 percent of gross income.
The added costs associated with Roundup Ready varieties are sizable compared tototal seed plus herbicide expenditures, which typically run about $45.00 to $60.00 peracre. Accordingly, for some farmers the decision to grow RR soybeans may come closeto doubling the cost of seed plus weed management systems when both the direct andindirect consequences of growing RR soybeans are taken into account. In Illinois and onsome farms throughout the Midwest, RR varieties perform as well or even better thanconventional varieties, despite the yield drag associated with all varieties. Seed andbiotechnology companies are working to understand why. Answers will no doubt guidefuture efforts to bred improved varieties for the western and northern Cornbelt or tomodify agronomic practices to better exploit the genetic yield potential in RR varieties.
Clearly, additional factors need to be taken into account to come up with acomplete assessment of the economic impacts of RR soybeans. The amount of moneyspent on herbicides per acre varies widely across the Midwest and as a function ofagronomic practices and field conditions. Most data suggest that those farmers using RRsoybean systems with greatest success under conditions of relatively low weed pressurecan get by with one application per year and costs somewhat below the average.

12
Ag BioTech InfoNet Technical Paper No 1
But an increasing number of farmers need two applications of Roundup and oneof at least one additional active ingredient. There are little or no herbicide cost-savingson such farms relative to growers planting conventional varieties and using IntegratedWeed Management. A myriad of price incentives, volume discounts, product guaranteesand rebates has made it very difficult to compare the actual costs of herbicide basedsystems and will continue to plague those making such comparisons for some time tocome.
3. USDA Survey Data
Each year the U.S. Department of Agriculture (USDA) carries out an AgriculturalResource Management Study (ARMS) that includes surveys of agricultural chemical useand cropping practices in each state. On June 25, 1999 the USDA’s Economic ResearchService (ERS) released an analysis of 1996, 1997, and 1998 ARMS survey data entitled“Genetically Engineered Crops for Pest Management.”6 This short report contains threetables that have led to much discussion and many misleading statements.
The first table in the ERS report covers the percent of acres planted to Bt-transgenic and herbicide tolerant varieties since 1996, as well as the percent ofproduction. The data is organized by regions and aggregated to cover “All SurveyedStates.”
In the case of herbicide-tolerant soybeans, acres planted to Roundup Readysoybeans are combined with acres planted to sulfonylurea and imidazolinone tolerantsoybeans. Accordingly, it is not possible to isolate the growth in acres planted toRoundup Ready varieties, even though it is widely accepted that most of the increase inacres planted to herbicide tolerant varieties have involved Roundup Ready seed.
In all surveyed states, the percent of soybean acres planted to herbicide tolerantvarieties rose from 7.4 percent in 1996 to 44.2 percent in 1998. In crop season 1999 atleast 50 percent of the nation’s soybeans are Roundup Ready (personal communication,Dr. Matt Liebman, Iowa State University).
Table 2 in the ERS report covers mean yields on acres planted to transgenicvarieties compared to mean yields from acres planted to all other seeds. The Tablereports the percent difference in mean yields on farms adopting the technologiescompared to those planting all other seeds. In the case of herbicide-tolerant soybeans, theyield differences vary from an 8 percent yield drag in the Eastern Uplands region in 1998to a 24.2 percent yield advantage in the Prairie Gateway region in 1998.
In a preface to the tables, the authors of the ERS report state several caveats aboutusing mean yields from survey data to compare the genetic potential of different crop
6 The report is accessible on the Internet through the ERS “Issues Center – Biotech,” athttp://www.econ.ag.gov/whatsnew/issues/biotech/ A link to this report and analysis of it can be found onthe Ag BioTech InfoNet website at http://www.biotech-info.net/bt-transgenics.html, under “GeneralDiscussion and Opinions.”
13
Ag BioTech InfoNet Technical Paper No 1
varieties. The authors state appropriately that conditions other than the geneticdifferences between Roundup Ready and conventional seed varieties might account forsome or all the observed differences in yields. The authors conclude that –
“Thus, differences between mean estimates for yields and pesticide use fromsurvey results cannot necessarily be attributed to the use of genetic engineeringtechnology since the results are influenced by many other factors not controlledfor, including irrigation, weather, soils, nutrient and pest management practices,other cropping practices, operator characteristics, pest pressures, and others.”(“Caveats About Using Comparisons of Means,” ERS report, “GeneticallyEngineered Crops for Pest Management”)
We concur with the ERS analysts. The only reliable conclusions one can drawfrom the ERS data are that –
• the acreage devoted to herbicide tolerant varieties is growing (not disputed);
• soybean yields on farms growing herbicide tolerant seed compared toconventional seed have varied greatly from year to year and from one region toanother; and
• there have been modest shifts in the reliance on herbicides as measured by acre-treatments.
It is impossible to tell from the data reported by ERS what portion of thevariability in yields is attributed to natural factors like soil, weather and pest pressure, ormanagement factors, in contrast to genetic differences in the seed planted. It is likely, forexample, that Roundup Ready adopters include a higher percentage of farmers who areaggressive managers covering large acreage. The bigger the farm, the greater theeconomic value of the flexibility inherent in Roundup Ready systems. Adopters may alsochoose to plant the higher-priced Roundup Ready seeds on their better land. Clearly,more detailed analyses will be required to understand more fully the differences betweenthe agronomic practices and pest management systems on farms planting RR soybeans incontrast to conventional varieties.
4. Why Roundup Ready Varieties Sometimes Out-Yield ConventionalSoybeans
No one or no seed company claims that the insertion of the genes conferringresistance to Roundup into a soybean variety increases the variety’s genetic yieldpotential, other things being equal. Still, on some farms in some regions and in sometrials, Roundup Ready soybeans out-yield otherwise similar conventional varieties.Indeed, this is one of the major reasons they have proven so popular with farmers. It isimportant to understand why this occurs in order to accurately project the magnitude ofthe Roundup Ready yield drag under truly comparable conditions.

14
Ag BioTech InfoNet Technical Paper No 1
Seed companies have worked hard to insert the RR gene and trait into their bestcommercial varieties for various soil types and maturity groups. There are two ways thatthe RR soybean version of these best commercial varieties could produce higher yields --
• More effective weed control than otherwise attainable; and/or
• Less crop injury from applications of other herbicides or weed managementpractices like cultivation.
In most RR soybean systems growers must tolerate a certain degree of early-season weed pressure. To work, Roundup must be applied to green, growing weeds.Optimal results with RR beans require careful timing of the first application. If theapplication is made soon after weeds germinate, the farmer will avoid setting the cropback but might suffer some yield loss from later season weed pressure. Sometimesfarmers have to apply a second application of Roundup to clean up fields, increasing thecost of the system and causing some damage to plants. The need for a second applicationcan be avoided by delaying the first application, but this risks a certain degree of earlyseason weed competition. Hence, RR weed management systems that rest solely onRoundup applications are likely to result in weed competition at least as great as in otherwell-managed systems.
In the field, farmers have come to expect a very high level of weed control,expectations reinforced by the proliferation of new chemistry, emergence of herbicide-tolerant varieties, and the marketing and performance guarantee programs offered byherbicide manufactures. Major across-the-board price reductions since 1997 are anotherfactor leading to increased rates of application. In early 1998 Monsanto announced abouta 25 percent reduction in the price of Roundup. Soon thereafter Dupont and AmericanCyanamid announced comparable, and in some cases even steeper reductions in theprices of their competing herbicides, as they struggled to slow the loss of market share toRoundup.
And so most experts agree that greater seed and product choice and lowerherbicide prices has resulted in very aggressive and generally successful soybean weedmanagement in recent years. If weed pressure and competition does not account formuch of the observed differences in yields between RR and conventional varieties, whatdoes?
Most farmers not using a Roundup Ready based system are applying eithersulfonylurea or imidazolinone herbicides. Most university soybean trials also incorporateroutine applications of these products in their side-by-side comparisons. Theseherbicides are known to cause some stunting and damage to soybeans early in the season,as clearly documented in the extensive performance trials carried out in 1998 by IowaState University scientists.7 Soybeans grown in areas with long seasons tend to be better
7 Go the Iowa State University extension weed mamangement homepage at http://www.weeds.iastate.edu/and then to the section “1998 Weed Research Results Now Online.” At each of several locations aroundthe state, different teams of researchers carried out multiple trials assessing herbicide performance. Many

15
Ag BioTech InfoNet Technical Paper No 1
able to overcome early season soybean herbicide injury, although a variety ofenvironmental and chemical interactions can undermine this capacity.
These highly-active herbicides can also reduce soybean yields through othermechanisms such as lessening the availability of phosphorous or impairing the plant’simmune response. But regardless of the mechanism – direct injury or indirect soilecosystem or plant health impacts – it is clear that Roundup Ready systems sometimesproduce higher yields because they avoid some of these problems associated with otherherbicides. For this reason the RR yield drag is actually somewhat greater than suggestedby current university trials. To more accurately isolate the magnitude of physiologicalRR yield drag under various conditions, university trials should be extended to includecomparison plots where Integrated Weed Management and non-chemical systems areused.
The Devil in Weed Management Details
In general the better the growing season and the more even the crop stand, thebetter the chance that the soybean crop will fully recover from early season weedpressure and/or herbicide-based crop injury.
But all sorts of complicated interactions can arise between herbicides, surfactants,insecticides, application methods and timing, weather, tillage methods and soilconditions. These interactions sometimes create unforeseen problems. Wet and coolsprings can delay the microbial degradation of herbicides and increase carry-overdamage, while also slowing crop emergence and favoring certain hard to control weeds.Dry years can undermine the efficacy of certain herbicides and enhance the odds of awhole new set of adverse interactions. Soils with low pH levels can cause problems, ascan mixing herbicides with certain soil insecticides.
These interactions are, moreover, inherently unpredictable. Their adverseconsequences – and impact on the farmer’s bottomline – are often unavoidable once theconditions set the interactions in motion. Farmers have so eagerly adopted RoundupReady soybean technology, despite higher costs and evidence of a yield drag, in order toavoid these headaches and periodic losses. It is also why seed and biotechnologycompanies have bred IMI (imidazolinone) and STS (sulfonylurea) herbicide-tolerantsoybean varieties -- to avoid soybean crop injury either from direct applications toherbicide tolerant seeds or carry-over from cornfields treated the year before with theseoften very persistent herbicides.
C. Impacts of Roundup Ready Soybean Systems on Pesticide Use
The benefit of planting a herbicide-tolerant variety is to gain added flexibility inwhen herbicides can be applied. Growers spending the extra money on herbicide tolerant
studies were designed to determine optimal ways to incorporate residual pre- or post-plant herbicides intoRR soybean systems. Early season injury to soybean plants from other herbicides is a recurrent focus ofresearchers and a growing concern among farmers.

16
Ag BioTech InfoNet Technical Paper No 1
seeds have made an implicit decision to largely rely on herbicides as their major weedmanagement tool. Hence, it is no surprise that reliance on herbicides is greater inherbicide tolerant systems compared to Integrated Weed Management systems thatinclude non-chemical practices such as rotations, cultivation, and use of cover crops.
Roundup Ready soybeans are a new technology. The first significant acreage wasplanted in 1997. Adoption rose dramatically in 1998 and is expected to grow further in1999. Still relatively few acres have been planted to Roundup Ready soybeans more thantwo times, so it is way too early to determine the severity and impacts of weed shifts andresistance on pesticide use.
Still, the signs are not encouraging. Slipping efficacy is being reported byfarmers across the Midwest, especially in control of velvetleaf and ragweed species.8
Many are reporting inadequate control of these weeds after applying Roundup Ultra at arate of 24 ounces per acre (0.75 pounds active ingredient) but good control at 32 to 48ounces per acre. A rate of 24 ounces worked acceptably well on these weeds in mostregions of the Midwest in 1996 and 1997.
Weed shifts are occurring, perhaps rather swiftly and even the first case of RRsoybean induced resistance – in waterhemp species – is either here or just around thecorner. So regardless of whether RR soybeans have reduced reliance and use in 1996-1998, it is clear that both are rising and will continue to do so until more balanced,multitactic weed management systems become the norm.
Reliance on Herbicides
Both in the near-term and longer-run it is tricky to measure changes in reliance onand use of herbicides. No single measure of herbicide use is a reliable indictor ofreliance. Pounds applied per acre is misleading because some herbicides are effective atjust a fraction of an ounce per acre while others require applications well over 1 poundper acre.
The biological activity and persistence of herbicides also vary greatly, as does thetoxicity of herbicides. Accordingly, it is difficult to reach reliable judgements regardingchanges in herbicide use without an in-depth look at just what changes have occurred,both in terms of the products applied, how often they are applied, and their rates ofapplication. These data, coupled with measures of herbicide toxicity and persistence,make it possible to reach conclusions regarding changes in reliance over time and therisks stemming from herbicide use.
While the planting of RR soybeans will sustain a high level of reliance onherbicides, there are two ways on a given farm that Roundup Ready soybean systems canreduce herbicide "use."
8 For example, see several posts by farmers between July 4 and July, 9 1999 on the “IPM Talk” discussionsection of AgOnline, http://www.agriculture.com/scgi/Agtalk/. Click on “IPM Talk” and review messageson the topic “reduced rate herbicides.”

17
Ag BioTech InfoNet Technical Paper No 1
First, growers might switch from "old" chemistry herbicides that are applied at 1.5to 3.0 pounds active ingredient per acre to Roundup-based system involving maybe .75 to1.5 pounds of Roundup per acre. Farmers using some of the new low-dose materials, orplanting STS soybeans (soybeans resistant to sulfonylurea herbicides) can sometimesachieve excellent control with less than one-tenth pound of active ingredient per acre.
Such reductions in herbicide use, measured by acre-treatments or pounds applied,are brought about by the switch to more biologically-active and persistent chemistryeffective at lower use rates, not through reduction in reliance on herbicides.
An example -- RR soybean systems in 1998 required, on avergae, about 1.0 poundactive ingredient per acre. This level of use is 10- to 20-times greater than the herbiciderequired with conventional seeds on farms using sulfonylurea herbicides, and is at least 5times more active ingredient than several of the new low-dose herbicides likesulfentrazone. Hence, any claims that RR soybeans reduce herbicide use are incompletewithout the phrase "...reduced COMPARED TO WHAT??" If the goal is minimizingherbicide use there are clearly far better – and cheaper -- ways for farmers to moveforward.
Use Trending Upward
Experience in the field in 1999 suggests strongly that use of Roundup this yearwill rise perhaps 15 percent to 25 percent above 1998 in terms of average pounds ofRoundup applied per acre. In 1998 USDA data show that the average rate per crop yearfor Roundup on soybeans was 0.92 pounds and there were on average 1.3 applicationsper acre. In 1999, use will trend upward to perhaps 1.6 applications per acre and 1.2pounds per acre on average.
To place this level of Roundup use in perspective, in 1998 well less than 0.5pounds of herbicide were applied to the vast majority of soybean acres not treated withRoundup. On perhaps 15 percent to 20 percent of the acres, the rate was well under 0.25pounds. So compared to these systems, RR soybeans are heavily herbicide dependent.Moreover, because of weed shifts, resistance, price cuts and aggressive marketing,Roundup use is bound to rise sharply in the next few years, hastening the day whenfarmers will be forced to seek new solutions.
What comes next is the soybean farmer’s $64,000.00 question. It remains to beseen whether any company or public research institution will come forward with answersthat cut to the core of soybean weed management challenges. In the current economic andpolicy climate, this vital task might be left to growers themselves.

Bushels per Acre
Percent Yield Drag
AsgrowTop RR AG 2301 2.3 73Top Conventional A 2553 2.5 77
Mean RR - - 70Mean Conventional - - 77
Low RR AG 1901 1.9 68Low Conventional A 2553 2.5 77
ColeTop RR Dyna-Gro 3266RR 2.5 73Top Conventional Dyna-Gro 3252 2.5 74*
Mean RR - - 69.3Mean Conventional - - 71.8
Low RR Dyna-Gro 3214RR 2.1 67Low Conventional Dyna-Gro 3233 2.5 66
DairylandTop RR DSR-215/RR 2 69*Top Conventional DST2124 2 73*
Mean RR - - 68.7Mean Conventional - - 72.3
Low RR DSR-293/RR 2.8 68Low Conventional DSR-277 2.8 71
DekalbTop RR RR 2300 2.3 72Top Conventional CX 253 2.5 76
Mean RR - - 68.1Mean Conventional - - 72.7
Low RR CX 256RR 2.5 65Low Conventional CX 230 2.3 69
Golden HarvestTop RR X 198RR 1.9 70Top Conventional X 251 2.4 76
Mean RR - - 68Mean Conventional - - 68.7
Low RR H-1238RR 2.3 67*Low Conventional H-1184 1.8 65*
KaltenbergTop RR KB 215RR 2.1 68Top Conventional KB 248 2.4 75
Mean RR - - 67.5Mean Conventional - - 72.5
Low RR KB 249RR 2.4 67Low Conventional KB 214 2.1 69
-9.1%
-4
-3.6
-4
-4
-4.5
-5.5%
-1
-2.5
1
-3
3.1%
-6
-0.7
2
-7
-5
-2
-5.8%
-7.9%
-1.0%
-9.3%
-6.9%
-2.9%
Company
-4
-3.5%
1.5%
-5.0%
-4.2%
-5.3%
-6.2%
Table 3. Performance of Roundup Ready (RR) and Conventional Soybean Varieties by Company, 1998 Varietal Trials in Southern Wisconsin
-5.2%
-11.7%
-1.4%
-7
-9
Yield Difference: Conventional to RR
YieldMaturity Group
Variety

Bushels per Acre
Percent Yield Drag
Company
Table 3. Performance of Roundup Ready (RR) and Conventional Soybean Varieties by Company, 1998 Varietal Trials in Southern Wisconsin
Yield Difference: Conventional to RR
YieldMaturity Group
Variety
M/W GeneticsTop RR G 2445RR 2.4 69Top Conventional G 2380 2.3 77
Mean RR - - 68Mean Conventional - - 75
Low RR G 2210RR 2.2 67Low Conventional G 2711 2.7 73
PioneerTop RR 92B71 2.7 69Top Conventional 92B61 2.6 69
Mean RR - - 66Mean Conventional - - 67.3
Low RR 92B01 2 64Low Conventional 92B23 2.2 66
StineTop RR 2091-4 2 68*Top Conventional 2499-0 2.4 76
Mean RR - - 67Mean Conventional - - 71.6
Low RR 1980-4 1.9 65Low Conventional 2500 2 68
TerraTop RR E 1980RR 1.9 72Top Conventional E 248 2.4 77
Mean RR - - 68.7Mean Conventional - - 76
Low RR TS 253RR 2.5 66Low Conventional TS 277 2.7 75
-4.7 -6.2%-4.4 -5.9%-3.5 -4.8%
-2
-9.6%-7.3
-8
-5
-9
-8.2%
0.0%
Average Ten Companies
-6
-8
-7
0
-1.3
-3
-4.6
-3.0%
-2.0%
-10.4%
-9.3%
-10.5%
-6.4%
-4.4%
-6.5%
-12.0%
*More than one variety produced the same yield.
Source: Compiled by Benbrook Consulting Services, based on the 1998 Wisconsin Soybean Variety Tests, Southern Region (Table 6).
Top RR & ConventionalMean RR & Conventional
Low RR & Conventional
Top RR Mean RR Low RRAsgrow -5.2% -9.1% -11.7%Cole -1.4% -3.5% 1.5%Dairyland -5.5% -5.0% -4.2%Dekalb -5.3% -6.2% -5.8%Golden Harvest -7.9% -1.0% 3.1%Kaltenberg -9.3% -6.9% -2.9%M/W Genetics -10.4% -9.3% -8.2%Pioneer 0.0% -2.0% -3.0%Stine -10.5% -6.4% -4.4%Terra -6.5% -9.6% -12.0%
Average Ten Companies
-6.2% -5.9% -4.8%
Yield Drag as Percent of Top Conventional Yield Compared to -- Company
Source: Compiled by Benbrook Consulting Services, based on the 1998 Wisconsin Soybean Variety Tests, Southern Region (Table 6).
Table 4. Yield Drag Associated with the Roundup Ready (RR) and Conventional Soybean Varieties Sold by Ten Companies: 1998 Southern Wisconsin Varietal Trials

Bushels per Acre
Percent Yield Drag
CroplanRoundup Ready RT1557 9/17 58Conventional L1475 9/18 60
DairylandRoundup Ready DSR-152/RR 9/20 61Conventional DSR-180/STS 9/20 69
KrugerRoundup Ready K-14RR 9/21 62Conventional K-1990 9/20 70
KSC/ChallengerRoundup Ready K-10RR 9/15 57Conventional K-1414 9/17 69
MustangRoundup Ready M-111 9/17 61Conventional M-1160 9/18 70
MustangRoundup Ready M-144 9/20 63Conventional M-1167 9/19 66
PioneerRoundup Ready 91B52 9/18 59Conventional 9163 9/18 63
Prairie BrandRoundup Ready PB-1790RR 9/21 63Conventional PBR-169+ 9/21 73
RamyRoundup Ready 1555RR 9/19 55Conventional 1525 9/19 61
SandsRoundup Ready EXP 1557RR 9/18 57Conventional EXP 1444 9/18 69
StineRoundup Ready 1794 9/21 57Conventional 1680 9/21 73
TerraRoundup Ready E1181RR 9/17 62Conventional TS107 9/17 65
WensmanRoundup Ready W2118RR 9/17 60Conventional W3148 9/18 77
Yield KingRoundup Ready K-191RR 9/22 55Conventional K-1943+ 9/22 75
59.3
68.6
Table 5. Performance of Top Yielding Roundup Ready (RR) and Conventional Soybean Varieties by Company, and Maturity Date*; 1998 Varietal Trials in Minnesota, Central Zone
Company VarietyMaturity
DateYield
Yield Difference: Conventional to RR
-2 -3.3%
-8
-8
-12
-11.6%
-11.4%
-17.4%
-9 -12.9%
-3 -4.5%
-4 -6.3%
-10 -13.7%
-6 -9.8%
-12 -17.4%
-16 -21.9%
-3 -4.6%
Average Conventional
Average Roundup Ready
Source: Compiled by Benbrook Consulting Services, based from the 'Variety Trials Results' by Crookston, Moorhead and Shelly found at http://www.extension.umn.edu/Documents/D/C/Other.
-17 -22.1%
-20 -26.7%
*For each company, the closest match was selected by maturity date.
-9.3 -13.1%

Bushels per Acre
Percent Yield Drag
AsgrowRoundup Ready AG2201 9/19 64Conventional A1 923 9/18 59
AsgrowRoundup Ready AG2301 9/21 60Conventional A2247 9/21 66
DahlmanRoundup Ready 818RR 9/15 61Conventional Russel 9/16 57
DairylandRoundup Ready DSR-241/RR 9/19 64Conventional DSR-180/STS9/19 62
DeKalbRoundup Ready CX191RR 9/20 65Conventional CX205 9/20 68
Dyna GroRoundup Ready 3173RR 9/20 60Conventional 3188 9/20 63
Golden HarvestRoundup Ready 165RR 9/19 67Conventional H-1184 9/19 66
Golden HarvestRoundup Ready H-1207RR3 9/21 60Conventional H-1214 9/21 63
Great LakesRoundup Ready GL2000RR 9/24 64Conventional GL2451 9/24 65
KaltenbergRoundup Ready X160RR 9/20 63Conventional KB221 9/20 64
KaltenbergRoundup Ready KB209RR 9/22 64Conventional KB208 9/21 68
KaltenbergRoundup Ready KB159RR 9/23 63Conventional KB248 9/24 65
KrugerRoundup Ready K-24APR 9/20 65Conventional K-2242 9/20 64
KrugerRoundup Ready K24RR 9/21 65Conventional K-2303 9/21 65
Table 6. Performance of Top Yielding Roundup Ready (RR) and Conventional Soybean Varieties by Company, and Maturity Date*; 1998 Varietal Trials in Minnesota, Southern Zone
Company VarietyMaturity
DateYield
Yield Difference:
5 8.5%
1 1.6%
0 0.0%
-4 -5.9%
-2 -3.1%
-1 -1.5%
-1 -1.6%
1 1.5%
-3 -4.8%
-3 -4.4%
-3 -4.8%
4 7.0%
2 3.2%
-6 -9.1%

Bushels per Acre
Percent Yield Drag
Table 6. Performance of Top Yielding Roundup Ready (RR) and Conventional Soybean Varieties by Company, and Maturity Date*; 1998 Varietal Trials in Minnesota, Southern Zone
Company VarietyMaturity
DateYield
Yield Difference:
KSC/ChallengerRoundup Ready K-22RR 9/19 62Conventional K-2125 9/20 69
KSC/ChallengerRoundup Ready K-191RR 9/21 65Conventional K-2343 9/22 69
LathamRoundup Ready 406RR Brand 9/17 60Conventional 410 Brand 9/18 64
LathamRoundup Ready EX-656RR 9/20 63Conventional 660 Brand 9/20 67
LathamRoundup Ready EX-426RR 9/23 65Conventional 621 Brand 9/22 67
MustangRoundup Ready M-208 9/20 59Conventional E-201 9/19 62
Mustang Roundup Ready M-202 9/22 64Conventional M-2218 9/22 66
MycogenRoundup Ready 5214 9/22 60Conventional J-251 9/21 68
NorthstarRoundup Ready 2023RR 9/18 57Conventional 2302 9/19 63
PBRRoundup Ready PBR-1997RR 9/21 67Conventional PBR-218 9/21 63
PioneerRoundup Ready 92B05 9/15 66Conventional 9163 9/15 56
PioneerRoundup Ready 92B21 9/19 65Conventional 92B23 9/19 64
Prairie BrandRoundup Ready PB-2124R 9/21 67Conventional PB-197 9/21 66
Prairie BrandRoundup Ready PB-2090RR 9/24 67Conventional PB-235 9/24 66
1 1.5%
1 1.5%
10 17.9%
1 1.6%
-6 -9.5%
4 6.3%
-2 -3.0%
-8 -11.8%
-2 -3.0%
-3 -4.8%
-4 -6.3%
-4 -6.0%
-7 -10.1%
-4 -5.8%

Bushels per Acre
Percent Yield Drag
Table 6. Performance of Top Yielding Roundup Ready (RR) and Conventional Soybean Varieties by Company, and Maturity Date*; 1998 Varietal Trials in Minnesota, Southern Zone
Company VarietyMaturity
DateYield
Yield Difference:
ProfiseedRoundup Ready 4201 9/21 67Conventional 2557 9/22 69
ProfiseedRoundup Ready 4249 9/24 57Conventional 2413 9/24 67
RamyRoundup Ready 1995RR 9/20 60Conventional 2195 9/21 66
RamyRoundup Ready 2195RR 9/22 63Conventional 2198 9/22 72
RamyRoundup Ready 2085RR 9/23 65Conventional 2550 9/23 66
RenzeRoundup Ready R1909R 9/20 64Conventional R2098 9/20 66
RenzeRoundup Ready R2009R 9/23 65Conventional R2297 9/22 65
SandsRoundup Ready EXP 9619RR 9/21 67Conventional EXP 2027 9/20 61
SandsRoundup Ready SOI 245RR 9/23 63Conventional EXP 2435 9/24 71
SansgaardRoundup Ready S-2100RR 9/18 61Conventional S-190X 9/18 67
SansgaardRoundup Ready S-245XRR 9/20 62Conventional S-199X 9/20 61
SansgaardRoundup Ready S-233XRR 9/23 62Conventional S-237X 9/22 72
StineRoundup Ready 1991-4 9/21 66Conventional 1970 9/21 65
TerraRoundup Ready E-1481RR 9/16 60Conventional E1 58 9/16 64
1 1.5%
-4 -6.3%
1 1.6%
-10 -13.9%
-8 -11.3%
-6 -9.0%
0 0.0%
6 9.8%
-1 -1.5%
-2 -3.0%
-6 -9.1%
-9 -12.5%
-2 -2.9%
-10 -14.9%

Bushels per Acre
Percent Yield Drag
Table 6. Performance of Top Yielding Roundup Ready (RR) and Conventional Soybean Varieties by Company, and Maturity Date*; 1998 Varietal Trials in Minnesota, Southern Zone
Company VarietyMaturity
DateYield
Yield Difference:
TerraRoundup Ready E2081RR 9/20 60Conventional TS194 9/19 66
ThompsonRoundup Ready T-3178RR 9/15 58Conventional EX7217 9/16 60
ThompsonRoundup Ready T-3215RR 9/21 66Conventional T-3222 9/21 68
ThompsonRoundup Ready T-3208RR 9/23 63Conventional EX7705 9/24 65
WensmanRoundup Ready W 2178RR 9/16 63Conventional W 3148 9/15 63
WensmanRoundup Ready W2198RR 9/21 65Conventional W3207 9/21 71
Yield King Roundup Ready K-19FRR 9/20 65Conventional K-2323STS 9/21 59
Yield King Roundup Ready K-20RR 9/23 64Conventional K2525A 9/22 70
63.265.2
*For each company, the closest match was selected by maturity date.
Source: Compiled by Benbrook Consulting Services, based from the 'Variety Trials Results' by Crookston, Moorhead and Shelly found at http://www.extension.umn.edu/Documents/D/C/Other.
Average Roundup Ready -2.0 -2.8%
Average Conventional
6 10.2%
-6 -8.6%
0 0.0%
-6 -8.5%
-2 -2.9%
-2 -3.1%
-6 -9.1%
-2 -3.3%
Number of Companies
Average Yield Drag
[Bushels/Acre]
Average Percent
Yield Drag
Dollar Value of Yield Drag*
Added Cost of RR
System*
Added Cost as Percent of
Gross Income
Minnesota: Central 14 -9.3 -13.1% $48.75 $56.75 15.8%Minnesota: Southern 50 -2.0 -2.8% $10.61 $18.61 5.4%Wisconsin: Southern 10 -4.7 -6.2% $24.68 $32.68 8.3%
Oplinger Summary DataIllinois - 0 0.0% $0.00 $8.00 2.3%Iowa - -6 -9.1% $31.50 $39.50 11.4%Michigan - -8 -10.3% $42.00 $50.00 12.2%Minnesota - -5 -6.8% $26.25 $34.25 8.8%Nebraska - -6 -9.0% $31.50 $39.50 11.4%Ohio - -4 -6.0% $21.00 $29.00 8.0%South Dakota - -5 -9.0% $26.25 $34.25 11.6%Wisconsin - -3 -3.4% $15.75 $23.75 5.2%
Source: Compiled by Benbrook Consulting Services from state varietal trial data and (Oplinger, et al., 1999).
State Varietal Trial Comparisons
Table 7. Farm Level Economic Impacts of the Roundup Ready Soybean Yield Drag in 1998: Top Yielding RR to Conventional Varieties
*Assumes a soybean price of $5.25 per bushel and an average "Technology Fee" of $8.00 per acre.

18
Ag BioTech InfoNet Technical Paper No 1
References
Benbrook, C, 1999. “World Food System Challenges and Opportunities: GMOs,Biodiversity, and Lessons from America’s Heartland,” Paper presented January 27, 1999at the University of Illinois World Food Sustainable Agriculture Program. Accessible inAdobe Acrobat format on Ag BioTech InfoNet at http://www.biotech-info.net/costs.html#cost_returns.
Benbrook, C., Groth, E., Hansen, M., and S. Marquardt, 1996. Pest Management at theCrossroads, Consumers Union, Yonkers, New York.
Drinkwater, L.E., Wagoner, P, and M. Sarrantino, 1998. “Legume-based croppingsystems have reduced carbon and nitrogen losses,” Nature, Vol. 396: 262-265.
Hager, A., and M. McGalmery, 1998. “Corn Herbicide/Insecticide Interactions,”Univeristy of illinois Cooperative Extension. Accessible athttp://spectre.ag.uiuc.edu/cespubs/pest/articles/v983f.html.
Oplinger, E. S. Oplinger, Martinka, M.J., and K. A. Schmitz, 1999. “Performance ofTransgenic Soybeans in the Northern U.S.,” Accessible in Adobe Acrobat format athttp://www.biotech-info.net/herbicide-tolerance.html#soy.
Owen, M., 1999. “North American Developments in Herbicide Tolerant Crops,” Paperpresented at the 1997 British Crop Protection Conference, Brighton, England. Accessibleat http://www.weeds.iastate.edu/weednews/Brighton.htm.
Tilman, D., 1998. “The greening of the green revolution,” Nature, Vol. 396: 211-212.
Wyse, D, 1994. “New Technologies and Approaches for Weed Management inSustainable Agriculture Systems,” Weed Technology, Vol. 8: pages 403-407.
Soybean Yield Trial Data
Minnesota: James H. Orf , Philip J. Schaus, Leland L Hardman, and Arthur S. Killam,“1998 Soybean Variety Trial Results,” Minnesota Agricultural Experiment Station,.Department of Agronomy and Plant Genetics, University of Minnesota, St. Paul, MN55108. Accessible on the Internet athttp://www.extension.umn.edu/Documents/D/C/DC7349.html.
Wisconsin: Oplinger, E.S., Martinka, J.M., Schmitz, K.A., and C.R. Grau, 1999. “1998Wisconsin Soybean Variety Tests,” Department of Agronomy, College of Agriculturaland Life Sciecnes, Univeristy of Wisconsin-Madison. Accessible in Adobe Acrobatformat on the Internet at < http://www.uwex.edu/ces/soybean/>.