
Roularta Media Group Market review and peer benchmarking · Key monthly insights Market review and...
18
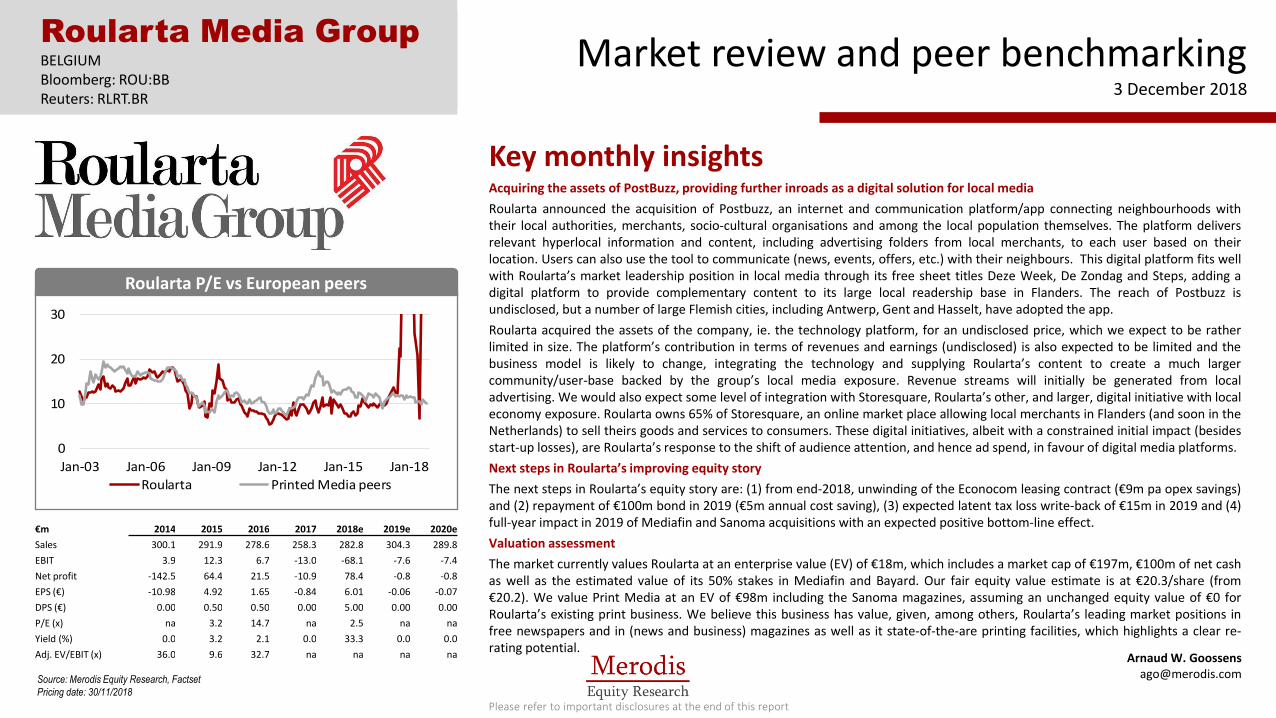
Key monthly insights Market review and peer benchmarking 3 December 2018 Acquiring the assets of PostBuzz, providing further inroads as a digital solution for local media Roularta announced the acquisition of Postbuzz, an internet and communication platform/app connecting neighbourhoods with their local authorities, merchants, socio-cultural organisations and among the local population themselves. The platform delivers relevant hyperlocal information and content, including advertising folders from local merchants, to each user based on their location. Users can also use the tool to communicate (news, events, offers, etc.) with their neighbours. This digital platform fits well with Roularta’s market leadership position in local media through its free sheet titles Deze Week, De Zondag and Steps, adding a digital platform to provide complementary content to its large local readership base in Flanders. The reach of Postbuzz is undisclosed, but a number of large Flemish cities, including Antwerp, Gent and Hasselt, have adopted the app. Roularta acquired the assets of the company, ie. the technology platform, for an undisclosed price, which we expect to be rather limited in size. The platform’s contribution in terms of revenues and earnings (undisclosed) is also expected to be limited and the business model is likely to change, integrating the technology and supplying Roularta’s content to create a much larger community/user-base backed by the group’s local media exposure. Revenue streams will initially be generated from local advertising. We would also expect some level of integration with Storesquare, Roularta’s other, and larger, digital initiative with local economy exposure. Roularta owns 65% of Storesquare, an online market place allowing local merchants in Flanders (and soon in the Netherlands) to sell theirs goods and services to consumers. These digital initiatives, albeit with a constrained initial impact (besides start-up losses), are Roularta’s response to the shift of audience attention, and hence ad spend, in favour of digital media platforms. Next steps in Roularta’s improving equity story The next steps in Roularta’s equity story are: (1) from end-2018, unwinding of the Econocom leasing contract (€9m pa opex savings) and (2) repayment of €100m bond in 2019 (€5m annual cost saving), (3) expected latent tax loss write-back of €15m in 2019 and (4) full-year impact in 2019 of Mediafin and Sanoma acquisitions with an expected positive bottom-line effect. Valuation assessment The market currently values Roularta at an enterprise value (EV) of €18m, which includes a market cap of €197m, €100m of net cash as well as the estimated value of its 50% stakes in Mediafin and Bayard. Our fair equity value estimate is at €20.3/share (from €20.2). We value Print Media at an EV of €98m including the Sanoma magazines, assuming an unchanged equity value of €0 for Roularta’s existing print business. We believe this business has value, given, among others, Roularta’s leading market positions in free newspapers and in (news and business) magazines as well as it state-of-the-are printing facilities, which highlights a clear re- rating potential. Roularta Media Group BELGIUM Bloomberg: ROU:BB Reuters: RLRT.BR Arnaud W. Goossens [email protected] Please refer to important disclosures at the end of this report €m 2014 2015 2016 2017 2018e 2019e 2020e Sales 300.1 291.9 278.6 258.3 282.8 304.3 289.8 EBIT 3.9 12.3 6.7 -13.0 -68.1 -7.6 -7.4 Net profit -142.5 64.4 21.5 -10.9 78.4 -0.8 -0.8 EPS (€) -10.98 4.92 1.65 -0.84 6.01 -0.06 -0.07 DPS (€) 0.00 0.50 0.50 0.00 5.00 0.00 0.00 P/E (x) na 3.2 14.7 na 2.5 na na Yield (%) 0.0 3.2 2.1 0.0 33.3 0.0 0.0 Adj. EV/EBIT (x) 36.0 9.6 32.7 na na na na Source: Merodis Equity Research, Factset Pricing date: 30/11/2018 Roularta P/E vs European peers 0 10 20 30 Jan-03 Jan-06 Jan-09 Jan-12 Jan-15 Jan-18 Roularta Printed Media peers
Transcript of Roularta Media Group Market review and peer benchmarking · Key monthly insights Market review and...
Key monthly insights
Market review and peer benchmarking 3 December 2018
Acquiring the assets of PostBuzz, providing further inroads as a digital solution for local media
Roularta announced the acquisition of Postbuzz, an internet and communication platform/app connecting neighbourhoods with their local authorities, merchants, socio-cultural organisations and among the local population themselves. The platform delivers relevant hyperlocal information and content, including advertising folders from local merchants, to each user based on their location. Users can also use the tool to communicate (news, events, offers, etc.) with their neighbours. This digital platform fits well with Roularta’s market leadership position in local media through its free sheet titles Deze Week, De Zondag and Steps, adding a digital platform to provide complementary content to its large local readership base in Flanders. The reach of Postbuzz is undisclosed, but a number of large Flemish cities, including Antwerp, Gent and Hasselt, have adopted the app.
Roularta acquired the assets of the company, ie. the technology platform, for an undisclosed price, which we expect to be rather limited in size. The platform’s contribution in terms of revenues and earnings (undisclosed) is also expected to be limited and the business model is likely to change, integrating the technology and supplying Roularta’s content to create a much larger community/user-base backed by the group’s local media exposure. Revenue streams will initially be generated from local advertising. We would also expect some level of integration with Storesquare, Roularta’s other, and larger, digital initiative with local economy exposure. Roularta owns 65% of Storesquare, an online market place allowing local merchants in Flanders (and soon in the Netherlands) to sell theirs goods and services to consumers. These digital initiatives, albeit with a constrained initial impact (besides start-up losses), are Roularta’s response to the shift of audience attention, and hence ad spend, in favour of digital media platforms.
Next steps in Roularta’s improving equity story
The next steps in Roularta’s equity story are: (1) from end-2018, unwinding of the Econocom leasing contract (€9m pa opex savings) and (2) repayment of €100m bond in 2019 (€5m annual cost saving), (3) expected latent tax loss write-back of €15m in 2019 and (4) full-year impact in 2019 of Mediafin and Sanoma acquisitions with an expected positive bottom-line effect.
Valuation assessment
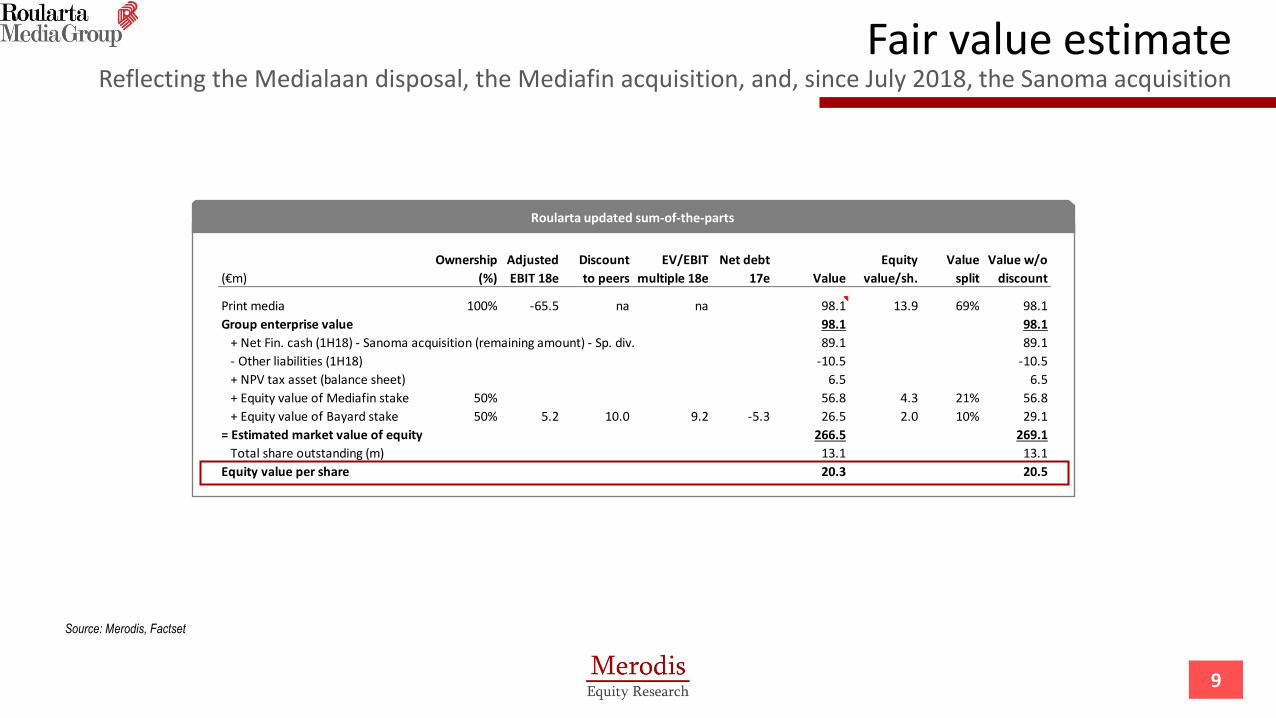
The market currently values Roularta at an enterprise value (EV) of €18m, which includes a market cap of €197m, €100m of net cash as well as the estimated value of its 50% stakes in Mediafin and Bayard. Our fair equity value estimate is at €20.3/share (from €20.2). We value Print Media at an EV of €98m including the Sanoma magazines, assuming an unchanged equity value of €0 for Roularta’s existing print business. We believe this business has value, given, among others, Roularta’s leading market positions in free newspapers and in (news and business) magazines as well as it state-of-the-are printing facilities, which highlights a clear re-rating potential.
Roularta Media Group BELGIUM Bloomberg: ROU:BB Reuters: RLRT.BR
Arnaud W. Goossens [email protected]
Please refer to important disclosures at the end of this report
€m 2014 2015 2016 2017 2018e 2019e 2020e
Sales 300.1 291.9 278.6 258.3 282.8 304.3 289.8
EBIT 3.9 12.3 6.7 -13.0 -68.1 -7.6 -7.4
Net profit -142.5 64.4 21.5 -10.9 78.4 -0.8 -0.8
EPS (€) -10.98 4.92 1.65 -0.84 6.01 -0.06 -0.07
DPS (€) 0.00 0.50 0.50 0.00 5.00 0.00 0.00
P/E (x) na 3.2 14.7 na 2.5 na na
Yield (%) 0.0 3.2 2.1 0.0 33.3 0.0 0.0
Adj. EV/EBIT (x) 36.0 9.6 32.7 na na na na
Source: Merodis Equity Research, Factset
Pricing date: 30/11/2018
Roularta P/E vs European peers
0
10
20
30
Jan-03 Jan-06 Jan-09 Jan-12 Jan-15 Jan-18
Roularta Printed Media peers

2
Monthly market review dashboard
Goals of this Dashboard
Follow-up to our coverage of Roularta which was launched in October 2015 (see below)
Tool to keep investors up to date with Roularta’s equity story as well as its valuation in a sector context
Update investors on recent company and sector news flow
Corporate calendar of Roularta’s upcoming announcements and events
Friday, 1 March 2019: Announcement of FY18 results (08.15AM CET; Analyst meeting at 2PM)
Access our recent research reports on Roularta:
“Back on its feet” (initiation), 14 October 2015
“When the going gets tough” (update), 28 August 2017
“October 2018 market review” (monthly dashboard), 5 November 2018
https://documentcloud.adobe.com/link/track?uri=urn:aaid:scds:US:166d49f3-bdff-45f4-8f08-764e3c9eb7ad

3
Company profile A domestic leader in high-quality print media
Roularta is Belgium's leading media company offering
(1) local weekly free newspapers in Flanders (Deze Week, De Zondag, Steps),
(2) nationwide weekly news, business and women magazines (Knack, Le Vif L'Express, Trends, Trends Tendance, Libelle/Femme d’Aujourd’hui and Flair and Feeling/Gael),
(3) internet platforms (Storesquare, Digilocal, Proxistore, own content websites) and
(4) a 50% JV stake in Mediafin, Belgium's leading daily business newspaper (De Tijd and L’Echo).
Combined group sales are almost entirely generated in Belgium through (1) Print Media Advertising (40% of group in 2017, ie. excluding the Sanoma acquisition), (2) Readers Market (subscriptions and newsstand sales) (28%), (3) Third-Party Printing (14%), (4) Internet advertising and related (10%) and (5) other sources of revenues (inc. Line Extensions) (8%). Roularta's consolidated accounts include the full contribution of its Print Media activity (advertising and readers market ex-Bayard, internet activity, line extensions and third-party printing). The 50% stakes in Mediafin and Bayard are equity-accounted. The company acquired the women magazines in an asset deal with Sanoma (June 2018), with sales in the region of €70m for a consideration of €25m. The company recently restated its business segmentation to include two activities: Media Brands (86% of group sales in 1H18) and Printing Services (14%).
Combined sales breakdown (2017) Shareholders Company description
Combined EBIT breakdown (2016) Consolidated EBIT breakdown (2017)
Source: Merodis, Factset
Print ad39%
Readership
27%
3rd-party printing
14%
Internet10%
Line extensions
8%
TV & Radio ad
2%
Family & related
72%
Bestinver8%
Treasury shares
5%
Free float15%
Medialaan73%
Print media & others
27%
Medialaan0%
Print media & others
100%
4
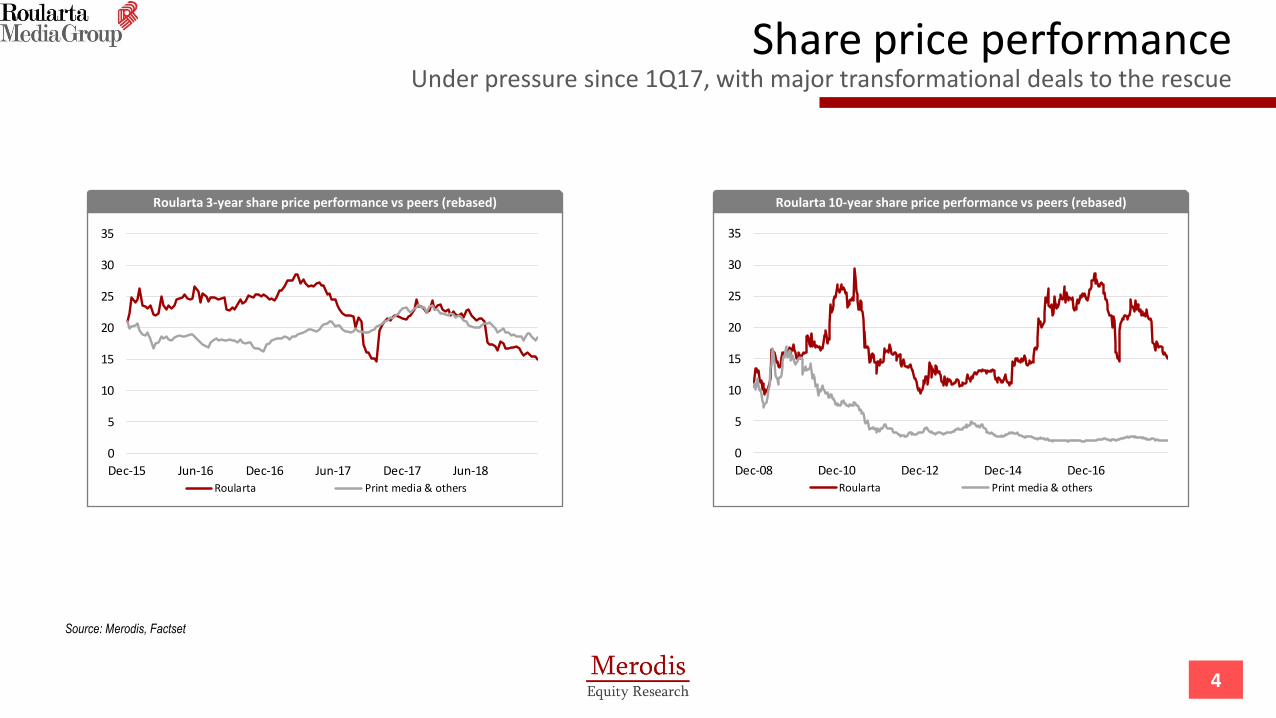
Share price performance Under pressure since 1Q17, with major transformational deals to the rescue
Source: Merodis, Factset
Roularta 3-year share price performance vs peers (rebased) Roularta 10-year share price performance vs peers (rebased)
0
5
10
15
20
25
30
35
Dec-08 Dec-10 Dec-12 Dec-14 Dec-16Roularta Print media & others
0
5
10
15
20
25
30
35
Dec-15 Jun-16 Dec-16 Jun-17 Dec-17 Jun-18Roularta Print media & others

Consensus EPS 2017-19 (€/share)
5
Analyst Recommendations, Earnings Expectations Consensus remains volatile, but stable in the past month
Source: Merodis, Factset
Consensus view
2018 consensus EPS estimates for Roularta are again flat m-o-m, still reflecting the weak results reported in August and the unexpected impairment which offset the capital gain from the disposal of the Medialaan stake. We adjusted our estimates in August, taking into account the 1H18 results.
Consensus currently expects a 2018e EPS of €-0.73 which is in line with our forecast (excluding the capital gain on Medialaan; €6.01 including the other one-time items), while 2019e consensus earnings are at €0.52 (flat m-o-m, but down 38% vs. August) vs. our forecast of €-0.06, mainly reflecting persistent top line weakness as well as start-up losses within the digital activities, which we expect to offset the full-year effect of the end of the leasing contract with Econocom (end-2018) and the repayment of the €100m bond (also end-2018).
Roularta’s share price was still under some pressure in November following the broader market sell-off of October. The stock is down 1.6% m-o-m in November following a sharper fall in October (-10%). The stock outperformed Print Media peers (-3.4% m-o-m), while underperforming the Euro Stoxx 600 (-1.1%) and Belgian SMCs (+0.2%). The share reached a new low over the last 12 months, at €14.65 (intraday on 28 November 2018), while its high during the year was €25.4 (26 February 2018).
Three brokers cover the stock, Degroof Petercam, KBC Securities and Kepler Chevreux (since September), with Factset indicating a Hold recommendation for the two latter and unchanged target prices of €17.50 and €17.90 respectively.
EPS Worms (€/share)
-2.0
-1.0
0.0
1.0
2.0
3.0
4.0
5.0
6.0
Dec-03 Dec-07 Dec-11 Dec-15
20062007200820092010201120122013201420152016201720182019
-2.0
-1.0
0.0
1.0
2.0
3.0
4.0
5.0
6.0
Mar-16 Sep-16 Mar-17 Sep-17 Mar-18 Sep-18
2018
2019
2020
Merodis Equity Research estimates (MERe) vs. consensus (%) Analyst recommendations vs. peer average
Jan-03 Jan-05 Jan-07 Jan-09 Jan-11 Jan-13 Jan-15 Jan-17
Roularta Sector average
Sell
Buy
MER vs Cns (%) 2018e 2019e 2020e
Sales -1.1 -2.5 -2.7
EBITDA 1.7 -75.3 -67.1
EBIT 37.8 2,812.4 na
EPS na na na
DPS 0.0 na na
Net debt 32,741.6 66.5 48.8
6
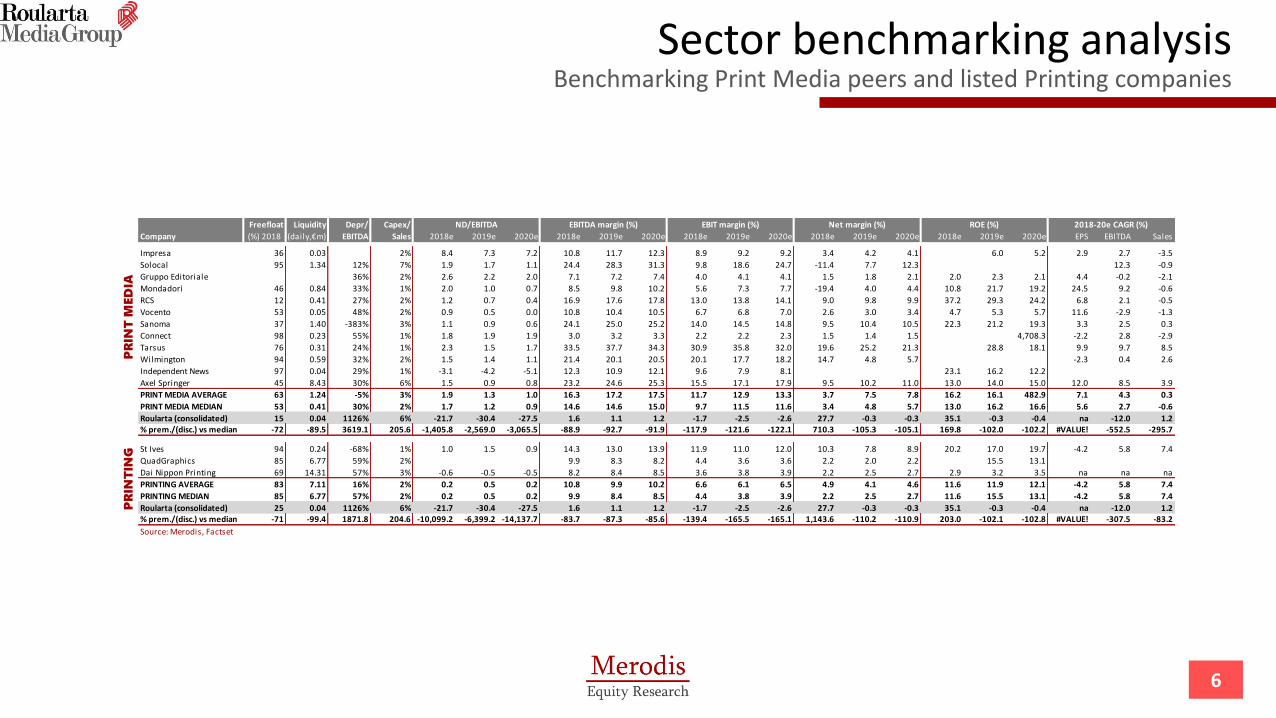
Sector benchmarking analysis Benchmarking Print Media peers and listed Printing companies
Freefloat Liquidity Depr/ Capex/
Company (%) 2018 (daily,€m) EBITDA Sales 2018e 2019e 2020e 2018e 2019e 2020e 2018e 2019e 2020e 2018e 2019e 2020e 2018e 2019e 2020e EPS EBITDA Sales
Impresa 36 0.03 2% 8.4 7.3 7.2 10.8 11.7 12.3 8.9 9.2 9.2 3.4 4.2 4.1 6.0 5.2 2.9 2.7 -3.5
Solocal 95 1.34 12% 7% 1.9 1.7 1.1 24.4 28.3 31.3 9.8 18.6 24.7 -11.4 7.7 12.3 12.3 -0.9
Gruppo Editoriale 36% 2% 2.6 2.2 2.0 7.1 7.2 7.4 4.0 4.1 4.1 1.5 1.8 2.1 2.0 2.3 2.1 4.4 -0.2 -2.1
Mondadori 46 0.84 33% 1% 2.0 1.0 0.7 8.5 9.8 10.2 5.6 7.3 7.7 -19.4 4.0 4.4 10.8 21.7 19.2 24.5 9.2 -0.6
RCS 12 0.41 27% 2% 1.2 0.7 0.4 16.9 17.6 17.8 13.0 13.8 14.1 9.0 9.8 9.9 37.2 29.3 24.2 6.8 2.1 -0.5
Vocento 53 0.05 48% 2% 0.9 0.5 0.0 10.8 10.4 10.5 6.7 6.8 7.0 2.6 3.0 3.4 4.7 5.3 5.7 11.6 -2.9 -1.3
Sanoma 37 1.40 -383% 3% 1.1 0.9 0.6 24.1 25.0 25.2 14.0 14.5 14.8 9.5 10.4 10.5 22.3 21.2 19.3 3.3 2.5 0.3
Connect 98 0.23 55% 1% 1.8 1.9 1.9 3.0 3.2 3.3 2.2 2.2 2.3 1.5 1.4 1.5 4,708.3 -2.2 2.8 -2.9
Tarsus 76 0.31 24% 1% 2.3 1.5 1.7 33.5 37.7 34.3 30.9 35.8 32.0 19.6 25.2 21.3 28.8 18.1 9.9 9.7 8.5
Wilmington 94 0.59 32% 2% 1.5 1.4 1.1 21.4 20.1 20.5 20.1 17.7 18.2 14.7 4.8 5.7 -2.3 0.4 2.6
Independent News 97 0.04 29% 1% -3.1 -4.2 -5.1 12.3 10.9 12.1 9.6 7.9 8.1 23.1 16.2 12.2
Axel Springer 45 8.43 30% 6% 1.5 0.9 0.8 23.2 24.6 25.3 15.5 17.1 17.9 9.5 10.2 11.0 13.0 14.0 15.0 12.0 8.5 3.9
PRINT MEDIA AVERAGE 63 1.24 -5% 3% 1.9 1.3 1.0 16.3 17.2 17.5 11.7 12.9 13.3 3.7 7.5 7.8 16.2 16.1 482.9 7.1 4.3 0.3
PRINT MEDIA MEDIAN 53 0.41 30% 2% 1.7 1.2 0.9 14.6 14.6 15.0 9.7 11.5 11.6 3.4 4.8 5.7 13.0 16.2 16.6 5.6 2.7 -0.6
Roularta (consolidated) 15 0.04 1126% 6% -21.7 -30.4 -27.5 1.6 1.1 1.2 -1.7 -2.5 -2.6 27.7 -0.3 -0.3 35.1 -0.3 -0.4 na -12.0 1.2% prem./(disc.) vs median -72 -89.5 3619.1 205.6 -1,405.8 -2,569.0 -3,065.5 -88.9 -92.7 -91.9 -117.9 -121.6 -122.1 710.3 -105.3 -105.1 169.8 -102.0 -102.2 #VALUE! -552.5 -295.7
St Ives 94 0.24 -68% 1% 1.0 1.5 0.9 14.3 13.0 13.9 11.9 11.0 12.0 10.3 7.8 8.9 20.2 17.0 19.7 -4.2 5.8 7.4
QuadGraphics 85 6.77 59% 2% 9.9 8.3 8.2 4.4 3.6 3.6 2.2 2.0 2.2 15.5 13.1
Dai Nippon Printing 69 14.31 57% 3% -0.6 -0.5 -0.5 8.2 8.4 8.5 3.6 3.8 3.9 2.2 2.5 2.7 2.9 3.2 3.5 na na na
PRINTING AVERAGE 83 7.11 16% 2% 0.2 0.5 0.2 10.8 9.9 10.2 6.6 6.1 6.5 4.9 4.1 4.6 11.6 11.9 12.1 -4.2 5.8 7.4
PRINTING MEDIAN 85 6.77 57% 2% 0.2 0.5 0.2 9.9 8.4 8.5 4.4 3.8 3.9 2.2 2.5 2.7 11.6 15.5 13.1 -4.2 5.8 7.4
Roularta (consolidated) 25 0.04 1126% 6% -21.7 -30.4 -27.5 1.6 1.1 1.2 -1.7 -2.5 -2.6 27.7 -0.3 -0.3 35.1 -0.3 -0.4 na -12.0 1.2% prem./(disc.) vs median -71 -99.4 1871.8 204.6 -10,099.2 -6,399.2 -14,137.7 -83.7 -87.3 -85.6 -139.4 -165.5 -165.1 1,143.6 -110.2 -110.9 203.0 -102.1 -102.8 #VALUE! -307.5 -83.2
Source: Merodis, Factset
PR
INT
ING
ROE (%) 2018-20e CAGR (%)
PR
INT
MED
IA
ND/EBITDA EBITDA margin (%) EBIT margin (%) Net margin (%)
7
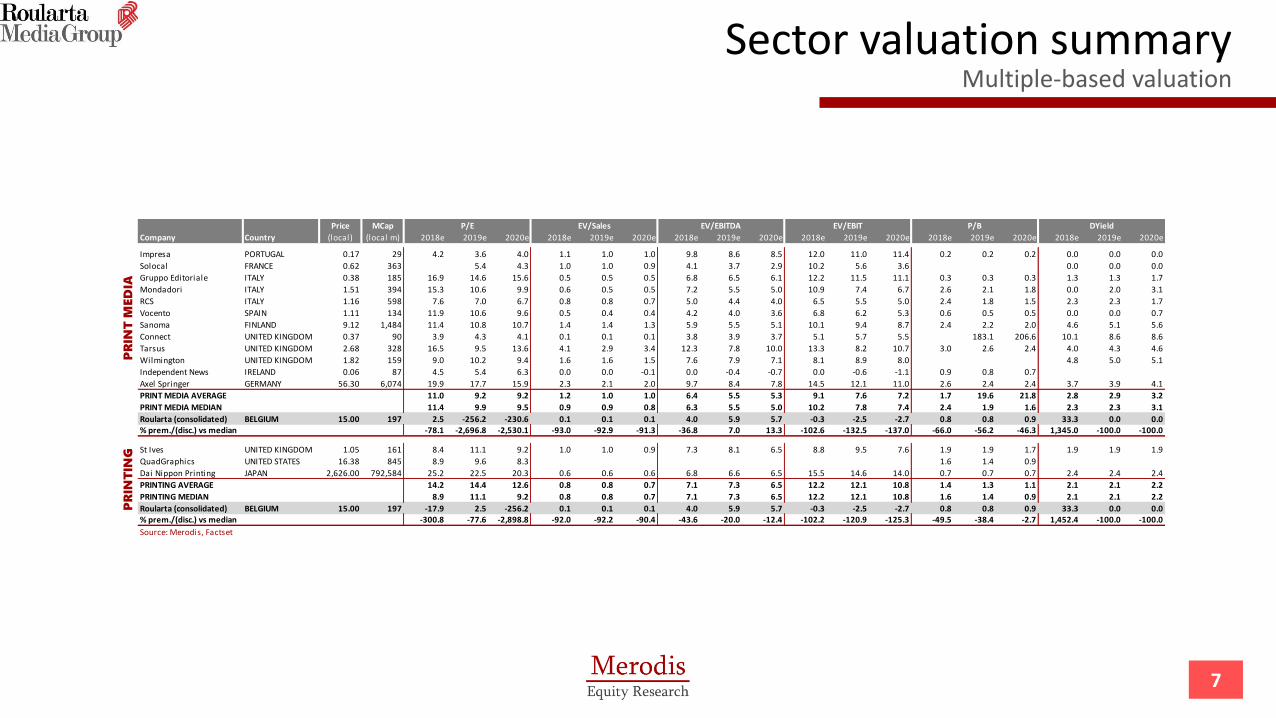
Sector valuation summary Multiple-based valuation
Price MCap
Company Country (local) (local m) 2018e 2019e 2020e 2018e 2019e 2020e 2018e 2019e 2020e 2018e 2019e 2020e 2018e 2019e 2020e 2018e 2019e 2020e
Impresa PORTUGAL 0.17 29 4.2 3.6 4.0 1.1 1.0 1.0 9.8 8.6 8.5 12.0 11.0 11.4 0.2 0.2 0.2 0.0 0.0 0.0
Solocal FRANCE 0.62 363 5.4 4.3 1.0 1.0 0.9 4.1 3.7 2.9 10.2 5.6 3.6 0.0 0.0 0.0
Gruppo Editoriale ITALY 0.38 185 16.9 14.6 15.6 0.5 0.5 0.5 6.8 6.5 6.1 12.2 11.5 11.1 0.3 0.3 0.3 1.3 1.3 1.7
Mondadori ITALY 1.51 394 15.3 10.6 9.9 0.6 0.5 0.5 7.2 5.5 5.0 10.9 7.4 6.7 2.6 2.1 1.8 0.0 2.0 3.1
RCS ITALY 1.16 598 7.6 7.0 6.7 0.8 0.8 0.7 5.0 4.4 4.0 6.5 5.5 5.0 2.4 1.8 1.5 2.3 2.3 1.7
Vocento SPAIN 1.11 134 11.9 10.6 9.6 0.5 0.4 0.4 4.2 4.0 3.6 6.8 6.2 5.3 0.6 0.5 0.5 0.0 0.0 0.7
Sanoma FINLAND 9.12 1,484 11.4 10.8 10.7 1.4 1.4 1.3 5.9 5.5 5.1 10.1 9.4 8.7 2.4 2.2 2.0 4.6 5.1 5.6
Connect UNITED KINGDOM 0.37 90 3.9 4.3 4.1 0.1 0.1 0.1 3.8 3.9 3.7 5.1 5.7 5.5 183.1 206.6 10.1 8.6 8.6
Tarsus UNITED KINGDOM 2.68 328 16.5 9.5 13.6 4.1 2.9 3.4 12.3 7.8 10.0 13.3 8.2 10.7 3.0 2.6 2.4 4.0 4.3 4.6
Wilmington UNITED KINGDOM 1.82 159 9.0 10.2 9.4 1.6 1.6 1.5 7.6 7.9 7.1 8.1 8.9 8.0 4.8 5.0 5.1
Independent News IRELAND 0.06 87 4.5 5.4 6.3 0.0 0.0 -0.1 0.0 -0.4 -0.7 0.0 -0.6 -1.1 0.9 0.8 0.7
Axel Springer GERMANY 56.30 6,074 19.9 17.7 15.9 2.3 2.1 2.0 9.7 8.4 7.8 14.5 12.1 11.0 2.6 2.4 2.4 3.7 3.9 4.1
PRINT MEDIA AVERAGE 11.0 9.2 9.2 1.2 1.0 1.0 6.4 5.5 5.3 9.1 7.6 7.2 1.7 19.6 21.8 2.8 2.9 3.2
PRINT MEDIA MEDIAN 11.4 9.9 9.5 0.9 0.9 0.8 6.3 5.5 5.0 10.2 7.8 7.4 2.4 1.9 1.6 2.3 2.3 3.1
Roularta (consolidated) BELGIUM 15.00 197 2.5 -256.2 -230.6 0.1 0.1 0.1 4.0 5.9 5.7 -0.3 -2.5 -2.7 0.8 0.8 0.9 33.3 0.0 0.0% prem./(disc.) vs median -78.1 -2,696.8 -2,530.1 -93.0 -92.9 -91.3 -36.8 7.0 13.3 -102.6 -132.5 -137.0 -66.0 -56.2 -46.3 1,345.0 -100.0 -100.0
St Ives UNITED KINGDOM 1.05 161 8.4 11.1 9.2 1.0 1.0 0.9 7.3 8.1 6.5 8.8 9.5 7.6 1.9 1.9 1.7 1.9 1.9 1.9
QuadGraphics UNITED STATES 16.38 845 8.9 9.6 8.3 1.6 1.4 0.9
Dai Nippon Printing JAPAN 2,626.00 792,584 25.2 22.5 20.3 0.6 0.6 0.6 6.8 6.6 6.5 15.5 14.6 14.0 0.7 0.7 0.7 2.4 2.4 2.4
PRINTING AVERAGE 14.2 14.4 12.6 0.8 0.8 0.7 7.1 7.3 6.5 12.2 12.1 10.8 1.4 1.3 1.1 2.1 2.1 2.2
PRINTING MEDIAN 8.9 11.1 9.2 0.8 0.8 0.7 7.1 7.3 6.5 12.2 12.1 10.8 1.6 1.4 0.9 2.1 2.1 2.2
Roularta (consolidated) BELGIUM 15.00 197 -17.9 2.5 -256.2 0.1 0.1 0.1 4.0 5.9 5.7 -0.3 -2.5 -2.7 0.8 0.8 0.9 33.3 0.0 0.0% prem./(disc.) vs median -300.8 -77.6 -2,898.8 -92.0 -92.2 -90.4 -43.6 -20.0 -12.4 -102.2 -120.9 -125.3 -49.5 -38.4 -2.7 1,452.4 -100.0 -100.0
Source: Merodis, Factset
PR
INT
ING
P/B DYieldEV/EBIT
PR
INT
MED
IA
P/E EV/EBITDAEV/Sales

EV/EBITDA ratio of Roularta vs. Print Media
8
P/E valuation relative to the sector A recent re-rating driven by an accounting impact and major digital investments which hurt profitability
Source: Merodis, Factset
Valuation
On consensus EPS estimates, Roularta shares trade at a P/E 12M forward of 37x, a 270% premium versus Print Media peers in Europe (from a 370% premium in October). Importantly, the volatility is due to the inclusion, within consensus, of the capital gain on the disposal of the Medialaan stake which has been largely offset by the value impairment of the magazine titles. In addition, profitability at Roularta is still expected to be negatively impacted by high start-up losses in the digital ventures as well as weak market conditions in the ad space for Roularta’s core activity.
As a reminder, Roularta has disposed of its stake in Medialaan, which means Roularta is now a Print Media pure play compared to the past when TV broadcasting (through Medialaan) was the main profit contributor and the key value driver of the stock (in 2016, 73% of Roularta’s EBIT and 80% of its EPS was generated by Medialaan). The rerating compared to the Print Media sector is driven entirely by the share price performance since October 2017 as well as the sharp cut in Roularta’s earnings estimates due to launching costs in digital initiatives such as Storesquare.
The Print Media sector is currently valued at 9.8x P/E 12M forward (vs. 10.4x previously, ie. a continued de-rating m-o-m) and at 5.5x EV/EBITDA 12M forward (vs. 5.0x previously), which compares to a LT average of 12.9x and 7.3x respectively. The historical valuation range for the sector is 7x-19x (P/E 12M forward) and 5x-11x (EV/EBITDA 12M forward), which suggest that the sector remains at the low-end of its historical range.
P/E ratio of Roularta vs. Print Media
EV/EBITDA Premium/(Discount) of Roularta vs. Print Media P/E Premium/(Discount) of Roularta vs. Print Media
0
10
20
30
Jan-03 Jan-06 Jan-09 Jan-12 Jan-15 Jan-18
Roularta Printed Media peers
-100%
-50%
0%
50%
100%
Jan-03 Jan-06 Jan-09 Jan-12 Jan-15 Jan-18
0
10
20
30
Jan-03 Jan-06 Jan-09 Jan-12 Jan-15 Jan-18
Roularta Printed Media peers
-100%
-50%
0%
50%
100%
150%
200%
Jan-03 Jan-06 Jan-09 Jan-12 Jan-15 Jan-18
9
Fair value estimate Reflecting the Medialaan disposal, the Mediafin acquisition, and, since July 2018, the Sanoma acquisition
Source: Merodis, Factset
Roularta updated sum-of-the-parts
(€m)
Ownership
(%)
Adjusted
EBIT 18e
Discount
to peers
EV/EBIT
multiple 18e
Net debt
17e Value
Equity
value/sh.
Value
split
Value w/o
discount
Print media 100% -65.5 na na 98.1 13.9 69% 98.1
Group enterprise value 98.1 98.1
+ Net Fin. cash (1H18) - Sanoma acquisition (remaining amount) - Sp. div. 89.1 89.1
- Other liabilities (1H18) -10.5 -10.5
+ NPV tax asset (balance sheet) 6.5 6.5
+ Equity value of Mediafin stake 50% 56.8 4.3 21% 56.8
+ Equity value of Bayard stake 50% 5.2 10.0 9.2 -5.3 26.5 2.0 10% 29.1
= Estimated market value of equity 266.5 269.1
Total share outstanding (m) 13.1 13.1
Equity value per share 20.3 20.5
10
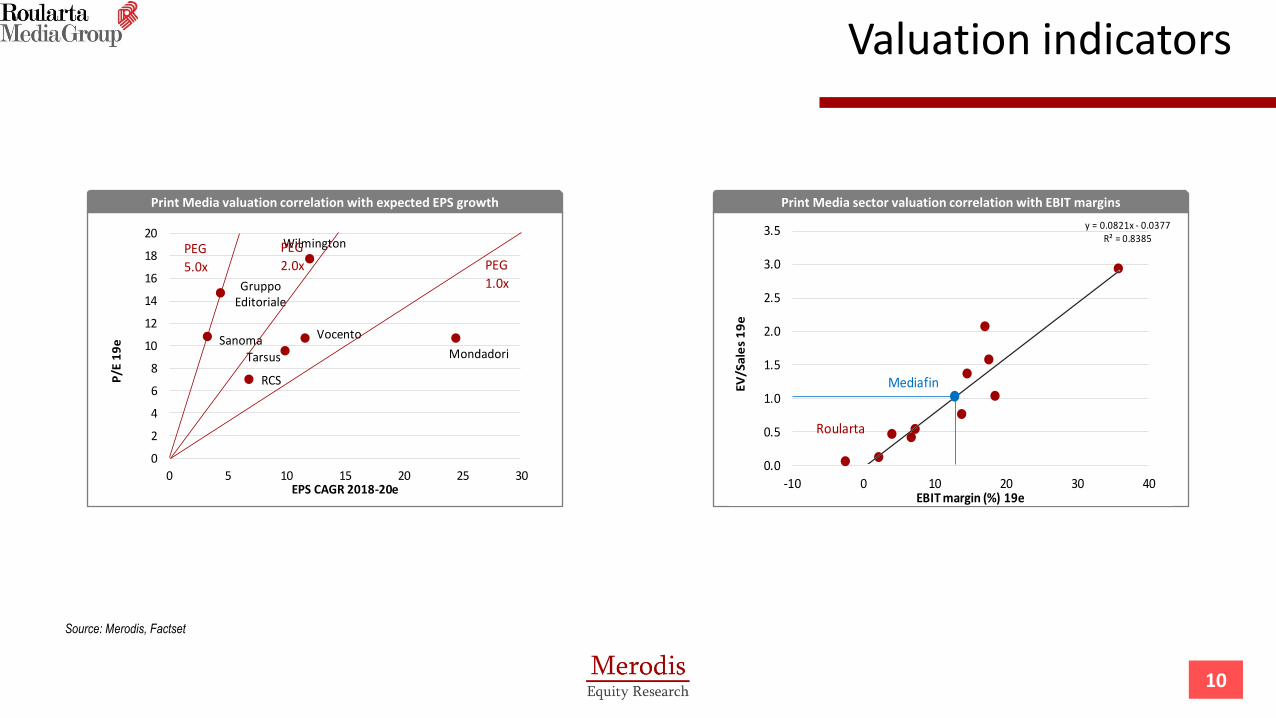
Valuation indicators
Source: Merodis, Factset
Print Media valuation correlation with expected EPS growth
Gruppo Editoriale
Mondadori
RCS
VocentoSanomaTarsus
Wilmington
0
2
4
6
8
10
12
14
16
18
20
0 5 10 15 20 25 30
P/E
19
e
EPS CAGR 2018-20e
PEG
5.0x
PEG
2.0x PEG
1.0x
Print Media sector valuation correlation with EBIT margins
y = 0.0821x - 0.0377R² = 0.8385
0.0
0.5
1.0
1.5
2.0
2.5
3.0
3.5
-10 0 10 20 30 40
EV
/Sa
les
19
e
EBIT margin (%) 19e
Roularta
Mediafin

2019 expected sales growth (%)
11
Sales growth expectations Impacted by cyclical and structural effects
Source: Merodis, Factset
Expected Sales Growth
At the end of November, consensus cut Print Media sector sales growth expectations for 2018 from -4.1% to -12.6% driven mainly by sharp downgrades at Independent News and Media (2018 sales expected at -22% y-o-y from -7.4% expected previously) as well as at Mondadori (2018 sales expected at -28% y-o-y from -2% expected previously). The latter is driven mainly by the expected disposal of Mondadori’s French activity (classified as a discontinued asset).
Consensus sales expectations for Roularta in 2018 are flat m-o-m, following a sharp increase in July and August with the inclusion of the Sanoma assets acquired in June 2018. Consensus now expects 9% sales growth.
As a reminder the announced disposal of Medialaan and acquisition of Mediafin have no impact on Roularta’s consolidated sales as the stakes are equity-accounted JVs.
The sector is suffering from the structural impact of online media gaining market share over traditional Printed Media and TV in terms of advertising revenues. This is driven by changes in viewership, which is moving from the traditional media to online.
2018 expected sales growth (%)
2019 expected sales growth, Roularta vs. peers 2018 expected sales growth, Roularta vs. peers
-40%
-30%
-20%
-10%
0%
10%
20%
Mar-15 Dec-15 Sep-16 Jun-17 Mar-18
ROU-BRU
IPR-LIS
IPDC-DUB
GEDI-IT
MN-MIL
VOC-MCE -10%
-5%
0%
5%
10%
15%
20%
Mar-15 Dec-15 Sep-16 Jun-17 Mar-18
ROU-BRU
IPR-LIS
IPDC-DUB
GEDI-IT
MN-MIL
VOC-MCE
-15%
-10%
-5%
0%
5%
10%
15%
Mar-15 Mar-16 Mar-17 Mar-18ROU-BRU Peer avg.
-10%
-5%
0%
5%
10%
Mar-15 Oct-15 May-16 Dec-16 Jul-17 Feb-18 Sep-18
ROU-BRU Peer avg.
2019 expected EBITDA growth (%)
12
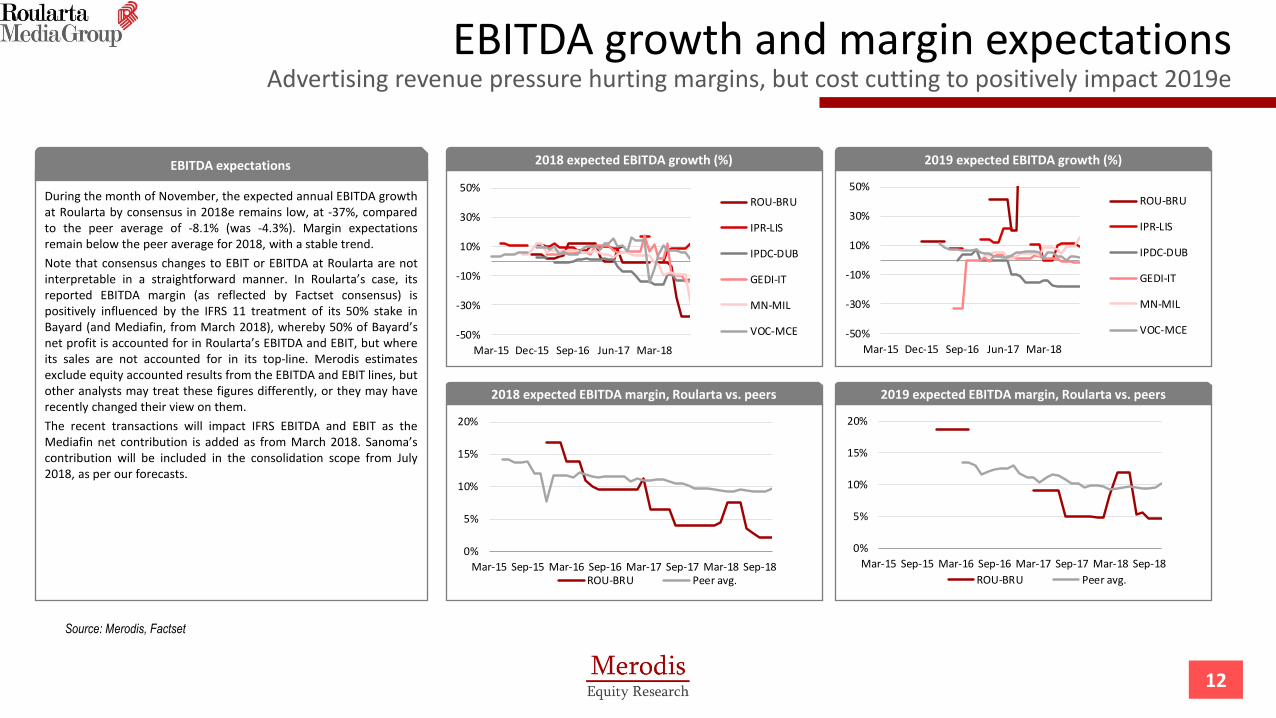
EBITDA growth and margin expectations Advertising revenue pressure hurting margins, but cost cutting to positively impact 2019e
Source: Merodis, Factset
EBITDA expectations
During the month of November, the expected annual EBITDA growth at Roularta by consensus in 2018e remains low, at -37%, compared to the peer average of -8.1% (was -4.3%). Margin expectations remain below the peer average for 2018, with a stable trend.
Note that consensus changes to EBIT or EBITDA at Roularta are not interpretable in a straightforward manner. In Roularta’s case, its reported EBITDA margin (as reflected by Factset consensus) is positively influenced by the IFRS 11 treatment of its 50% stake in Bayard (and Mediafin, from March 2018), whereby 50% of Bayard’s net profit is accounted for in Roularta’s EBITDA and EBIT, but where its sales are not accounted for in its top-line. Merodis estimates exclude equity accounted results from the EBITDA and EBIT lines, but other analysts may treat these figures differently, or they may have recently changed their view on them.
The recent transactions will impact IFRS EBITDA and EBIT as the Mediafin net contribution is added as from March 2018. Sanoma’s contribution will be included in the consolidation scope from July 2018, as per our forecasts.
2018 expected EBITDA growth (%)
2019 expected EBITDA margin, Roularta vs. peers 2018 expected EBITDA margin, Roularta vs. peers
0%
5%
10%
15%
20%
Mar-15 Sep-15 Mar-16 Sep-16 Mar-17 Sep-17 Mar-18 Sep-18ROU-BRU Peer avg.
0%
5%
10%
15%
20%
Mar-15 Sep-15 Mar-16 Sep-16 Mar-17 Sep-17 Mar-18 Sep-18
ROU-BRU Peer avg.
-50%
-30%
-10%
10%
30%
50%
Mar-15 Dec-15 Sep-16 Jun-17 Mar-18
ROU-BRU
IPR-LIS
IPDC-DUB
GEDI-IT
MN-MIL
VOC-MCE -50%
-30%
-10%
10%
30%
50%
Mar-15 Dec-15 Sep-16 Jun-17 Mar-18
ROU-BRU
IPR-LIS
IPDC-DUB
GEDI-IT
MN-MIL
VOC-MCE

2019 expected Payout, Sector
13
Consensus payout expectations Margin pressure and the Medialaan/Mediafin swap may impact the dividend strategy
Source: Merodis, Factset
Dividend payout
Roularta announced on 16 January 2018 that no ordinary dividend will be paid out on 2017 earnings, which compared to our previous forecast of €0.20/share. The company announced, however, a €5/share interim dividend (€63m pay out) which was paid out on 19 July 2018. The intention was to remunerate shareholders for the €145m capital gain on the Medialaan disposal which was closed in February 2018.
Roularta’s targeted pay-out ratio is 30%, which is in line with its average payout ratio prior to the acquisition in France of c32% (2002-2006) and broadly in line with the Sector average.
Consensus still expects Roularta to pay out a dividend in 2019e (contrary to MERe), with an expected payout of 14% (flat m-o-m).
The Mediafin acquisition and the Medialaan disposal is likely to have a negative impact on Roularta’s dividend outlay given the lower cash-generation potential of Mediafin vs. Medialaan. Given our forecast of losses in 2018e and 2019e, we do not expect any dividends soon despite the company’s solid balance sheet which holds an expected net cash position of €99m for 2018e.
2018 expected Payout, Sector
2019 expected payout, Roularta vs. Peers 2018 expected payout, Roularta vs. Peers
0
20
40
60
80
100
120
Mar-15 Mar-16 Mar-17 Mar-18ROU-BRU Peer avg.
0
10
20
30
40
50
Mar-15 Sep-15 Mar-16 Sep-16 Mar-17 Sep-17 Mar-18 Sep-18ROU-BRU Peer avg.
0
20
40
60
80
100
120
Mar-15 Dec-15 Sep-16 Jun-17 Mar-18
ROU-BRU
IPR-LIS
IPDC-DUB
GEDI-IT
MN-MIL
VOC-MCE 0
10
20
30
40
50
Mar-15 Dec-15 Sep-16 Jun-17 Mar-18
ROU-BRU
IPR-LIS
IPDC-DUB
GEDI-IT
MN-MIL
VOC-MCE
2019 NFD/EBITDA, sector
14
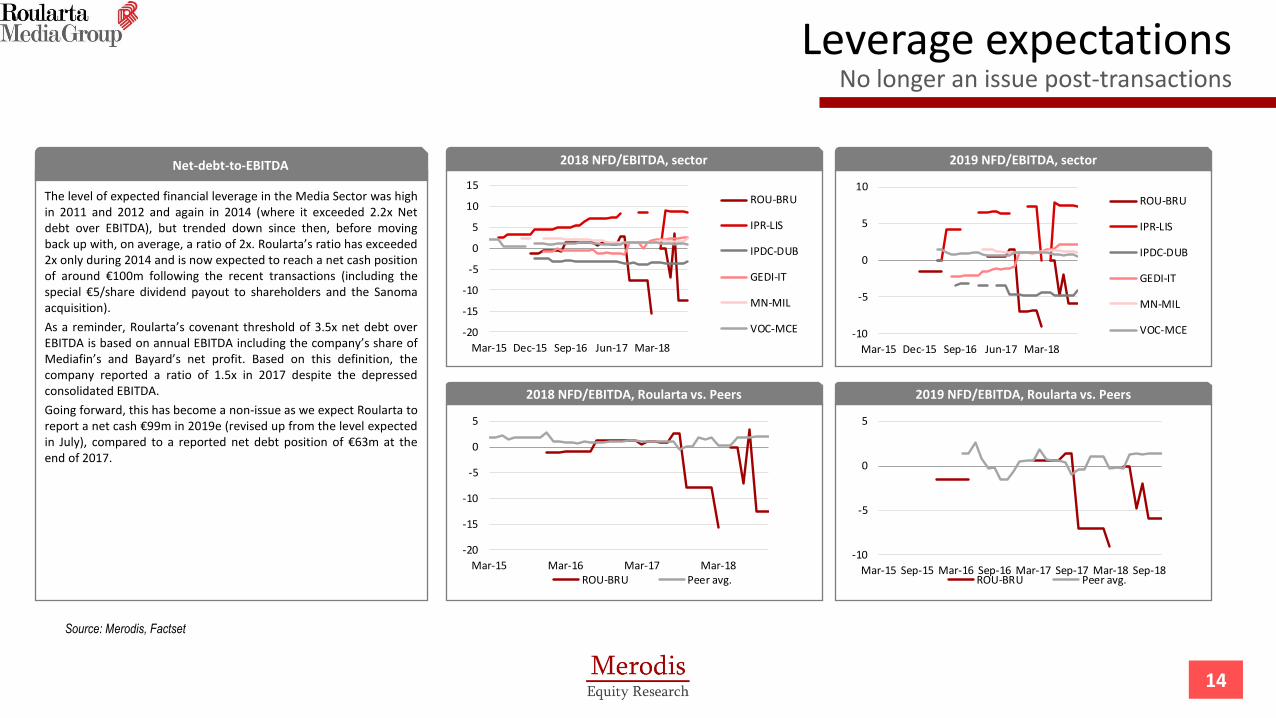
Leverage expectations No longer an issue post-transactions
Source: Merodis, Factset
Net-debt-to-EBITDA
The level of expected financial leverage in the Media Sector was high in 2011 and 2012 and again in 2014 (where it exceeded 2.2x Net debt over EBITDA), but trended down since then, before moving back up with, on average, a ratio of 2x. Roularta’s ratio has exceeded 2x only during 2014 and is now expected to reach a net cash position of around €100m following the recent transactions (including the special €5/share dividend payout to shareholders and the Sanoma acquisition).
As a reminder, Roularta’s covenant threshold of 3.5x net debt over EBITDA is based on annual EBITDA including the company’s share of Mediafin’s and Bayard’s net profit. Based on this definition, the company reported a ratio of 1.5x in 2017 despite the depressed consolidated EBITDA.
Going forward, this has become a non-issue as we expect Roularta to report a net cash €99m in 2019e (revised up from the level expected in July), compared to a reported net debt position of €63m at the end of 2017.
2018 NFD/EBITDA, sector
2019 NFD/EBITDA, Roularta vs. Peers 2018 NFD/EBITDA, Roularta vs. Peers
-20
-15
-10
-5
0
5
10
15
Mar-15 Dec-15 Sep-16 Jun-17 Mar-18
ROU-BRU
IPR-LIS
IPDC-DUB
GEDI-IT
MN-MIL
VOC-MCE -10
-5
0
5
10
Mar-15 Dec-15 Sep-16 Jun-17 Mar-18
ROU-BRU
IPR-LIS
IPDC-DUB
GEDI-IT
MN-MIL
VOC-MCE
-20
-15
-10
-5
0
5
Mar-15 Mar-16 Mar-17 Mar-18ROU-BRU Peer avg.
-10
-5
0
5
Mar-15 Sep-15 Mar-16 Sep-16 Mar-17 Sep-17 Mar-18 Sep-18ROU-BRU Peer avg.
Historical EBIT Margin, Roularta vs. Peers
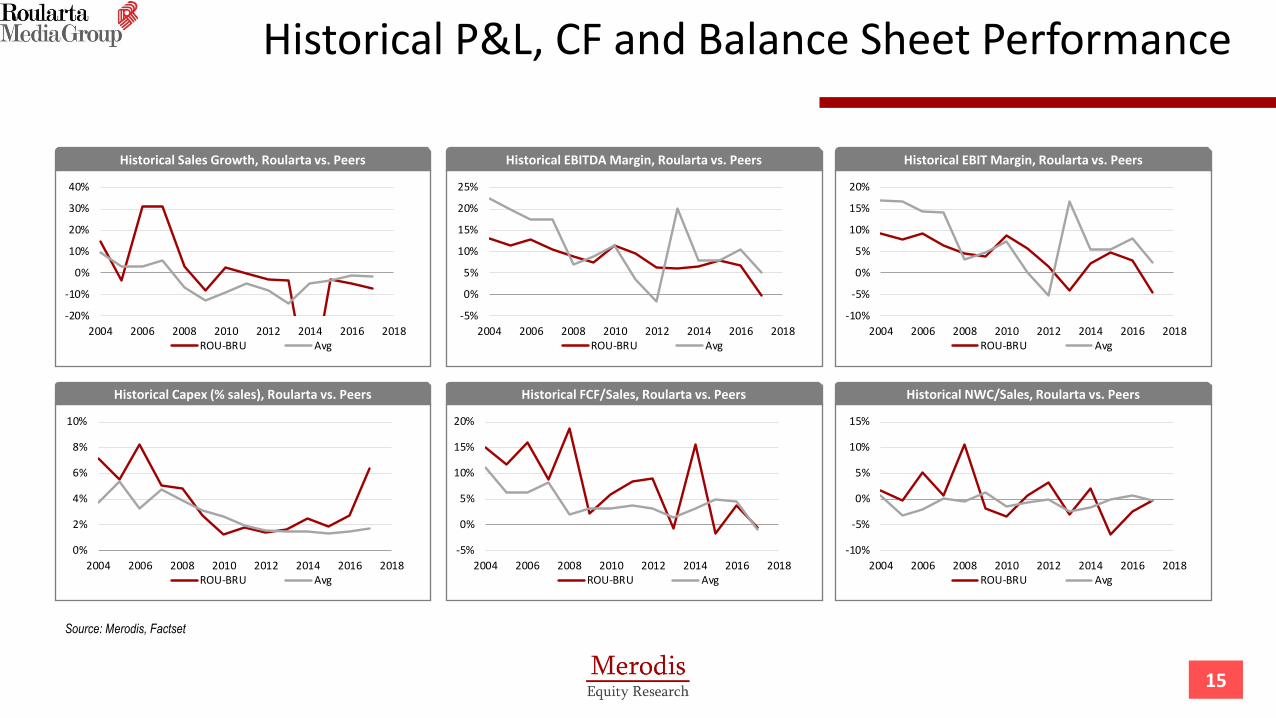
15
Historical P&L, CF and Balance Sheet Performance
Source: Merodis, Factset
Historical EBITDA Margin, Roularta vs. Peers
Historical NWC/Sales, Roularta vs. Peers Historical FCF/Sales, Roularta vs. Peers
Historical Sales Growth, Roularta vs. Peers
Historical Capex (% sales), Roularta vs. Peers
-20%
-10%
0%
10%
20%
30%
40%
2004 2006 2008 2010 2012 2014 2016 2018ROU-BRU Avg
-5%
0%
5%
10%
15%
20%
25%
2004 2006 2008 2010 2012 2014 2016 2018ROU-BRU Avg
-10%
-5%
0%
5%
10%
15%
20%
2004 2006 2008 2010 2012 2014 2016 2018ROU-BRU Avg
0%
2%
4%
6%
8%
10%
2004 2006 2008 2010 2012 2014 2016 2018ROU-BRU Avg
-5%
0%
5%
10%
15%
20%
2004 2006 2008 2010 2012 2014 2016 2018ROU-BRU Avg
-10%
-5%
0%
5%
10%
15%
2004 2006 2008 2010 2012 2014 2016 2018ROU-BRU Avg
16
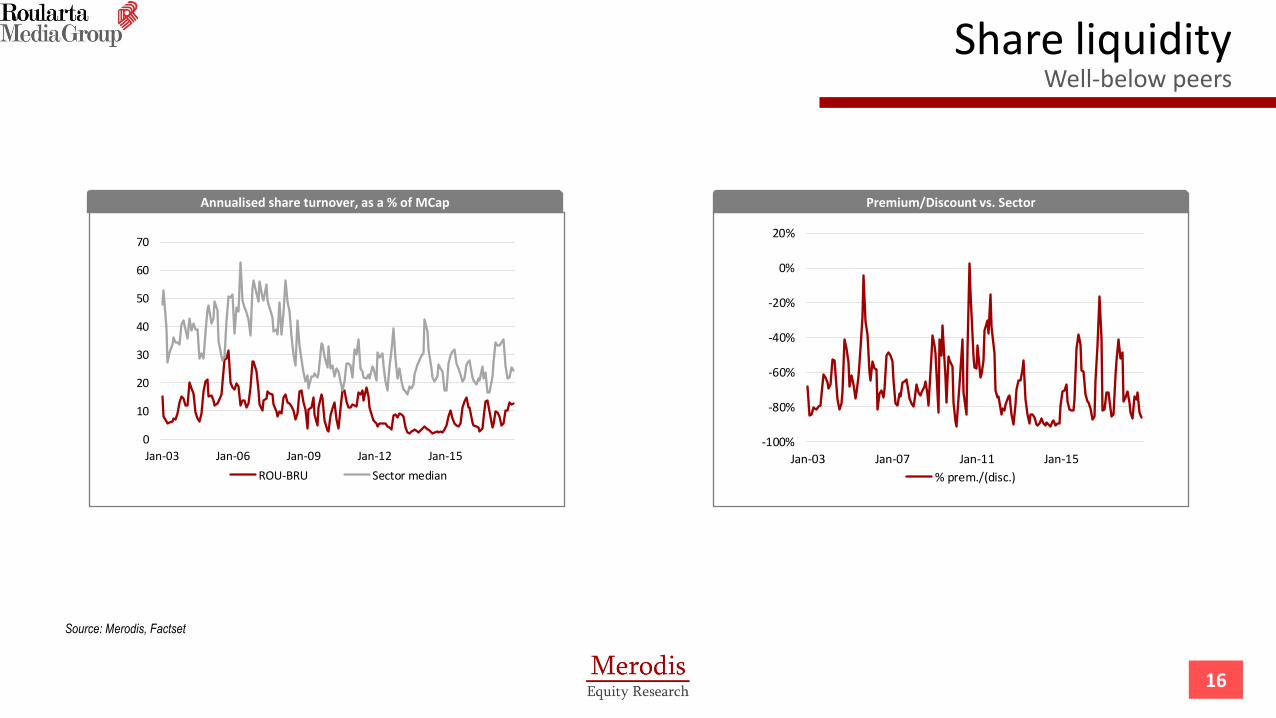
Share liquidity Well-below peers
Source: Merodis, Factset
Annualised share turnover, as a % of MCap Premium/Discount vs. Sector
0
10
20
30
40
50
60
70
Jan-03 Jan-06 Jan-09 Jan-12 Jan-15
ROU-BRU Sector median
-100%
-80%
-60%
-40%
-20%
0%
20%
Jan-03 Jan-07 Jan-11 Jan-15
% prem./(disc.)

17
Financial tear sheet
Ente
rpri
se V
alu
e (
€m
): 1
8M
arke
t C
ap. (
€m
): 1
97
Fre
e-f
loat
MC
ap (
€m
): 3
0
Co
nso
lid
ate
d P
&L (
€m
)2
00
62
00
72
00
82
00
92
01
02
01
12
01
22
01
32
01
42
01
52
01
62
01
72
01
8e
20
19
e2
02
0e
CA
GR
06
-17
CA
GR
18
-20
e
Sale
s6
09
76
77
82
70
77
12
73
17
12
67
73
00
29
22
79
25
82
83
30
42
90
-7.5
1.2
EBIT
DA
78
81
70
53
82
70
45
42
20
18
16
15
34
-32
.7-1
2.0
EBIT
51
50
33
10
57
36
5-4
94
12
7-1
3-6
8-8
-7n
a-6
6.9
Pre
tax
pro
fit
49
36
18
-35
12
8-4
-57
-37
2-1
8-7
3-7
-7n
a-6
9.6
Net
pro
fit
25
16
14
-43
11
5-3
-58
-14
26
42
1-1
17
8-1
-1n
an
aC
om
bin
ed
P&
L (
€m
)2
00
62
00
72
00
82
00
92
01
02
01
12
01
22
01
32
01
42
01
52
01
62
01
72
01
8e
20
19
e2
02
0e
06
-17
18
-20
eSa
les
49
14
77
47
14
76
28
73
29
36
13
49
12
.1EB
ITD
A4
64
85
55
31
15
31
31
62
03
.9EB
IT2
33
34
23
6-1
18
01
4n
aP
reta
x p
rofi
t1
62
63
73
1-1
67
52
4n
aN
et p
rofi
t-5
8-1
42
64
21
-11
75
24
na
Cash
Flo
w (
€m
)2
00
62
00
72
00
82
00
92
01
02
01
12
01
22
01
32
01
42
01
52
01
62
01
72
01
8e
20
19
e2
02
0e
06
-17
18
-20
eA
dj.
EB
ITD
A7
28
06
73
67
76
33
92
11
71
51
61
53
4-3
2.2
-12
.0W
CR
22
46
2-1
0-1
94
17
-16
4-1
7-8
04
14
-1n
an
aG
ros
Op
CF
95
84
12
92
65
86
65
65
21
-38
18
18
2-3
5.3
-50
.2C
ap
ex-5
0-3
8-3
5-2
0-8
0-4
-6-7
-5-8
-16
-4-1
4-7
-9.6
32
.3FC
F2
01
37
4-8
24
46
44
-10
27
05
-26
58
-1n
an
aN
et d
isp
./(a
cq.)
-21
4-1
44
57
-91
01
91
21
61
72
20
-90
na
na
Div
iden
ds
pa
id-8
-8-9
00
-6-4
00
0-6
-6-6
30
0-2
.3n
aEq
uit
y is
sue
51
-13
28
20
-30
00
00
00
00
na
na
Oth
ers
-29
-2-1
7-1
20
-16
-19
2-4
1-6
31
00
00
na
na
Net
Deb
t (i
ncr
.)/d
ecr.
-18
2-2
48
13
91
52
22
0-7
-66
18
-51
62
-1-1
-27
.7n
aB
ala
nce
Sh
eet
(€m
)2
00
62
00
72
00
82
00
92
01
02
01
12
01
22
01
32
01
42
01
52
01
62
01
72
01
8e
20
19
e2
02
0e
06
-17
18
-20
eW
C1
71
3-4
9-3
9-2
0-2
4-4
1-2
5-5
1-2
1-1
3-1
3-1
7-3
1-2
9n
a3
3.3
Ca
pit
al
Emp
loye
d6
60
68
96
40
58
46
02
58
15
49
51
12
21
29
82
95
15
41
68
15
61
54
-12
.4-4
.3D
isco
nti
nu
ed A
sset
s0
00
00
00
01
52
00
12
90
00
na
na
Ca
sh &
Eq
uiv
ale
nt
42
32
11
07
24
43
57
95
13
43
95
14
31
05
10
41
03
0.3
-1.0
Gro
ss D
ebt
26
32
78
27
51
98
15
51
24
14
81
27
11
61
14
10
81
06
66
6-8
.00
.0Eq
uit
y2
85
28
43
18
31
23
45
35
13
45
28
71
43
20
82
22
20
32
44
23
22
28
-3.0
-3.2
Gro
wth
(%
)2
00
62
00
72
00
82
00
92
01
02
01
12
01
22
01
32
01
42
01
52
01
62
01
72
01
8e
20
19
e2
02
0e
Sale
s3
13
13
-83
0-3
-3-5
81
-4-6
10
7-5
EBIT
DA
40
4-1
4-2
45
4-1
5-3
5-6
-54
-8-1
0-9
43
55
-29
9EB
IT4
8-1
1-3
1-2
31
31
-32
-73
na
na
13
9-5
8n
an
an
an
aN
et p
rofi
t1
0-3
6-1
4n
an
a-5
0n
an
an
an
a-6
7n
an
an
an
aFC
F-5
1-3
64
91
na
na
92
-6n
an
a-1
00
18
85
9n
an
a4
2n
aN
WC
-57
-24
na
-20
-49
19
72
-38
99
-58
-39
-23
08
6-5
Ca
pit
al
Emp
loye
d1
23
4-7
-93
-4-5
-7-5
73
5-1
-48
9-7
-2Sh
are
ho
lder
Eq
uit
y3
20
12
-21
12
-2-1
7-5
04
57
-92
0-5
-2Fin
an
cial
Rati
os
20
06
20
07
20
08
20
09
20
10
20
11
20
12
20
13
20
14
20
15
20
16
20
17
20
18
e2
01
9e
20
20
eG
ross
ma
rgin
(%
)7
17
47
57
67
87
67
57
67
27
57
67
67
77
77
6EB
ITD
A m
arg
in (
%)
13
11
98
12
10
66
76
60
21
1EB
IT m
arg
in (
%)
97
44
96
2-4
25
2-5
-2-2
-3N
et m
arg
in (
%)
42
2-1
42
0-9
-47
22
8-4
28
00
Op
ex/S
ale
s (%
)8
78
99
29
28
89
19
49
49
49
29
49
99
89
89
8D
epre
cia
tio
n/S
ale
s (%
)3
33
32
22
33
34
44
44
Dep
reci
ati
on
/EB
ITD
A (
%)
25
29
37
42
22
22
34
41
45
52
63
11
26
22
73
33
31
0Ta
x ra
te (
%)
48
55
31
-84
37
43
28
-3-8
9-6
71
-4-8
20
00
Ca
pex
/Sa
les
(%)
85
53
10
11
22
36
15
2FC
F/Sa
les
(%)
32
9-1
36
6-1
90
2-1
02
30
WC
R/S
ale
s (%
)4
18
-1-3
12
-21
-6-3
01
5-1
WC
/Sa
les
(%)
32
-6-6
-3-3
-6-4
-17
-7-5
-5-6
-10
-10
Ca
pit
al
Emp
loye
d/S
ale
s (%
)1
08
90
82
83
85
79
77
75
74
10
21
06
59
59
51
53
Gea
rin
g (%
)7
48
35
03
93
12
51
92
65
63
62
63
1-4
0-4
2-4
2N
et D
ebt/
EBIT
DA
(x)
2.8
3.0
2.4
2.4
1.4
1.3
1.5
1.8
4.2
4.2
3.5
62
.2-2
1.7
-30
.4-2
7.5
RO
CE
po
st-t
ax
(%)
63
33
63
16
83
28
-95
01
2R
OE
(%)
10
65
-19
4-1
-18
-66
37
10
-53
50
0D
ivid
end
Pa
you
t (%
)3
35
20
02
23
00
00
10
30
08
30
0V
alu
ati
on
20
06
20
07
20
08
20
09
20
10
20
11
20
12
20
13
20
14
20
15
20
16
20
17
20
18
e2
01
9e
20
20
e0
6-1
71
8-2
0e
Ma
rket
Ca
pit
ali
sati
on
(€
m)
57
96
69
39
31
84
24
82
75
18
51
55
16
22
08
31
93
05
19
71
97
19
7-5
.70
.0+
Net
Fin
an
cia
l D
ebt
(€)
22
22
46
16
51
27
11
18
97
07
68
27
65
76
3-1
00
-99
-98
-10
.9-1
.0+
Res
tate
d M
in. +
oth
ers
(€m
)3
83
82
21
51
71
61
43
52
01
01
01
01
01
01
0-1
1.6
0.0
- A
sso
cia
tes
& I
nv.
(€
m)
16
11
12
10
11
12
14
14
12
31
76
16
72
09
09
09
01
.90
.0=
Ente
rpri
se V
alu
e (
€m
)8
24
94
25
68
31
63
65
36
92
54
25
31
41
11
82
19
35
81
81
92
0-7
.35
.4A
sso
c. N
FD (
gr. s
ha
re)
(€m
)0
00
00
00
00
-6-6
-6-6
-6-6
EV/S
ale
s (x
)1
.41
.20
.70
.40
.50
.50
.40
.40
.30
.40
.81
.40
.10
.10
.1EV
/EB
ITD
A (
x)1
0.5
11
.68
.25
.94
.55
.35
.66
.07
.26
.61
3.5
35
5.6
4.0
5.9
5.7
EV/E
BIT
(x)
16
.11
9.0
17
.43
0.9
6.4
10
.45
3.7
-5.1
36
.09
.63
2.7
-27
.6-0
.3-2
.5-2
.7EV
/FC
F (x
)4
2.2
75
.07
.7-3
7.3
15
.17
.95
.8-2
5.0
5.3
na
42
.8-1
3.7
3.4
2.5
-17
.2EV
/Ca
pit
al
Emp
loye
d (
x)1
.21
.40
.90
.50
.60
.60
.50
.50
.60
.40
.72
.30
.10
.10
.1P
/E (
x)2
3.3
42
.02
8.9
-45
.08
.21
7.9
-74
.0-2
.7-1
.13
.21
4.7
-27
.72
.5-2
56
-23
0.6
P/B
VP
S (x
)2
.02
.41
.20
.60
.70
.80
.50
.51
.11
.01
.41
.50
.80
.80
.9FC
F yi
eld
(%
)3
.41
.91
8.9
-4.6
9.8
16
.92
3.7
-6.5
16
.40
.01
.6-8
.62
.73
.9-0
.6P
er
share
data
20
06
20
07
20
08
20
09
20
10
20
11
20
12
20
13
20
14
20
15
20
16
20
17
20
18
e2
01
9e
20
20
e0
6-1
71
8-2
0e
# o
f sh
are
s1
1.0
11
1.0
41
3.1
31
3.1
31
3.1
31
3.1
41
3.1
41
3.1
41
3.1
41
3.1
41
3.1
41
3.1
41
3.1
41
3.1
41
3.1
41
.60
.0#
of
avg
sh
. (FD
, ex-
trea
s.)
10
.96
11
.03
13
.26
13
.43
13
.42
13
.21
13
.18
13
.05
12
.97
13
.07
13
.03
13
.03
13
.03
13
.03
13
.03
1.6
0.0
Sha
re p
rice
52
.65
60
.61
29
.96
14
.02
18
.85
20
.95
14
.06
11
.81
12
.36
15
.85
24
.24
23
.20
15
.00
15
.00
15
.00
-7.2
0.0
EPS
2.2
61
.44
1.0
4-0
.31
2.3
11
.17
-0.1
9-4
.44
-11
.04
.92
1.6
5-0
.84
6.0
1-0
.06
-0.0
7n
an
aEP
S FD
2.2
61
.44
1.0
4-0
.31
2.3
11
.17
-0.1
9-4
.44
-11
.04
.92
1.6
5-0
.84
6.0
1-0
.06
-0.0
7n
an
aB
VP
S2
5.8
82
5.7
02
4.2
22
3.7
52
6.2
82
6.7
32
6.2
32
1.8
41
0.9
01
5.8
01
6.9
21
5.4
51
8.5
51
7.6
61
7.3
8-4
.6-3
.2D
PS
0.7
50
.75
0.0
00
.00
0.5
00
.35
0.0
00
.00
0.0
00
.50
0.5
00
.00
5.0
00
.00
0.0
0n
an
aS
ou
rce
: C
om
pa
ny d
ata
, M
ero
dis
Eq
uity R
ese
arc
h
Fin
an
cia
l su
mm
ary
18
Disclaimer
This Report is solely for the information of the recipients. All information contained in this research report has been compiled from sources believed to be reliable. However, no representation or warranty, express or implied, is made with respect to the completeness or accuracy of its contents, and it is not to be relied upon as such. Opinions contained in this research report represent the authors’ current opinions on the date of the report only. Merodis is not soliciting an action based upon it, and under no circumstances is it to be used or considered as an offer to sell, or a solicitation of any offer to buy.
This report is provided solely for the information of professional investors who are expected to make their own investment decisions without undue reliance on this report and Merodis accepts no liability whatsoever for any direct or consequential loss arising from any use of this report or its contents.
ANALYST CERTIFICATION:
Merodis has been mandated by the subject company to produce a neutral, fair, and elaborate equity research report about the subject company with the aim to increase investors’ awareness about the stock. The authors hereby declare that this report represents their personal opinion and that the company has neither limited nor in any other way influenced the content of this report. No part of the research analyst's compensation was, is, or will be, directly or indirectly, related to the specific opinions or views expressed by the research analyst in this research report.
The authors also declare that they are not shareholders of the subject company and that they have no other economic interest in the subject company than through their current mandate.
This Report is and at all times shall remain the exclusive property of Merodis.
This Report contains statements, estimates and projections provided by the Client concerning anticipated future performance. Such statements, estimates and projections reflect assumptions by our Client concerning anticipated results, which may or may not prove to be correct. No representations, expressed or implied are made as to the accuracy of such statements, estimates and projections.
All communication regarding this Report and requests for additional information should be directed to Merodis:
Arnaud W. Goossens
Partner
For more information about
Merodis
please visit:
www.merodis.com