
Rotational dynamic characteristics of the shaft line of a...
16
Rotational dynamic characteristics of the shaft line of a polar supply and research vessel during open water, cav- itation and ice navigation R.J.O. de Waal 1 , K. Soal 1 , A. Bekker 1 , P.S. Heyns 2 1 Stellenbosch University, Department of Mechanical & Mechatronic Engineering, Sound and Vibration Research Group, Private Bag X1, Matieland 7602, South Africa e-mail: [email protected] 2 University of Pretoria, Department of Mechanical and Aeronautical Engineering, The Centre for Asset Integrity Management, Pretoria, Private Bag X20, Hatfield 0028, South Africa Abstract In order to estimate the forces exerted on a ship’s propulsion system as well as the expected fatigue life, the rotational dynamics of the system during operation need to be accurately modelled. Inverse techniques are required to model the forces on the propeller from measurements on the shaft line and bearings, inside the hull of the vessel. The rotational dynamic response of the shaft line on a polar supply and research vessel, during a voyage to Antarctica, is investigated. Three case studies are presented, namely open water, cavitation and ice navigation. The maximum torque and thrust measured for the three cases were 493 kNm during ice navigation and 741 kN during cavitation. Operational modal analysis was performed, from which it was observed that unique mechanisms were at work during each case, resulting in different bending responses of the system. The effects of combined cavitation and ice impacts have the potential to significantly increase the shaft line loads, thereby reducing fatigue life. 1 Introduction Efficient and safe shipping activities in Arctic regions are an increasing requirement, especially for the propulsion system of vessels [1]. This is due to maritime transport in ice-covered seas being expected to increase in future decades [2]. Vessels sailing in ice infested waters experience additional ice-related loads on the propulsion system that affect the efficiency and safety of vessel operations [3]. The propellers of these vessels are therefore required to operate efficiently in ice and open water and need to withstand both extreme loads and fatigue loads [1]. Ice-going vessels suffer from transient torsional vibration induced by propeller- ice interaction and since January 2011 it is required of all ice going vessels to calculate these vibrations in accordance with Classification Society Rules [4]. These circumstances lead to the interest in ice loads on the propulsion system of vessels. Propeller-ice interaction is defined as the influence of ice on the hydrodynamic performance of the propeller as well as physical contact between the propeller and ice [3]. Extreme loading as well as cyclic moderate loading of the propeller is increased during propeller-ice interaction, where extreme loading dictates the ultimate strength and cyclic moderate loading dictates the fatigue life of the propeller [1]. Ice-related loads are typically measured between the engine and the propeller on the shaft line for both full-scale trials and model-scale tests [3]. This results in the measured load including a dynamic response of the mechanical transmission line elements, which is not equal to the propeller loads [3]. The use of numerical methods can 2183
Transcript of Rotational dynamic characteristics of the shaft line of a...
Rotational dynamic characteristics of the shaft line of apolar supply and research vessel during open water, cav-itation and ice navigation
R.J.O. de Waal 1, K. Soal 1, A. Bekker 1, P.S. Heyns 2
1 Stellenbosch University, Department of Mechanical & Mechatronic Engineering,Sound and Vibration Research Group,Private Bag X1, Matieland 7602, South Africae-mail: [email protected]
2 University of Pretoria, Department of Mechanical and Aeronautical Engineering,The Centre for Asset Integrity Management,Pretoria, Private Bag X20, Hatfield 0028, South Africa
AbstractIn order to estimate the forces exerted on a ship’s propulsion system as well as the expected fatigue life, therotational dynamics of the system during operation need to be accurately modelled. Inverse techniques arerequired to model the forces on the propeller from measurements on the shaft line and bearings, inside the hullof the vessel. The rotational dynamic response of the shaft line on a polar supply and research vessel, duringa voyage to Antarctica, is investigated. Three case studies are presented, namely open water, cavitation andice navigation. The maximum torque and thrust measured for the three cases were 493 kNm during icenavigation and 741 kN during cavitation. Operational modal analysis was performed, from which it wasobserved that unique mechanisms were at work during each case, resulting in different bending responses ofthe system. The effects of combined cavitation and ice impacts have the potential to significantly increasethe shaft line loads, thereby reducing fatigue life.
1 Introduction
Efficient and safe shipping activities in Arctic regions are an increasing requirement, especially for thepropulsion system of vessels [1]. This is due to maritime transport in ice-covered seas being expected toincrease in future decades [2]. Vessels sailing in ice infested waters experience additional ice-related loadson the propulsion system that affect the efficiency and safety of vessel operations [3]. The propellers of thesevessels are therefore required to operate efficiently in ice and open water and need to withstand both extremeloads and fatigue loads [1]. Ice-going vessels suffer from transient torsional vibration induced by propeller-ice interaction and since January 2011 it is required of all ice going vessels to calculate these vibrations inaccordance with Classification Society Rules [4]. These circumstances lead to the interest in ice loads on thepropulsion system of vessels.
Propeller-ice interaction is defined as the influence of ice on the hydrodynamic performance of the propelleras well as physical contact between the propeller and ice [3]. Extreme loading as well as cyclic moderateloading of the propeller is increased during propeller-ice interaction, where extreme loading dictates theultimate strength and cyclic moderate loading dictates the fatigue life of the propeller [1]. Ice-related loadsare typically measured between the engine and the propeller on the shaft line for both full-scale trials andmodel-scale tests [3]. This results in the measured load including a dynamic response of the mechanicaltransmission line elements, which is not equal to the propeller loads [3]. The use of numerical methods can
2183
assist to predict the global loads on the propeller, but are not adequate for efficiency and reliability designoptimization [1]. This is due to no in-depth, definitive study existing on propeller-ice interaction [5] andthere is a lack of knowledge regarding the physical processes during propeller-ice interaction that causesthese loads [1].
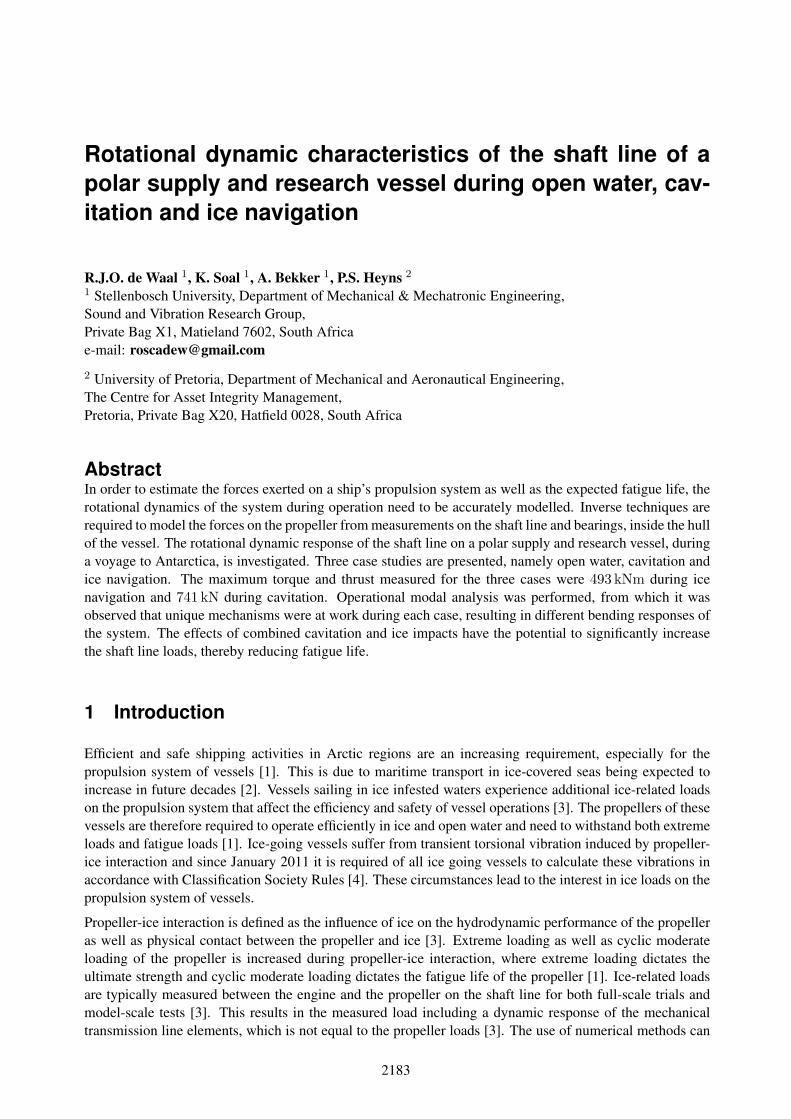
An example of internal torsional vibration obtained through full-scale measurements on the shaft line of theSAA II in Antarctica during propeller-ice interaction is presented in Figure 1. The torque fluctuates about afixed torque value not equal to zero. This represents the hydrodynamic load which can be defined as the waterresistance against the rotating propeller which causes a constant torque to be induced [2]. The hydrodynamicload is presented by a dotted line in Figure 1. The rapid increase of internal torque is due to ice-inducedloading on the propeller, indicated by 1. The second peak (2) that occurs after propeller-ice impact couldbe caused by a shear stress wave that propagates back and forth along the shaft line [2]. The reason for thequick deterioration of torque fluctuations (3) is as a result of water damping, which causes the internal torqueprofile to decay smoothly [2].
Time [s]
To
rqu
e [
kN
m]
80
100
120
140
160
180
200
0 1 2
1
2 3
Figure 1: Torque response of the SAA II shaft during propeller-ice impact over a two second interval on 12December 2015 at 09h27 during a voyage to Antarctica.
Propeller loads could be more effectively determined from blade measurements compared to shaft measure-ments [2]. However, the complications with blade measurements include the interaction of the blades withthe working environment, ice impacts that damage the sensors [6] and high installation costs due to the re-quirement of cable ducting through the shaft to the propeller blades [2]. It is due to these harsh operatingconditions of blades that strain gauges are only feasible in laboratory-testing studies to show the practicaltechnique limitations of sensor survival [6]. Current full-scale measurements of ice loads rely on shaft linemeasurements through strain gauges, which are installed between the propeller and the engine, to determinethe thrust and torque of propulsion on the shaft line [2]. A major factor that challenges the determination ofice loads on the propeller, based on shaft measurements, is the dynamic response of the propulsion system.This dynamic response includes that of the engine, the shaft and the propeller [2].
The bending or whirling modes play a role in the dynamic performance of the shaft line system. The naturalfrequencies, damping and mode shapes are effected by the bearings and structure surrounding the shaft lineas well as the oil film stiffness, shaft speed, static loading on the bearings and the propeller’s hydrodynamicmass [7]. Computational models suffer from uncertainties due to inaccurate numerical estimates of oil filmstiffness and hydrodynamic mass [8]. Operational modal analysis (OMA) offers a data driven modellingapproach to the operational estimation of bending modes and the possible coupling to torque and thrustmodes and aft body modes.
A vessel is able to navigate through water by converting the torque, which is generated by the engine, intothrust through the propeller [9]. The propeller is able to generate this thrust by creating a positive pressureon the faces of the blades and a negative pressure on the back [9]. Beyond a certain rotational speed, the flowpattern of water over the blades breaks down, resulting in a severe loss of thrust and physical damage over
2184 PROCEEDINGS OF ISMA2016 INCLUDING USD2016

Figure 2: Cavitation during an ice blockage test [5].
time due to cavitation [9]. A major concern relating to cavitation is therefore the result of thrust breakdown[10]. The Encyclopædia Britannica [11] defines cavitation as the ’formation of vapour bubbles within aliquid at low-pressure regions that occur in places where the liquid has been accelerated to high velocities.’
During cavitation, the propeller surface is exposed to continuous impacts from a fluctuating pressure field[9]. According to Casciani-Wood [9], cavitation damage usually appears on the back of the propeller bladeswith a strong radial pattern. This is due to the most significant pressure reductions occurring on the backof the blade, with greater rotational speed increasing the possibility of cavitation [9]. Sharma et al. [12]performed experiments on five model propellers and reported tip vortex cavitation to be the dominating typeof cavitation, followed by side sheet cavitation. It was also observed that bubble and sheet cavitation wereresponsible for severe blade surface erosion as well as noise problems. The authors noted that the behaviourof a propeller is directly influenced by the shape of the vessel as the propeller operates in the wake of thehull.
Cavitation does not only occur in open water, but in ice infested water as well (Figure 2). Stable sheet andvortex cavitation develops when the blade of the propeller passes behind a ice debris, with cloud cavitationforming as the wake of the ice-flow develops [13]. The result is a reduction in mean forward hydrodynamicloads as a result of propeller-ice interaction. This can cause a thirty percent increase in the aftwards directedloads on the propeller [13]. Walker [13] states that cavitation additionally increases oscillatory hydrodynamicloads, inducing the propulsion system of the vessel to fatigue.
Cavitation not only effects the propeller of the vessel, but the hull as well. This is due to rapid fluctuationsof the cavity volume of cavitation, resulting in vibration of the hull and leading to structural failure, mal-functioning of equipment and discomfort of the crew [10]. It has been noted that tip vortex cavitation, in itsdeveloped stages, has caused broadband excitation of the vessel hull structures [10]. There are many differ-ent forms of cavitation hindering the performance of a vessel, with sheet cavitation having been reported toresult in pressure fluctuations in the flow of water over the propeller [10].
Therefore, in order to further investigate the dynamic characteristics of a shaft line system, full scale mea-surement were conducted on the Polar Supply and Research Vessel SA Agulhas II (SAA II). The SAA II wasmanufactured in Rauma shipyard in 2012 by STX Finland [2]. The hull was strengthened in accordance withDNV ICE-10 and the vessel was built to Polar Ice Class PC 5 [14], meaning the vessel is rated for year-roundoperations in medium first-year ice containing old ice inclusions [15]. The vessel measures 134 m in lengthand 22 m in breadth. She is driven by four Wartsila 3 MW diesel generators that power two Conver Teamelectric motors of 4.5 MW each and are connected to Rolls-Royce four bladed variable pitch propellers withindividual shaft lines [16]. The aim of these investigations was to perform data driven modelling of therotational dynamics for the following reasons:
1. Contribute towards sparse literature of full scale measurements and operational techniques through
MODAL TESTING: METHODS AND CASE STUDIES 2185

x
z25.9 m
23.8 m 5.1 m 2 m
z
-y-x
g g p
Figure 3: Accelerometers and strain gauges, for torque and thrust, mounted along the shaft line. Adaptedfrom [16].
which loads can be identified and compared.
2. Investigate the physical mechanisms and possible effects of ice loading and cavitation on shaft linedynamics.
3. For future comparison to numerical simulations of the related dynamic response.
4. As a first step in further investigations into energy flow through the system in terms of torque, thrustand bending which need to be considered for inverse force estimation and fatigue life estimation.
2 Method
Full-scale measurements were performed on the SAA II. The shaft line of the ship was instrumented withstrain gauges for thrust and torque to determine the effective loads on the propeller. Three sets of accelerom-eters were installed along the shaft line to conduct operational modal analysis in order to estimate the systembending modes. Machine control data was recorded by the on-board computer and could be utilized inconjunction with the torque, thrust and accelerometer data.
2.1 Shaft line measurements
Torque and thrust were measured on the port side intermediate shaft line using HBM strain gauges (3/350VY41 for torque and 3/350 XY71 for thrust) placed in a full bridge and T-rosette configuration. The config-urations were such that they rejected bending and temperature variations of the shaft. These strain gaugeswere located 25.9 m from the propeller’s center of gravity, as presented in Figure 3. In addition to the straingauge measurements on the shaft line, accelerometers were mounted at three locations on the shaft supportstructures. The orientation of the accelerometers is indicated in Figure 3. Data was acquired through a HBMQuantum mobile data acquisition system, transmitted to a laptop via an ethernet cable and recorded throughCatman AP V3.5 software at a sample rate of 600 Hz.
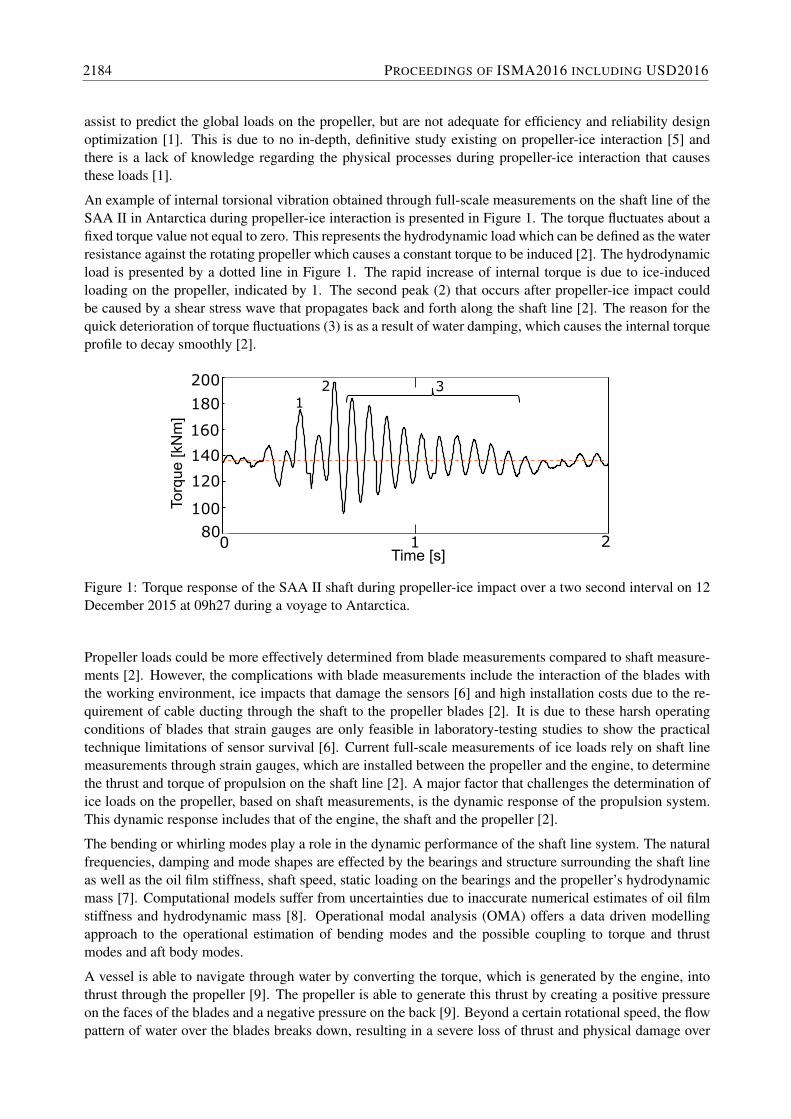
The thrust T-rosette strain gauges were installed in pairs on either side of the shaft, aligned along the centre-line. Full bridge torque strain gauges were inclined at ±45◦ to the centreline of the shaft to determine themaximum shear stress on the surface of the shaft. The strain gauge layout for measuring torque and thrustare presented in Figure 4a and 4b. The general equation used for a full Wheatstone bridge configuration is[17]:
UA
UE=k
4(ε1 − ε2 + ε3 − ε4) (1)
2186 PROCEEDINGS OF ISMA2016 INCLUDING USD2016
Qzy
x
(a) (b)
Figure 4: Strain gauge configuration for (a) torque measurements on a twisting shaft and (b) thrust measure-ments. Adapted from [17].
with k denoting the gauge factor of the strain gauges, which was 1.99 for torque and 2 for thrust. Whenclockwise torque is applied, strain gage number 2 and 4 will sense negative torque and strain gage 1 and 3will sense positive torque. Thus the absolute value of all strains (ε1 to ε4) will be the same and equation 1can be reduced to [17]:
UA
UE= kε (2)
Torque, Q, and strain can be related through the following equation:
Q =επE(d4
2 − d41)
16(1 + ν)d2(3)
where
Q is the torque response of the shaft line [kNm]E is the modulus of elasticity [Pa]ε is the normal strain measured by strain gauges [mm/mm]d1 is the inner diameter of the shaft [m]d2 is the outer diameter of the shaft [m]ν is the Poisson’s Ratio of the shaft [-]
Thrust can be derived from the strain measurements through the following relation [17]:
UA
UE=k
4[ε1 − (−νε1) + ε3 − (−νε3)] (4)
Ideally the axial strains (ε1 and ε3) is equal, thus Equation 4 can be further simplified to:
UA
UE=k
2ε(1 + ν) (5)
Thrust, Tshaft, can therefore be obtained from the T-rosette Wheatstone bridge output voltage by the follow-ing equation:
Tshaft =εEπ(d2
2 − d21)
4(6)
2.2 Analytical validation
In order to validate the measurements, measured shaft line torque was compared to the motor output torque.It is realized that there exists a transmissibility between the two locations, however for the present workthis transmissiblity was neither measured nor modelled. The motor torque was calculated from the motorrotational speed and motor power, obtained from the machine control data, as presented in Equation 7 [18].
MODAL TESTING: METHODS AND CASE STUDIES 2187
13 00 13 10 13 20 13 30 13 40 13 50 14 00120
140
160
180
200
Time [hour]
To
rqu
e [
kN
m]
Shaft line torque Motor torque
: : : : : : :
(a)
13 00 13 10 13 20 13 30 13 40 13 50 14 0050
100
150
200
250
Time [hour]
Th
rust
[kN
]
Shaft line thrust Analytical calculation
: : : : : : :
(b)
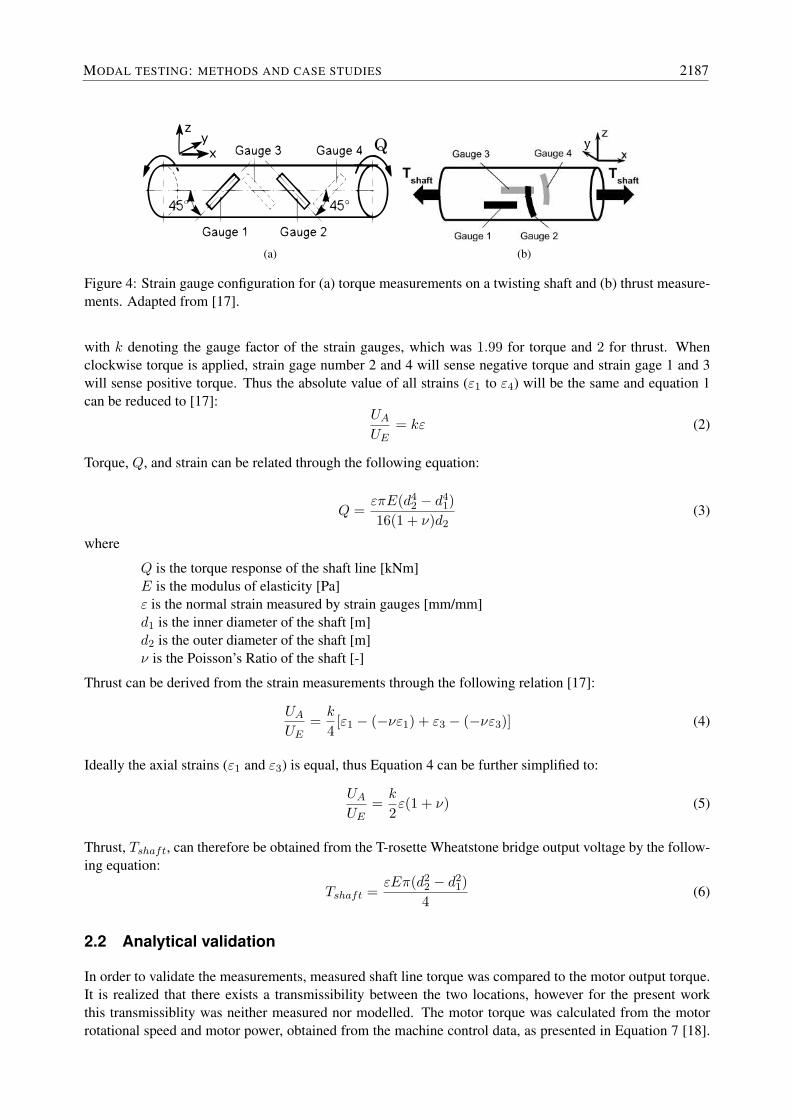
Figure 5: Validation of (a) shaft line torque against motor torque and (b) shaft line thrust against analyticalcalculations on 2 February 2016, 13h00 to 14h00 (SOG: 7.1 knots, shaft speed: 108.2 rpm, pitch: 99.6 %,motor power: 1688 kW).
Thrust was determined according to the methodology proposed by Matusiak [19] to estimate the vesselresistance in water, as presented in Equation 8.
P = Qω (7)
Tprop =PηOηR
V (1− w)(8)
P denotes the motor power [kW ], Q the motor torque [kNm], ω the motor rotational speed [rad/s], Tprop
the analytical propeller thrust [kN ], ηO the open water efficiency, ηR the rotational efficiency, V the vesselspeed [m/s] and w the wake fraction. Matusiak [19] recommends using the following approximations ifthe required data to determine the thrust variables is unavailable, as was done for the SAA II: ηO = 0.65,ηR = 1 and w = 0.05. The results obtained are displayed in Figure 5. Matusiak [19] states that the vesselresistance equation could lead to unrealistically high values at low vessel speeds. Therefore a case of openwater where the vessel was sailing at speed was selected.
The thrust comparison correlated well, whereas the torque validation presented a mean offset of 24.5 kNm.It is expected for the motor torque to closely match the shaft line torque due to the shaft line being a directdrive from the electric motor. This difference could be attributed to the fact that the dynamic response of theshaft line is superimposed on the hydrodynamic response of the shaft line and therefore the transmissibilitybetween the measured location on the shaft line and the electric motor has not been taken into account. Thereis a large difference in sample rate between the two data sets, where torque and thrust was sampled at 600 Hzand machine control data at under 1 Hz which will effect the resolution of the data.
2.3 Operational modal analysis
Operational modal analysis (OMA) is an output only technique, used to estimate the dynamic characteristicsof a system without known input forces. Since measurements were made on three bearings over 23 m fromthe propeller COG, the mode shapes cannot be used to identify the modes. However, the natural frequenciesand damping ratios can still provide valuable information about the shaft line bending dynamics. The rawvibration data was decimated to 60 Hz, and each direction was then analysed separately using the UnweightedPrinciple Components Stochastic Subspace Identification (UPC SSI) technique from Structural VibrationSolution’s ARTeMIS software.
2188 PROCEEDINGS OF ISMA2016 INCLUDING USD2016

0
200
400
Torq
ue [kN
m]
(a) (b)
−1000
−500
0
500
Th
rust
[kN
]
(c) (d)
0
5
10
[m/s2]
Accele
ration
-axis
x
(e) (f)
−2
0
2
[m/s2]
Accele
ration
y-a
xis
(g) (h)
2
0
2
[m/s2]
Accele
ration
z-a
xis
(i)
50 55 00 05 10 15 20Time [s]
(j)
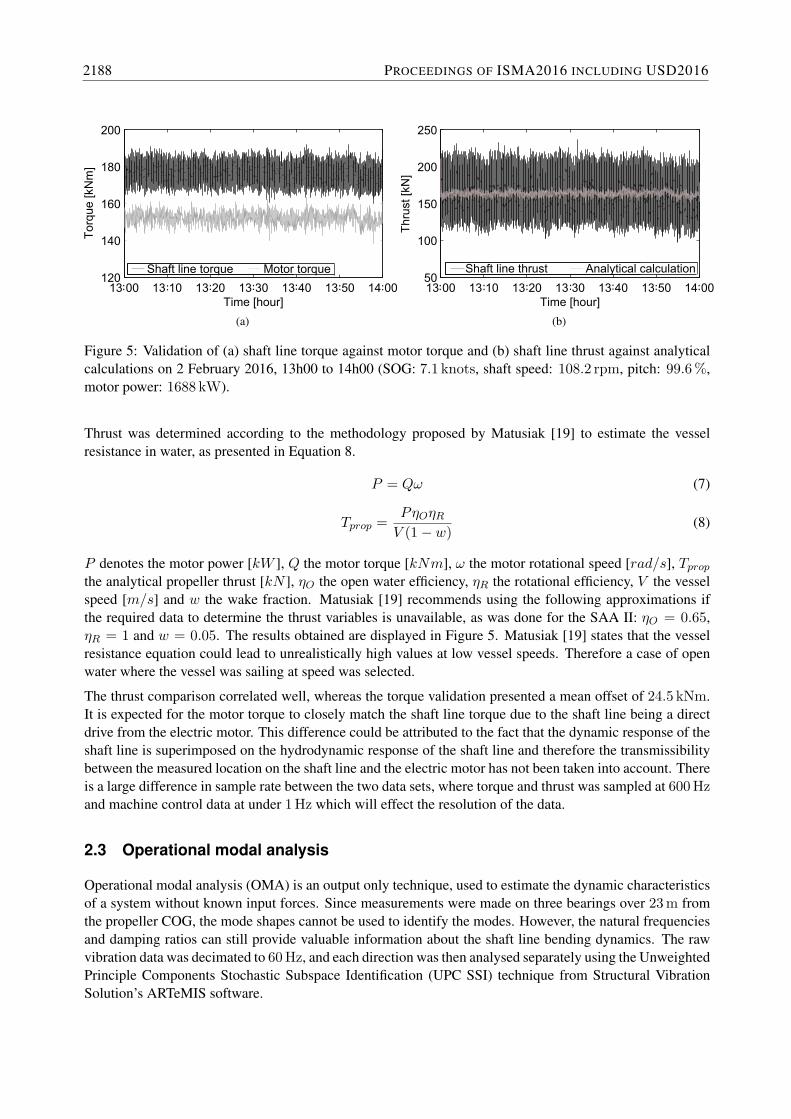
Figure 6: Comparison of two cavitation scenarios on (left) 14 January 2016 14h50 and (right) 15 December2015 10h52, with (a,b) shaft line torque, (c,d) shaft line thrust, (e,f) x-axis vibration, (g,h) y-axis vibrationand (i,j) z-axis vibration for Set 1 accelerometers.
MODAL TESTING: METHODS AND CASE STUDIES 2189
0
200
400
Torq
ue [
kN
m]
(a) (b)
−1000
−500
0
500
Th
rust
[kN
]
(c) (d)
0
5
10
[m/s2]
Accele
ration
x-a
xis
(e) (f)
−2
0
2
[m/s2]
Accele
ration
y-a
xis
(g) (h)
−2
0
2
[m/s2]
Accele
ration
z-a
xis
00 05 10 15 20 25 30
Time [s]
(i)
20 25 30 35 40 45Time [s]
(j)
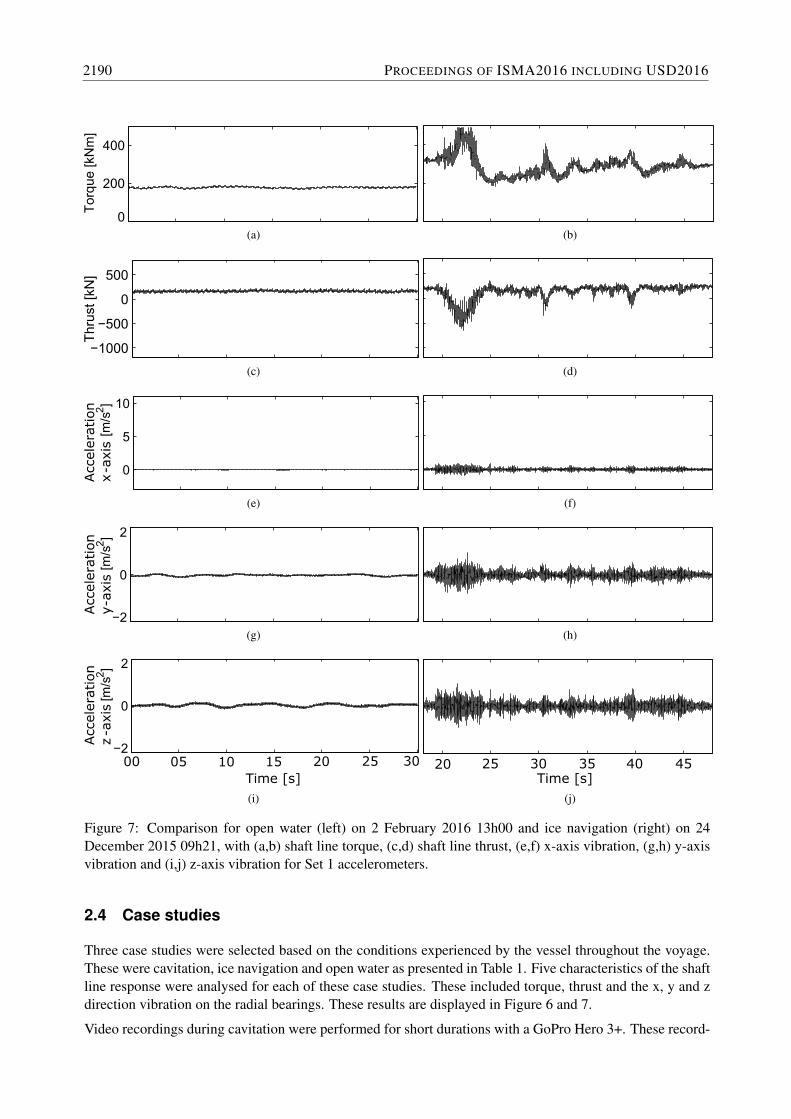
Figure 7: Comparison for open water (left) on 2 February 2016 13h00 and ice navigation (right) on 24December 2015 09h21, with (a,b) shaft line torque, (c,d) shaft line thrust, (e,f) x-axis vibration, (g,h) y-axisvibration and (i,j) z-axis vibration for Set 1 accelerometers.
2.4 Case studies
Three case studies were selected based on the conditions experienced by the vessel throughout the voyage.These were cavitation, ice navigation and open water as presented in Table 1. Five characteristics of the shaftline response were analysed for each of these case studies. These included torque, thrust and the x, y and zdirection vibration on the radial bearings. These results are displayed in Figure 6 and 7.
Video recordings during cavitation were performed for short durations with a GoPro Hero 3+. These record-
2190 PROCEEDINGS OF ISMA2016 INCLUDING USD2016
(a) (b)
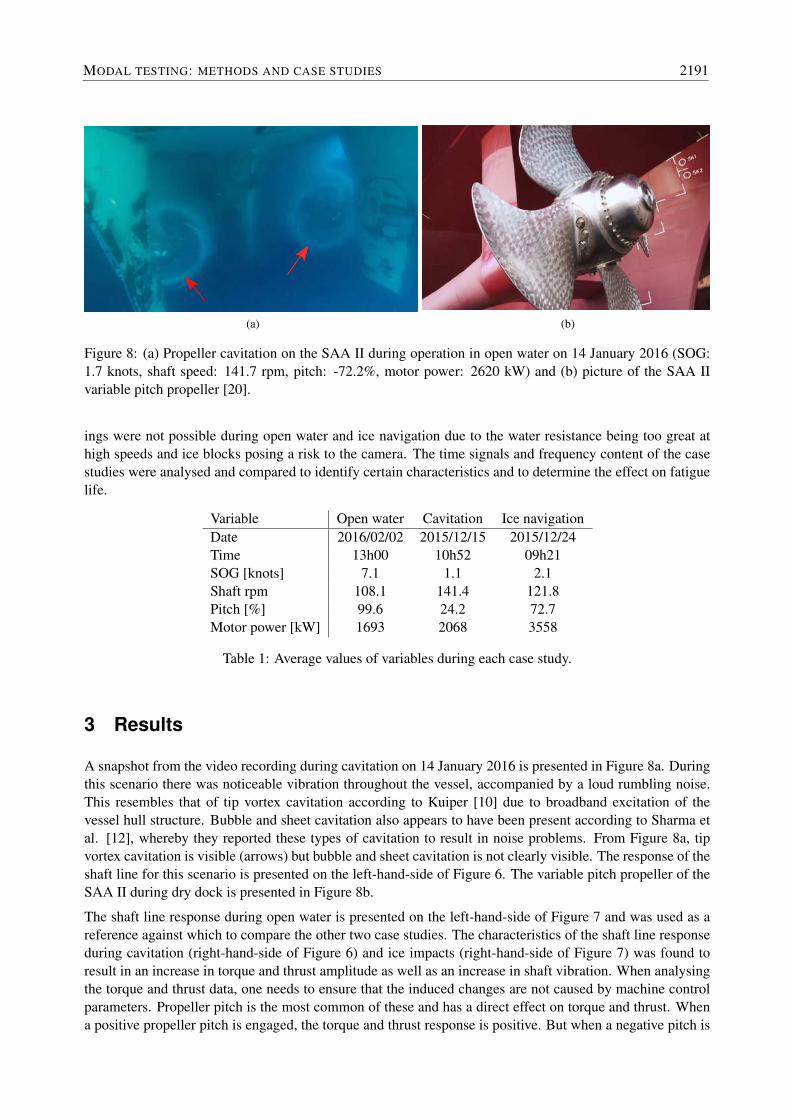
Figure 8: (a) Propeller cavitation on the SAA II during operation in open water on 14 January 2016 (SOG:1.7 knots, shaft speed: 141.7 rpm, pitch: -72.2%, motor power: 2620 kW) and (b) picture of the SAA IIvariable pitch propeller [20].
ings were not possible during open water and ice navigation due to the water resistance being too great athigh speeds and ice blocks posing a risk to the camera. The time signals and frequency content of the casestudies were analysed and compared to identify certain characteristics and to determine the effect on fatiguelife.
Variable Open water Cavitation Ice navigationDate 2016/02/02 2015/12/15 2015/12/24Time 13h00 10h52 09h21SOG [knots] 7.1 1.1 2.1Shaft rpm 108.1 141.4 121.8Pitch [%] 99.6 24.2 72.7Motor power [kW] 1693 2068 3558
Table 1: Average values of variables during each case study.
3 Results
A snapshot from the video recording during cavitation on 14 January 2016 is presented in Figure 8a. Duringthis scenario there was noticeable vibration throughout the vessel, accompanied by a loud rumbling noise.This resembles that of tip vortex cavitation according to Kuiper [10] due to broadband excitation of thevessel hull structure. Bubble and sheet cavitation also appears to have been present according to Sharma etal. [12], whereby they reported these types of cavitation to result in noise problems. From Figure 8a, tipvortex cavitation is visible (arrows) but bubble and sheet cavitation is not clearly visible. The response of theshaft line for this scenario is presented on the left-hand-side of Figure 6. The variable pitch propeller of theSAA II during dry dock is presented in Figure 8b.
The shaft line response during open water is presented on the left-hand-side of Figure 7 and was used as areference against which to compare the other two case studies. The characteristics of the shaft line responseduring cavitation (right-hand-side of Figure 6) and ice impacts (right-hand-side of Figure 7) was found toresult in an increase in torque and thrust amplitude as well as an increase in shaft vibration. When analysingthe torque and thrust data, one needs to ensure that the induced changes are not caused by machine controlparameters. Propeller pitch is the most common of these and has a direct effect on torque and thrust. Whena positive propeller pitch is engaged, the torque and thrust response is positive. But when a negative pitch is
MODAL TESTING: METHODS AND CASE STUDIES 2191
engaged, the torque response is positive and the thrust response negative. This is due to the rotation of theshaft line always being in the same direction. Therefore the torque is positive for both positive and negativepitch and will reduce as pitch changes to zero; however the torque will only reach zero when the shaft linestops rotating.
For the open water condition, the torque and thrust oscillate with time. For thrust this variation is containedto about 10 kN, whereas variation in the torque signal is about 50 kNm. The torque and thrust response fluc-tuates at a frequency of 1.8 Hz which is the same frequency as the shaft line rotational speed (1.8× 60rpm).This wave is therefore caused by the rotational driving torque of the electric motor. The characteristics ofeach case study is summarised in Table 2.
Torque [kNm] Thrust [kN]Open Ice Open Icewater Cavitation navigation water Cavitation navigation
Max peak 186.6 367.7 493.0 221.0 741.2 350.3Max amplitude 10.6 161.7 155.0 55.0 930.8 497.6Mean 176.8 159.3 290.2 161.4 19.0 132.6
Table 2: Summary of torque and thrust measurements.
When analysing the cavitation case study, it is interesting to note that there are sudden changes in the torqueresponse and significant fluctuations in the torque amplitude. Propeller pitch has a direct effect on the torqueand thrust. However, in this case there are sudden drops in torque when a general increase is expecteddue to a gradual increase in pitch. Contrary to expectations it is therefore observed that torque decreasesduring instances of cavitation. This complies with research done by Walker [13] whereby torque and thrustcoefficients were found to reduce during cavitation, indicating a reduction in the mean level of hydrodynamicload on the propeller during cavitation. A decrease in thrust was also observed, with significant effects on theamplitude. The fluctuations were severe enough to result in a reverse thrust of −1120 kN and a maximumamplitude of 931 kN.
Cavitation had the greatest effect on the x direction accelerometer, with a maximum acceleration of 7.3 m/s2.It is important to note that the accelerometers were mounted on the shaft line radial bearings and thereforethe x direction vibration is not solely attributed to the shaft vibration, but rather a combination of the shaftline and the vessel hull. The y and z direction was also significantly affected by cavitation with a maximumacceleration of 1.7 m/s2 and 2.1 m/s2 respectively. The maximum vibration recorded during the three casestudies are provided in Table 3.
Open water Cavitation Ice navigationx direction 0.1 m/s2 7.3 m/s2 0.9 m/s2
y direction 0.1 m/s2 1.7 m/s2 0.9 m/s2
z direction 0.2 m/s2 2.1 m/s2 1.0 m/s2
Table 3: Maximum accelerometer vibration on shaft line radial bearings for Set 1.
For ice navigation, the propeller pitch remained relatively constant and therefore the change in torque andthrust is the result of the propeller-ice interaction. The torque increased suddenly from around 325 kNm to470 kNm during the first propeller-ice impact phase. The thrust decreased from around 200 kN to −500 kNduring the associated time frame. The reason for the increase in torque, according to Huisman et al. [1] isdue to the extreme loading as well as cyclic moderate loading during propeller-ice interaction. The reason forthe large decrease in thrust could be due to the ice floes impacting the propeller from the bow-side, resultingin the elongation of the shaft. This reduction in thrust could also be due to the ice floes interrupting the flowof water over the propeller, but it is not likely that this alone could result in such a large decrease in thrust.
Fast Fourier Transforms (FFT) were calculated for the torque and thrust signals. The results for torque inFigure 9a allow for the following conclusions.
2192 PROCEEDINGS OF ISMA2016 INCLUDING USD2016
0 10 20 30 40 50 6010
✁ 4
10✁
2
100
102
104
Frequency [Hz]
Torq
ue A
mplit
ude [kN
m] Open water
Cavitation
Ice infested
-
-
(a)
0 10 20 30 40 50 6010
✁ 4
10✁
2
100
102
104
Frequency [Hz]
Thru
st A
mplit
ude [kN
] Open water
Cavitation
Ice infested
(b)
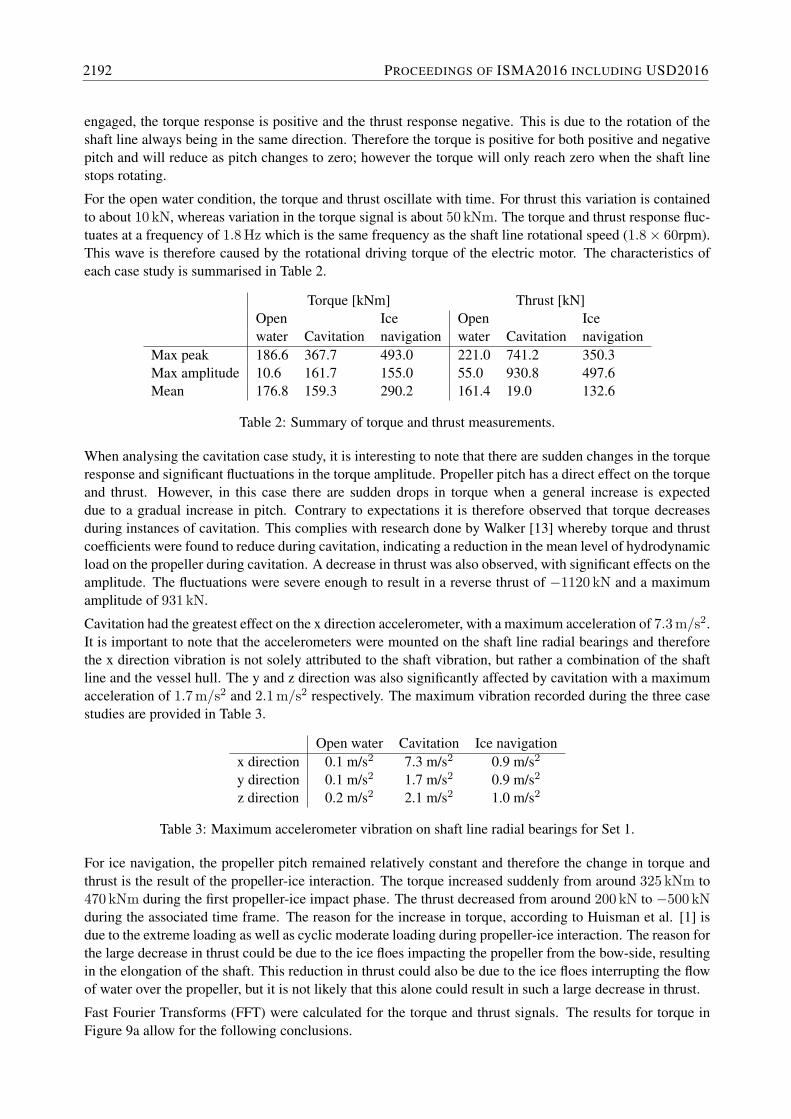
Figure 9: FFT of shaft line (a) torque and (b) thrust during open water, cavitation and ice navigation (Dura-tion: 30 seconds, sample rate: 600 Hz, block size: 4096, window: Flat Top, overlap: 50%).
• In each case study the rpm of the shaft could be identified as 1.8, 2.3 and 1.9 Hz for open water,cavitation and ice navigation respectively.
• The first blade-pass frequency of the four-bladed propeller was identified at 7.0 Hz for open water,9.2 Hz for cavitation and 9.5 Hz for ice navigation.
• The second blade-pass frequency was only clearly identifiable for open water and cavitation at 14.2and 18.8 Hz respectively, due to broad-band excitation caused by propeller-ice impacts.
• The natural frequency of the shaft line torsional vibration during open water was determined to be11.1 Hz, which is similar to the value of 11.2 Hz determined by Peltokorpi et al. [21] during full-scale measurements on-board the SAA II in the Baltic Sea. This peak decreased to 10.8 Hz duringcavitation and increased to 11.3 Hz during ice navigation. The reason for this is attributed to thechange in boundary conditions between the shaft line and the working environment.
• The second natural frequency of the shaft line torsional vibration was evident for all three case studiesaround 46.3 Hz, however it was not dominant during ice navigation due to broad-band excitation fromice impacts.
• For ice navigation, there was a dominating frequency content around 5.3 Hz which was not evident inthe other two case studies. This could be due to propeller-ice impacts not always occurring on all fourblades for the same ice piece, but only three of the blades resulting in a frequency content three timesthe shaft rpm being excited. This can however not be confirmed and requires further investigation.
For the thrust FFT spectrum (Figure 9b), the same frequency contents were dominant as for the torque. Thedifference was that the second blade-pass frequency for ice navigation was dominant in the thrust frequencycontent at 19.0 Hz and cavitation had many more dominant frequencies compared to the torque FFT.
3.1 Operational Modal Analysis
Spectrograms of the acceleration signals were plotted in order to investigate the frequency content of thesignal over the measured duration. The spectrograms for open water, ice and cavitation in the z direction onbearing 2 (Set 2 accelerometers) are presented in Figure 10. The z and y directions showed similar resultsand bearing 2 was selected due to higher levels of measured vibration resulting in clearer frequency content.The spectrograms show unique results for each of the three cases. Open water, Figure 10a, contains the
MODAL TESTING: METHODS AND CASE STUDIES 2193

(a)
(b)
(c)
Tim
e [
s]
Tim
e [
s]
Tim
e [
s]
Figure 10: Spectrograms for shaft line vibration response of Set 2 accelerometers for (a) open water, (b) icenavigation and (c) cavitation.
lowest energy across the bandwidth 0 to 60 Hz. The rotational frequency of the shaft line is seen at 1.78 Hzas well as the 1st blade pass at 7.2 Hz and their respective harmonics. Frequency content in this bandwidth,which does not occur at harmonics are expected to be modes of the system and these are seen at 18.76 Hz,31.25 Hz and 42.90 Hz. During ice navigation, Figure 10b, the energy is mainly contained in two bandsbetween 18 to 25 Hz and 42 to 50 Hz. The rotational frequency of the shaft line is seen at 2.03 Hz and the1st blade pass at 8.11 Hz. The only clear peaks which do not occur near harmonics and are therefore thoughtto be modes are at 43.69 Hz and 45.64 Hz. The peak frequency content during ice navigation is the lowest ofthe three cases. Cavitation, Figure 10c, contains the most energy in this bandwidth with uniform broadbandexcitation. The rotational frequency and blade pass are not clearly observable and only one line containinghigher energy is observed at around 18.26 Hz. It is important to note that the observed modes of the systemcannot be identified by the mode shape, and only represent modes excited to measurable levels by the specificoperational regime i.e. open water, ice navigation and cavitation.
Open water CavitationNatural Damping Natural Damping
frequency [Hz] [%] frequency [Hz] [%]18.85 2.81 18.42 1.1831.23 0.19 20.23 4.4142.98 0.24 27.90 3.01
- - 33.75 3.47
Table 4: First bending modes in the z directions during open water and cavitation.
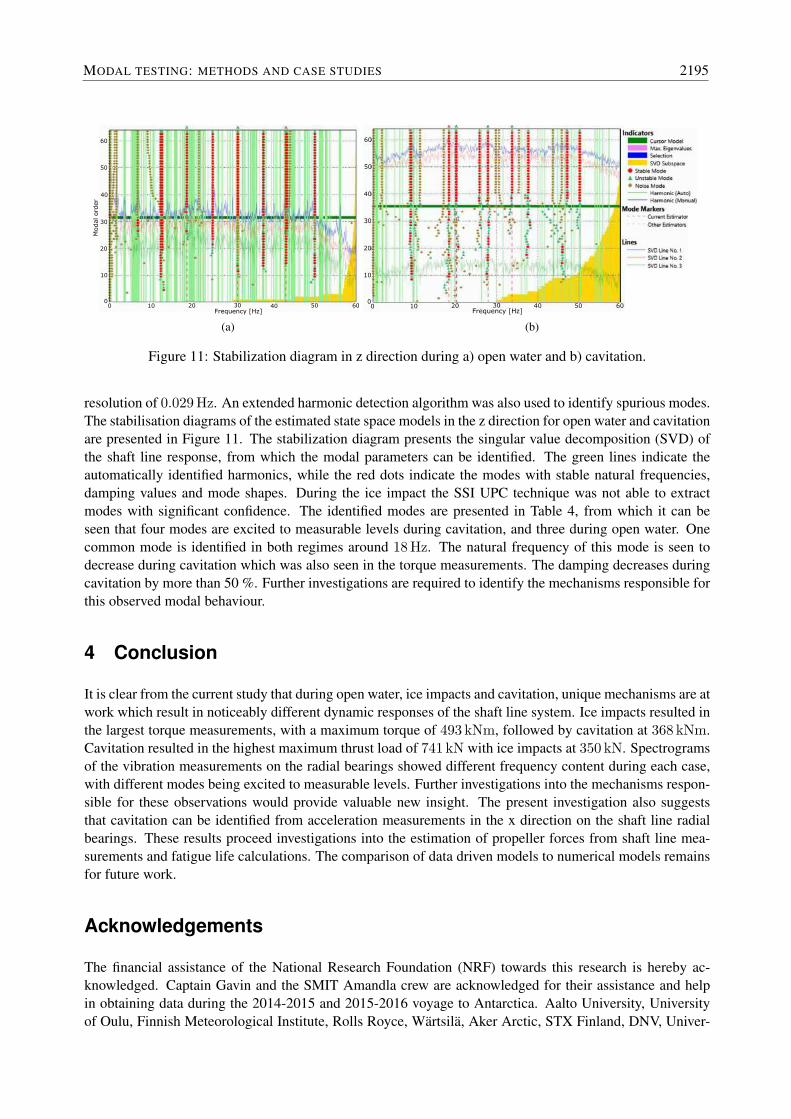
Modes were automatically selected using the SSI UPC estimation technique with a model order of 64 and a
2194 PROCEEDINGS OF ISMA2016 INCLUDING USD2016
0
10
20
30
40
50
60
10 20 30 40 50 600
Modal ord
er
Frequency [Hz]
(a)
0 10 20 30 40 50 600
10
20
30
40
50
60
Frequency [Hz]
(b)
Figure 11: Stabilization diagram in z direction during a) open water and b) cavitation.
resolution of 0.029 Hz. An extended harmonic detection algorithm was also used to identify spurious modes.The stabilisation diagrams of the estimated state space models in the z direction for open water and cavitationare presented in Figure 11. The stabilization diagram presents the singular value decomposition (SVD) ofthe shaft line response, from which the modal parameters can be identified. The green lines indicate theautomatically identified harmonics, while the red dots indicate the modes with stable natural frequencies,damping values and mode shapes. During the ice impact the SSI UPC technique was not able to extractmodes with significant confidence. The identified modes are presented in Table 4, from which it can beseen that four modes are excited to measurable levels during cavitation, and three during open water. Onecommon mode is identified in both regimes around 18 Hz. The natural frequency of this mode is seen todecrease during cavitation which was also seen in the torque measurements. The damping decreases duringcavitation by more than 50 %. Further investigations are required to identify the mechanisms responsible forthis observed modal behaviour.
4 Conclusion
It is clear from the current study that during open water, ice impacts and cavitation, unique mechanisms are atwork which result in noticeably different dynamic responses of the shaft line system. Ice impacts resulted inthe largest torque measurements, with a maximum torque of 493 kNm, followed by cavitation at 368 kNm.Cavitation resulted in the highest maximum thrust load of 741 kN with ice impacts at 350 kN. Spectrogramsof the vibration measurements on the radial bearings showed different frequency content during each case,with different modes being excited to measurable levels. Further investigations into the mechanisms respon-sible for these observations would provide valuable new insight. The present investigation also suggeststhat cavitation can be identified from acceleration measurements in the x direction on the shaft line radialbearings. These results proceed investigations into the estimation of propeller forces from shaft line mea-surements and fatigue life calculations. The comparison of data driven models to numerical models remainsfor future work.
Acknowledgements
The financial assistance of the National Research Foundation (NRF) towards this research is hereby ac-knowledged. Captain Gavin and the SMIT Amandla crew are acknowledged for their assistance and helpin obtaining data during the 2014-2015 and 2015-2016 voyage to Antarctica. Aalto University, Universityof Oulu, Finnish Meteorological Institute, Rolls Royce, Wartsila, Aker Arctic, STX Finland, DNV, Univer-
MODAL TESTING: METHODS AND CASE STUDIES 2195
sity of Pretoria and the Department of Environmental Affairs of South Africa are acknowledged for theircontribution towards this field of research.
References
[1] T.J. Huisman, R.W. Bos, G. Hagesteijn, J. Brouwer, H.J. de Koning Gans, Interaction between warmmodel ice and a propeller, Proceedings of the ASME 2014 33rd International Conference on Ocean,Offshore and Arctic Engineering OMAE2014, San Francisco, California, USA, 2014 June 8-13, ASME(2014).
[2] T. Ikonen, O. Peltokorpi, J. Karhunen, Inverse ice-induced moment determination on the propeller ofan ice-going vessel, Cold Regions Science and Technology (2014), Vol. 112.
[3] D. Polic, S. Ehlers, V. Æsøy, E. Pedersen, Shaft response as a propulsion machinery design load, Pro-ceedings of the ASME 2014 33rd International Conference on Ocean, Offshore and Arctic EngineeringOMAE2014, San Francisco, California, USA, 2014 June 8-13, ASME (2014).
[4] Det Norske Veritas, Ice Strengthening of Propulsion Machinery, Classification Notes, No. 51.1, Veri-tasveien (2011).
[5] R. Sampson, M. Atlar, N. Sasaki, Propeller ice interaction - effect of blockage proximity, First Interna-tional Symposium on Marine Propulsors, Trondheim, Norway, 2009 June.
[6] B.O. Al-Bedoor, S. Aedwesi, Y. Al-Nassar, Blades condition monitoring using shaft torsional vibrationsignals, Journal of Quality in Maintenance Engineering, Vol. 12, No. 3, Emerald Insight (2006), pp.275-293.
[7] American Bureau of Shipping, Guidance Notes on Ship Vibration, (2006).
[8] I. Asmussen, W. Menzel, H. Mumm, G. Lloyd, Ship Vibration, GL Technology, Hamburg (2001).
[9] J. Casciani-Wood, An introduction to propeller cavitation, International Institute of Marine Surveying(2015), URL http://www.iims.org.uk/introduction-propeller-cavitation.
[10] G. Kuiper, Cavitation research and ship propeller design, Applied Scientific Research, Vol. 58, KluwerAcademic Publishers (1998), pp. 33-50.
[11] Encyclopædia Britannica, Cavitation, (2016), URL http://www.britannica.com/science/cavitation.
[12] S.D. Sharma, K. Mani, V.H. Arakeri, Cavitation noise studies on marine propellers, Journal of Soundand Vibration, Vol. 138, No. 2, (1990), pp. 255-283.
[13] D. L. N. Walker, The influence of blockage and cavitation on the hydrodynamic performance of iceclass propellers in blocked flow, Memorial University of Newfoundland, PhD thesis, Newfoundland,Canada (1996).
[14] P. Kujala, J. Kulovesi, J. Lehtiranta, M. Suominen, Full-scale measurements on board S.A. Agulhas IIin the Antarctic waters 2013-2014, Aalto University, Technical report, Helsinki, Finland (2014).
[15] Det Norske Veritas, Classification of ships for navigation in ice, Rules for classification of ships, No.5.1, Veritasveien (2011).
[16] STX Finland Oy, Polar supply and research vessel shaft line arrangement, Technical drawings (2012).
[17] K. Hoffmann, Applying the wheatstone bridge circuit, HBM, Darmstadt, Germany (2001).
2196 PROCEEDINGS OF ISMA2016 INCLUDING USD2016
[18] R.G. Budynas, J.K. Nisbett, Shigley’s Mechanical Engineering Design, McGraw-Hill, 9th Edition, NewYork (2011).
[19] J. Matusiak, Dynamics of a Rigid Ship, Aalto University publication series, Department of AppliedMechanics, Helsinki, Finland (2013).
[20] Ship Year, STX SA Agulhas II Documentary: Taking Antarctic exploration to the next level, (2013),URL http://www.shipyearonline.co.za/articles/documentary-stx-sa-agulhas-2-4332.html.
[21] O. Peltokorpi, A. Bekker, J. Kulovesi, M. Suominen, P. Kujala, J. Karhunen, Full-scale measurementson a polar supply and research vessel during maneuver tests in an ice field in the baltic sea, Pro-ceedings of the ASME 2014 33rd International Conference on Ocean, Offshore and Arctic EngineeringOMAE2014, , San Francisco, California, USA, 2014 June 8-13, ASME (2014).
[22] J. Matusiak, Dynamic loads and response of icebreaker SISU during continuous icebreaking, AaltoUniversity, Technical report, Helsinki, Finland (1982).
MODAL TESTING: METHODS AND CASE STUDIES 2197

2198 PROCEEDINGS OF ISMA2016 INCLUDING USD2016