Rosneft Oil Company IFRS Results Q3 and 9M 2017 · PDF fileRosneft Oil Company IFRS Results Q3...
35
November 14, 2017 Rosneft Oil Company IFRS Results Q3 and 9M 2017
-
Upload
hoangnguyet -
Category
Documents
-
view
220 -
download
0
Transcript of Rosneft Oil Company IFRS Results Q3 and 9M 2017 · PDF fileRosneft Oil Company IFRS Results Q3...

November 14, 2017
Rosneft Oil Company
IFRS Results
Q3 and 9M 2017

Important Notice
Information herein has been prepared by the Company. The presented conclusions are based on the general information
collected as of the date hereof and can be amended without any additional notice. The Company relies on the information
obtained from the sources which it deems credible; however, it does not guarantee its accuracy or completeness.
These materials contain statements about future events and explanations representing a forecast of such events. Any
assertion in these materials that is not a statement of historical fact is a forward-looking statement that involves known and
unknown risks, uncertainties and other factors, which may cause our actual results, performance or achievements to be
materially different from any future results, performance or achievements expressed or implied by such forward-looking
statements. We assume no obligations to update the forward-looking statements contained herein to reflect actual results,
changes in assumptions or changes in factors affecting such statements.
This presentation does not constitute an offer to sell, or any solicitation of any offer to subscribe for or purchase any
securities. It is understood that nothing in this report / presentation provides grounds for any contract or commitment
whatsoever. The information herein should not for any purpose be deemed complete, accurate or impartial. The information
herein in subject to verification, final formatting and modification. The contents hereof has not been verified by the Company.
Accordingly, we did not and do not give on behalf of the Company, its shareholders, directors, officers or employees or any
other person, any representations or warranties, either explicitly expressed or implied, as to the accuracy, completeness or
objectivity of information or opinions contained in it. None of the directors of the Company, its shareholders, officers or
employees or any other persons accepts any liability for any loss of any kind that may arise from any use of this presentation
or its contents or otherwise arising in connection therewith.
2

3
Overview of Key Developments
Key events
Macroeconomic environment1
Indicator Q3 2017 Q2 2017 % 9M 2017 9M 2016 %
Urals, $/bbl 50.8 48.8 4.1% 50.6 40.0 26.5%
Urals, ‘000 RUB/bbl 3.00 2.79 7.5% 2.95 2.74 8.0%
Naphtha, ‘000 RUB/ton 26.6 24.1 10.4% 26.2 24.2 8.1%
Gasoil 0.1%, ‘000 RUB/ton 27.9 25.4 9.8% 27.1 25.4 6.5%
Fuel oil 3.5%, ‘000 RUB/ton 17.5 16.1 8.7% 16.9 13.1 29.6%
Average exchange rate, RUB/$ 59.0 57.2 3.1% 58.3 68.4 (14.8)%
Inflation for the period (CPI), % (0.5)% 1.3% 1.7% 4.1%
Approved first ever interim dividends with a payout ratio of 50% of IFRS net income
Closing the deal on acquisition of 49% of Essar Oil Limited
Closing the deal to acquire a 30% stake in Zohr project
Agreeing on tax incentives for the Samotlor field
Signing a strategic cooperation agreement and a long term crude oil supply contract with CEFC China
Note: (1) Average prices and changes are calculated based on unrounded data of analytical agencies

Key Operating Highlights
4
Indicator Q3 2017 Q2 2017 % 9M 2017 9M 2016 %
Hydrocarbon production, incl. kboed
5,674 5,703 (0.5)% 5,720 5,213 9.7%
Crude oil and NGL, kboed
4,571 4,566 0.1% 4,585 4,117 11.4%
Gas, kboed
1,103 1,137 (3.0)% 1,135 1,096 3.6%
Hydrocarbon production1, kboed
5,674 5,703 (0.5)% 5,720 5,655 1.1%
Refining throughput1, mmt
28.31 27.72 2.1% 84.33 83.49 1.0%
Refining depth1, %
77.1% 74.3% +2.8 p.p. 75.2% 74.0% +1.2 p.p.
Note: (1) Proforma data (Bashneft consolidated starting January 1, 2016)

Indicator Q3 2017 Q2 2017 % 9M 2017 9M 2016 %
EBITDA, RUB bn 371 306 21.2% 1,010 913 10.6%
Net income, RUB bn Attributable to Rosneft shareholders
47 64 (26.6)% 122 127 (3.9)%
Adjusted net income1, RUB bn Attributable to Rosneft shareholders
132 92 43.5% 334 336 (0.6)%
Adjusted operating cash flow2, RUB bn 231 274 (15.7)% 815 819 (0.5)%
CAPEX, RUB bn 223 215 3.7% 630 475 32.6%
Free cash flow, RUB bn 8 59 (86.4)% 185 344 (46.2)%
EBITDA, $ bn 6.3 5.3 18.9% 17.3 13.5 28.1%
Net income, $ bn Attributable to Rosneft shareholders
0.7 1.1 (36.4)% 2.0 2.0 -
Adjusted net income1, $ bn Attributable to Rosneft shareholders
2.2 1.6 37.5% 5.7 4.9 16.3%
Adjusted operating cash flow2, $ bn 3.9 4.7 (17.0)% 13.9 12.1 14.9%
CAPEX, $ bn 3.8 3.7 2.7% 10.8 7.0 54.3%
Free cash flow, $ bn 0.1 1.0 (90.0)% 3.1 5.1 (39.2)%
Urals price,
th. RUB/bbl 3.00 2.79 7.5% 2.95 2.74 8.0%
Key Financial Highlights
5
Note: (1) Adjusted for FX gains/losses and other one-off effects, (2) Adjusted for prepayments under long term crude oil supply contracts and operations with trading securities (RUB
equivalent). Adjusted operating cash flows for the respective periods also include interest on prepayments under long term crude oil supply contracts. The amount incudes both interest
accrued and offset against crude oil deliveries as well as interest paid – RUB 53 bn and RUB 8 bn for the 9M 2017 respectively (RUB 55 bn and RUB 12 bn for the 9M 2016)

6
Completion of a 49% Stake in Essar Acquisition
Rosneft successfully completed acquisition of a 49%
stake in Essar Oil Limited (EOL).
100% of EOL’s business was valued at $12.9 bn
Deal rationale:
Rosneft gets a significant share in the second largest
Indian refinery with Nelson complexity index at 11.8 (Top
10 complex refineries globally) and refining depth of
95.5%
Highly profitable product slate – gross refining margin
at c. $9
Higher flexibility in feedstock – possibility to process
heavy crude oil from Venezuela
All necessary infrastructure in place: port, storage
terminals and own power station
Access to one of the fastest growing markets in Asia
– cumulative GDP growth of 29.8% in 2013-16
Potential hub for international trading expansion in
the Asia-Pacific
Asset location
Expansion projects Existing assets
Refinery (capacity – 20 mmt, Nelson Index – 11.8)
Retail network (>3,500 stations)
Refinery optimization (capacity growth by 3.7 mmt)
Retail network expansion (up to 5,000 stations)
Essar Oil
Current assets structure
Arabian Sea
INDIA
SBM – Single Buoy Moring

7
Completion of a 30% Stake in Zohr Project Acquisition
Key features2 Deal rationale:
Participation in one of the largest recent discoveries
(more than 30% of estimated gas reserves in Egypt)
Entering into a unique scale project at low cost of the
proved reserves
Developed infrastructure
Access to the strategically important gas consumption
market with opportunities for further expansion in the
region
Diversifying international projects portfolio
Rosneft closed the deal to acquire a 30% stake in the
concession for the development of the Zohr gas field from
Italian company Eni. An option to increase the share up to
35% was granted
Acquisition price amounted to $1.1 bn. Rosneft also
reimbursed its share in ENI’s historical project costs
The shareholder structure upon the deal completion: Eni –
50%1, Rosneft – up to 35%1, BP – up to 15%1
Note: (1) Rosneft and BP have options for additional 5% each, BP joined the project on November 25, 2016 (acquisition of 10% share for ~$530 mln, including historical costs
compensation), (2) 100% stake if not specified, (3) Starting 2018, (4) ENI’s estimates
Asset location
Alexandria
Zohr
Atoll
Notus
License areas
with Eni’s participation
Gas fields discovered in 2015
Gas fields
Year of discovery by ENI 2015
Rosneft share of future investments
(next 4 years)3 >$2 bn
Project stage Development
Geological reserves4 c. 850 bcm
Production plateau/marketable gas 29/28 bcm

8
Strategic Cooperation with CEFC China
Expected shareholder structure1
In September, 2017 Rosneft and CEFC China signed
a Strategic cooperation agreement and a long term
crude oil supply contract at the 9th BRICS summit
The Strategic cooperation agreement provides for:
a joint development of upstream projects in West
and East Siberia
a cooperation in refining, petrochemicals and
trading
In September, 2017 the Glencore-QIA announced an
agreement with CEFC China on a partial sale of
14,16% in Rosneft
Upon the deal completion the new strategic
shareholder will enter the Company charter capital.
The diversified shareholder structure will match
Rosneft business profile
In November, 2017 Rosneft and CEFC China signed
an agreement to perform a joint preliminary study of
possible construction of petrochemical facility in
Hainan Province
Founded in 2002. The Company workforce accounts for
30,000 people, annual revenues exceeds $40 bn
The strategy of the Company seeks to expand
international economic cooperation in the energy sector
and establish a well-organized international investment
bank and an investment group
The largest private Chinese company
in the energy sector
Note: (1) Upon the successful completion of the transaction between the Glencore-QIA consortium and CEFC China

9
Tax Incentives for the Samotlor Field Development
Note: (1) As of January 1, 2017 (2) In Q3 2017
The supportive tax measures will ensure:
an impetus for one of the country largest fields with
a significant multiplicative effect
drilling of over 2,100 new oil wells
incremental production of c. 50 mmt
Key features of the Samotlor field:
Proved reserves (PRMS)1 – 3,853 mmbbl
Watercut – 96%
Current production2 – 382 kbpd
In October investment incentives for the Samotlor field
and their estimated effect were successfully confirmed
The approval of formal procedures for annual tax breaks
in the amount at RUB 35 bn for 10 years is expected by
the year end
The measures to be enacted starting January 1, 2018
after the amendments to the Tax Code will be approved
Operating Results
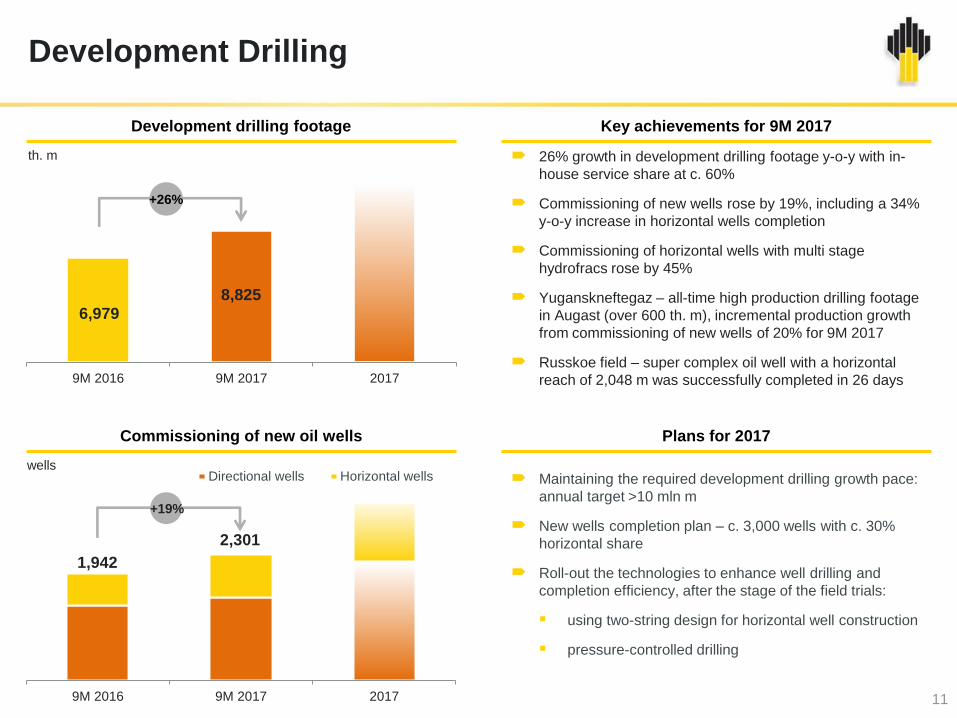
Development Drilling
11
26% growth in development drilling footage y-o-y with in-
house service share at c. 60%
Commissioning of new wells rose by 19%, including a 34%
y-o-y increase in horizontal wells completion
Commissioning of horizontal wells with multi stage
hydrofracs rose by 45%
Yuganskneftegaz – all-time high production drilling footage
in Augast (over 600 th. m), incremental production growth
from commissioning of new wells of 20% for 9M 2017
Russkoe field – super complex oil well with a horizontal
reach of 2,048 m was successfully completed in 26 days 9M 2016 9M 2017 2017
+26%
6,979
8,825
9M 2016 9M 2017 2017
Directional wells Horizontal wells
+19%
1,942
2,301
th. m
Commissioning of new oil wells
wells
Development drilling footage Key achievements for 9M 2017
Plans for 2017
Maintaining the required development drilling growth pace:
annual target >10 mln m
New wells completion plan – c. 3,000 wells with c. 30%
horizontal share
Roll-out the technologies to enhance well drilling and
completion efficiency, after the stage of the field trials:
using two-string design for horizontal well construction
pressure-controlled drilling

Hydrocarbon Production
12
kboed
Growth in average daily hydrocarbon production through development of new projects, integration of Bashneft and production
growth at a number of brownfields
Yuganskneftegaz: record high production since 1986 through development drilling and commissioning of new wells increase
by 16% and 11% respectively, improvement in quality of wellworks, including horizontal drilling and multi-stage hydrofracs
International projects: the Company increased its stake in Petromonagas JV (Venezuela) in May 2016
Suzun / East Messoyakha: the Company keeps production ramp up at the Suzun and East Messoyakhska fields, launched in Q3
2016
Gas production: commissioning of new wells at Varyoganneftegaz in 2017 and increase of gas deliveries through Tyumen
compressor station after reconstruction, comissioning of new wells and optimization of operating modes of the existing wells at
Sibneftegaz
5,213
5,720
46 (16) (14) (15) (28) 17 29 21 27
440
9M 2016 Yugansk Orenburg Samotlor Offshore projects Other International projects Messoyakha Vankor projects Gas production Bashneft 9M 2017
+9.7%
+67 kboed (+1.3%)

Progress in Key Projects:
Yurubcheno-Tokhomskoe field
13
Comprehensive testing of oil treatment and transportation
units started in September 2017
In Q4 2016 early supplies started from the field to the
Kuyumba-Taishet trunk pipeline system
Development drilling is being carried out at 10 well pads
Сonstruction operations at the key infrastructure facilities are
near completion: oil treatment facility with project capacity of
2.5 mmtpa, acceptance transfer unit and field pipelines and
other facilities
2017 production target – c. 0.8 mmt
Note: (1) Data for Yurubchenskiy block
Indicator Value
3Р reserves (PRMS)1 272 mmtoe / 2,078 mmboe
Commissioning year 2017
Production plateau c. 5 mmtpa
Target plateau year 2019

Progress in Key Projects:
Kondinskoe field
14
Central production facility construction (CPF)
Acceptance transfer unit (ACU)
As a part of the 1st development phase drilling at 7 well pads
was completed. 27 pads were successfully filled
Construction of a transfer and acceptance unit completed
Construction, installation and pre-commissioning works of
the key facilities at the 1st startup complex were successfully
completed, construction of a 68 km «CPF-ACU» pipeline
completed as well as «Tsingaly jetty – Kondinskoe field
support base» road
Indicator Value
3Р reserves (PRMS) 135 mmtoe / 977 mmboe
Commissioning year 2017
Production plateau under review
Target plateau year 2019

Progress in Key Projects:
Tagul
15
Indicator Value
3Р reserves (PRMS) 435 mmtoe / 3,102 mmboe
Commissioning year 2018
Production plateau >4.5 mmtpa
Target plateau year 2022+
As a part of a pilot the first startup complex of the oil
treatment facility (OTF) with capacity of 2.3 mmtpa was
initiated
OTF will be used to process crude oil to commercial quality
and its further transportation by 4.5 km length pipeline to the
connection point at the Vankor-Purpe trunk pipeline
Development drilling is carried out at 4 well pads
Infrastructure facilities site preparation is in progress

16
Gas Business: Organic Production Growth
and Efficient Monetization
Key achievements for 9M 2017
46.3
148.6
45.8
150.6
9M 2016
9M 2017
3.21 3.29
-1.1%
+1.3%
+2.5%
9M 2016 9M 2017
49.33 50.86
+1.53 (+3.1%)
3.1% production growth on the back of:
Bashneft acquisition in Q4 2016
commissioning of new wells at Varyoganneftegaz in
2017 and increase of gas deliveries through
Tyumen compressor station after reconstruction
comissioning of new well and optimization of
operating modes of existing wells at Sibneftegaz in
2017
average Company’s sales price in Russia increased
by 2.5% y-o-y of faster than the average price for
industrial consumers (+1.3% y-o-y)
Gas production
bcm
Gas sales in Russia
Other
Sibneftegaz
Vankor projects
Purneftegaz
Samotlor
Rospan
Yuganskneftegaz
Revenue,
RUB bn
Sales volumes,
bcm
Average sales price,
th. RUB / ‘000 cubic meters

Refining: Efficiency Improvement via Further
Operating Optimization and Modernization
17
Progress in Refinery modernization program
Key refining highlights (Russia) Key achievements in Q3 2017
5.4 5.5 6.1 8.1 7.8 7.3 7.4
2.9 2.7 3.0
4.0 3.9 3.6 3.9
19.5 19.4 21.6
27.1 25.5 24.6 25.0
0.0
5.0
10. 0
15. 0
20. 0
25. 0
30. 0
35. 0
0.0
2.0
4.0
6.0
8.0
10. 0
12. 0
14. 0
16. 0
18. 0
20. 0
Q1 16 Q2 16 Q3 16 Q4 16 Q1 17 Q2 17 Q3 17
Gasoline production, mmt Diesel production, mmt
Refining throughput, mmt
46%
54%
55%
57%
62%
62%
63%
71%
Рязанская НПК
Ачинский НПЗ
Ангарская НХК
Комсомольский НПЗ
Новокуйбышевский НПЗ
Туапсинский НПЗ
Сызранский НПЗ
Куйбышевский НПЗ
55.5% 56.2% 56.7% 57.6% 58.7% 58.0% 58.4%
68.9% 71.2% 73.6% 73.4% 74.0% 74.3% 77.1%
Q1 16 Q2 16 Q3 16 Q4 16 Q1 17 Q2 17 Q3 17
Light product yieldRifining depth
Kuibyshev Refinery
Syzran Refinery
Tuapse Refinery
Novokuibyshev Refinery
Komsomolsk Refinery
Angarsk PCC
Achinsk Refinery
Ryazan Refinery
Q3 2017 light product yield reached 58.4%, refining
depth – 77.1%
Large-tonnage equipment for the hydrocracker at the
Novokuibyshev refinery was delivered (9 columns)
At the Ryazan refinery the LPG storage park was
upgraded enhancing operating efficiency,
environmental protection and industrial safety
As part of the import substitution program catalysts
procured for the gasoline reforming units of the
Kuibyshev and the Saratov refineries were switched to
the catalysts produced by AZKiOS
Note: Bashneft consolidation starting October 1, 2016

Profit Maximization from Crude Oil Marketing
18
43% 42% 43%
3% 3% 3% 3% 4% 3%
21% 21% 20%
30% 30% 30%
Q3 16 Q2 17 Q3 17
Refining in Russia
Domestic market
Export to CIS
Export to Asia
Export (West)
Netbacks of the main crude oil marketing channels Oil marketing structure
57.9 58.3 49.8
High-margin crude oil supplies eastwards increased by 10%
for 9M 2017 y-o-y to 35.2 mmt
At the 9th BRICS summit a long term crude oil supply contract
with CEFC China was signed
78%
81%
85% 85%
82%
84%
86%
0.7 2
0.7 4
0.7 6
0.7 8
0.8 0
0.8 2
0.8 4
0.8 6
0.8 8
100
160
220
280
Q1 16 Q2 16 Q3 16 Q4 16 Q1 17 Q2 17 Q3 17
$/t
Refining capacity utilization Export netback
Refining netback Domestic market netback
Export netback (Primorsk)
Note: Bashneft consolidation starting October 1, 2016
mmt

Premium Marketing Channels
19
Growth of lubes sales for
9M 2017 y-o-y
Lubes Bitumen
Avia
9M bunker fuel sales
growth y-o-y
Company market
share reached 38%
9M 2017 bitumen
sales growth y-o-y
9M jet fuel sales growth
y-o-y
Bunker fuel
+38%
+26%
+4% +50%
Note: Bashneft consolidation starting October 1, 2016

Financial Results

Revenue
21
Q3 2017 vs. Q2 2017
RUB bn
Crude oil price increase in RUB terms by 7.5%: positive effect of both RUB depreciation and global price recovery
Slight decline in sales volumes on the back of crude oil and petroleum product inventories buildup
Continued optimization of the sales mix
1,399
1,496
46
56 2 16 2 (4) (21)
Q2 2017 Exchange rate Crude oil price Exchange rate effect fromprepayments
Share in profit ofassociates and JVs
Larger number of days inthe period
Change in volumes Other Q3 2017
Company controlled factors:
RUB -19 bn; -1.4% External factors:
RUB +116 bn; +8.3%

Operating Costs Dynamics
22
349 342 361
317 322
2.8% -0.8% -2.4%
-5.4% -7.7%
Q3 16 Q4 16 Q1 17 Q2 17 Q3 17
Costs
Average LTM
% y-o-y
129 141
131
149
172
-3.0% -7.8%
-12.7%
-1.3%
33.3%
Q3 16 Q4 16 Q1 17 Q2 17 Q3 17
Bashneft effect RosneftAverage LTM % y-o-y
167 172
164 170 163
177 179
5.1% 3.0% 5.2% 7.9% 9.1%
Q3 16 Q4 16 Q1 17 Q2 17 Q3 17
Bashneft effect Rosneft
Average LTM % y-o-y
180 189
172
148
336
168 185 180 195
3.9% 5.0%
13.0%
4.9% 4.3%
Q3 16 Q4 16 Q1 17 Q2 17 Q3 17
Refining costs in Russia Lifting costs
Transportation costs Producer price index (annual basis)
RUB/boe RUB/bbl
RUB/boe
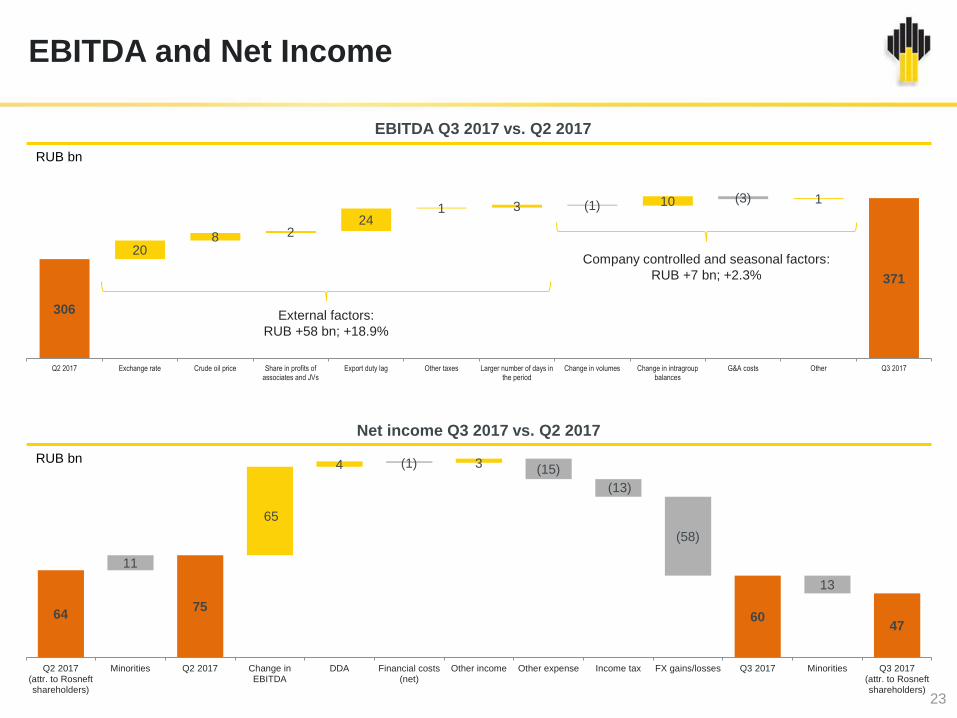
EBITDA and Net Income
23
306
371
20 8 2
24 1 3 10 1
(1) (3)
Q2 2017 Exchange rate Crude oil price Share in profits ofassociates and JVs
Export duty lag Other taxes Larger number of days inthe period
Change in volumes Change in intragroupbalances
G&A costs Other Q3 2017
External factors:
RUB +58 bn; +18.9%
Company controlled and seasonal factors:
RUB +7 bn; +2.3%
64 75
60 47
11
65
4 (1) 3 (15)
(13)
(58)
13
Q2 2017(attr. to Rosneftshareholders)
Minorities Q2 2017 Change inEBITDA
DDA Financial costs(net)
Other income Other expense Income tax FX gains/losses Q3 2017 Minorities Q3 2017(attr. to Rosneftshareholders)
EBITDA Q3 2017 vs. Q2 2017
RUB bn
RUB bn
Net income Q3 2017 vs. Q2 2017

CAPEX
24
0
2,000
4,000
6,000
0
300
600
900
1,200
2015 9M 2016 2016 9М 2017
2017range
Upstream Downstream Other HC production
630 709
595
475
Upstream CAPEX 9M 20171: benchmarking
22.6
20.0
14.4
12.5
11.5
11.0
10.1
9.1
7.4
6.5
22.6
20.0
14.4
12.5
11.5
11.0
10.1
9.1
7.4
6.5
9M 2017 CAPEX increase at 33% y-o-y consistent with
the strategic goals:
development of the major long-term oil and gas
production projects
extension of the development drilling program to
maintain hydrocarbon production
accelerating in highly efficient refining development
projects execution
Bashneft and other new assets consolidation
In 2017 the Company implemented investment projects
in the key business segments, taking into account the
oil output constraints, weather conditions, seasonality
and work schedule
Maintaining leadership in unit upstream CAPEX
efficiency in 2017 compared to the key Russian and
global peers while increasing the investment program:
9M 2017 – 6.5 $/boe.
2017 forecast – not higher than $7 per boe
CAPEX and production
$/boe
RUB bn kboed
Note: (1) Data for Rosneft and Statoil for 9M 2017, Gazpromneft, Lukoil, Petrochina and
Petrobras – for H1 2017, other companies – for 2016.

Appendix
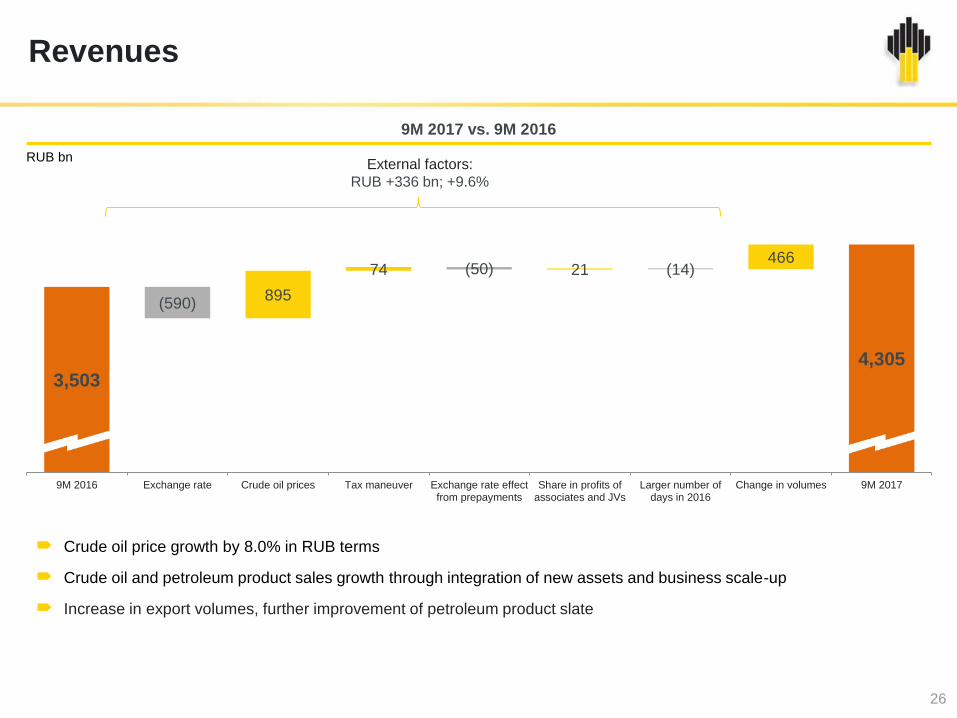
Revenues
26
3,503 4,305
895
74 21 466
(590)
(50) (14)
9M 2016 Exchange rate Crude oil prices Tax maneuver Exchange rate effectfrom prepayments
Share in profits ofassociates and JVs
Larger number ofdays in 2016
Change in volumes 9M 2017
Crude oil price growth by 8.0% in RUB terms
Crude oil and petroleum product sales growth through integration of new assets and business scale-up
Increase in export volumes, further improvement of petroleum product slate
External factors:
RUB +336 bn; +9.6%
9M 2017 vs. 9M 2016
RUB bn

Operating costs 2017 vs. 2016
27
Lifting costs increase for 9M 2017 was mainly driven
by the acquisition of Bashneft assets in October 2016,
growth in electricity costs (increase in tariffs and
watercut), wells overhauls, equipment and
infrastructure facilities maintenance
Refining costs increase was mainly due to acquisition
of Bashneft assets in October 2016 as well as
indexation of natural monopolies’ tariffs and salaries
Transneft trunk pipelines oil transportation tariffs
indexation by 3.5%-4% starting from January 2017 as
well as transit transportation tariffs through Belarus by
7.7% starting February 1, 2017
4.1% CPI growth y-o-y
420 444
15 9
9M 2016 Change in Transneft andRussian Railways tariffs
Volumes and routes 9M 2017
213 262
32 9 6 2
9M 2016 Acquisition ofBashneft assets
Power supplies andwatercut increase
Increase inproduction, payroll,
infrastructure atbrownfields and
other
OFS costs 9M 2017
56.4
92.5
30.9
(2.6) 2.6 2.8 2.4
9M 2016 Acquisition ofBashneft assets
Raw materialinputs (additives)
Indexation oftariffs andsalaries
Increase ofmaintenance
works
Other 9M 2017
Refining costs in Russia
Lifting costs
Transportation costs
RUB bn
RUB bn
RUB bn

EBITDA and Net Income
28
913 1,010
(224) (20) (30)
(24) (15) (13) (24) (53) (5)
106
267
21 90 21
9M 2016 Exchange rate Delay inexport duty cut*
Excise taxes Tax maneuver Crude oil price Share in profits ofassociates and JVs
Export duty lag Indexation oftransport tariffs
Other taxes Change in volumes Change inintragroupbalances
G&A costs** E&P and refiningOPEX**
Other OPEX 9M 2017
External factors:
RUB +68 bn; +7.4%
Company controlled and seasonal factors:
RUB +29 bn; +3.2%
* The decrease in export duty coefficient from 42% to 36% in 2016 (according to the original tax maneuver) was cancelled
** Including increase of fixed and variable costs after consolidation of Bashneft assets
127 133 152
122
6
97 (91)
(5) (3) (4) 9 16 30
9M 2016(attr. to Rosneftshareholders)
Minorities 9M 2016 Change inEBITDA
DDA Financial costs(net)
Other incomes Other expenses Income tax FX gains/losses 9M 2017 Minorities 9M 2017(attr. to Rosneftshareholders)
EBITDA 9M 2017 vs. 9M 2016
RUB bn
RUB bn
Net income 9M 2017 vs. 9M 2016

FX Risk Hedge
29
For reference:
Q3 2017, RUB bn 9M 2017, RUB bn
Before tax Income tax Net of income
tax Before tax Income tax
Net of income
tax
Recognized within other funds and
reserves as of the start of the period (364) 73 (291) (435) 87 (348)
Foreign exchange effects recognized
during the period 2 - 2 - - -
Foreign exchange effects reclassified
to profit or loss 36 (8) 28 109 (22) 87
Total recognized in other
comprehensive income/(loss) for
the period
38 (8) 30 109 (22) 87
Recognized within other funds and
reserves as of the period end (326) 65 (261) (326) 65 (261)
Nominal hedging amounts $ MM CBR exchange rate, RUB/$
December 31, 2016 1,763 60.6569
March 31, 2017. 0 56.3779
June 30, 2017 982 59.0855
September 30, 2017 927 58.0169

Calculation of Adjusted Operating Cash Flow
30
# Indicator 9M 2017,
$ bn
1 Revenue, incl. 76.3
Prepayments reimbursed 6.9
2 Costs and expenses (66.5)
3 Operating profit (1+2) 9.8
4 Expenses before income tax (6.5)
5 Income before income taxes (3+4) 3.3
6 Profit tax (0.8)
7 Net income (5+6) 2.5
9M 2017,
$ bn Indicator #
2.5 Net income 1
11.4 Adjustments to reconcile net income to
cash flow from operations 2
(10.0) Changes in operating assets and
liabilities, including 3
(6.9) Prepayments reimbursed
(0.7) Income tax payments, interest and
dividends received 4
3.2 Net cash from operating activities
(1+2+3+4) 5
2.7 Prepayments against future supplies
6.9 Effect from prepayments 6
1.1 Interest on prepayments under long
term crude oil supply contracts 7
13.9 Adjusted operational cash flow
(5+6+7) 9
Profit and loss statement Cash flow statement

Operating Cash Flow Adjustment
31
196
815
185
257
145
61
156
(630)
Net cash providedby operating
activities
Prepayments forcrude oil supplies
reimbursed(historical FX rate)
FX rate changeeffect
Interest onprepayments
Prepaymentsagainst future
supplies
Adjusted operatingcash flow
CAPEX Free cash flow
RUB bn
Reimbursement of crude oil supplies prepayments
(average FX rate)
RUB 402 bn

32
287 296 294
341 327 313
356
273
348
292
365 333
306
371
Q1 16 Q2 16 Q3 16 Q4 16 Q1 17 Q2 17 Q3 17
Normalized EBITDA Actual EBITDA
6 (2) 52 24 (7) (14) 15
Export Duty Lag
RUB bn
Note: The effect of the time lag in export duties on the Company's EBITDA is separated on this slide, i.e. it is calculated for certain quarters and based on the volumes and the USD
average exchange rate of respective quarter (unlike the factor analysis)

Financial Expenses, RUB bn
33
Note: (1) Including interest charged on credits and loans, promissory notes, ruble bonds and eurobonds, (2) Interest is paid according to the schedule, (3) Interests paid shall be
capitalized in accordance with IAS 23 standard Borrowing Costs. Capitalization rate is calculated by dividing the interest costs for borrowings related to capital expenditures by the average
balance of loans. Capitalized interest shall be calculated by multiplying average balance of construction in progress by capitalization rate
Indicator Q3 17 Q2 17 % 9M 17 9M 16 %
1. Interest accrued1 56 54 3.7% 162 104 55.8%
2. Interest paid2 57 53 7.5% 154 108 42.6%
3. Change in interest payable (1-2) (1) 1 – 8 (4) –
4. Interest capitalized3 28 27 3.7% 78 44 77.3%
5. Increase in provision due to the
unwinding of a discount 5 4 25.0% 13 11 18.2%
6. Interest on prepayments under long
term crude oil supply contracts 20 20 – 61 67 (9.0)%
7. Other finance expenses 3 2 50.0% 10 3 >100%
8. Total finance expenses
(1-4+5+6+7) 56 53 5.7% 168 141 19.1%

EBITDA and Net Income Sensitivity
-6 $/bbl +6 $/bbl -2 RUB/$ +2 RUB/$
(15)
(19)
15
19
EBITDA
Net income
(33)
(41)
33
41
EBITDA
Net income
34
Urals price change RUB/$ exchange rate change
RUB bn RUB bn
Average Urals price in Q3 2017 was $50.9 per bbl. In case the average price for the period was $6 per bbl higher,
EBITDA would have increased by RUB 41 bn, including the positive export duty lag effect of RUB 12 bn
Average USD exchange rate in Q3 2017 was 59 RUB/$. In case the average USD exchange rate was 2 RUB/$ lower,
EBITDA would have decreased by RUB 19 bn

Questions and Answers