root Cheat Sheet A. Stephen Beac h - UCLAhauser/classes/180F/ROOTCheat.pdfA root Cheat Sheet A....
32
Transcript of root Cheat Sheet A. Stephen Beac h - UCLAhauser/classes/180F/ROOTCheat.pdfA root Cheat Sheet A....
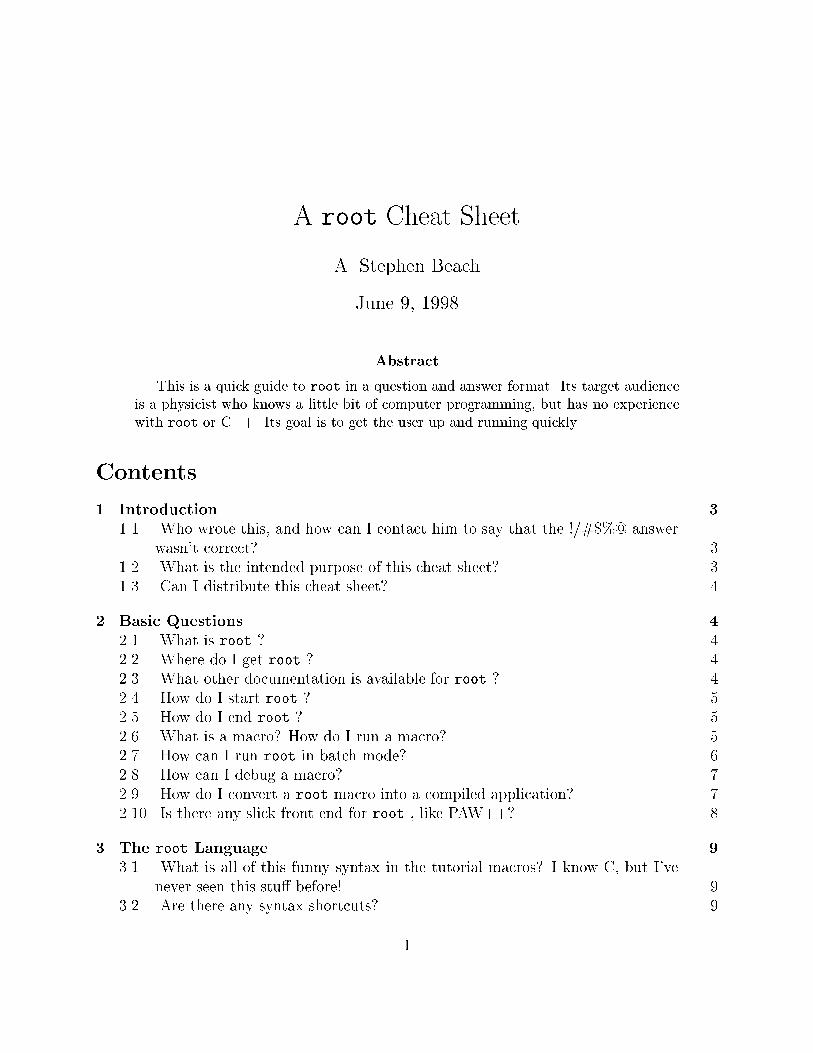
A root Cheat SheetA. Stephen BeachJune 9, 1998AbstractThis is a quick guide to root in a question and answer format. Its target audienceis a physicist who knows a little bit of computer programming, but has no experiencewith root or C++. Its goal is to get the user up and running quickly.Contents1 Introduction 31.1 Who wrote this, and how can I contact him to say that the !/#$%@ answerwasn't correct? . . . . . . . . . . . . . . . . . . . . . . . . . . . . . . . . . . 31.2 What is the intended purpose of this cheat sheet? . . . . . . . . . . . . . . 31.3 Can I distribute this cheat sheet? . . . . . . . . . . . . . . . . . . . . . . . 42 Basic Questions 42.1 What is root ? . . . . . . . . . . . . . . . . . . . . . . . . . . . . . . . . . 42.2 Where do I get root ? . . . . . . . . . . . . . . . . . . . . . . . . . . . . . 42.3 What other documentation is available for root ? . . . . . . . . . . . . . . 42.4 How do I start root ? . . . . . . . . . . . . . . . . . . . . . . . . . . . . . 52.5 How do I end root ? . . . . . . . . . . . . . . . . . . . . . . . . . . . . . . 52.6 What is a macro? How do I run a macro? . . . . . . . . . . . . . . . . . . 52.7 How can I run root in batch mode? . . . . . . . . . . . . . . . . . . . . . . 62.8 How can I debug a macro? . . . . . . . . . . . . . . . . . . . . . . . . . . . 72.9 How do I convert a root macro into a compiled application? . . . . . . . . 72.10 Is there any slick front end for root , like PAW++? . . . . . . . . . . . . . 83 The root Language 93.1 What is all of this funny syntax in the tutorial macros? I know C, but I'venever seen this stu� before! . . . . . . . . . . . . . . . . . . . . . . . . . . . 93.2 Are there any syntax shortcuts? . . . . . . . . . . . . . . . . . . . . . . . . 91

June 9, 1998 23.3 What naming conventions are used in root ? . . . . . . . . . . . . . . . . . 103.4 What are the data types Float t, Int t etc., and how are they di�erent fromthe usual C data types? . . . . . . . . . . . . . . . . . . . . . . . . . . . . . 114 Histograms and Ntuples 114.1 What is a histogram? . . . . . . . . . . . . . . . . . . . . . . . . . . . . . . 114.2 What is an ntuple? . . . . . . . . . . . . . . . . . . . . . . . . . . . . . . . 114.3 How do I draw a histogram from an ntuple? How do I set cuts for an ntuple? 124.4 Somebody just gave me a root �le containing an ntuple. How do I �nd outwhat variables are in the ntuple? . . . . . . . . . . . . . . . . . . . . . . . . 134.5 How can I manipulate an ntuple? . . . . . . . . . . . . . . . . . . . . . . . 134.6 How do I create a new ntuple? . . . . . . . . . . . . . . . . . . . . . . . . . 154.7 How do I create a new histogram? . . . . . . . . . . . . . . . . . . . . . . . 155 Formatting Questions 165.1 How do I tell root what style to use when drawing a histogram? . . . . . . 165.2 What about other options, like axis titles, overall titles, and statistics? . . 175.3 Is it possible to display only a part of a histogram? For example, only thepart of the histogram with x between 1 and 2? . . . . . . . . . . . . . . . . 215.4 How do I get a logarithmic histogram? . . . . . . . . . . . . . . . . . . . . 215.5 How do I set the options on histograms drawn from an ntuple? . . . . . . . 216 Doing Stu� With root 226.1 How can I de�ne a formula? How do I de�ne a function? . . . . . . . . . . 226.2 How do I do a �t with root ? . . . . . . . . . . . . . . . . . . . . . . . . . 236.3 How can I smooth the data with root ? . . . . . . . . . . . . . . . . . . . 246.4 What kinds of random deviates does root have? How do I generate them? 246.5 How can I get a graph of some input data? . . . . . . . . . . . . . . . . . . 256.6 How do I set graphics options for a graph? . . . . . . . . . . . . . . . . . . 266.7 How do I get error bars on a graph? . . . . . . . . . . . . . . . . . . . . . . 276.8 How do I get a legend on a graph, showing what each line on a plot is? . . 277 Input & Output Questions 277.1 How do I read in a .root �le? How do I �nd out what's in a .root �le? . . . 277.2 How do I create a .root �le? . . . . . . . . . . . . . . . . . . . . . . . . . . 287.3 How do I convert an .hbook �le into a .root �le? Will all the data be preserved,including the names? . . . . . . . . . . . . . . . . . . . . . . . . . . . . . . 287.4 How do I read data from an ASCII �le into an ntuple? . . . . . . . . . . . 297.5 How do I take data from an ntuple and write it to an ASCII �le? . . . . . 297.6 How do I get data from a �tted function and write it to an ASCII �le? . . 30

June 9, 1998 37.7 How can I get root to output a histogram directly to an encapsulatedpostscript �le? . . . . . . . . . . . . . . . . . . . . . . . . . . . . . . . . . . 307.8 How can I get root to read a �le and histogram it at the same time anotherprocess is writing the �le? . . . . . . . . . . . . . . . . . . . . . . . . . . . . 311 Introduction1.1 Who wrote this, and how can I contact him to say that the!/#$%@ answer wasn't correct?This cheat sheet was written by Steve Beach, a graduate student working in experimentalparticle astrophysics at Penn State University. He has, like any graduate student, got far toomuch stu� to do, so be gentle in the corrections, please. He can be reached best by e-mailat [email protected] , and also has a web site (mostly with pictures of his darling daughter!)at http://landau.phys.psu.edu/people/beach/Untitled.html.But seriously, any and all additions to this document will be appreciated. If you haveanswers to my unanswered questions, please send them to me. Ditto for more questions,with or without answers.Note that this document has been neither edited, proofed, nor blessed by the root devel-opment team. I have personally run every code example and suggestion in this document,and they have worked for me. However, it still may have mistakes in it, and its distributionand use is entirely at the risk of the user. In other words, you get what you pay for, and ifyou blow up your computer or delete your data set, since you didn't pay anything, you don'tget to sue me.1.2 What is the intended purpose of this cheat sheet?Remember when you were in school and the teacher asked you a question you didn't know theanswer? Didn't you just really want a sheet with all the quick answers to things you reallyfelt stupid not to know? Well, that's what this is for. Not as an encyclopedic dictionary ofminutia, but as a compendium of those answers you really feel stupid not knowing. It can beused as a study guide, helping the newbie get his/her feet wet, but do not use as a referencefor getting that graph just right.Also, this is not an FAQ. I did not comb the root newsgroups, although I may do thatfor a later version if I get enough response.
June 9, 1998 41.3 Can I distribute this cheat sheet?Why of course! Why else would I have written it up? This document is hereby copyright1998 by A. Stephen Beach, and is licensed to the world under terms of the Gnu PublicLicense. As a courtesy to the author, it is requested that I be noti�ed when this document isincluded in any compilation or CD-ROM. Also, please attempt to get the latest version frommy web site listed above, in order to save me from error reports on items that I've already�xed!2 Basic Questions2.1 What is root ?root is an data analysis and graphics program designed for use in high-energy physics,but adaptable to use in other �elds. The source code as well as pre-compiled versions ofroot are available at no cost. Improvements are being made continuously by the hardworking, talented, root development team of Ren�e Brun, Nenad Buncic, Valery Fine, andFons Rademakers. At the time of this writing, the latest version was 2.00/04, and that iswhat this cheat sheet is based on.2.2 Where do I get root ?The best place to get root as well as the o�cial documentation is the main web site,http://root.cern.ch.2.3 What other documentation is available for root ?See the bibliography. Reference [1] is an overview of the system, on a somewhat technicallevel, appropriate for pitching it to your boss and showing him/her all the nifty things itcan do. Reference [2] is a tutorial, or a collection of macros that helps to guide you throughthe intricacies of root . However, it's pretty much a self-guided tour. Reference [3] is theauthoritative guide to root . If you have a question about what a function does or whatarguements a function takes, look there. However, do not print it out { it's over 600 pageslong! And, it will change as root changes, so it will probably be out of date before you'vemanaged to look at half the pages!In a slightly di�erent vein is reference [4]. It is an outline of a course in root , aiming tobe a comprehensive course, but assuming from the students a fair understanding of objectoriented programming and C++. It should also be understood as a work in progress, as itends fairly abruptly.
June 9, 1998 5Finally, there are the root howto's, on a wide variety of topics, for example, how to reada tree or how to debug a macro. They are available on the main root web site, under \howto's". They are quite comprehensive, but I found them relatively di�cult to follow, in partbecause of their comprehensive scope.So what does this have to o�er instead? First, it is aimed at a lower audience. Second,I believe that the format is better suited for a harried grad student told \Do this!". Third,since I am not a part of the root team, I believe I may have a little bit more insight as towhat the root novice needs to know or is confused about.2.4 How do I start root ?You start root by typing root at the system prompt. If everything is working correctly, youwill see a logo screen with a lightning bolt on an orange background and the word \root "in large type. That will disappear in a couple of seconds, leaving you with a \Welcome toroot " message in your original screen and a \root prompt". The root prompt looks likeroot [0]This is where you enter your commands. The number inside the brackets [] re ects thenumber of commands you've entered so far. As a help, if you want to repeat a command,you can use the up arrow key to scroll through the prior commands.If this doesn't work, you need to check two things:1. Is the system variable ROOTSYS set, and is it pointing to the correct directory?2. Is your path correct?If either or both of these is gibberish, may I suggest either �nding a friendly co-worker orlearning about UNIX? For help with either, see reference [5].2.5 How do I end root ?At the root prompt, type .q or .qqq.2.6 What is a macro? How do I run a macro?A macro is a set of C or C++ commands enclosed in braces (f g), stored in a �le. Theseare commands that you could just type into root yourself, but would rather not have thetypos that come from typing! The braces at the start and end are important, in that theytell root the start and �nish of the macro.Running a macro is simple: at the root prompt, type .x macro-name, where macro-nameis the �le name of the macro, exactly as it is typed on your system. So, on Linux, if you
June 9, 1998 6wanted to run the macro \test", in your home directory, you would type .x test if youstarted root from your home directory, or .x /test if you started it somewhere else.As an aside, you can use \meta-macros", at least on macros. For example, say you wantedto run the macro \test", and then exit, saving all the output to the �le \test.output". First,make up a text �le named \runtest" with the following contents:.x test.qThen, at the system prompt (i.e., before starting root ), typeroot < runtest > test.outputroot will then execute all the commands of the \test" macro, save all the results to the �le\test.output", and quit.2.7 How can I run root in batch mode?There are at least three ways to do this. The �rst is the \meta-macro" method of question2.6.The second way is the \o�cial" way, using command line options. There are four com-mand line options on version 2.00 of root :� -b: run in batch mode without graphics� -q: exit after running all of the macros listed on the command line� -l: do not show the \splash" screen (i.e., the lightning bold logo)� -n: do not run the logon and logon macros in .rootrc� -?: list these optionsFor example, say you wanted to run the macro test, save the results and exit. At thesystem command prompt, you would enterroot -b -q test > testoutThe third method is to compile your macros. While this is the most di�cult method,the macros do run faster. Much faster. Perhaps by a factor of 100 sometimes.
June 9, 1998 72.8 How can I debug a macro?By using the root environment wisely. There are breakpoint and step-by-step commands,but I've never �gured out how to use them. I'm leaning towards doing everything complicatedenough to need debugging as a compiled program, so that the compiler and linker can checkfor bugs.2.9 How do I convert a root macro into a compiled application?If you've adhered to all C++ syntax (and not used any of the root interpreter extensionsmentioned in question 3.1), it should be pretty easy. Basically, all you've got to do is putin the header �les, a main function to call the rest, make two small additions to the macro,and then compile it. There are just enough subtleties that I'll expound further on each.The top matter: You've got to tell the compiler a couple of things. First, where to �ndthe declarations for all the classes and libraries that you use. So, include the following linesat the top:#ifndef __CINT__#include <stdio.h>#include <math.h>#include ``TROOT.h''#include ``TClass.h''#include ``TClassTable.h''#include ``TCollection.h''#include ``TObject.h''#endifThe #ifndef and #endif lines are to leave your macro executable by as a macro. (I.e.,the lines in between will be ignored if you are running CINT , the C interpreter that runsmacros.) You may have to add more lines here. Compile your code, see what classes thecompiler doesn't understand, and then add #include ``T , the class name, then .h'' .Next in the top matter, you've got to include a global object TROOT , as well as someother type declarations, perhaps as#ifndef __CINT__extern void InitGui();VoidFuncPtr_t initfuncs[] = {InitGui, 0};TROOT root("hello","Hello World",initfuncs);#endifThe next thing to add at the top is a call to the function main that every C++ programmust have. Remember that your macro is surrounded by braces? Perfect for adding themain function name. Right before the start of your macro, insert

June 9, 1998 8#ifndef __CINT__int main(int argc, char **argv)#endifNow, there is only two changes you need to make in your macro. If you want any sort ofGUI in your program, add the following as the �rst executable statement:1#ifndef __CINT__TApplication theApp("App",&argc,argv);#endifIf you want the user to be able to interact with the GUI, put the following lines in at theappropriate location. Note that all other processing will cease until the user chooses to exitroot . If you want to continue processing after the user has exitted the GUI, change it totheApp.Run(kTRUE); .#ifndef __CINT__theApp.Run();#endifLast and probably least, you've got to insert a return at the end of the code. As the lastexecutable statement, add#ifndef __CINT__return 0;#endifFinally, the compiling. There are so many ags and include stu� here that you reallyshouldn't even try to do it without using make. So, when you write up your Make�le,all you have to do is steal from the one they so nicely gave you, located in $(ROOT-SYS)/test/Make�le. But if you can't �nd that, here's the ags you need.For compiling, -fPIC -Wall -I$ROOTSYS/includeFor linking, -L$(ROOTSYS)/lib -lNew -lBase -lCint -lClib -lCont -lFunc-lGraf -lGraf3d -lHist -lHtml -lMatrix -lMeta -lMinuit -lNet -lPostscript-lProof -lRint -lTree -lUnix -lZip -lGpad -lGui -lGX11 -lX3d-L/usr/X11R6/lib -lXpm -lX11 -lg++ -lm -ldl -rdynamicNote that I'm running Linux, so if you're not, some of the X11 libaries etc. might di�er.2.10 Is there any slick front end for root , like PAW++?Not at the moment, but give it a chance! root is only a couple of years old, and thedevelopment team is wisely making it functional �rst, idiot-proof second.1If you want the root command line to be available to the user (handy for playing with derived objects),substitute TRint for TApplication .

June 9, 1998 93 The root Language3.1 What is all of this funny syntax in the tutorial macros? Iknow C, but I've never seen this stu� before!You've never seen it before because you haven't seen C++ before. C++ is an object orientedprogramming language, and the concept of objects is at the heart of C++. You do not haveto be a C++ wizard to run root e�ectively, but you should know enough to realize whatthe syntax is doing. Towards that end, here are some code examples with some explanationof the funny capitalization, parenthesis, and arrows.hpx->Fill(px);If you are a C programmer, you might recognize this as a reference to a member of a structurepointed to by the pointer hpx. This is C++, however, and this is a class, not a structure.So, functions are allowed to be members of a class, and this statement means that you arecalling the function Fill, with no arguments, as part of the object pointed to by the pointerhpx (loosely, the object hpx).TH1F *hpx = new TH1F("hpx","This is the px distribution",100,-4,4);This is another instance of classes making your life easier, even if it doesn't look like it. The�rst part the command, TH1F *hpx, is a type declaration, declaring hpx to be a pointer to anobject of type TH1F. In C, you would have been forced to put this at the top of the program,but C++ gives you the freedom to put the declaration right when you need it.The new keyword is a C++ innovation, replacing malloc(). It not only allocates thespace for a TH1F object, but it checks for running out of space, as well as allowing theprogrammer to do intelligent things when a new object is set up. Those intelligent things aregoverned by the parameters listed inside the parenthesis. The meanings of these argumentsare given in the root class documentation [3].Finally, one notation you'll see in the documentation (not so much in the code) is the\class scope reslution operator" :: , as in TF1::SetParLimits . What that means is that\SetParLimits" is a member of the class \TF1". Kind of handy, actually.3.2 Are there any syntax shortcuts?Yes, root does provide shortcuts, but I prefer not to use them, for two reasons. First, I'mstill learning C++, and I think using the long versions will help me get the hang of thesyntax and the thought process. Second, I want to write code that can be easily compiled,if necessary. The syntax easings are purely for the root prompt interpreter, not for thecompiler.With those caveats, I now present the syntax shortcuts. First, you don't have to use thefull syntax when creating an object. The following code fragments are equivalent:TFile fill(''fillrandom.root'');
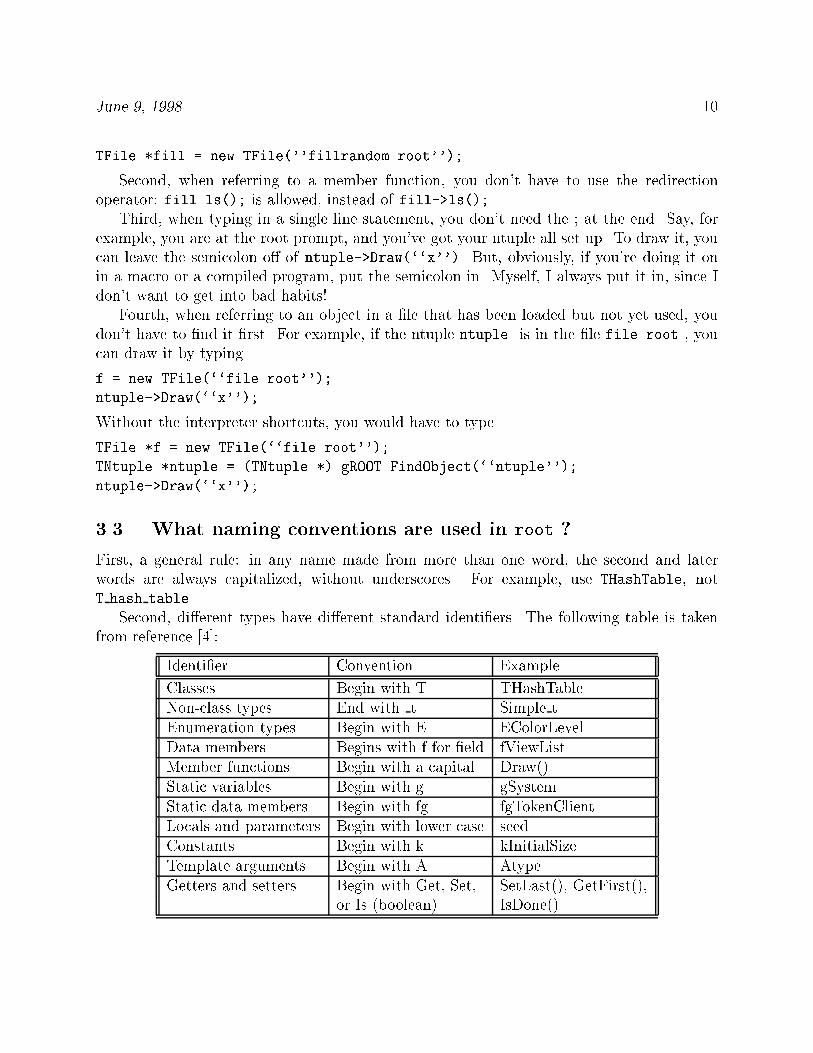
June 9, 1998 10TFile *fill = new TFile(''fillrandom.root'');Second, when referring to a member function, you don't have to use the redirectionoperator: fill.ls(); is allowed, instead of fill->ls();.Third, when typing in a single line statement, you don't need the ; at the end. Say, forexample, you are at the root prompt, and you've got your ntuple all set up. To draw it, youcan leave the semicolon o� of ntuple->Draw(``x'') But, obviously, if you're doing it onin a macro or a compiled program, put the semicolon in. Myself, I always put it in, since Idon't want to get into bad habits!Fourth, when referring to an object in a �le that has been loaded but not yet used, youdon't have to �nd it �rst. For example, if the ntuple ntuple is in the �le file.root , youcan draw it by typingf = new TFile(``file.root'');ntuple->Draw(``x'');Without the interpreter shortcuts, you would have to typeTFile *f = new TFile(``file.root'');TNtuple *ntuple = (TNtuple *) gROOT.FindObject(``ntuple'');ntuple->Draw(``x'');3.3 What naming conventions are used in root ?First, a general rule: in any name made from more than one word, the second and laterwords are always capitalized, without underscores. For example, use THashTable, notT hash table.Second, di�erent types have di�erent standard identi�ers. The following table is takenfrom reference [4]:Identi�er Convention ExampleClasses Begin with T THashTableNon-class types End with t Simple tEnumeration types Begin with E EColorLevelData members Begins with f for �eld fViewListMember functions Begin with a capital Draw()Static variables Begin with g gSystemStatic data members Begin with fg fgTokenClientLocals and parameters Begin with lower case seedConstants Begin with k kInitialSizeTemplate arguments Begin with A AtypeGetters and setters Begin with Get, Set, SetLast(), GetFirst(),or Is (boolean) IsDone()

June 9, 1998 113.4 What are the data types Float t, Int t etc., and how are theydi�erent from the usual C data types?Since root has been ported to many di�erent systems, with many di�erent compilers andprocessors, there is no way of knowing, a priori, how many bytes are in an int , a float , orwhatever. In order to get the same results no matter what machine it's run on, the creatorsof root de�ned machine independent basic types. Here is a table of what exactly they are(taken from [4]) Type MeaningChar t Signed, 1 byteUChar t Unsigned, 1 byteShort t Signed integer, 2 bytesUShort t Unsigned integer, 2 bytesInt t Signed integer, 4 bytesUInt t Unigned integer, 4 bytesLong t Signed integer, 8 bytesULong t Unsigned integer, 8 byteFloat t Floating point, 4 bytesDouble t Floating point, 8 bytesBool t Boolean, taking values kTRUE, kFALSE4 Histograms and Ntuples4.1 What is a histogram?A histogram is a graph showing how many events fell in a certain range. For example, 1event had an angle between 0 and 1 degree, 3 events were between 1 and 2 degrees, etc.Very, very handy graph for experimental physics.4.2 What is an ntuple?An ntuple, in mathematical usage, is a group of n numbers. For example, a point ona plane corresponds to a ntuple of two numbers. For experimental physics, this concepthas been broadened and specialized, so now \ntuple" refers to a collection of data aboutan experiment, where each event is a collection of numbers that describes the event (forexample, time, temperature, amount of energy seen), and there are many events in thecollection. Speci�cally for root , an ntuple is a data set with a speci�c format, an object ofthe class TNtuple .
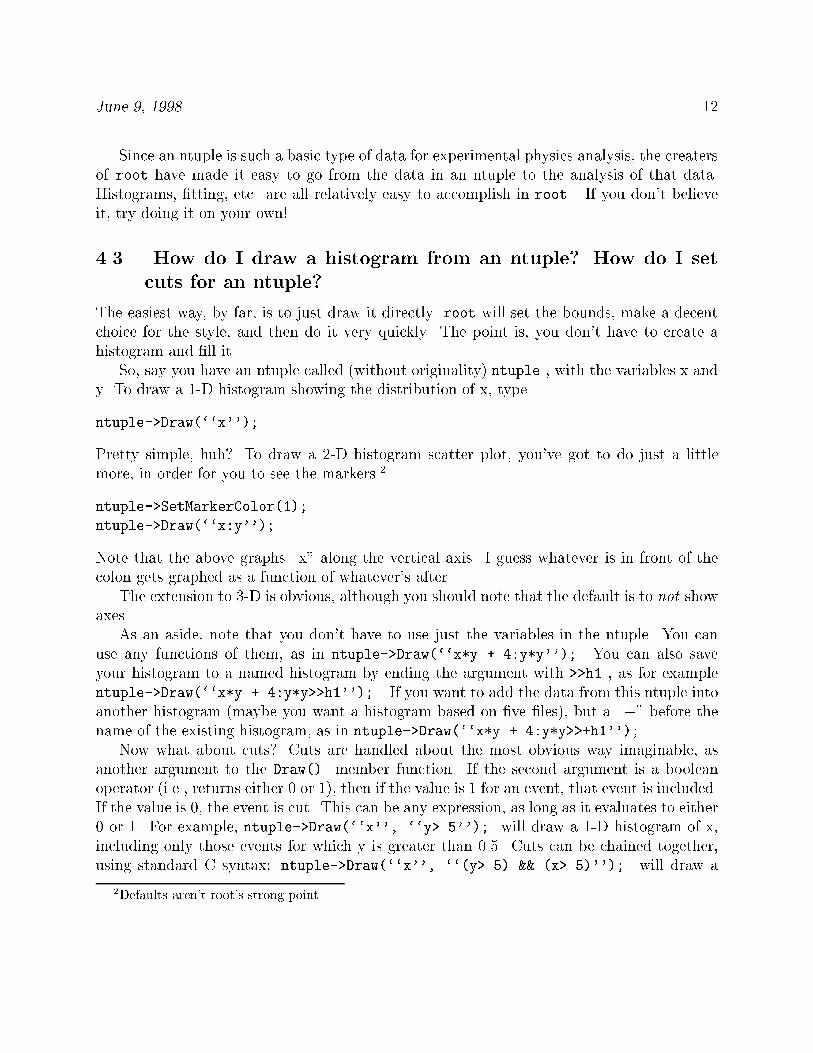
June 9, 1998 12Since an ntuple is such a basic type of data for experimental physics analysis, the creatersof root have made it easy to go from the data in an ntuple to the analysis of that data.Histograms, �tting, etc. are all relatively easy to accomplish in root . If you don't believeit, try doing it on your own!4.3 How do I draw a histogram from an ntuple? How do I setcuts for an ntuple?The easiest way, by far, is to just draw it directly. root will set the bounds, make a decentchoice for the style, and then do it very quickly. The point is, you don't have to create ahistogram and �ll it.So, say you have an ntuple called (without originality) ntuple , with the variables x andy. To draw a 1-D histogram showing the distribution of x, typentuple->Draw(``x'');Pretty simple, huh? To draw a 2-D histogram scatter plot, you've got to do just a littlemore, in order for you to see the markers.2ntuple->SetMarkerColor(1);ntuple->Draw(``x:y'');Note that the above graphs \x" along the vertical axis. I guess whatever is in front of thecolon gets graphed as a function of whatever's after.The extension to 3-D is obvious, although you should note that the default is to not showaxes.As an aside, note that you don't have to use just the variables in the ntuple. You canuse any functions of them, as in ntuple->Draw(``x*y + 4:y*y''); You can also saveyour histogram to a named histogram by ending the argument with >>h1 , as for examplentuple->Draw(``x*y + 4:y*y>>h1''); . If you want to add the data from this ntuple intoanother histogram (maybe you want a histogram based on �ve �les), but a \+" before thename of the existing histogram, as in ntuple->Draw(``x*y + 4:y*y>>+h1'');Now what about cuts? Cuts are handled about the most obvious way imaginable, asanother argument to the Draw() member function. If the second argument is a booleanoperator (i.e., returns either 0 or 1), then if the value is 1 for an event, that event is included.If the value is 0, the event is cut. This can be any expression, as long as it evaluates to either0 or 1. For example, ntuple->Draw(``x'', ``y>.5''); will draw a 1-D histogram of x,including only those events for which y is greater than 0.5. Cuts can be chained together,using standard C syntax: ntuple->Draw(``x'', ``(y>.5) && (x>.5)''); will draw a2Defaults aren't root's strong point.
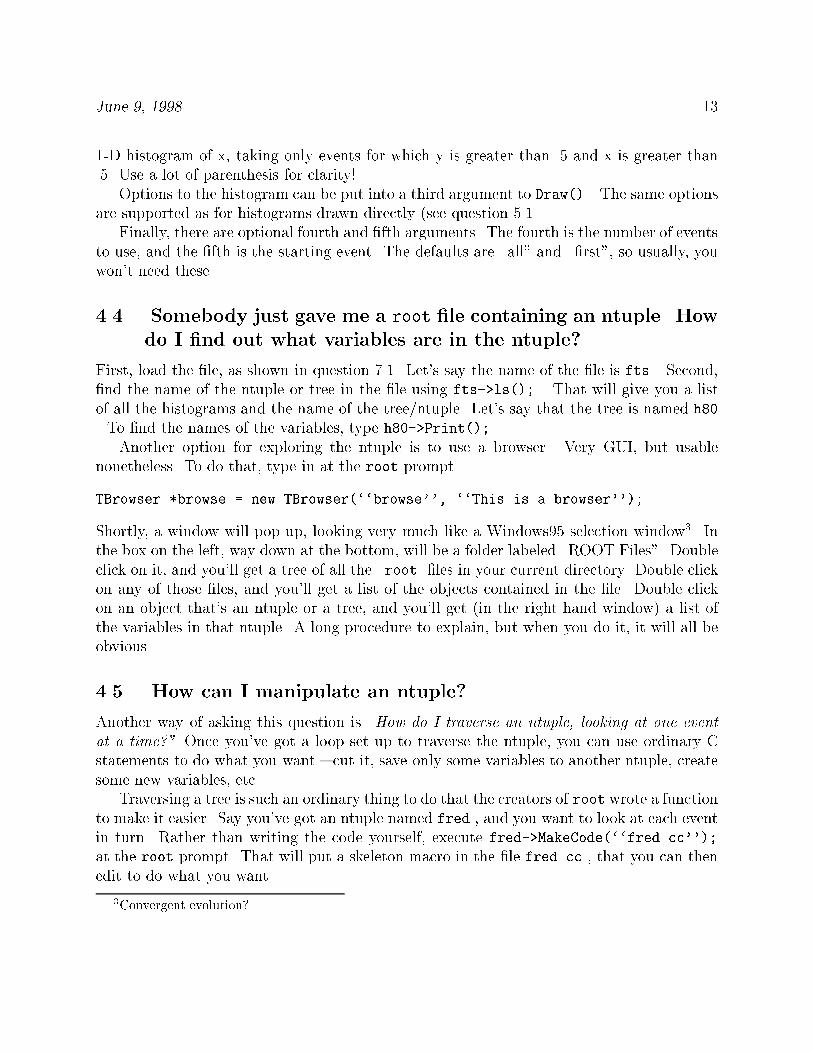
June 9, 1998 131-D histogram of x, taking only events for which y is greater than .5 and x is greater than.5. Use a lot of parenthesis for clarity!Options to the histogram can be put into a third argument to Draw() . The same optionsare supported as for histograms drawn directly (see question 5.1.Finally, there are optional fourth and �fth arguments. The fourth is the number of eventsto use, and the �fth is the starting event. The defaults are \all" and \�rst", so usually, youwon't need these.4.4 Somebody just gave me a root �le containing an ntuple. Howdo I �nd out what variables are in the ntuple?First, load the �le, as shown in question 7.1. Let's say the name of the �le is fts . Second,�nd the name of the ntuple or tree in the �le using fts->ls(); . That will give you a listof all the histograms and the name of the tree/ntuple. Let's say that the tree is named h80. To �nd the names of the variables, type h80->Print(); .Another option for exploring the ntuple is to use a browser. Very GUI, but usablenonetheless. To do that, type in at the root promptTBrowser *browse = new TBrowser(``browse'', ``This is a browser'');Shortly, a window will pop up, looking very much like a Windows95 selection window3. Inthe box on the left, way down at the bottom, will be a folder labeled \ROOT Files". Doubleclick on it, and you'll get a tree of all the .root �les in your current directory. Double clickon any of those �les, and you'll get a list of the objects contained in the �le. Double clickon an object that's an ntuple or a tree, and you'll get (in the right hand window) a list ofthe variables in that ntuple. A long procedure to explain, but when you do it, it will all beobvious.4.5 How can I manipulate an ntuple?Another way of asking this question is \How do I traverse an ntuple, looking at one eventat a time?" Once you've got a loop set up to traverse the ntuple, you can use ordinary Cstatements to do what you want { cut it, save only some variables to another ntuple, createsome new variables, etc.Traversing a tree is such an ordinary thing to do that the creators of root wrote a functionto make it easier. Say you've got an ntuple named fred , and you want to look at each eventin turn. Rather than writing the code yourself, execute fred->MakeCode(``fred.cc'');at the root prompt. That will put a skeleton macro in the �le fred.cc , that you can thenedit to do what you want.3Convergent evolution?
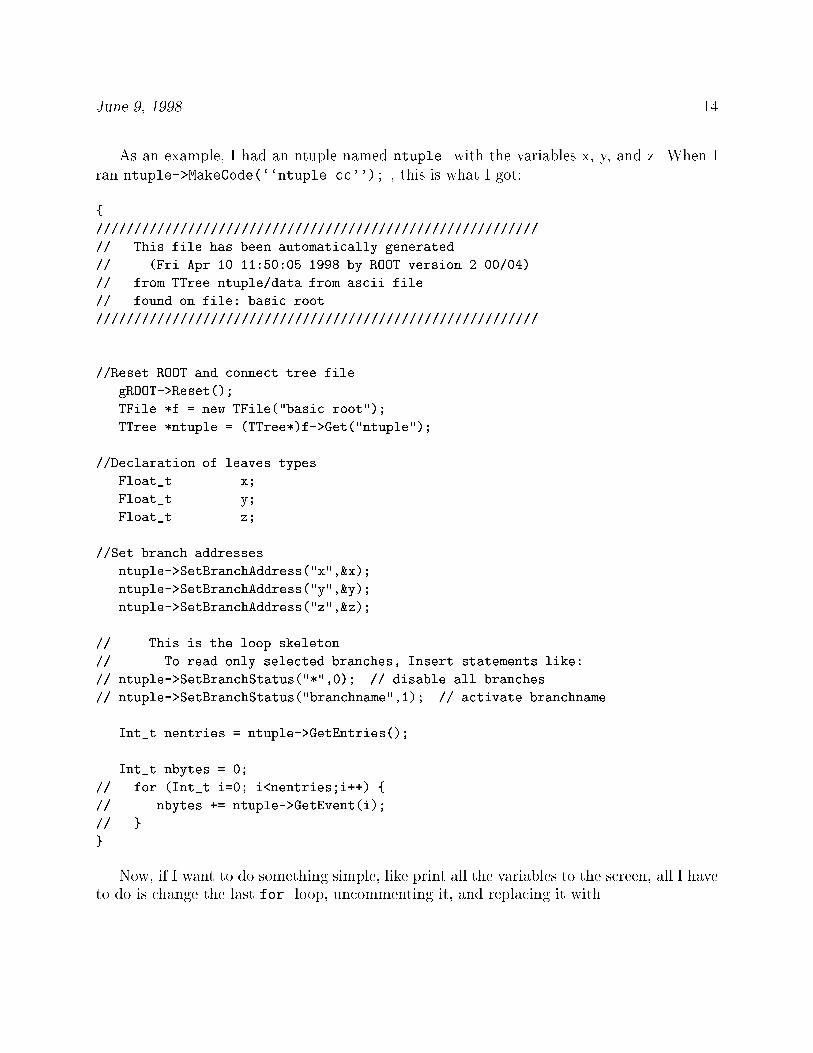
June 9, 1998 14As an example, I had an ntuple named ntuple with the variables x, y, and z. When Iran ntuple->MakeCode(``ntuple.cc''); , this is what I got:{//////////////////////////////////////////////////////////// This file has been automatically generated// (Fri Apr 10 11:50:05 1998 by ROOT version 2.00/04)// from TTree ntuple/data from ascii file// found on file: basic.root////////////////////////////////////////////////////////////Reset ROOT and connect tree filegROOT->Reset();TFile *f = new TFile("basic.root");TTree *ntuple = (TTree*)f->Get("ntuple");//Declaration of leaves typesFloat_t x;Float_t y;Float_t z;//Set branch addressesntuple->SetBranchAddress("x",&x);ntuple->SetBranchAddress("y",&y);ntuple->SetBranchAddress("z",&z);// This is the loop skeleton// To read only selected branches, Insert statements like:// ntuple->SetBranchStatus("*",0); // disable all branches// ntuple->SetBranchStatus("branchname",1); // activate branchnameInt_t nentries = ntuple->GetEntries();Int_t nbytes = 0;// for (Int_t i=0; i<nentries;i++) {// nbytes += ntuple->GetEvent(i);// }} Now, if I want to do something simple, like print all the variables to the screen, all I haveto do is change the last for loop, uncommenting it, and replacing it with
June 9, 1998 15for (Int_t i=0; i<nentries;i++){ nbytes += ntuple->GetEvent(i);printf(``x,y,z= %f, %f, %f \n'',x,y,z);}Notice that after I've gotten the event, I can refer to the variables just by their name,nothing fancy required. Execute this like any other macro, as .x ntuple.cc at the rootprompt.So, manipulating one ntuple into another is easy. Traverse it as above, but declareanother ntuple, and instead of printf , calculate the variables you want, and then use aFill into the new ntuple.4.6 How do I create a new ntuple?This is a three step process. First, you create it, by the C++ command new , which callsthe \constructor" of the class:TNtuple *ntuple = new TNtuple(``ntuple'', ``This is an ntuple'', ``x:y:z'');The �rst argument is the name of the ntuple. The second argument is a short description ofthe ntuple { makes debugging a �le a lot easier! The last argument is a list of the data inthe ntuple { names separated by colons. Please give descriptive names, as these names arestored with the ntuple, and will greatly ease the life of the next user.The second step is to �ll the ntuple. This is absurdly easy. First, get the data you want,and then sayntuple->Fill(x,y,z);The last step is to save it to a �le. For that, see question 7.2.4.7 How do I create a new histogram?Pretty much the same way you create an ntuple, by using the constructor of the class,and then �lling in the data. The only hard part is that there is an incredible selection ofhistogram types. First, histograms can be 1, 2 or 3 dimensional. Second, the values storedcan be character (one byte integers), short (2 byte integers), oats, or doubles. The namesof the histogram classes re ect the di�erent types available. They all start TH , and then addon the dimension (1, 2 or 3) and the data type (C, S, F, or D). So a 1 dimensional oatingpoint histogram is in the class TH1F .Actually creating a histogram is done by calling 'new' and the name of the class, witharguments to specify the data range, name, header, etc.
June 9, 1998 165 Formatting Questions5.1 How do I tell root what style to use when drawing a his-togram?There are two ways. First, the user can play with the GUI canvas after the drawing has beendone. She can change the style, the colors, the markers, add text, just about anything. Sec-ond, the options can be speci�ed when drawing the histogram. Naturally, there are di�erentoptions for 1-D, 2-D, etc., but to an amazing extent, they overlap. To use any of these op-tions, make them an argument to the Draw() class member, as in histo->Draw(''box'');. (Yes, the quotes are necessary.Some major options for all histograms are� same { superimpose on the previous picture� cyl, pol, sph, psr { use cylindrical, polar, spherical or pseudorapidity/phi coordi-nates� lego { draw a lego plot (variations include lego1, lego2 )� surf { draw a surface plot (variations include surf1 through surf4 )Some of the options for 1-D histograms are� A { do not draw axis labels and tick marks� B { draw a bar chart, which shows in a contrasting color under the graph line, ratherthan just outlining it� C { draw a smooth curve, rather than a bar chart outline� E { draw error bars (variations include E1 through E4 )� L { draw a line through the bin contents� P { put a marker at each bin, rather than a line� * { put a '*' marker at each bin, rather than a line. (Note that I couldn't get this oneto work.)Some of the options for 2-D histograms are

June 9, 1998 17� scat { draw a scatter plot (default). This has a funny interpretation that may takesome getting used to. Recall that what you're doing is drawing the histogram, andthe histogram only stores processed data, not the individual points. So, when it doesa scatter plot, it can't plot each point as it was input, it only puts a point randomlyin the interval of the bin.� box { draw a box whose size is proportional to the number of points in the bin� col { draw a box for each bin, with di�erent colors for di�erent numbers of points� cont { draw a contour plot (variations include cont0 through cont3 )As an example of what these do, I've done a generic 1-D and 2-D histogram, and drawnfour sample styles in �gures 1 and 2. Enjoy!5.2 What about other options, like axis titles, overall titles, andstatistics?Overall titles are automatically put in. The text is given when the histogram is created.If the histogram is drawn from an ntuple, the title is the name of the ntuple. Any othercomments you want to add can be put in with the TPaveLabel class. See the �le $(ROOT-SYS)/tutorial/h1draw.C for some examples.You can put an x grid on the background with the command (assuming you're workingon pad1) pad1->SetGridx(); (obvious changes for a y grid). This can also be done withthe entire canvas: c1->SetGridx(); .To put a title on the x axis, use the command (for histogram h1) h1->SetXTitle(``xaxis''); . Obvious changes for y and z axes. Sometimes, there is a problem with thetitle running into the labels. You can move the title out of the way with the commandh1->SetTitleOffset(1.1,''X'') . (Obvious change for the Y and Z axes.) The defaulto�set is 1.0, and increasing it moves the title away from the axis. Going over about 1.7 willmove the title o� the graph entirely, so be careful. Another way to get the proper clearanceis move the labels. The command h1->SetLabelOffset(-0.1,''X'') will move the labelsup (closer to the axis) slightly.Simple statistics (name, number of entries, mean and RMS) are the default for 1-D his-tograms. To change which statistics are shown, use the command gStyle->SetOptStat(x), where x is a string of 1's and 0's that specify which statistics to print. The choices, in orderare� Number of under ows� Number of over ows

June 9, 1998 18
-4 -3 -2 -1 0 1 2 3 40
50
100
150
200
250
300
350
x distribution h1
Nent = 5000
Mean = 0.0013106
RMS = 0.994306
-4 -3 -2 -1 0 1 2 3 4
0
50
100
150
200
250
300
350
x distribution
-4 -3 -2 -1 0 1 2 3 40
50
100
150
200
250
300
350
x distribution h1
Nent = 5000
Mean = 0.0013106
RMS = 0.994306
-4 -3 -2 -1 0 1 2 3 40
50
100
150
200
250
300
350
x distribution h1
Nent = 5000
Mean = 0.0013106
RMS = 0.994306
Figure 1: 1-D sample histogram styles. Clockwise from upper left: default, lego, e, c.

June 9, 1998 19
-4 -3 -2 -1 0 1 2 3 4-4
-3
-2
-1
0
1
2
3
4
x-y distribution
-4 -3 -2 -1 0 1 2 3 4-4
-3
-2
-1
0
1
2
3
4
x-y distribution
-4 -3 -2 -1 0 1 2 3 4
-4-3
-2-1
01
23
40
102030405060708090
x-y distribution
-4 -3 -2 -1 0 1 2 3 4
-4-3
-2-1
01
23
40
102030405060708090
x-y distribution
Figure 2: 2-D sample histogram styles. Clockwise from upper left: scat, box, lego, surf.
June 9, 1998 20� Root mean square deviation� Arithmetic average� Number of entries� Name of objectSo, if you wanted all of these, do gStyle->SetOptStat(111111) . If you only want the RMSdeviation and average, do gStyle->SetOptStat(1100) . Do not enter any leading zeros, asthey just screw everything up.Other attributes of the statistics box can also be set with gStyle . SetStatColor willset the background color of the box. SetStatX(a) and SetStatY(b) will put the top rightcorner of the statistics block at (a,b), where a is a number between 0 (far left) and 1 (farright). SetStatH(a) and SetStatW(b) set the height and width as a fraction of the totalheight.Other drawing options are the marker style and color, the �ll color and style, and theline color and style. All colors are referred to as integers from 1 to 50. To see what thesecolors mean, go to a canvas, and from the menu, click on \view" then \colors". To set acolor, typeh1->SetFillColor(2);h1->SetMarkerColor(2);etc. Marker styles (what you get if you have a 2-D scatter plot or a 1-D plot with errorbars) are numbered from 1 to 30. To see them, go to a canvas, and from the menu, click on\view" then \markers". To set a style, typeh1->SetMarkerColor(2);h1->SetMarkerSize(0.7);The size is relative to the default. Play until it looks right.If you want to set the background color of a canvas and any pads it has, you can do sowithc1->SetFillColor(42);c1->GetFrame()->SetFillColor(21);c1->GetFrame()->SetBorderSize(6);c1->GetFrame()->SetBorderMode(-1);The last two lines make the border look pretty. I have no idea what other options look like.
June 9, 1998 215.3 Is it possible to display only a part of a histogram? Forexample, only the part of the histogram with x between 1and 2?Yes and no. You can set the range of a histogram to just the \interesting part", but doingso will require resetting the histogram and �lling it up again. To do so for histogram h1 ,typeh1->Reset();h1->SetBins(25,1,2);This will reset the x axis so it has 25 bins, going from 1 to 2. If you add three morearguments, you can reset the y axis bins.Now, say you've got an ntuple that you're going to draw a histogram from. Can you setthe bins for that? Yes and no. The simple way is to just do a cut that preserves only theinteresting region. However, you still get the default number of bins. If you want to go to allthe work, you could traverse the ntuple (see question 4.5) and �ll in a histogram manually.5.4 How do I get a logarithmic histogram?The property of having an axis with logarithmic scaling is a function of the pad that thegraph is on. The way of setting this (assuming pad1) is with pad1->SetOptLogy(1); . Toturn o� logarithmic scaling, change the 1 to a 0. To set it for other axes, change Logy toLogx or Logz.5.5 How do I set the options on histograms drawn from an ntuple?Pretty much the same way you set them on a direct histogram. Say you've got an ntuplenamed ntuple , and you want to draw a killer histogram from it.ntuple->SetFillColor(2);ntuple->SetMarkerStyle(21);ntuple->Draw(``x'', ``x>-5000'', ``e1p'');The second argument is a \false cut", since you've got to have a place holder there. Thepoint is that you can set the options just as if it were a histogram.
June 9, 1998 226 Doing Stu� With root6.1 How can I de�ne a formula? How do I de�ne a function?A little bit of root terminology here: a \formula" is a string of characters that when parsedas a C expression, with inputs of \x", \y" and/or \z", will return a number (of type double).4A \function" is a formula, with the di�erence that it has parameters, whose values can bevaried, as well as having a range of values for x, y, and/or z. So, the real di�erence is that aformula will give a number when evaluated, but a function can be drawn and �tted to data.You can de�ne and evaluate a formula pretty simply:TFormula *form1 = new TFormula(``form1'', ``abs(sin(x)/x)'');form1->eval(10.0);Functions are also pretty easy. The classes are TF1, TF2 and TF3 , corresponding to 1,2 and 3 dimensional functions. A simple function without any parameters would be de�nedand drawn byTF1 *func1 = new TF1(``func1'', ``abs(sin(x)/x)'',0,10);func1->Eval(0.56);func1->Draw();Note that you have to provide upper and lower limits for the function. For a 2-D function,you've gotta provide all the limits:TF2 *func2 = new TF2(``func2'', ``abs(sin(x)/x)*y'',0,10,-2,2);func2->Draw(``lego'');But functions are a lot more exciting than that, since you can put in adjustable param-eters, allowing for �tting. For example,TF1 *f3=new TF2(``func3'',``[0]*sin(x)+[1]*sin(2*x)+[2]*sin(3*x)'',0,6.28);f3->SetParameter(0,1.1);f3->SetParameter(1,2.1);f3->SetParameter(2,3.1);f3->Draw(``lego'');Note that before you draw it, you have to give values to the parameters. If you like, youcould also give names to the parameters via f3->SetParName(0,''a0''); .root has also de�ned a bunch of pre-de�ned functions, all the functions that physicistsnormally use and abuse, including gaussian, exponential, and polynomial. The gaussianfunction is called gaus , and is called something likeTF1 *func4 = new TF1(``func4'', ``gaus(0)+[3]*sin(3*x)'',0,6.28);func3->SetParameter(0,1);func3->SetParameter(1,0);4A round of applause here, please, for the coder of the TFormula class, Nicolas Brun, age 18!!!. Heck, at18, I was just wasting time!
June 9, 1998 23func3->SetParameter(2,1);func3->SetParameter(3,3.1);func3->Draw();The '0' in \gaus(0)" means to take the three parameters of the gaussian function starting atspot zero. The three parameters are amplitude, location, and width.The exponential function is named expo , and has two parameters, used as expo(x) =ep0+p1�x .Polynomial functions are named pol0, pol1, pol2 , etc, for polynomials of degree 0, 1,2, etc. For degree N, there are N+1 parameters to specify.6.2 How do I do a �t with root ?This is pretty easy. If you want to use one of the pre-de�ned functions, and you are willingto accept root 's defaults, it's a one liner:h1->Fit(``gaus'');This will �t a gaussian to the histogram h1 , by minimizing the sum of the squared errors,weighted by the inverse of the square root of the number of counts in the bin, using thefunction value at the midpoint of the bin, and using a host of other options. Now, if youdon't want to use the basic options, here's what you do. You use the callh1->Fit(``gaus'', ``fit option'', ``graph option'',lower bound,upper bound);Here are the �t options (input as a quoted character string):� V { verbose �tting information { USE THIS! How else are you going to know that the�t didn't work at all!� I { use integral of function over bin, rather than value of function at midpoint { better,but slower.� W { use constant weights� E { \perform better error estimation using the Minos technique", whatever that means.� B { \some parameters are bound" { see below.� R { �t only over the range of x, y, or z speci�ed in the function.� + { �t a new function, but don't throw away the old function.� H { do not draw or store the graphics object resulting from the �t.� O { store, but do not plot, the graphics object from the �t.
June 9, 1998 24The graph options are the same as for drawing any histogram (see question 5.1).Rather than �tting from the keyboard, you can �t directly from the GUI. Move themouse over the pad of the drawn histogram until you see an arrow (not a hand, crosshairs,or anything else), and then right click. Then pick out \FitPanel" to see another GUI withall of the above options on it.You can also �t your own user de�ned functions, but if you do so, you have to give rootthe starting parameter values. root will guess at the starting parameter values for its ownfunctions.To �t a function whose parameters fall only in a certain range, you have to tell thefunction that the parameter is bound, and then tell Fit that the function has a boundparameter. You do the latter with the \B" option. You do the former (parameter 0 between�1, for example) with the callfunc->SetParLimits(0,-1,1);Once you've gotten the �t, you can get the parameter values out as follows (assumingthat your histogram h1 was �tted with a gaus function):TF1 *func = h1->GetFunction(``gaus'');func->GetParameter(0);func->GetParameter(1);func->GetParameter(2);You can get the errors of the �t parameters the same way, using GetParError(0) , etc.Errors of the �t can be had by �nding the histogram value via h1->GetBin(x); , and thensubtracting the function value at x.6.3 How can I smooth the data with root ?6.4 What kinds of random deviates does root have? How do Igenerate them?Normal deviates: generate them with calls to gRandom->Gaus(0.0,1.0) , with the �rstargument being the mean and the second the standard deviation.Uniform deviates: generate them by gRandom->Rndm(); .For either of the above, you can set the seed by the call gRandom->SetSeed(x); . Thedefault seed is 12345.You can get deviates for an arbitrary distribution, but you have to do a couple moresteps. First, you have to de�ne the PDF (probability distribution function, which gives theprobability of landing between x and x+dx) as a function (see question 6.1) with the properrange. Then, you call the GetRandom() member function. For example, to generate randomdeviates from a gamma distribution with � = 3 and � = 1, you'd do the following:

June 9, 1998 25TF1 gamma = new TF1(``gamma'', ``0.5 * exp(-x) * x * x'',0,100);gamma->GetRandom();The one thing you have to be careful about here is the upper and lower limits, due to theway root calculates the random deviate. What root does is integrate the function betweenthe limits, at a given set of points. After normalizing (i.e., multiplying the function by a valueso that the total integral is 1.0), it then generates a uniform deviate, �gures out in whichbin it falls, and then linearly interpolates. If the limits of your function are too wide, thatintegration will be very grainy, and you'll be relying too much on the linear interpolation.So, my advice is, always take a look at a 1-D histogram of the random deviates before usingit. The graininess will be readily apparent as a \ at spot" on the graph where it doesn'tbelong.6.5 How can I get a graph of some input data?Here's the situation: you want to make a killer graph of your data, suitable for publication,so you decide to use root . You've come up with the data points and the errors on eachside, and now you need to come up with a way of drawing your error bars.root makes this pretty simple, but there it is a subtle process. The �rst thing to do is toget the x and y data into separate one dimensional Float t matrices. Also, put the numberof data points into a integer variable. Then, create the graph with a statement likeTGraph *tt1 = new TGraph(n,x,y);'n' is the integer number of points, 'x' is the name of the matrix containing the x values,and 'y' is the name of the matrix containing the y values.Drawing the graph is easy: tt1->Draw(``AL'') . The stu� inside the quotes gives thestyle for the graph, with the following options:� A { draw axes for the graph� P { use the current marker (see next question) for each point� * { use a \*" for each point� C { draw a smooth curve through the points� L { draw a simple line between the points� F { �ll in the area below the points� B { draw a bar chart
June 9, 1998 26One subtlety is the drawing of multiple plots on the same graph. Note that there is noway to specify more than one set of data points in TGraph , so you've got to be creative. Theway to do it is to create and draw the �rst graph with axes (option 'A'), and then put thecreate and draw the second graph without axes. (Use the same pad/canvas.) For example,TGraph *tt1 = new TGraph(n,x1,y1);tt1->Draw(``ALP'');TGraph *tt2 = new TGraph(n,x2,y2);tt2->Draw(``L*'');6.6 How do I set graphics options for a graph?The overall title and most of the color/style options are easy. Use the same commands as forhistograms, before drawing the graph. For example, to set the title and background color,do something like// Create the canvas, set optionsc1 = new TCanvas("c1","",200,10,700,500);c1->SetGridx();c1->SetGridy();// Create the graphsTGraph *tt1 = new TGraph(nlines,x1,y1);tt1->SetTitle("");tt1->SetMarkerStyle(24);tt1->Draw("ALP");Setting the axis titles is a little tricky, since root piggybacks TGraph onto the histogramclasses. The basic method is to draw the graph, then set the axes titles:// Create the canvas, set optionsc1 = new TCanvas("c1","",200,10,700,500);// Create the graphTGraph *tt1 = new TGraph(nlines,x1,y1);tt1->SetTitle("");tt1->Draw("AL");c1->Update();tt2->GetHistogram()->SetXTitle("Energy Lost (GeV)");
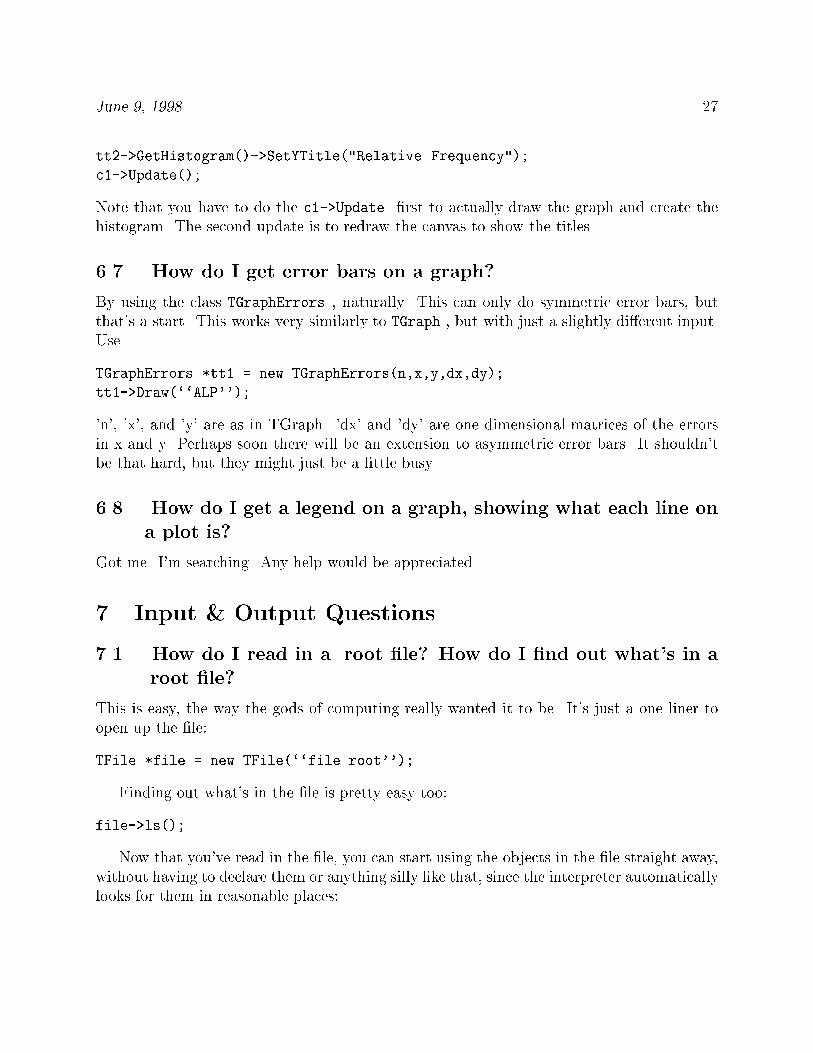
June 9, 1998 27tt2->GetHistogram()->SetYTitle("Relative Frequency");c1->Update();Note that you have to do the c1->Update �rst to actually draw the graph and create thehistogram. The second update is to redraw the canvas to show the titles.6.7 How do I get error bars on a graph?By using the class TGraphErrors , naturally. This can only do symmetric error bars, butthat's a start. This works very similarly to TGraph , but with just a slightly di�erent input.UseTGraphErrors *tt1 = new TGraphErrors(n,x,y,dx,dy);tt1->Draw(``ALP'');'n', 'x', and 'y' are as in TGraph. 'dx' and 'dy' are one dimensional matrices of the errorsin x and y. Perhaps soon there will be an extension to asymmetric error bars. It shouldn'tbe that hard, but they might just be a little busy.6.8 How do I get a legend on a graph, showing what each line ona plot is?Got me. I'm searching. Any help would be appreciated.7 Input & Output Questions7.1 How do I read in a .root �le? How do I �nd out what's in a.root �le?This is easy, the way the gods of computing really wanted it to be. It's just a one liner toopen up the �le:TFile *file = new TFile(``file.root'');Finding out what's in the �le is pretty easy too:file->ls();Now that you've read in the �le, you can start using the objects in the �le straight away,without having to declare them or anything silly like that, since the interpreter automaticallylooks for them in reasonable places:

June 9, 1998 28sqroot->Print();histo1->Draw();If you're writing code to compile, you've got to do it the long way:TH1 *histo1 = (TH1*) gROOT.FindObject(``histo1'');histo1->Draw();7.2 How do I create a .root �le?The �rst step is to create the �le.TFile myfile(``myfile.root'', ``RECREATE'');The second step is to put stu� into the �le. Say you've got an ntuple ntuple and ahistogram h1 you want to write to the �le. There are two ways to do this. If you wantsome, but not all of the objects laying around to be saved, you can save them explicitly:ntuple->Write();h1->Write();If you want to save all of your objects to the �le, try this:myfile->Write();Finally, the �le has to be closed. This will happen automatically at the end of the run,but if you want to do it explicitly, you can type myfile->Close();7.3 How do I convert an .hbook �le into a .root �le? Will all thedata be preserved, including the names?Since the developers of root knew that physicists love legacy code, there is included in eachdistribution a program to convert old \.hbook" �les created with PAW into new \.root"�les usable by root . To use it, just type at the system command lineh2root file-name.hbook file-name.rootIf you're lazy, you can omit the second �le name, and h2root will use the same �le name,except with .root instead of .hbookAs for using the new �le, just load it up into root as you usually would. Any histogramshave the same name, and can be used just like a normal root histogram. Any ntuples havebeen turned into a TTree object, and can be treated like a root tree. Since PAW does notrecognize the di�erence between uppercase and lowercase in names, root has a choice aboutcapitalization. The choice made was to capitalize the initial letter, and make the rest lowercase.

June 9, 1998 297.4 How do I read data from an ASCII �le into an ntuple?The basic method is to steal a macro from the root Tutorial [2], and modify it for yourpurposes. For those of you who can't �nd the tutorial, here is my mangling of the macro:{// Reset -- this appears to be done with every macro -- might as well do itgROOT->Reset();// Open a file, just like on c -- no need for stream output here, yeah!FILE *fp = fopen("/home/tebe/cern/ascii1.txt","r");// Declare some variables -- use their types, not the usual int, float, etc.Float_t x,y,z;Int_t ncols,nlines=0;// Here comes the C++ stuff// Allocate the file, giving the name and an option// I'm not sure what "RECREATE" meansTFile *f = new TFile("basic.root","RECREATE");// This creates an ntupleTNtuple *ntuple = new TNtuple("ntuple","data from ascii file","x:y:z:");// Now loop through the file using typical C syntaxwhile (1){ ncols = fscanf(fp,"%f %f %f",&x, &y, &z);if (ncols < 0) break;if (nlines < 5) printf("x=%g, y=%g, z=%g\n",x,y,z); // print first 5 lines// Put the data into the ntuplentuple->Fill(x,y,z);++nlines;}printf("found %d points\n",nlines);// Close the ascii filefclose(fp);// Write the root file, containing the ntuplef->Write();}7.5 How do I take data from an ntuple and write it to an ASCII�le?See the answer to question 4.5 on how to traverse an ntuple. Once you've gotten everythingset up to traverse the tree, just put in the usual C statements to open, write to, and close a�le. Here's an example of how to do that, working with the same ntuple as question 4.5:

June 9, 1998 30FILE *out = fopen(``ascii.txt'', ``w'');if (out == NULL)printf(``Sorry, but the ascii output file did not open.'');for (Int_t i=0; i<nentries;i++){ nbytes += ntuple->GetEvent(i);fprintf(``x,y,z= %f, %f, %f \n'',x,y,z);}fclose(out);7.6 How do I get data from a �tted function and write it to anASCII �le?This is pretty simple. if you want the values, the best way to do it is to write a loop thatgoes through the x values you want, and for each one, calculate the value of the functionusing Eval. As an example, say you've got a histogram called h1 that you want to �t andget the results out to another program. Then this would �t a degree 6 polynomial to it andwrite the data:h1->Fit(``pol6'', ``V'');TF1 func = h1->GetFunction(``pol6'');Double_t h_min = h1->GetMinimum();Double_t h_max = h1->GetMaximum();Double_t h_step = (h_max+h_min)/100.0;for(Double x = h\_min; x <= h_max; x += h_step)fprintf(out, ``%f %f \n'',x,func->Eval(x));If you want to output the paramters of the function, see question 6.2 for how to get theparameters, and then use fprintf to get them put out.7.7 How can I get root to output a histogram directly to anencapsulated postscript �le?By using the Print() member function, with an argument of the name of the �le you wantto create. For example,c1->Print(''test.eps'');will create an encapsulated postscript �le named test.eps .Note that you can also create the �les manually by clicking on the canvas.
June 9, 1998 317.8 How can I get root to read a �le and histogram it at the sametime another process is writing the �le?This really isn't that hard. Just set up root as if you were reading an ASCII �le as shownabove, but with a little more circumspection on the input. Read the input a character ata time, gradually building up an input string. When the string is complete, process theobservation. If you get to an end of �le (EOF) condition, make root wait and read the �leagain.There are two keys. First, make sure the data is coming in. If it's coming from anotherprogram, make sure that the entire output isn't being bu�ered. Second, make sure you havesome way of stopping execution of root , either by a time out, another input �le that passescommands, or a count of the input.If anybody is interested in this, I've got a program I wrote to do this, as a real timemonitor of some DAQ. Write me, and I'll send it to you.References[1] Brun, Ren�e, et al., ROOT, Overview, published as the gzipped postscript �leROOTMain.ps.gz, which may be downloaded freely from the main root web site,http://root.cern.ch, under \status and availability".[2] Brun, Ren�e, et al., ROOT, Tutorial, published as the gzipped postscript �leROOTTutorials.ps.gz, which may be downloaded from the main root web site,http://root.cern.ch, under \status and availability".[3] Brun, Ren�e, et al., ROOT, Classes Reference Manual, published as the gzippedpostscript �le ROOTClasses.ps.gz, which may be downloaded from the main root website, http://root.cern.ch, under \status and availability".[4] Rademakers, Fons, ROOT Course, published in three gzipped postscript �lescourse1.ps.gz, course2.ps.gz, and course3.ps.gz, which may be downloaded freely fromthe main root web site, http://root.cern.ch, under \publication list".[5] Levine, John R. and Margaret Levine Young, UNIX for Dummies, second edition, IDGBooks Worldwide, 1995. I am not implying that my readers are dummies! I learnedeverything I know about UNIX from this book, and found it quite useful.[6] Oualline, Steve, Practical C Programming, third edition, 1997, published by O'Reilly& Associates.[7] Kochan, Stephen G., Programming in ANSI C, �rst edition, 1988, Hayden Books.

June 9, 1998 32A second edition exists, published ?. One big advantage of this over the Oualline bookis that it has an appendix on the standard C library.[8] Pohl, Ira, C++ For C Programmers, second edition, 1994, published by Addison-Wesley.