Root Cause Analysis - Dallas Chapter of the IIA Cause Analysis Presented by: Priya Sarjoo ......
23
Root Cause Analysis Presented by: Priya Sarjoo Director, Business Advisory Services October 1, 2009
Transcript of Root Cause Analysis - Dallas Chapter of the IIA Cause Analysis Presented by: Priya Sarjoo ......

Root Cause Analysis
Presented by: Priya SarjooDirector, Business Advisory Services
October 1, 2009

© Grant Thornton LLP. All rights reserved.
Agenda
• Definition • Methodologies• Problem identification• Process understanding• Cause identification• Data collection & analysis• Corrective action

© Grant Thornton LLP. All rights reserved.
Definition
• Root Cause Analysis: – Component of a corrective action process whereby
failures or non-conformances are identified, causes are diagnosed and actions are taken to prevent recurrence
– Focuses on identifying possible causes, collecting and analyzing data and determining actual cause(s)
– A generic skill that can be applied to nearly any type of problem
1

© Grant Thornton LLP. All rights reserved.
Methodologies
• Various methodologies for conducting root cause analysis– Events and causal factor analysis– Change analysis– Barrier analysis– Risk tree analysis– Six Sigma (DMAIC)
2

© Grant Thornton LLP. All rights reserved.
Problem identification
• Effective root cause analysis requires deductive or logical thinking about cause-and-effect relationships
• Example:– Effect: Increase in number of cancer diagnoses– Possible Causes: ??
3

© Grant Thornton LLP. All rights reserved.
Problem identification (continued)
• Example:– Effect: Increase in number of cancer diagnoses– Possible Causes:
• Increase in number of individuals tested• More precise testing techniques• Increased incidences of cancer• Others…
4

© Grant Thornton LLP. All rights reserved.
Problem identification (continued)
• Root cause analysis can be ineffective when you only focus on what is most visible, or most convenient
• Example:– Assuming errors are one time
events which will not occur again
5

© Grant Thornton LLP. All rights reserved.
Problem identification (continued)
• Develop a thorough, succinct description which includes the following:– What?– Where?– Who?– When?– How much?
• Do not include or imply a cause
6
© Grant Thornton LLP. All rights reserved.
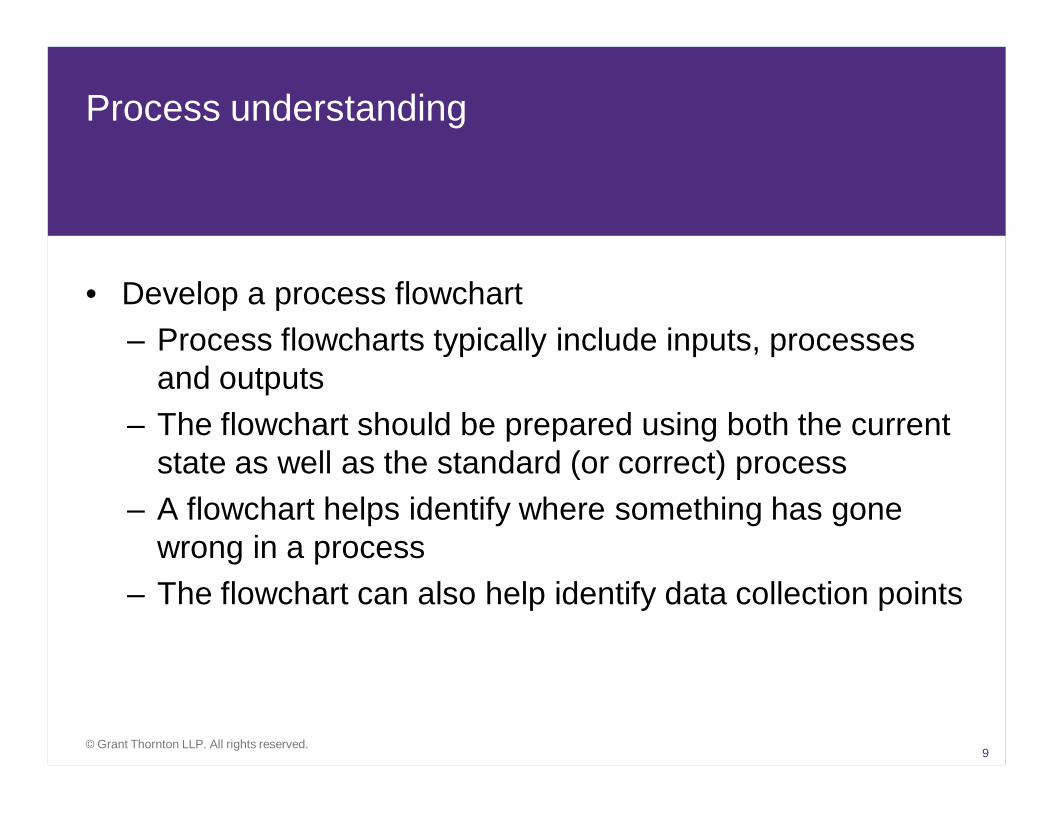
Process understanding
• Develop a process flowchart– Process flowcharts typically include inputs, processes
and outputs– The flowchart should be prepared using both the current
state as well as the standard (or correct) process– A flowchart helps identify where something has gone
wrong in a process– The flowchart can also help identify data collection points
9

© Grant Thornton LLP. All rights reserved.
Process understanding (continued)
• Analyze each step within the flowchart for possible weaknesses– Lack of defined standards, incomplete process, broken
process, non-compliance with process• Focus on process failures instead of operator failure
10

© Grant Thornton LLP. All rights reserved.
Cause identification
• Develop theories about what is causing the problem– Examine the flowchart– Compare to standards– Compare to expected procedures– Use a logic tree (5 whys)– Use a cause-and-effect diagram (4 Ps)
7

© Grant Thornton LLP. All rights reserved.
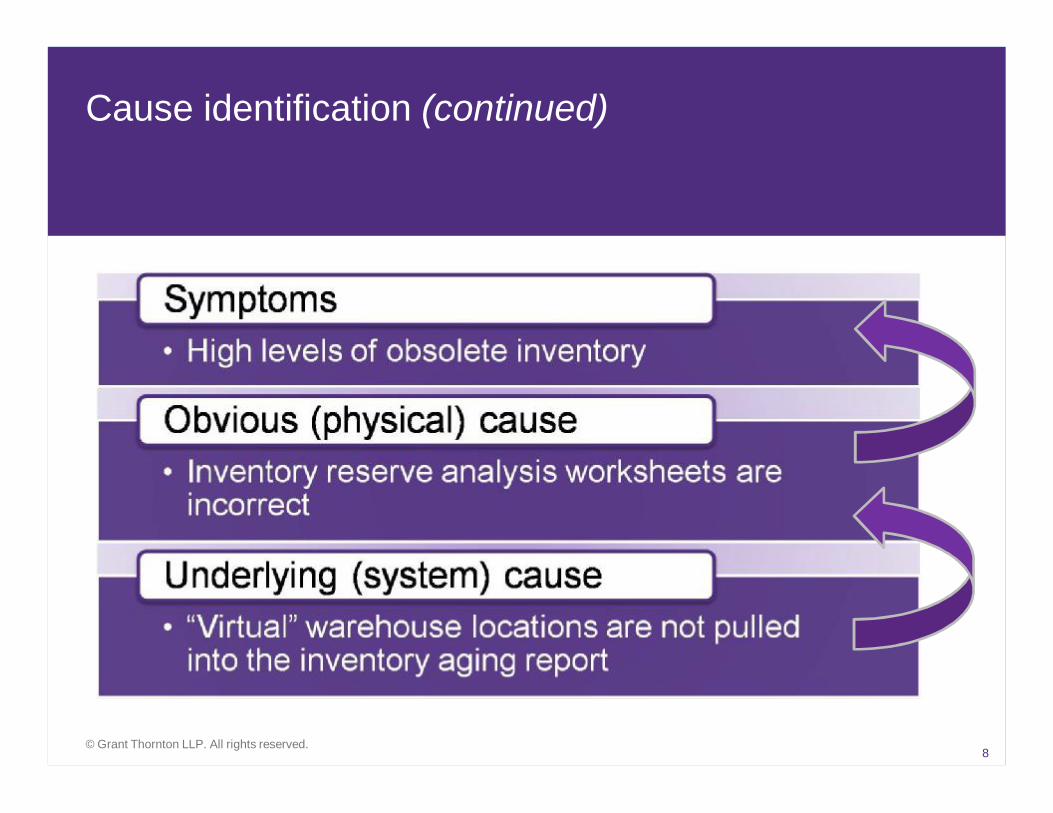
Cause identification (continued)
• Differentiate between symptoms and causes– Symptoms are the signals that something is
wrong– Causes are the underlying reasons which result
in the symptom(s)
• Drill down from symptoms to system cause
7
© Grant Thornton LLP. All rights reserved.
Cause identification (continued)
8

© Grant Thornton LLP. All rights reserved.
Cause identification (continued)
• Analyze to identify possible causes• Narrow causes down by identifying the
ones most likely to have caused the error– Conduct a sanity check– Is it logical?– Is it supported by the data?– Is it probable?
13

© Grant Thornton LLP. All rights reserved.
Cause-and-effect analysis
• Drill down from symptoms to system cause– The “5 whys” process
• Keep asking why something happened, until you get to a point where you can take action to correct the underlying system cause
11

© Grant Thornton LLP. All rights reserved.
System Cause
Physical Cause
SymptomHigh Levels of Obsolete Inventory
Inadequate Inventory
Management
Poor Visibility to Inventory
Levels
Insufficiently Trained Staff
Slow Sales
Priced Incorrectly
Why?
Why?
Why?
Cause-and-effect analysis (continued)
12

© Grant Thornton LLP. All rights reserved.
Cause-and-effect analysis (continued)
12
• Drill down from symptoms to system cause (cont’d)– The “4 Ps” process
High obsolete inventory
People Place
Procedures Policies
Computer problem
Un-reviewed calculations
Insufficient training
No monthly validation

© Grant Thornton LLP. All rights reserved.
Data collection
• Understand cause-and-effect• Understand the process variables and how
they can be measured• Understand the data and how it can be
gathered• Decide on analysis methods• Gather the data
15
© Grant Thornton LLP. All rights reserved.
Data collection methods
• Interview• Observation• Data review• Scientific techniques
16

© Grant Thornton LLP. All rights reserved.
Data analysis
• Ensure the correct data is collected (i.e. data is pertinent to the issue under review)
• Determine the expected outcome• Analyze the data• Compare to expected outcome
17

© Grant Thornton LLP. All rights reserved.
Data analysis (continued)
• Obsolete inventory example:– Understand standards or established procedures for
inventory management– Develop process flowchart showing inventory inputs,
processes and outputs– Identify data to be collected and analyzed– Collect inventory aging by SKU, dollars and quantity– Re-perform inventory reserve calculation– Compare to existing reserve calculation– Identify inconsistencies
18

© Grant Thornton LLP. All rights reserved.
Corrective action
• Focus resources on where they would be best spent– Identify one problem/reason/cause which may have the
largest impact (e.g. dollars, time, re-work, exposure, etc.)– Focus efforts on resolving the cause with the largest
impact
14

© Grant Thornton LLP. All rights reserved.
Questions
19