
Room Temperature Electrochemical Synthesis of Hg-1212 · Room Temperature Electrochemical Synthesis...
57
Room Temperature Electrochemical Synthesis of Hg-1212 Superconducting Thin Films D. D. Shivagan, P. M. Shirage, L. A. Ekal and S. H. Pawar* School of Energy Studies, Department of Physics, Shivaji University, Kolhapur- 416 004 (INDIA). *E-mail: [email protected] [email protected] Abstract In the present investigation, the novel two-step electrochemical process of room temperature synthesis of Hg-1212 superconducting films has been developed and reported first time. Electrochemical parameters were optimized by studying cyclic voltammetry (CV), linear sweep voltammetry (LSV) and chronoamperometry (CA) for the deposition of Hg-Ba-Ca-Cu alloy at room temperature. Current time transient showed progressive growth with hemispheriodal granules, which were then revealed by scanning electron microscopy (SEM). Stoichiometric electrocrystallization to get Hg 1 Ba 2 Ca 1 Cu 2 O 6+x (Hg-1212) was completed by electrochemically intercalating oxygen species into Hg-Ba-Ca-Cu alloy at room temperature. The oxygen content in the samples was varied by varying the electrochemical oxidation period and the changes in the crystal structure, microstructure, and superconducting transition temperature (T c ) and critical current density (J c ) were recorded. The films oxidized for 28 min showed T c = 104.7 K with J c = 1.437 x 10 3 A/cm 2 . The dependence of superconducting parameters on oxygen content is correlated with structure property relations and reported in this paper. * The corresponding author PACS Numbers : 74.72.Gr; 74.76.Bz ; 81.15.Pq Key Words : Hg-based cuprates; High-T c films; electrodeposition
Transcript of Room Temperature Electrochemical Synthesis of Hg-1212 · Room Temperature Electrochemical Synthesis...

Room Temperature Electrochemical Synthesis of Hg-1212Superconducting Thin Films
D. D. Shivagan, P. M. Shirage, L. A. Ekal and S. H. Pawar*School of Energy Studies,
Department of Physics,Shivaji University, Kolhapur- 416 004 (INDIA).
*E-mail: [email protected][email protected]
Abstract
In the present investigation, the novel two-step electrochemical process of room temperature synthesis
of Hg-1212 superconducting films has been developed and reported first time. Electrochemical parameters were
optimized by studying cyclic voltammetry (CV), linear sweep voltammetry (LSV) and chronoamperometry
(CA) for the deposition of Hg-Ba-Ca-Cu alloy at room temperature. Current time transient showed progressive
growth with hemispheriodal granules, which were then revealed by scanning electron microscopy (SEM).
Stoichiometric electrocrystallization to get Hg1Ba2Ca1Cu2O6+x (Hg-1212) was completed by electrochemically
intercalating oxygen species into Hg-Ba-Ca-Cu alloy at room temperature. The oxygen content in the samples
was varied by varying the electrochemical oxidation period and the changes in the crystal structure,
microstructure, and superconducting transition temperature (Tc) and critical current density (Jc) were recorded.
The films oxidized for 28 min showed Tc = 104.7 K with Jc = 1.437 x 10³ A/cm2. The dependence of
superconducting parameters on oxygen content is correlated with structure property relations and reported in
this paper.
* The corresponding author
PACS Numbers : 74.72.Gr; 74.76.Bz ; 81.15.Pq
Key Words : Hg-based cuprates; High-Tc films; electrodeposition

1. Introduction
Hg-based superconductors are attracting much attention among other cuprates due to
its high superconducting transition temperature, Tc, of 134 K and 164 K measured at ambient
and high pressure of 30 GPa, respectively [1,2]. The first member HgBa2CuO4+δ, of this
HgBa2Can-1CunO2n+2+δ [Hg-12(n-1)n] series, was invented in 1993 by Putilin et al. [3]
exhibiting superconductivity at 94 K. Soon after, Schilling et al. [1] observed
superconductivity at 133.5 K in the Hg-Ba-Ca-CuO system and reported the formation of Hg-
1212 and Hg-1223 phases. The highest values of Tc’s, which were determined as the onset
temperature of Meissner signal, were 97 K [4], 127 K [5], 135 K [6], and 123 K [7] for Hg-
1201, Hg-1212, Hg-1223 and Hg-1234 phases, respectively. Particular importance of the
series is very high Tc values than other cuprate superconductors.
Of these, Hg-1212 with Tc = 127 K is relatively stable phase bearing the highest Tc
than obtained for 1212 phase of the other cuprates and hence extensively studied for the
fundamental studies, particularly of irreversibility line (IL) and anisotropy problems [8-9].
For the fundamental studies of basic intrinsic properties one must be in a position to
synthesize these novel materials in thin film form. Further, to achieve desired device
performance, technologically reproducible high quality single-phase films are required.
Recently, the Hg-1212 films with Tc = 120 K exhibiting a critical current density, Jc, of about
106 A/cm2 at 77 K [10] have successfully synthesized. The first ever-superconducting
quantum interference device (SQUID) operating above 110 K was made from these Hg-1212
films [11]. This offers the possibility of electronic and microelectronic applications of these
superconducting films above 110 K.

For the synthesis of superconducting thin films, the range of processes such as
chemical vapor deposition, laser ablation, molecular beam epitaxy, magnetron sputtering,
physical vapor deposition, sol gel, spray pyrolysis and electrodeposition have been used. In
addition to the experimental complications, the following two problems make synthesis of
mercurocuprates a difficult task. First, notably, the high volatile nature of Hg and HgO oxides
at relatively low temperatures of 360-500 oC, depending on the process technique. Besides
the severe problem of reduction in Hg stoichiometry, the evolution of this poisonous toxic
mercury oxide vapour are dangerous for living being and creates environmental problem.
Second, the formation of stoichiometric Ba2Can-1CunOx precursor requires very high
annealing temperatures of about 680- 880 oC for longer times depending upon the process
[12]. Further these precursors are very sensitive to air and humidity [13].
To avoid this, most of the researchers have adopted the two-step process as given
below [13]:
i) Precursor pellets/ films of Ba2Can-1CunOx were synthesized by annealing at
high temperature.
ii) Mercury was deposited or precursor was subjected in a controlled Hg-
atmosphere.
When such multi-steps are introduced in the process it becomes difficult to maintain the
process condition to get reproducible and good quality films.
To avoid this, one must choose a reliable process such as electrodeposition: a soft
solution process. In this technique, as the reaction takes place on an atomic level, the Gibbs
free energy required in the thermodynamic process for the formation of crystalline materials
is being provided by the reaction kinetics. Hence avoiding the powder calcining approach it
gives the stoichiometric good quality films at room temperature and in less time.
In the present investigation, an attempt has been made to synthesize HgBa2CaCu2O6+δ
superconducting films by two step electrodeposition technique, at room temperature.
Electrochemical parameters of individual constituents were studied and the processing of the
alloy was optimized by cyclic voltammetry (CV), linear sweep voltammetry (LSV), and
chronoamperometry techniques. Pulsed potential technique was employed to achieve the
control over the desired atomic ratio and morphology of the deposited alloy. Further, a novel
electrochemical oxidation technique, which makes it possible to oxidize the films at room
temperature, was used to oxidize the alloy films with desired stoichiometry to become
superconducting. The films were characterized by XRD, SEM and EDAX techniques for
structural, morphological and compositional studies, respectively. The superconducting
parameters such as Tc and Jc were measured and results are reported in this paper.
2 Electrochemistry of Alloy Deposition:
Electrodeposition is a process for depositing the metals, alloys and oxides on a
conducting substrate from a bath containing the ions of interest. In recent years, an increasing
interest in electronic industry using electrodeposition for microfabrication purposes and in the
surface treatment industry confronted with the need for the development of new types of
functional coatings that are environmentally safe.
In a bath containing metal ions, when a sufficient negative potential greater than the
reduction of metal ions is applied, the metal ions get deposited onto the cathode surface. The

equilibrium reduction potential, Em, of the metal electrode (cathode) in a given solution is
given by the familiar Nernst equation,
Em = Emo + (RT/mF) ln [(aM
m+)/aM] (1)
where,
Em - is standard potential to form M, ‘R’ – is gas constant, ‘T’- is absolute
temperature, ‘m’- is the number of electrons required for the reduction, ‘F’- is the faradays
constant, and ‘aMm+’ and ‘aM’ are activities (concentrations) of metal ions in the electrolyte
and in the deposit respectively.
Electrodeposition of ‘M’ can occur at potentials more negative than the equilibrium
potential; this difference in potential is the overpotential (or over voltage), η. The rate and
amount of deposited metal can be monitored by adjusting the metal ion concentration in the
bath or by applying sufficient overpotentials, which is governed by the following equation,
d[Mo]/dt = km [Mn+] (2)
where, km is the potential-dependent rate constant and [Mn+] is the solution concentration of
the metal ions.
It is easier to deposit the single metal if one takes an account of the interactions of the
solute ions Mm+ with solvent, or with complex formation. The interfacial activity of Mm+,
which depends on ionic strength, must be carefully controlled.
In case of alloy or compound deposition, it is required to deal with two or more
metals having different equilibrium deposition potentials. Hence, for the alloy deposition,
equilibrium potentials, activities of the ions in the solution and the stability of the resultant
alloy are to be understood crucially [16]. For example, for compound MmNn deposition,
component M involves ‘m’ electrons and that of component N, ‘n’ electrons. The equilibrium
potentials of M and N can be determined by Nernst equation and are different.
However, simultaneous deposition of two different kinds of ions at the cathode can be
possible by keeping following condition.
Em +ηm = En + ηn (3)
The activities of the metals M and N in the compound or alloy are determined by their
concentrations, and by the thermodynamical stability of the deposit. The reversible potential
of a metal M alloyed with the component N should be more positive than that of pure metal.
This is because of the free energy of formation of the alloy or compound, ∆G, with a shift of
potential [14],
E = -∆G / rmF (4)
where, ‘m’ is the constituents valence, ‘r’ is mole fraction, ‘F’ is faradays constant and ‘∆G’
is the free energy.
The shift of potential is a constant value for the formation of a compound, but varies
with composition in the case of alloy formation. This often makes it very difficult to control
atomic ratio in deposit. The significant variation of electrochemical potential can be expected
[15].
Further, different kinetic approaches based on kinetic concept and considering the
nature of coupling phenomenon between co-depositing species, following types of
behaviours are discussed recently [17]. In ‘non-interactive co-deposition’, the partial current
densities of the co-depositing metals are largely independent of each other. The co-deposition
of copper and nickel under such conditions behave in this way [18]. Often in alloy deposition,

the partial current densities at the metal electrolyte interface are coupled i.e. the rate of charge
transfer of a given species ‘A’ depends on that of the co-depositing species ‘B’ called as
‘charge transfer coupled co-deposition’. The co-deposition of ‘B’ may lead to decrease,
‘inhibited co-deposition’, or to an increase, ‘catalyzed co-deposition’ of the deposition rate of
‘A’ and vice versa. On the other hand, the ‘induced’ co-deposition can be explained by a
catalytic effect of the codepositing metal. Finally, the co-deposition reactions are coupled
through mass transport process, ‘mass transport coupled co-deposition’. For example, the
reduction of a complexed species may release legends at the cathode surface that affects the
complexing equilibrium and hence the reduction rate of codepositing metals.
In the complexing ion deposition technique, the codepositing species are
simultaneously reduced after the complex reduction potential. Pawar et al. have obtained Dy-
Ba-CuO, Sm-Ba-CuO, YBCO and BSCCO [19-24] based superconducting thin films by
employing the various complexing baths in aqueous solution. Further, the technique was
modified by using the non-aqueous solvents such as DMSO [22-24]; and simply by adjusting
the individual bath concentrations and complex reduction over-potentials based on the
empirical facts, good quality films were achieved.
3 Experimental Procedure
Electrolytic bath was prepared by dissolving mercuric chloride and reagent grade
nitrates of barium, calcium and copper in dimethyl sulphoxide (DMSO). The conventional
three-electrode system consisting of saturated calomel electrode (SCE) as a reference
electrode, graphite as a counter electrode and mirror polished silver foil as working electrode
was used. Initially, the individual baths with 50 mM concentrations of Hg, Ba, Ca and Cu

were prepared and cyclic voltammetry of individual baths and DMSO was studied using
VersaStat-II in order to understand the possible reactions at electrode. Then linear sweep
voltammograms (LSV) of individual baths and combined bath were recorded to estimate the
deposition potentials. After LSV study, a complexing bath was selected to be 45 mM HgCl2,
80 mM Ba(NO3)2, 65 mM Ca(NO3)2. 2H2O and 50 mM Cu(NO3)2.3H2O to get HgBaCaCu
alloyed films with atomic ratio 1:2:1:2. Now the potentiostatic square wave pulse generator
(model 1130) with variable frequency from 1 Hz to 10 MHz and duty cycle from 1 to 100 %
was used. The square wave pulse with 25 Hz frequency and 50 % duty cycle was optimized
and employed in the present pulse deposition process. From cathodic polarization curve and
variation in current density with time for different potentials, the deposition potential was
optimized to be –1.7 V vs. SCE. The films were deposited under potentiostatic conditions for
different lengths of time and thickness was measured by gravimetric weight difference-
density method.
The as-deposited alloyed films were then electrochemically oxidized from alkaline 1
N KOH solution at a potential of +0.7 V vs. SCE at room temperature. The EG & G scanning
potentiostat (model 362) and VersaStat-II was used for the electrochemical oxidation. X-ray
diffraction patterns of as-deposited and electrochemically oxidized films were recorded using
microcomputer controlled Phillips-3710 diffractometer with CuKα radiations. The
microstructural measurements were done using scanning electron microscope (CAMECA
model-30) attached with EDAX. The electrical resistivity and critical current density Jc were
measured using standard four probe resistivity technique, where contacts were made by air-
drying silver paste. The samples were cooled in 10 K He close cycle refrigeration system. A
constant current was passed through the current contacts and the voltage developed was
measured with Keithley multimeters and temperature was measured with the help of silicon
diode sensor.
4 Experimental Results
4.1 Electrochemistry of Deposition of HgBaCaCu (1:2:1:2) Alloyed Films
The interface between the electrode and an electrolyte is the heart of electrochemistry.
It is the place where the charge transfer takes place and gradients in electrical and chemical
potentials constitute the driving force for the electrochemical reactions and hence the alloy
formation. The classic route to the study of electrochemical reactions rests on current and
voltage measurements, i.e. cyclic voltammetry (CV) and linear sweep voltammetry (LSV).
The CV and LSV studies give the electrochemical reduction/oxidation potentials of the
electrodepositing constituents based on the thermodynamic considerations and governed by
the Nernst equations of equilibrium potentials. Hence, this approach was followed in
determining the deposition potentials and bath concentrations.
4.1.1 Cyclic Voltammetry (CV)
The interpretation of cyclic voltammogram for any electrodeposition system is often
not straightforward owing to the combined influence of a number of processes involving
charge transfer, adsorption, electrodeposition and coupled chemical reactions. CV has still
proved to be a very popular and useful probe, particularly when one is studying a new
system.
To understand the individual reduction potentials and whether the constituting metal
species do undergo any oxidation/reduction or multi-step reactions, the cyclic voltammetry
for individual metal bath in dimethyl sulphoxide (DMSO) was studied. The individual baths
were prepared with 50 mM of HgCl2, and nitrates of Ba, Ca, and Cu. The Ag foil was used as
substrate and CV was recorded for 0 to -3.0 V vs. SCE with the scan rate of 20 mV/sec. This
potential range was selected by considering the individual standard reduction potentials.
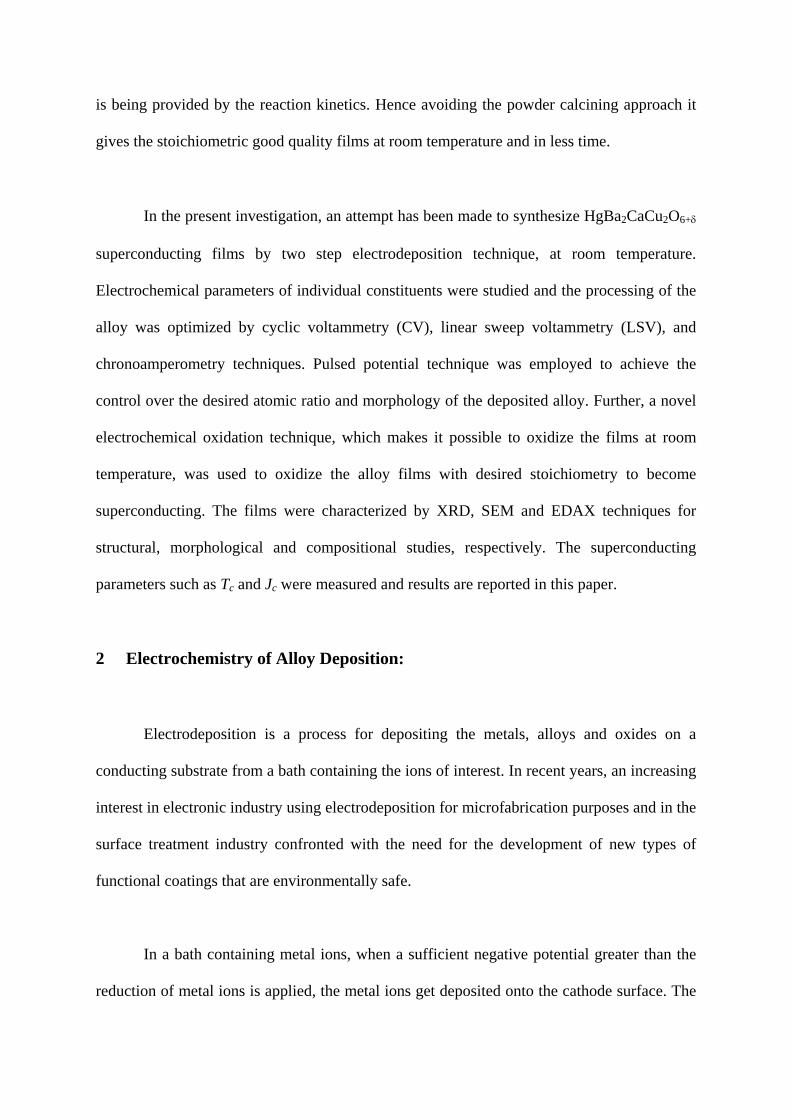
Figure 1 shows the CVs recorded onto Ag substrate for individual baths. The CV
recorded only for non-aqueous solvent (DMSO), showed no reduction or oxidation reactions
in the applied cathodic potential range. This might be due to its high dielectric constant [25]
and is sufficiently resistant to both oxidation and reduction, providing a fairly wide working
potential range.
In the CV recorded for HgCl2 bath, it is observed that the magnitude of current is
fairly larger than that for DMSO representing the ionic current, but the sudden increase in
current due to liberation of ions is not evidenced. Hence as it was expected to get Hg2+
reduction, it is bit difficult to determine cathodic potential where the Hg reduction takes place
by the following reaction,
Hg2+ + 2e- Hg
Or whether Hg does reduced or not? This was resolved by the early studies of
electrochemistry of mercury.
The mercury in chloride solution was observed to be reduced at positive potential,
particularly when calomel electrode was used in the electrochemical cell [22]. This implies
that some species other than Hg22+ were involved in the functioning of the reduction process.
Hill and Ives [26] in 1951 concluded that the main ionic entities in equilibrium with the
calomel electrode are chloride, chloromercurous ions (Hg2Cl+) and chloromercuric ions
(HgCl+). Some of these ions come into equilibrium and as a result so-called chloromercury is
formed which consists of monolayer of chlorine atoms covalently bound to the mercury
surface. Further, Erdey-Gruz and Volmer [27] have nucleated stable layer of liquid mercury
on metal surface by applying certain overpotential of –0.34 V vs. SHE for platinum and –0.21
V vs. SHE for carbon electrodes. At these overpotentials the reduction of Hg2+ occurs. Hence
in the present investigation the reduction of Hg2+ was expected. In the anodic path of CV any
reaction was not observed.
Further, Ba and Ca are found to be electrochemically reduced at individual potentials,
and the cyclic voltammogram is not reversible. Hence there is no possibility of any other
reaction.
The copper was found to reduce in two steps: Cu+ at early potential (-0.20 V vs. SCE)
and Cu2+ at the potential of –1.2 V vs. SCE, where the sigmoidal reduction peak was
observed. The CV is reversible and the oxidation peak is observed at -0.3 V vs. SCE.
Interpretation of CV for alloy/compound electrodeposition studies is often not
straightforward owing to the combined influence of a number of processes involving
adsorption, electrodeposition, and coupled chemical reactions.
In the present investigation, the electrolyte (DMSO) was not involved in the
electrochemical process and hence any non-significant multi-step reaction was not occurred.
However, Martin-Gonzalez et al. [28] while preparing YBCO and BSCCO thick films by

electrodeposition route from DMSO bath, observed the presence of characteristic bands of
dimethyl sulphoxide, water and carbonates in FTIR spectra. This is due to reduction of
DMSO at high deposition potential, -4.0 V vs. SCE, and was eliminated by heating the
deposited samples at 100 oC. In the present investigation, all the constituents reduced well
below -2.0 V vs. SCE. Hence it was ensured that DMSO is a suitable and stable solvent to
proceed with.
4.1.2 Linear Sweep Voltammetry (LSV )
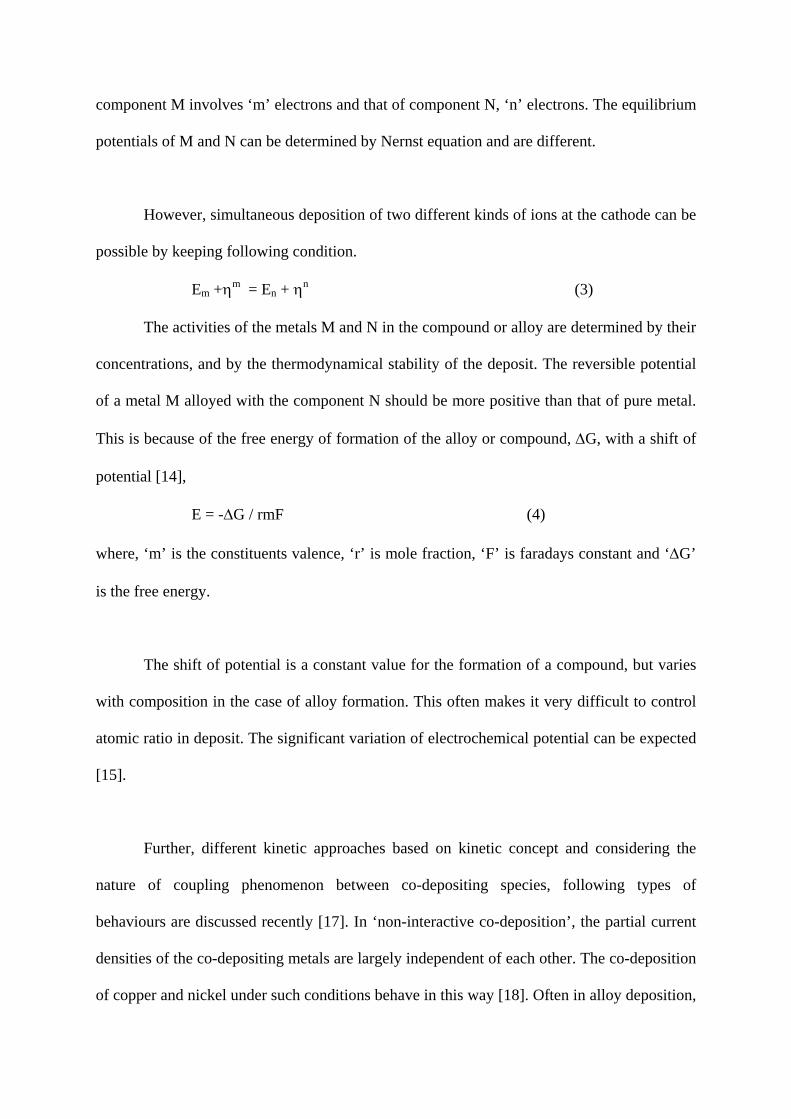
Figure 2 shows the LSV recorded for 50 mM HgCl2, and 50 mM nitrates of Ba, Ca,
Cu separately dissolved in DMSO. 7 ml of each of constituents was added to get the
combined bath of Hg-Ba-Ca-Cu system. The silver plate of suitable dimensions was used as
substrate. The same potential range, 0 to -3.0 V vs. SCE, and scan rate of 20 mV/sec was kept
during LSV measurements. From the figure 2 it can be seen that curves for bath containing
Ba and Ca shows the sudden increase in current after –1.7 V and –1.9 V vs. SCE,
respectively. Here, the initial flat region is due to electronic current and further sudden
increase in current is due to contribution of ionic current, after reduction of constituent
species. The potential at which the reduction starts is the equilibrium reduction potential or
deposition potential. The relation for the current density with applied scanning potential is
given by [29],
J = JiR (electronic current) + N Z u/V (ionic current) (5)
JiR is the iR compensating current due to the conductivity of electrolyte (bath) and electrodes.
After reduction of bath into the positive metal ions, the number of ions ‘N’ with valency ‘Z’
and velocity of ions ‘u’ increases with increase in applied scanning potentials and hence is
called the ionic current.
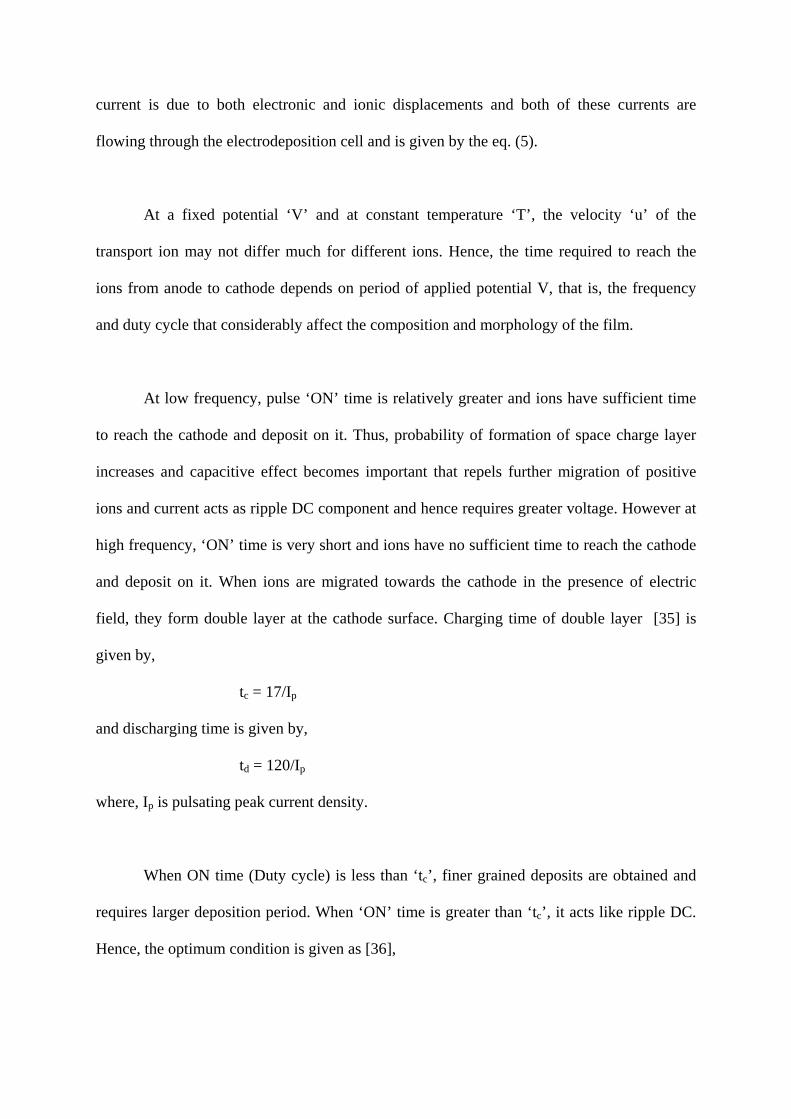
The LSV for Hg showed some current at zero potential indicating that the Hg2+
reduction starts at some positive potential range and current increases continuously in
cathodic potential range. The reduction of Cu2+ is observed at –1.2 V vs. SCE, and for
higher potentials, curve undergoes sigmoidal nature and current decreases. It can also be
noted in case of Cu that as it is a noble electro-reducting element, the magnitude of current is
much higher as compared to other constituents. These large numbers of ions when reached to
the working electrode, it could not be adsorbed and a double layer is developed between these
metal ions. These capacitive double layers cease the ionic motion and hence current
decreased.
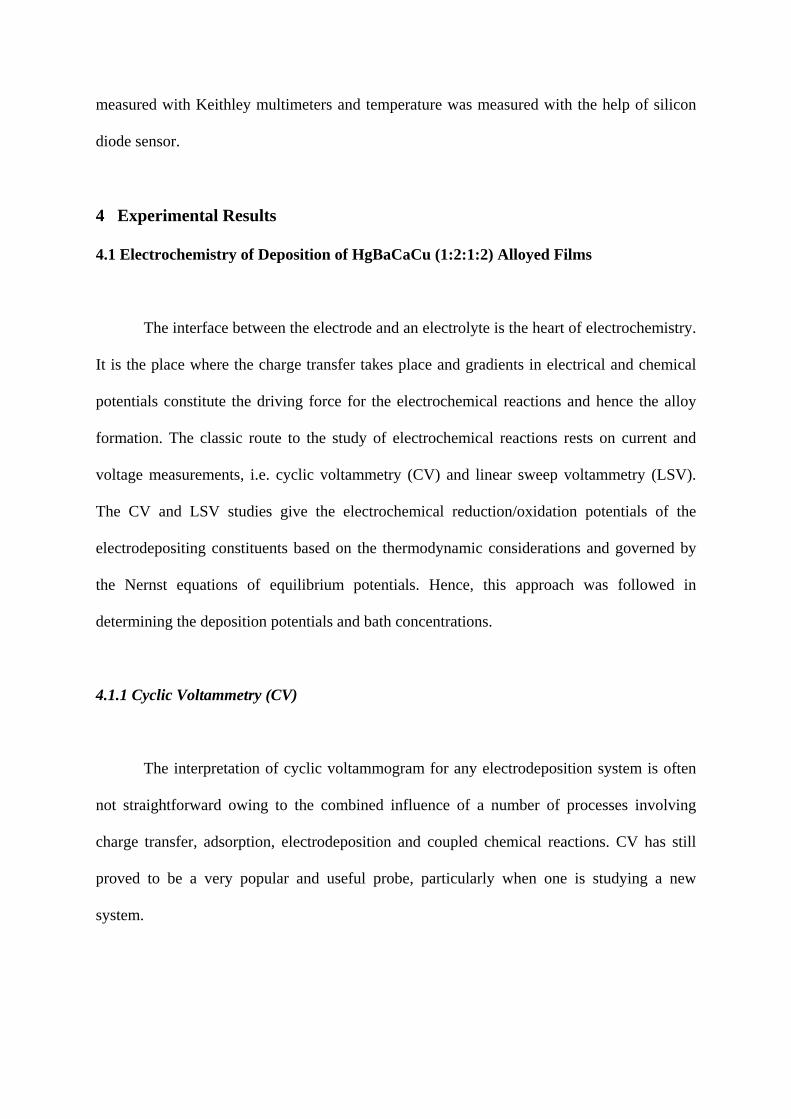
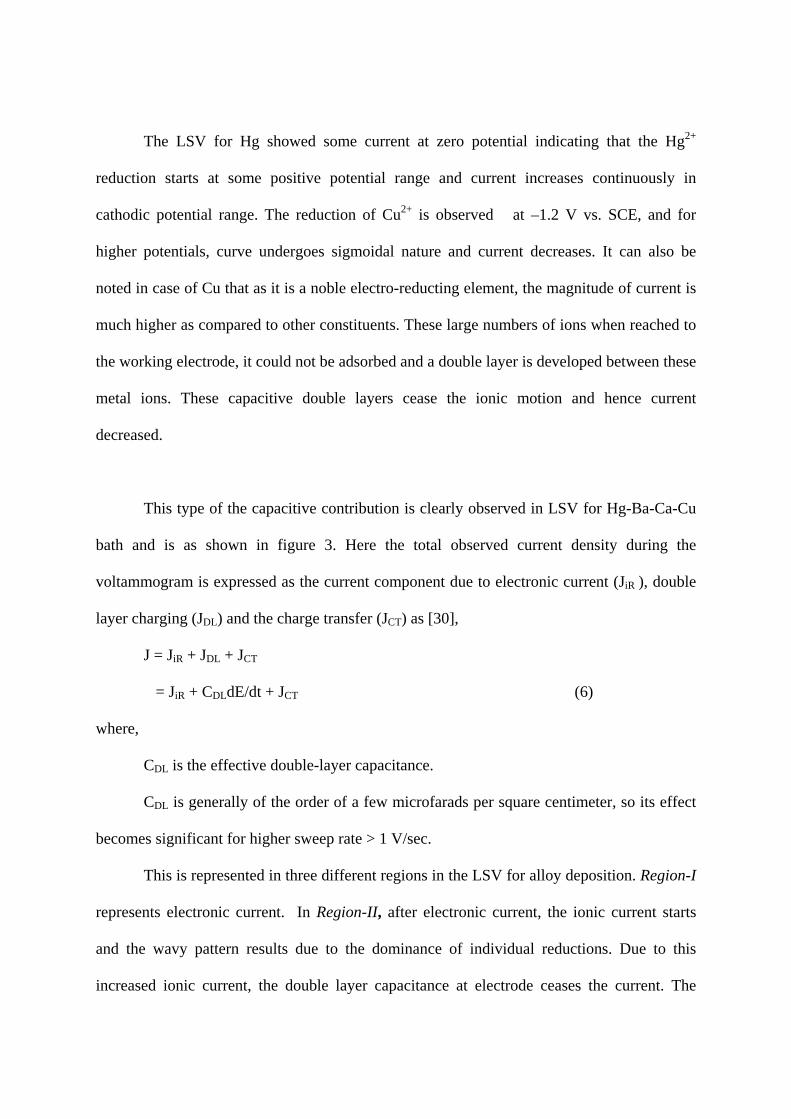
This type of the capacitive contribution is clearly observed in LSV for Hg-Ba-Ca-Cu
bath and is as shown in figure 3. Here the total observed current density during the
voltammogram is expressed as the current component due to electronic current (JiR ), double
layer charging (JDL) and the charge transfer (JCT) as [30],
J = JiR + JDL + JCT
= JiR + CDLdE/dt + JCT (6)
where,
CDL is the effective double-layer capacitance.
CDL is generally of the order of a few microfarads per square centimeter, so its effect
becomes significant for higher sweep rate > 1 V/sec.
This is represented in three different regions in the LSV for alloy deposition. Region-I
represents electronic current. In Region-II, after electronic current, the ionic current starts
and the wavy pattern results due to the dominance of individual reductions. Due to this
increased ionic current, the double layer capacitance at electrode ceases the current. The
individual deposition can best be obtained in this range. When the applied potential is
increased further, Region- III, after the reduction of last species, it overcomes the capacitive
barrier and current increases suddenly due to charge transfer mechanism.
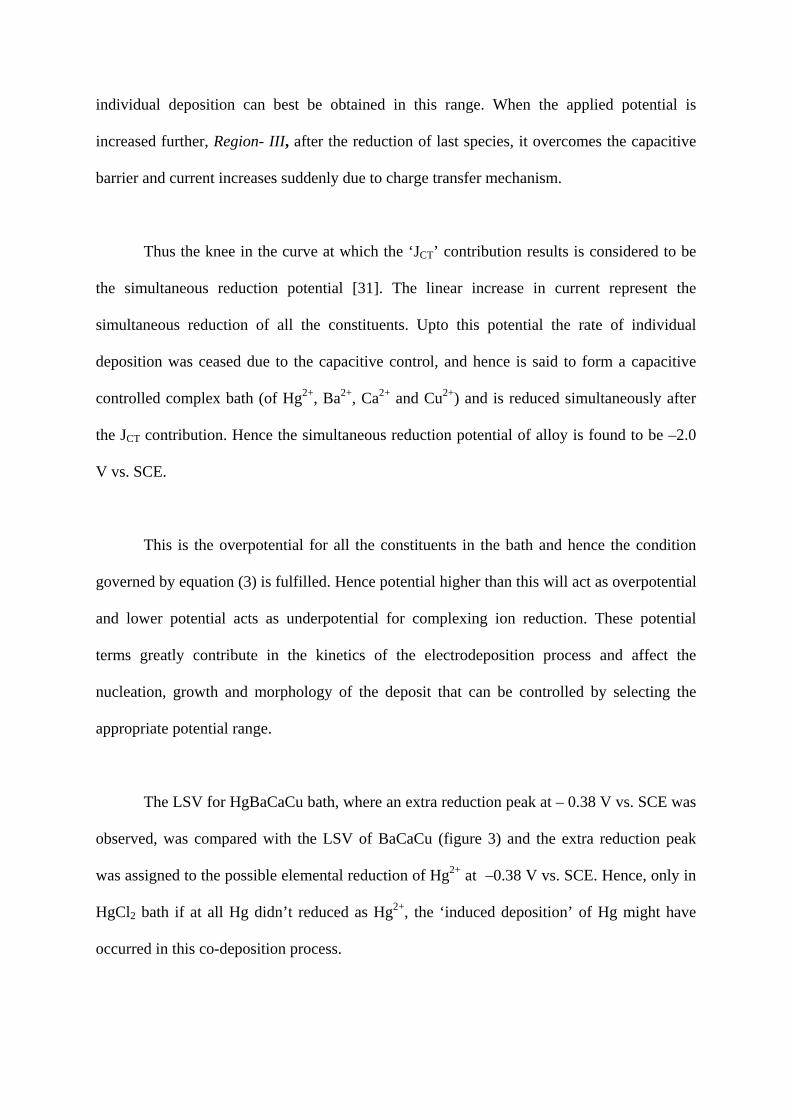
Thus the knee in the curve at which the ‘JCT’ contribution results is considered to be
the simultaneous reduction potential [31]. The linear increase in current represent the
simultaneous reduction of all the constituents. Upto this potential the rate of individual
deposition was ceased due to the capacitive control, and hence is said to form a capacitive
controlled complex bath (of Hg2+, Ba2+, Ca2+ and Cu2+) and is reduced simultaneously after
the JCT contribution. Hence the simultaneous reduction potential of alloy is found to be –2.0
V vs. SCE.
This is the overpotential for all the constituents in the bath and hence the condition
governed by equation (3) is fulfilled. Hence potential higher than this will act as overpotential
and lower potential acts as underpotential for complexing ion reduction. These potential
terms greatly contribute in the kinetics of the electrodeposition process and affect the
nucleation, growth and morphology of the deposit that can be controlled by selecting the
appropriate potential range.
The LSV for HgBaCaCu bath, where an extra reduction peak at – 0.38 V vs. SCE was
observed, was compared with the LSV of BaCaCu (figure 3) and the extra reduction peak
was assigned to the possible elemental reduction of Hg2+ at –0.38 V vs. SCE. Hence, only in
HgCl2 bath if at all Hg didn’t reduced as Hg2+, the ‘induced deposition’ of Hg might have
occurred in this co-deposition process.

The induced deposition of Ca on Hg was observed by Gmelin [32]. This induced
deposition would be possible due to the formation of well-known calcium amalgam where
Hg and Ca catalytically co-operate with each other. Accordingly, the electrolytic separation
of calcium from aqueous solution is possible only on mercury cathode by formation of
amalgam. The ‘Ca’ reduction is clearly observed in its LSV and hence ‘Hg’ reduction peak in
the HgBaCaCu bath could be due to ‘Ca’ assisted ‘Hg’ reduction. In the fabrication of
mercury-based superconductors, formation of the non significant CaHgO2 phase is observed
due to amalgamation during initial thermal treatments [13].
Hence peaks in the region-II (figure 3) are attributed to the individual reduction as
follows,
Hg2+ + 2e- → Hg (-0.39 V vs. SCE)
Ba2+ + 2e- → Ba (-1.30 V vs. SCE)
Ca2+ + 2e- → Ca (-1.61 V vs. SCE)
Cu2+ + 2e- → Cu (-0.66 V vs. SCE)
Cu+ + e- → Cu (-0.20 V vs. SCE)
4.1.3 Deposition of Alloy and EDAX Studies
It was finally decided to observe whether all species do deposit and, if so, what is the
quantity of individual constituents in the final deposit? For this purpose the deposition was
carried out at –2.0 V vs. SCE onto Ag substrate for 15 minutes. The film was dried at 100 oC
in oxygen flowing environment for 30 minutes.

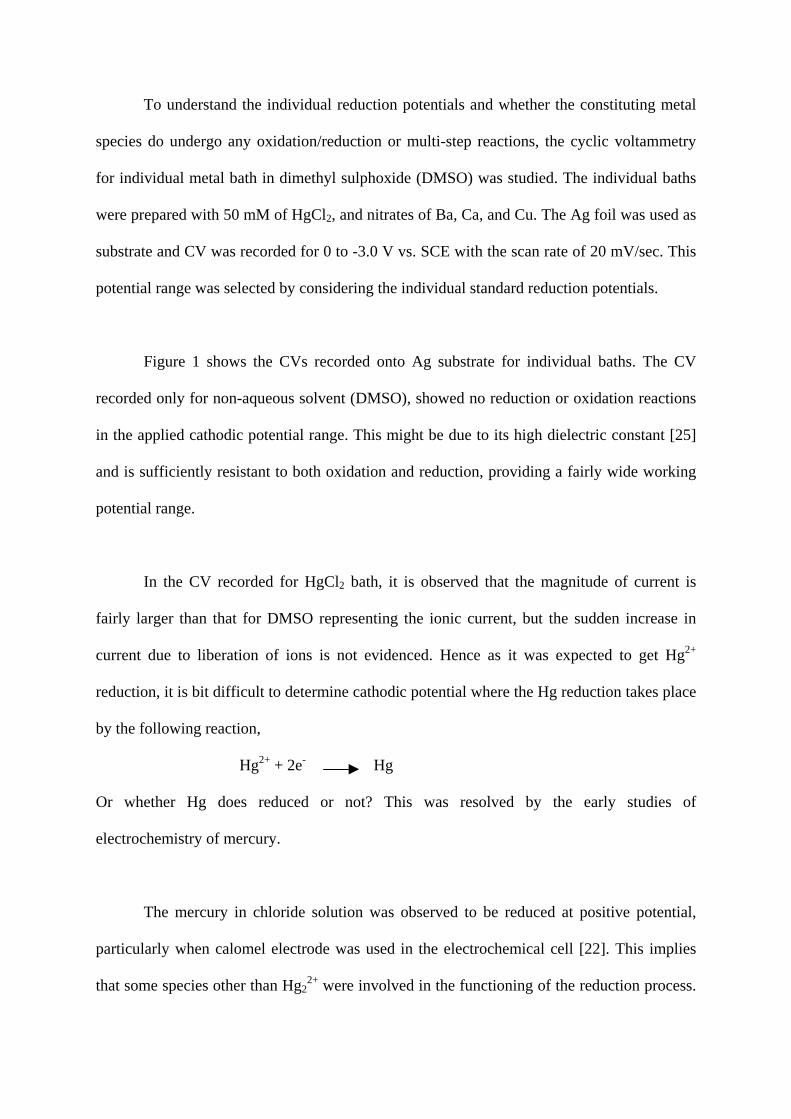
This film was then characterized by EDAX and is shown in figure 4. The
characteristic peaks corresponding to Hg, Ba, Ca, and Cu have been observed. This revealed
the successful reduction of all the required elements in the film and hence the co-deposition
has said to be occurred. The presence of oxygen species and silver from substrate are also
seen in the pattern. This is a big achievement for us towards the synthesis of Hg-Ba-Ca-CuO
superconductors at low temperatures.
4.1.4 Formation of Complexing Bath:
Considering the quantitative data from EDAX, individual deposition potentials and
empirical electrochemical laws, an attempt was made to select the individual concentrations
to get 1:2:1:2 atomic ratio. This was done with the help of LSV in view to form complexing
ion bath for the controlled reduction to achieve required stoichiometry. In this approach, the
bath concentrations were adjusted, nearby the required concentrations, such that the
individual reduction of any of the constituents will not be dominant in the JDL current range.
Rather, all the species must be simultaneously reduced after the potential, knee at the
beginning of region-III due to JCT. Hence many LSV’s were recorded by selecting different
bath concentrations nearby to the expected values, by trial and error method, and figure 5
shows LSV for one of the compositions 45 mM HgCl2, and 80 mM, 65 mM and 50 mM of
Ba, Ca and Cu nitrates respectively, for which the complexing reduction behaviour is
observed in LSV.
Upto this, an attempt has been made to study the electrochemical behaviour of the
constituents to develop the process at room temperature only. The complexing ion deposition
route is belived to be worked on the basis of capacitive controlled rate of deposition.

4.2 Pulse Electrodeposition of HgBaCaCu Alloyed Films
The films can be co-deposited by applying either constant potential or pulsed
potential. The pulsed potential deposition has many advantageous over d.c. plating technique
such as; the pulse current density is considerably higher than corresponding d.c. current
density which yields finer grained deposits, reduction in porosity, good control over
morphology and hence improvement in mechanical and physical properties [33]. The
morphology of electrodeposited materials is very important as far as superconducting
transport properties are concerned. Bhattacharya et al. [34] have deposited TBCCO films on
silver coated SrTiO3 substrate both by constant potential and pulsed potential condition and
found that pulse deposited films are very uniform. The critical current densities obtained are
5.6 x 10⁴ A/cm2 with Tc = 112 K for pulse deposited films whereas only 1 x 10⁴ A/cm2 with
Tc = 100 K was achieved for constant potential films.
Hence in the present investigation, it was decided to deposit the HgBaCaCu alloyed
films by applying pulsed potential. It is successfully demonstrated that the kinetics of the
electrochemical process can be monitored by applying the pulsed potential to the complexing
electrochemical bath and is presented in the following sections.
4.2.1 Optimization of Pulse Frequency and Duty Cycle
Figure 6 shows the variation of cathodic current density with different frequencies of
square wave pulse. For the frequencies, in the plateau region (20 Hz to 110 Hz), the cell
current is due to both electronic and ionic displacements and both of these currents are
flowing through the electrodeposition cell and is given by the eq. (5).
At a fixed potential ‘V’ and at constant temperature ‘T’, the velocity ‘u’ of the
transport ion may not differ much for different ions. Hence, the time required to reach the
ions from anode to cathode depends on period of applied potential V, that is, the frequency
and duty cycle that considerably affect the composition and morphology of the film.
At low frequency, pulse ‘ON’ time is relatively greater and ions have sufficient time
to reach the cathode and deposit on it. Thus, probability of formation of space charge layer
increases and capacitive effect becomes important that repels further migration of positive
ions and current acts as ripple DC component and hence requires greater voltage. However at
high frequency, ‘ON’ time is very short and ions have no sufficient time to reach the cathode
and deposit on it. When ions are migrated towards the cathode in the presence of electric
field, they form double layer at the cathode surface. Charging time of double layer [35] is
given by,
tc = 17/Ip
and discharging time is given by,
td = 120/Ip
where, Ip is pulsating peak current density.
When ON time (Duty cycle) is less than ‘tc’, finer grained deposits are obtained and
requires larger deposition period. When ‘ON’ time is greater than ‘tc’, it acts like ripple DC.
Hence, the optimum condition is given as [36],
Pulse ‘ON’ time < tc and Pulse ‘OFF’ time > td
Pawar et al. [37] have studied electrical properties of Bi-Sr-Ca-CuO superconducting
thin films deposited at 25 Hz and at different duty cycle, and found that the Tc varies with
duty cycle and was maximum for 50 % duty cycle. Hence, DC pulsating potential with 25 Hz
frequency and 50 % duty cycle was applied between the electrodes.
4.2.2 Deposition Potential and Current Density
Here the same three-electrode cell and the finally optimized bath was used and
potential was applied by pulse generator. The polarization curve was plotted to determine the
complex ion deposition potential for the deposition of HgBaCaCu alloy onto Ag substrate
and is shown in figure 7. It is seen that the complex ion reduction current increases at about –
1.7 V vs. SCE. This potential is less than that obtained by DC potential because of the fact
that due to ‘OFF’ time pulsating potential allows to discharge the double layer relatively in a
small time period and also the peak current density at peak potential is higher than
corresponding DC current.
The actual deposition potential was estimated by studying the deposition current
density (chronoamperometry) for different cell potentials. Figure 8 shows the deposition
current density recorded at the cell potentials of -1.8 V, -1.7 V and -1.6 V vs. SCE. From the
figure it is observed that deposition current density sharply decreases in first few seconds and
then remains steady. In pulse electrodeposition, during pulse ‘ON’ time the corresponding
peak current is higher than DC potential. Rapid fall of current is observed in first few seconds
and it is attributed to the formation of double layer between electrode-electrolyte interfaces,
which causes an increase in resistance. Whereas during pulse ‘OFF’ time these migrated

metal ions get sufficient time to deposit, and hence the nucleation process increases. Thus,
after few seconds the current density remains almost steady. In case of the deposition
potential of –1.8 V vs. SCE; however, the current density gradually increases rather than the
steady state value. This increase in current density results in the formation of non-uniform
and spongy deposit. In this type of current density, the further increase in current may be due
to the catalytic activities of any of the constituents or if concentration of any of the
constituents decreases then the current density of next electroactive species increases faster
and hence, over the period, the deposit ratio could not be ensured. If this is not the case and if
the stoichiometry remains, according to the kinetics of the nucleation, the nature of
nucleation may be instantaneous and three-dimensional deposition occurs [30].
The current density at –1.7 V vs. SCE is constant over the time representing the
steady flow of ions and this control may be due to the controlled pulsating current and
minimized interface double layer capacitance. According to the kinetics of the
electrodeposition governed by the Buttler-Volmer equations for the nucleation [38], this type
of current density nature results into progressive three-dimensional growth. Here current
density is relatively low and steady than at –1.8 V vs. SCE, this gives uniform, fine-grained
non-porous deposits. The same type of current density is observed at –1.6 V vs. SCE but due
to further decreased current density the granules size increases and also required longer time
for higher thickness.
Hence potential of –1.7 V vs. SCE was selected as the optimum deposition potential
for Hg-Ba-Ca-Cu alloy.
4.2.3 Thickness of Alloyed Film

Figure 9 shows the variation of thickness with deposition time for Hg-Ba-Ca-Cu film
deposited at –1.7 V vs. SCE. Films were dried at 100 oC for half hour to remove moisture and
DMSO in the deposit. It has been observed that the thickness increases linearly with time, as
there is steady flow of ions from anode to cathode. As the thickness increases with time, the
deposition continues either by build-up on previously deposited material i.e. on old
nucleation centers or the formation and growth of new ones takes place. However, after 30
minutes of deposition the films were found to be spongy and for further increase in
deposition period deposits peels off in the electrolyte. The optimum thickness of about 2 µm
was obtained for 20 min deposition.
4.2.4 Current Time Transient and Nucleation Growth
The chronoamperometry, the variation of current with time, was measured for the
complexing alloy bath at a potential of –2.0 V vs. SCE (see section 4.1.4) using the
VersaStat-II and is as shown in figure 10 (a).
To ascertain whether the nucleation process is instantaneous or progressive and what
is the structure of final growth, it is more convenient to represent the potentiostatic transients
in a dimensionless plot of (I/Imax)2 vs. (t/tmax), where Imax and tmax corresponds to the
maximum current density and the corresponding time in the transient. The relation between
(t/tmax) and (I/Imax)2 is given by [39],
(I/Imax )2 = 1.9542 (tmax/t) [ 1-exp{-1.2564(t/tmax)}]2 ---------Instantaneous
(I/Imax )2 = 1.2254(tmax/t) [ 1-exp{-2.3367(t/tmax)2}]2 --------- Progressive

The observed data is fitted with the theoretical plots for instantaneous and
progressive growth and is shown in figure 10 (b).
The figure 10 (b) shows that the obtained transient fits to the progressive growth. In a
current time transient, current before approaching the steady state value passes through a
single maximum and three dimension growth results.
Depending on the time span of this maxima and the steady state, recently, the
theoretical model is developed by M.Y. Abyanesh [40] and predicted the triangular and
hemispheroidal growth habits and are shown in figure 10 (c) for the representation. Our
experimental results (Figure 10 (b)) also show such current time transient suggesting the
three dimensional progressive growth occurs after steady state value leading to the growth of
hemispherical nuclei.
Figure 10 (d) shows the SEM (10000 x) where the hemispheroidal granules can be
seen. This current time transient model could help in predicting the possible growth habits
without looking at the microstructural measurements and hence growth could be in-situ
monitored by applying the suitable potential range and texture of the substrate.
Here, as the data is to collect within first few seconds the constant potential was
applied using VersaStat-II and electrochemistry software was used to take the real time
measurements.
4.3 Electrochemical Oxidation of HgBaCaCu Alloy

It is for the first time that the HgBaCaCu alloyed precursor films are fabricated in co-
deposition route at room temperature. In order to convert this material into superconducting
phase, HgBa2Ca1Cu2O6+δ, it is required to add oxygen crucially to maintain the oxygen
stoichiometry in the sample. The problem of volatile and toxic nature of mercury and
mercury oxide at high temperature oxidation is widely addressed earlier. Thus it was decided
to employ the novel electrochemical oxidation route that works at room temperature.
The conventional three-electrode system was used with HgBaCaCu precursor
deposited onto Ag as a working electrode. The alkaline 1 N KOH solution in double distilled
water was used as electrolyte bath to get oxygen species in anodic potentials. The figure 11
shows the LSV recorded both onto Ag and Ag/HgCaCaCu electrodes at the potential range of
0 to +1.0 V vs. SCE. For Ag, the peak at + 250 mV is seen which is assigned to the reaction,
KOH (aq) → K+ + OH-
Further broad peak at + 630 mV vs. SCE is assigned to the reaction at anode,
4OH- → O2↑ + 2H2O + 4e-
After some over potential, 700 mV, the current increases fast resulting in oxygen evaluation
at silver electrode.
The nature of LSV on Ag/HgBaCaCu alloy electrode is similar with some shifts in the
peaks in anodic range. This shift may be due to low conductivity of working electrode after
deposition of HgBaCaCu alloy.
From these observations it was decided to oxidize the alloyed HgBaCaCu films at
+0.7 V vs. SCE.
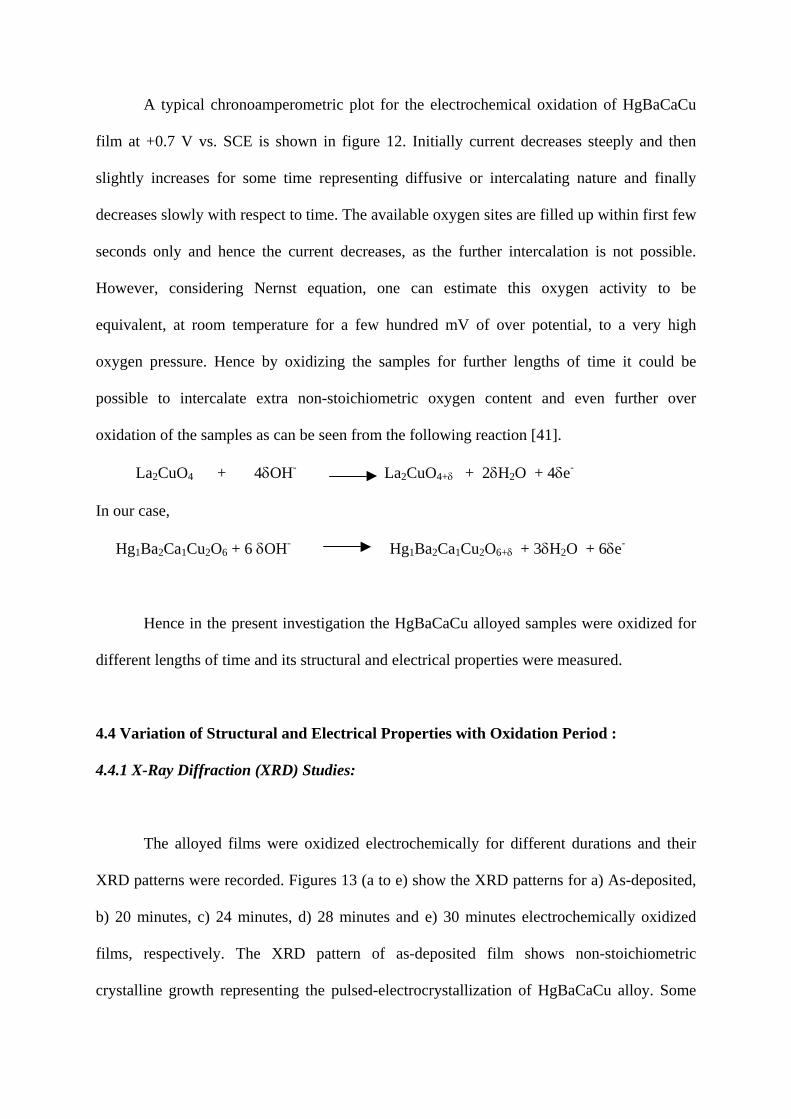
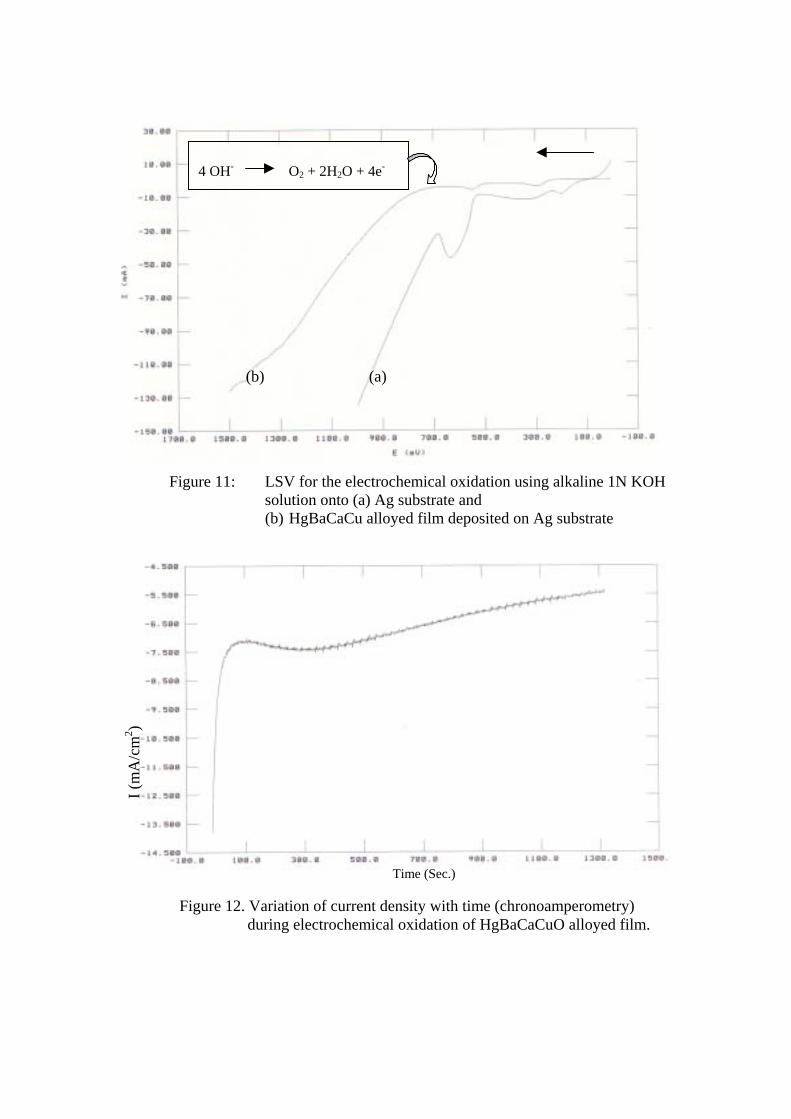
A typical chronoamperometric plot for the electrochemical oxidation of HgBaCaCu
film at +0.7 V vs. SCE is shown in figure 12. Initially current decreases steeply and then
slightly increases for some time representing diffusive or intercalating nature and finally
decreases slowly with respect to time. The available oxygen sites are filled up within first few
seconds only and hence the current decreases, as the further intercalation is not possible.
However, considering Nernst equation, one can estimate this oxygen activity to be
equivalent, at room temperature for a few hundred mV of over potential, to a very high
oxygen pressure. Hence by oxidizing the samples for further lengths of time it could be
possible to intercalate extra non-stoichiometric oxygen content and even further over
oxidation of the samples as can be seen from the following reaction [41].
La2CuO4 + 4δOH- La2CuO4+δ + 2δH2O + 4δe-
In our case,
Hg1Ba2Ca1Cu2O6 + 6 δOH- Hg1Ba2Ca1Cu2O6+δ + 3δH2O + 6δe-
Hence in the present investigation the HgBaCaCu alloyed samples were oxidized for
different lengths of time and its structural and electrical properties were measured.
4.4 Variation of Structural and Electrical Properties with Oxidation Period :
4.4.1 X-Ray Diffraction (XRD) Studies:
The alloyed films were oxidized electrochemically for different durations and their
XRD patterns were recorded. Figures 13 (a to e) show the XRD patterns for a) As-deposited,
b) 20 minutes, c) 24 minutes, d) 28 minutes and e) 30 minutes electrochemically oxidized
films, respectively. The XRD pattern of as-deposited film shows non-stoichiometric
crystalline growth representing the pulsed-electrocrystallization of HgBaCaCu alloy. Some

oxide phases are found to be developed which may be due to the exposure of the precursor to
the atmosphere. These are noted to be of CaHgO2 at 2θ = 18.2o and 32o [42-47]. The film
oxidized for 20 minutes shows the development of crystallization and indexed with tetragonal
indices with P4/mmm space group for Hg-1212 phase [48]. The film was polycrystalline in
nature with presence of (002), (003), (102), (004), (111), (005), (104), (114), (115), (200) and
(107) planes. It contains some impurity phase of CaHgO2. The lattice parameters were
calculated and are a = 3.872Å and c = 12.648 Å. These values do not matched adequately
with the standard values [49]. Hence another sample was further oxidized for 24 minutes and
it was observed that impurity phases are diminished and crystallinity is improved by further
oxygenation. This is estimated by measuring the lattice parameters. The films were further
oxidized for 28 minutes and XRD data showed the presence of single phase Hg-1212 with
improved crystallinity and lattice parameters are in agreement with standard values. The film
oxidized for 30-minute show presence of some oxide impurities. The Table 1 shows the
standard and calculated lattice parameters of these Hg-1212 films for different durations of
oxidation.
From the Table 1 it is seen that the lattice parameter a decreases with increase in
oxidation period. The variation of a and c with oxidation period is shown graphically in
Figure 14.
Variation in lattice parameters clearly indicates the intercalation of oxygen species.
The presence of impurity phases might be due to insufficient oxygen content, which then
converts into superconducting state after further oxygenation. The optimum oxidation period
of 28 min. was also confirmed by superconducting transition temperature reported in section
4.4.3.

4.4.2 Microstructural Studies:
Figure 15(a-d) shows the SEM of as-deposited, 20 minute, 24 minute, 28 minute and
30 minute oxidized films. It is seen that the films are uniform and dense. The as-deposited
films have circular hemispherical growth. In pulse plating, the pulsed current density remains
considerably higher with time, which leads to a higher population of adatoms on the surface
during pulse deposition resulting in an increased nucleation rate and therefore a uniform and
finer grained structure.
But the film oxidized for 20 minutes showed a noticeable change in surface
morphology. The granular structure with fine grain is observed. The grain growth and
compactness was improved for the films oxidized for 24 minutes and 28 minutes. When
oxygen is intercalated, due to the intercalating channels the granularity is developed and its
size was found to be increased for further oxidation periods. The improved grain size is
attributed to the intercalation of oxygen and homogenization of the identical phases in a
granular depending on the initial growth habits of the critical nucleii. The polycrystallinity
may be due to such a granular growth.
4.4.3 Temperature Dependence of Electrical Resistivity:
Figure 16 shows the variation of normalized electrical resistance of HgBaCaCuO
films electrochemically oxidized for different periods. The as-deposited film showed metallic
behaviour and do not became superconducting still up to 77 K. Upto 20 min. of
electrochemical oxidation the films were not found to be superconducting throughout the

temperature range of measurement. This is attributed to the underdoped state of the samples.
But the film oxidized for 20 minute turned superconducting at 87 K. Further, the films
oxidized for 24 minutes and 28 minutes showed increase in superconducting transition
temperature to be 97 K and 104.7 K, respectively. The film oxidized for 30 minutes showed
transition temperature Tc = 101 K, which is less than the films oxidized for 28 minutes. This
decreased Tc might be due to the over oxygen content of the sample. As the oxidation period
is increased the amount of extra non-stoichiometric oxygen content in HgOδ layer increases
which intern increase the hole concentration in CuO2 planes. The transition temperature is
found to be lower and transition widths are found to be broad. The onset superconducting
transition temperature shows the formation of HgBa2CaCu2O6+δ films.
4.4.4 Critical Current Densities (Jc):
The critical current densities, Jc, were recorded with the criteria of maximum current
(Ic) that can be passed to develop the potential gradient of 1µV/cm. The values recorded are
listed in Table 2. It is seen that as oxygen content increases Jc values increases representing
the complete stoichiometric oxidation of the samples. However, the values are lower
compared to the reports [43]. This may be due to the weak link behaviour at the grain
boundary.
5. Discussion
Here, in the electrochemical deposition of the films, according to the established
atomistic model [50], the applied potential allows the metal ions in liquid phase to transform
its phase to solid and adsorbs onto the substrate simply by following the reaction M2+ + 2e- →
M. Single atom or group of atoms constituting alloy/compound adsorbed on the active site
can be considered as a stable cluster which grows spontaneously and formally the active sites
itself plays the role of critical nucleii. In this case the thermodynamic work for the nucleus
formation equals zero and therefore only the kinetics determine the rate of phase formation
[51]. Here the overall reaction takes place on the atomic level and it reduces the time and
temperature that is otherwise required for the formation of cuprate superconductor by powder
calcining approach. Hence this principle was attempted to workout the process for
HgBaCaCuO formation at room temperature.
The kinetics of the nucleation and control over the morphology is achieved by
employing pulsed potential and allowing the double layer to discharge in a controlled way,
which results in the formation of smooth uniform films. The optimized process parameters
for the deposition of HgBaCaCu alloy films are,
! Electrochemical Bath : 45 mM HgCl2, 80 mM Ba(NO3)2, 65 mM
Ca(NO3)2.3H2O, 50 mM Cu(NO3)2.2H2O
in Dimethyl Suplhoxide (DMSO)
! Pulse Parameters: Frequency :- 25 Hz, Duty Cycle :- 50 %
! Deposition potential: -1.7 V vs. SCE
! Thickness: 2-3 micrometers
For 20 minutes it is 2 µm
The pulse frequency and duty cycle of pulsed potential was so optimized that after 5
minutes of deposition the films looks to be well covered with the substrate. The current
density was steady representing that ion flow from anode to cathode and hence the charge
transfer at electrode-electrolyte interface is uniform and hence the thickness increases

gradually with respect to time. Hence it is possible to obtain the desired HgBaCaCu alloyed
film with desired thickness by varying the length of deposition period.
The silver substrate is found to be suitable to provide the sufficient active sites for the
nucleation growth. But as the substrate itself is polycrystalline and there is a lattice mismatch
of 5.95% between Ag and Hg-1212 unit cell, the polycrystalline growth is observed.
However, by using the textured substrates i.e by depositing the silver thin layer onto oriented
LiAlO2 or SrTiO3, Bhattacharya et al. [52] achieved the c-axis oriented films of TBCCO with
Jc values greater than 105 A/cm2. Martin-Gonzalez et al. [53] have deposited the YBCO films
onto the non-textured silver foils and observed that the 30 micron thick film cracks when
heated to the 700 oC. However, in the present investigation we have not deposited the thick
films and did not heat-treated also and hence no cracks in the samples are seen.
The use of DMSO is found to be significant, otherwise in most of the studies, where
aqueous electrolyte used was found to develop the impurity phases. The reaction takes place
as,
Mz+ + xH2O + ze- → [M] + x H2O,
and when the electrolyte gets polarized the hydroxyl ions form,
M + 2OH → M(OH)2
and hence there is a formation of Ca(OH)2, Ba(OH)2, Cu(OH)2 [53] .
These can be heat treated (~ 600 oC) and converted to the respective oxides to form
the constituting superconducting films but it is difficult to control oxygen stoichiometry
besides the formation of impurity phases such as Cu2O, BaCuO2 etc. Mercury evaporation
takes place at such high temperatures. Otherwise it is a best method for the oxide formation.
Hence, in the present investigation, the controlled electrochemical oxidation of
alloyed film was carried by using alkaline KOH bath. The electrochemical intercalation of
oxygen into La2CuO4 using anhydrous organic electrolyte media of DMSO/0.1 M NaClO4 or
nBu4NBF4 with KO2 as oxygen source was used by Jacob et. al. [54], and the sample was
oxidized which show superconductivity at 42 K. But the duration needed (76 hrs) is large
and this long polarization time induces degradation and corrosion of materials due to
dissolution-precipitation process during the reaction.
But in our experiment the desired optimum oxygen content was achieved within 28
minutes at room temperature. This may vary with the bulk thickness.
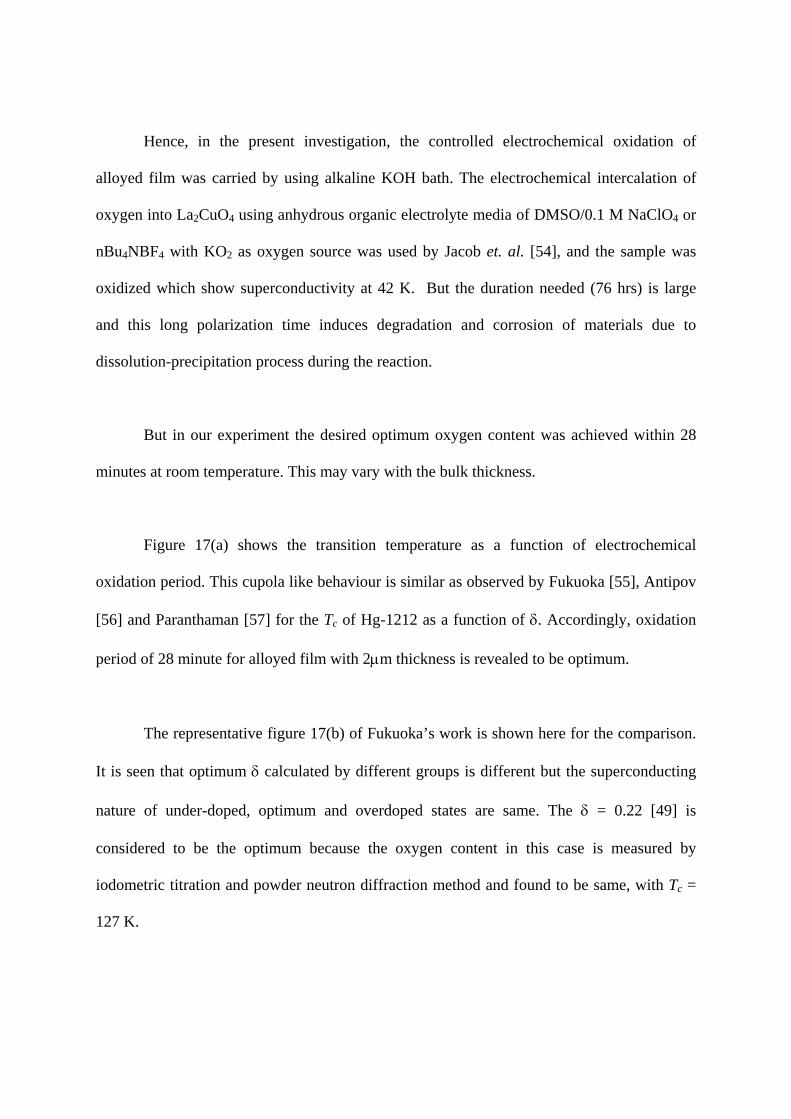
Figure 17(a) shows the transition temperature as a function of electrochemical
oxidation period. This cupola like behaviour is similar as observed by Fukuoka [55], Antipov
[56] and Paranthaman [57] for the Tc of Hg-1212 as a function of δ. Accordingly, oxidation
period of 28 minute for alloyed film with 2µm thickness is revealed to be optimum.
The representative figure 17(b) of Fukuoka’s work is shown here for the comparison.
It is seen that optimum δ calculated by different groups is different but the superconducting
nature of under-doped, optimum and overdoped states are same. The δ = 0.22 [49] is
considered to be the optimum because the oxygen content in this case is measured by
iodometric titration and powder neutron diffraction method and found to be same, with Tc =
127 K.
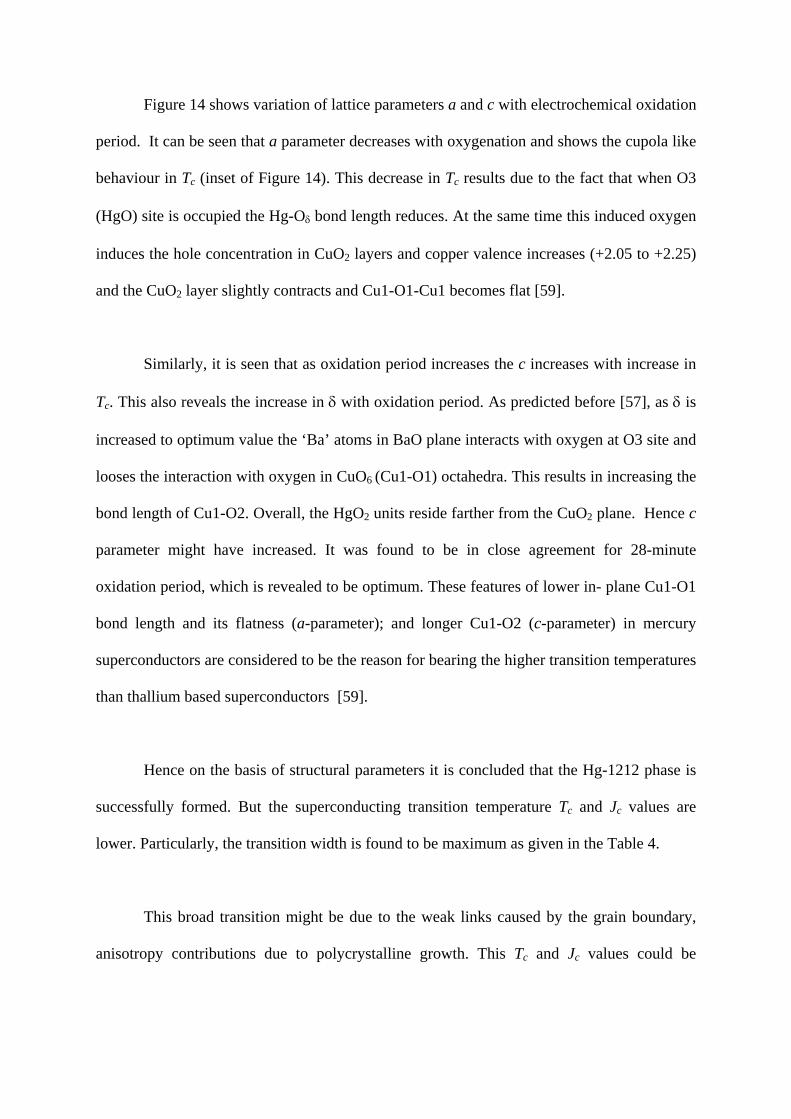
Figure 14 shows variation of lattice parameters a and c with electrochemical oxidation
period. It can be seen that a parameter decreases with oxygenation and shows the cupola like
behaviour in Tc (inset of Figure 14). This decrease in Tc results due to the fact that when O3
(HgO) site is occupied the Hg-Oδ bond length reduces. At the same time this induced oxygen
induces the hole concentration in CuO2 layers and copper valence increases (+2.05 to +2.25)
and the CuO2 layer slightly contracts and Cu1-O1-Cu1 becomes flat [59].
Similarly, it is seen that as oxidation period increases the c increases with increase in
Tc. This also reveals the increase in δ with oxidation period. As predicted before [57], as δ is
increased to optimum value the ‘Ba’ atoms in BaO plane interacts with oxygen at O3 site and
looses the interaction with oxygen in CuO6 (Cu1-O1) octahedra. This results in increasing the
bond length of Cu1-O2. Overall, the HgO2 units reside farther from the CuO2 plane. Hence c
parameter might have increased. It was found to be in close agreement for 28-minute
oxidation period, which is revealed to be optimum. These features of lower in- plane Cu1-O1
bond length and its flatness (a-parameter); and longer Cu1-O2 (c-parameter) in mercury
superconductors are considered to be the reason for bearing the higher transition temperatures
than thallium based superconductors [59].
Hence on the basis of structural parameters it is concluded that the Hg-1212 phase is
successfully formed. But the superconducting transition temperature Tc and Jc values are
lower. Particularly, the transition width is found to be maximum as given in the Table 4.
This broad transition might be due to the weak links caused by the grain boundary,
anisotropy contributions due to polycrystalline growth. This Tc and Jc values could be

improved by controlled heat treatments below the decomposition of mercury and mercury
oxides.
6. Conclusions
It is concluded that the complexing ion simultaneous deposition of HgBaCaCu films
have been successfully carried out by pulse electrodeposition techniques at room temperature.
The deposition potential of –1.7 V vs. SCE was the over potential for the reduction of all
individual constituents, those deposits simultaneously and atomic ratio (Hg-1212) is
monitored by controlling the concentrations of constituents in the bath.
The room temperature electrochemical oxidation route is proved to be a novel
technique to intercalate oxygen species into the lattice of these alloyed films where oxygen
content can be monitored by varying the period of oxygenation and is revealed by the
variation of Tc ranging from 87 – 104.7 K and Jc from 830 - 1780 A/cm2.
In pulse electrosynthesis technique, the reaction takes place on atomic scale and it
reduces temperature and time of the process. As it avoids the high temperature processing, it
prevents from inhalation of toxic mercury oxide vapors those are harmful to human being.
Hence, this is environmental friendly and economical method for synthesis of
superconducting thin films with required stoichiometry. None of the other processes could
fabricate the Hg based superconducting films at room temperatures.
Acknowledgements
Authors wish to thank the University Grants Commission, New Delhi (India), for
financial support under superconductivity R & D Project and Dr. A.V. Narlikar for his

constant encouragement. One of the authors, DDS, thanks Council of Scientific and Industrial
Research (CSIR), New Delhi for the award of Senior Research Fellowship.
References :
[1] Schilling, M. Cantoni, J. D. Gao and H. R. Ott, Nature, 363 (1993) 56.
[2] C. W. Chu, L. Gao, F. Chen, Z. J. Huang, R. L. Meng and Y.Y. Xue, Nature, 365 (1993) 323.
[3] S. N. Putilin, E. V. Antipov, O. Chmaissem and M. Marezio, Nature, 362
(1993) 226.
[4] A. Fukuoka, A. Tokiwa - Yamamoto et. al., Physics C, 265 (1996) 13.
[5] A. Tokiwa - Yamamoto, S. Adachi, K. Isawa et. al., Advances in Superconductivity, VI /Proc.
ISS' 93 ( Oct 26 - 29, 1993 Hiroshima, Japan) eds. T. Fujita, Y. Shiohara ( Springer - Verlag
Tokyo 1994) P 247.
[6] K. Isawa, A. Tokiwa - Yamamoto, M. Itoh et. al. Physica C, 222 ( 1994) 33.
[7] R. Usami, S. Adachi, M. Itoh, et. al. Physica C, 262 (1996) 21.
[8] A. Tokiwa - Yamamoto, A. Fukuoka, M. Itoh, S. Adachi, H. Yamauchi and K. Tanabe, Physica
C, 269 (1996) 354.
[9] A. Fukuoko, A. Tokiwa - Yamamoto, M. Itoh et. al. Phys, Rev. B 55 (1997) 6612.
[10] L. Krasin - Elbaum, C. C. Tsuei, A. Gupta, Nature, 373 (1995) 679.
[11] A. Gupta, J. Z. Sun, C. C. Tsuei, Science, 265 (1994) 1075.
[12] A. Schilling, O. Jeandupeux, J. D. Gao, and H. R. Ott, Physica C 216 ( 1993) 6.
[13] R. L. Meng, L. Beauvais, X. N. Zhang et. al., Physica C, 216 (1993) 21.
[14] E. B. Budevski, Comprehensive Treaties of Electrochemistry, Edrs. B. E. Canway, J. O. M.
Bockri's, U. M. Khan, R. E. White, 7 (1983) 399.
[15] K.M. Gorbunova, Y. M. Polukarov, in "Advances in Electrochemistry of Electrochemical
Engg. 5 (1967)249.
[16] A. Brenner, in "Electrodeposition of alloys 1-2 ( Academic Press, N. Y. (1963).
[17] D. Londolt, Electrochim Acta, 39 (1994) 1075.

[18] E. J. Podlaha, and D. Londolt, J. Electrochemical Soc. 143 (1996) 885.
[19] R. D. Madhale, Ph. D. Thesis, Shivaji University, Kolhapur 1987.
[20] M. H. Pendse and S. H. Pawar, Mater. Res. Bull. 26 (1990) 641.
[21] S. H. Pawar, B. M. Todkar, H. A. Mujawar, and M. H. Pendse, Mater. Res. Bull. 25 ( 1990)
503.
[22] N. V. Desai, L. A. Ekal, D. D. Shivagan and S. H. Pawar, Bull. Mater. Sci. 23 (2000) 51.
[23] L. A. Ekal, D. D. Shivagan, P. M. Shirage, N. V. Desai, S. B. Mane and S. H. Pawar, Thin
Solid Films, 397 (2001)249.
[24] S. H. Pawar, P. M. Shirage, and D. D. Shivagan, Sup. Sci. Tech. 15 (2002) 1547.
[25] J. N. Butler, J. Electroanal Chem. 14 (1967)89.
[26] G. J. Hills and D. J. G. Ives, Nature 165(1950)530.
[27] Erdey - Gruz and Volmer, J. Chem. Soc. ( 1951) 319.
[28] M. S. Martin - Goz Nalez, J. Garcia - Jaca, E. Moran and M. A. Alario - Franco, J. Mater.
Chem. 9 (1999) 137.
[29] S. H. Pawar and V. N. Shinde in " Studies of High Temperature Superconductors" Eds. Anant
Narlikar, Nova Science Publishers, N. Y. 13 (1994) 278.
[30] R. K. Pandey, S. N. Sahu and S. Chandra, in " Handbook of Semiconductor
Electrodeposition" Marcel and Dekker Inc. N. Y. (1996) 131.
[31] R. D. Engelken, T. P. Van Doress, J. Electrochem. Soc, 132:2910.
[32] Gmelin's Handbuchder, Anorgarischen Chem. 121 (1926) 121.
[33] S. Ray and D. Landolt, J. Applied Electrochem., 27 (3) (1997) 299.
[34] R. N. Bhattacharya, R. D. Blaugher in Thallium Based High - Temperature Superconductors
Eds. A. M. Hermann, J. V. Yakhami Marcel Dekker Inc. (1994) 279.
[35] J. Puippee, AESF - III, Pulse Plating Symposium, Washington, 1986.
[36] L. G. Holmbon, B. E. Jacobson, Plating and Surface finish 71 (1987) 74.
[37] V. N. Shinde and S. H. Pawar, Ind. J. Cryogenics, 18 (1993) 91.
[38] R. Kaischew, and E. Budevski, Contemp. Phys 8 (1967) 489.
[39] M. Fleischmann, H. R. Thirsk, Trans Faraday Soc. 51 ( 1955) 71.

[40] M. Y. Abyaneh, J. Electrochemical Chemistry, 530 (2002) 82.
[41] A. Wattiaux, J. C. Park, J. C. Grenier and M. Pouchard, C. R. Acad. Sci. Paris 310 (1990)
1047.
[42] G. B. Peacock, A. Fletcher, I. Gameson, P. P. Edwards, Physica C, 301 (1998) 1.
[43] K. Kellner, K. Przybylski, G. Gritzner, Physica C, 307 (1998) 99.
[44] P. V. P. S. S. Sastry, K. M. Amm, D. C. Knoll, S. C. Peterson and J. Schwartz, Physica C 300
(1998) 125.
[45] E. Kuzmann, M. Mair and G. Gritzner, Physica C, 312 (1999) 45.
[46] G. B. Peacock, S. K. Haydon, A. J. Ellis, I. Gameson and P. P. Edwards Sup. Sci. Tech. 13
(2000) 412.
[47] K. A. Lokshin, D. A. Pavlov, M. L. Kovba, S. N. Putilin, E. V. Antipov, I. Bryntse, Physica C
366 (2002) 263.
[48] JCPDS Card No. 82 - 166.
[49] Q. Huang, J. W. Lynn, R. L. Meng, and C. W. Chu, Physica C, 218 (1993) 356.
[50] D. M. Kolb, Surface Science 500 ( 2002)722.
[51] Alexander Milchev, Contemporary Physics 32 (1991) 321.
[52] R. N. Bhattacharya, R. D. Blaugher, Z. F. Ken, W. Li. J. H. Wang, M. Paranthaman, D. T.
Verebelyi and D. K. Christen, Physica C, 229 (1994) 244.
[53] S. Marisol Martin - Gonzalez, Javier Garcia Jaea, Emilio Morun and Misuel A Alario –
Franco. J. Mater. Chem. 9 (1999) 1293.
[54] A. Lin Jacob, David Barbut, Alaim Wattiaux, Marie - Helene Delville, Jeass - Claude
Grenier, Michele Pouchard and Jeass Etourneau, J. Mater. Chem. 10 (2000) 829.
[55] A. Fukuoka, A. Tokiwa - Yamamoto, M. Itoh, R. Usami, S. Adachi, Y. Yamamuchi and K.
Tanabe, Physica C, 265 (1996) 13.
[56] E. V. Antipov, J. J. Copponi, C. Chaillant, O. Chmaissem, S. M. Loureirv, M. Marezio, S. N.
Putilin, A. Santoro and J. L. Tholence, Physica C 218 ( 1993) 348.
[57] M. Paranthaman and B. C. Chakoumakos, J. Solid State Chemistry, 122 (1996) 221.
[58] S. N. Putilin, E. V. Antipov, and M. Marezio, Physica C 212 ( 1993) 266.

[59] P. G. Radaelli, J. L. Wagner, B. A. Hunter, M. A. Beno, G. S. Knapp, J. D. Jorgensen and D.
G. Hinks Physica C 216 (1993) 29.
[60] I Bryntse and A. Kareiva, Physica C 251 ( 1995) 115.

Figure Captions
Figure 1 Cyclic Voltammetry curves for (a) DMSO solvent and 50 mM solutions of (b) HgCl2, (c) Ba(NO3)2, (d) Ca(NO3)2.2H2O and (e) Cu(NO3)2.3H2O into
DMSO
Figure 2 Linear Sweep Voltammetry (LSV) for 50 mM solutions of(a) HgCl2, (b) Ba(NO3)2, (c) Ca(NO3)2.2H2O,(d) Cu(NO3)2.3H2O and (e) Combined HgBaCaCu bath into DMSO on Agsubstrate
Figure 3 LSV for the bath of 50 mM concentrations of Hg, Ba, Ca and Cu constituentstogether.
Figure 4 EDAX pattern for the HgBaCaCu film deposited from 50 mM bathconcentrations of each constituents.
Figure 5 LSV for the bath containing 45 mM HgCl2 and 80 mM, 65 mM and 50 mM ofBa, Ca and Cu nitrates, respectively, forming a complexing bath in DMSO.
Figure 6 Variation of cathodic current density with pulse frequency
Figure 7 Polarization curve for the HgBaCaCu alloy deposition
Figure 8 Variation of cathodic current density with deposition time during deposition ofHg-Ba-Ca-Cu alloyed film for different potentials with SCE electrode
Figure 9 Variation of thickness with deposition time of the Hg-Ba-Ca-Cu alloyed films
Figure 10 (a) Chronoamperometry curve for the deposition of HgBaCaCu onto Ag substrate
(b) The fitting of observed transient with theoretical curves ofinstantaneous and progressive growths.
(c) The theoretically predicted 1) triangular and 2) hemispherical nucleation growth.(d) SEM of the HgBaCaCuO film.
Figure 11 LSV for the electrochemical oxidation using alkaline 1N KOH solution onto(a) Ag substrate and(b) HgBaCaCu alloyed film deposited on Ag substrate
Figure 12 Variation of current density with time (chronoamperometry) duringelectrochemical oxidation of HgBaCaCuO alloyed film

Figure 13 The X-ray diffraction pattern for (a) as-deposited HgBaCaCu alloyed film and(c) 20 min.; (c) 24 min.; (d) 28 min.; and (e) 30 min. electrochemicallyoxidized films
Figure 14 Variation of a and c parameter with oxidation period.
Figure 15 Scanning electron micrographs for(a) as-deposited HgBaCaCu alloyed film and electrochemically oxidized filmsfor (b) 20 min.; (c) 24 min.; (d) 28 min.; and (e) 30 min.
Figure 16 Temperature dependence of normalized resistance of the Hg-Ba-Ca-CuO(Hg-1212) films electrochemically oxidized for different periods
Figure 17 (a) Transition temperatures achieved for the films oxidized for different electrochemical oxidation periods.(b) Variation in Tc with δ as observed by Fukuoka [55].

Tables
Table 1. The standard and calculated lattice parameters of the Hg-1212 films.
Oxidation period→
Lattice parameters↓
Standard
[49]
20 min. 24 min 28 min 30 min
a (Å) 3.8580 3.872 3.867 3.8576 3.8559
c (Å) 12.6811 12.648 12.650 12.658 12.663
Table 2. Jc values of the Hg-1212 films electrochemically oxidized for different durations.
Oxidation period (min.)
JcA/cm2
20 83024 112028 143730 1780
Table 3. The structural parameter, extra oxygen content δ and Tc for some HgBa2CaCu2O6+δsamples
REF. a(Å)
c(Å)
Tc(K)
δ Cu-O1(Å)
Cu-O2(Å)
58 3.85766 12.6562 120 0.265 1.936 2.753
57 3.8570 12.6923 122 0.33 1.9285 2.81
56 3.8543 12.6416 123 0.28 1.9272 2.7986
59 3.8601 12.7030 126 0.21 1.9301 2.825
60 3.8580 12.681 127 0.22 1.9290 2.801
Table 4. Variation in transition width with electrochemical oxidation period.
Oxidation period(min.)
Tconset
(K)Tc
0
(K)Transition width
(K)
20 107 87 20
24 110 98 12
28 114 104.7 9.3
30 114 101 13

Figure 1 Cyclic Voltammetry curves for (a) DMSO solvent and 50 mM solutions of (b)HgCl2, (c) Ba(NO3)2, (d) Ca(NO3)2.2H2O and(e) Cu(NO3)2.3H2O into DMSO
DMSO
Cu
HgCaBa
I (m
A)
E (V)

E (V)
Figure 2 Linear Sweep Voltammetry (LSV) for 50 mM solutions of(e) HgCl2, (b) Ba(NO3)2, (c) Ca(NO3)2.2H2O,(d) Cu(NO3)2.3H2O and (e) Combined HgBaCaCu bath into DMSO on Agsubstrate
Cu+
Cu2+
Hg2+ Ba2+Ca2+
Ba2+
Hg2+Cu2+
I (m
A)
(a)
(b)
(c)
(d) (e)
Ca2+
Electronic Current Ionic Current

Figure 3. LSV for the bath of 50 mM concentrations of Hg, Ba, Ca and Cu constituents together.
Cu2+ Ba2+ Ca2+
Region-I Region-II Region-III
Hg2+

Figure 4 : EDAX pattern for the HgBaCaCu film deposited from 50 mM bathconcentrations of each constituents.

Figure 5 LSV for the bath containing 45 mM HgCl2 and 80 mM, 65 mM and 50mM of Ba, Ca and Cu nitrates, respectively, forming a complexingbath in DMSO.

Figure 4.6 Variation of cathodic current density with pulse frequency
20
24
28
0 20 40 60 80 100 120
Pulse frequency (Hz)
Cur
rent
Den
sity
(mA
/cm2 )
Figure 4.7 Polarization curve for the HgBaCaCu alloy deposition
0
4
8
12
16
20
-2.5-2-1.5-1-0.50Applied Voltage V vs SCE
Cur
rent
den
sity
(mA
/cm2 )
Figure 6 Variation of cathodic current density with pulse frequency
Figure 7 Polarization curve for the HgBaCaCu alloy deposition

Figure 8 Variation of cathodic current density with deposition time during depostion of Hg-Ba-Ca-Cu alloyed film for different potentials with SCE
electrode.
0
3
6
9
12
15
18
0 400 800 1200 1600
Deposition time (sec)
Cur
rent
den
sity
(mA
/cm2 )
-1.6 V-1.7 V
-1.8 V
Figure 9. Variation of thickness with deposition time of the Hg-Ba-Ca-Cu alloyed films
0
1
2
3
4
0 10 20 30Time ( min.)
Thic
knes
s in
mic
ron

Figure 10 (b). The fitting of observed transient with theoretical curves of instantaneous and progressive growths.
Time (seconds)
Figure 10 (a) Chronoamperometry curve for the deposition of HgBaCaCu onto Ag substrate
Cur
rent
(mA
/cm
2 )
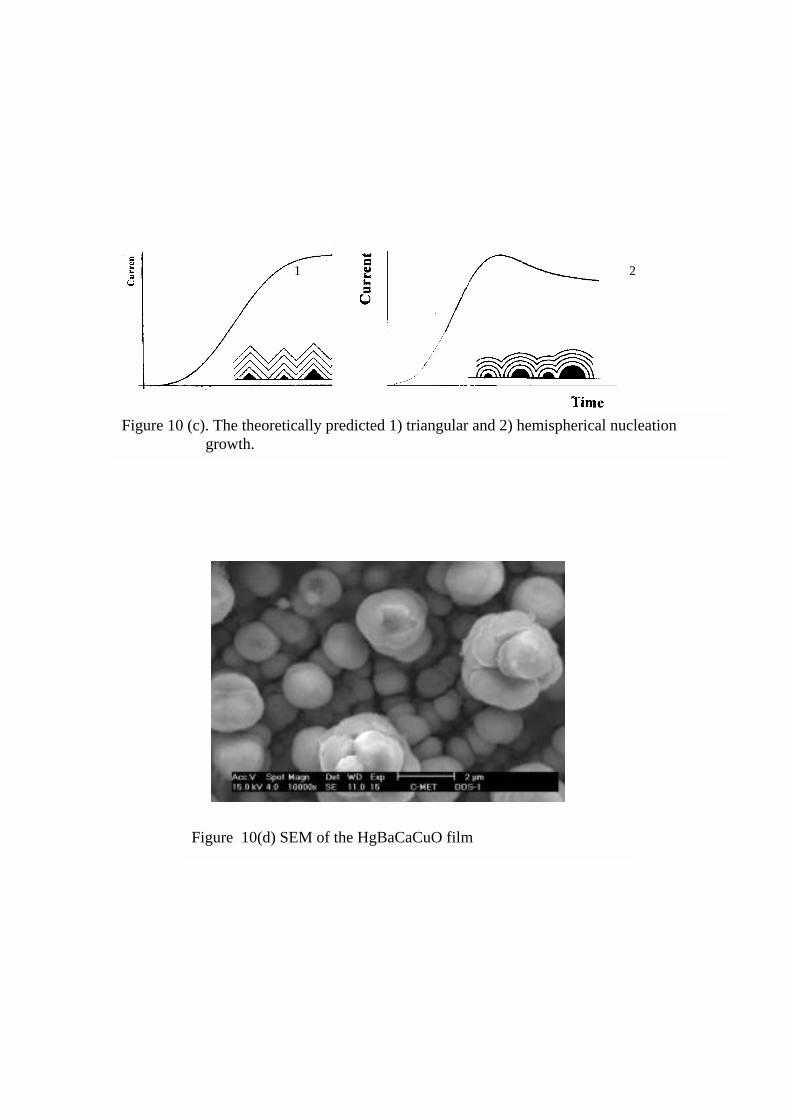
Figure 10(d) SEM of the HgBaCaCuO film
Figure 10 (c). The theoretically predicted 1) triangular and 2) hemispherical nucleation growth.
1 2
Time (Sec.)
Figure 12. Variation of current density with time (chronoamperometry) during electrochemical oxidation of HgBaCaCuO alloyed film.
I (m
A/c
m2 )
4 OH- O2 + 2H2O + 4e-
(a)(b)
Figure 11: LSV for the electrochemical oxidation using alkaline 1N KOHsolution onto (a) Ag substrate and(b) HgBaCaCu alloyed film deposited on Ag substrate

(002
)
(
003)
(10
1)
(102
)
(004
)
(1
10)
(005
)
(104
) Ag
(114
), A
g
(2
00)
(2
11)
(0
08)
(2
14)
Ag
A
g
Inte
nsity
(a.u
.)
(b)
Inte
nsity
(a.u
.)
(a)

(0
02)
(0
03)
(1
01)
(0
04)
(1
03)
(
005)
(1
04) A
g
(1
14),
Ag
(20
0), (
115)
(211
)
(0
08),
(107
)
(21
4) A
g
Ag
(214
)Inte
nsity
(a.u
.)
(c )
(111
)
(0
02)
(
003)
(102
)
(004
)
(1
11)
(0
05)
(104
) Ag
(114
), A
g
(2
00),
(115
)
(2
11)
(0
08),
(107
)
(2
14)
Ag
(1
18)
Ag
(2
14)
Inte
nsity
(a.u
.)
(d)
(205
)
(206
)
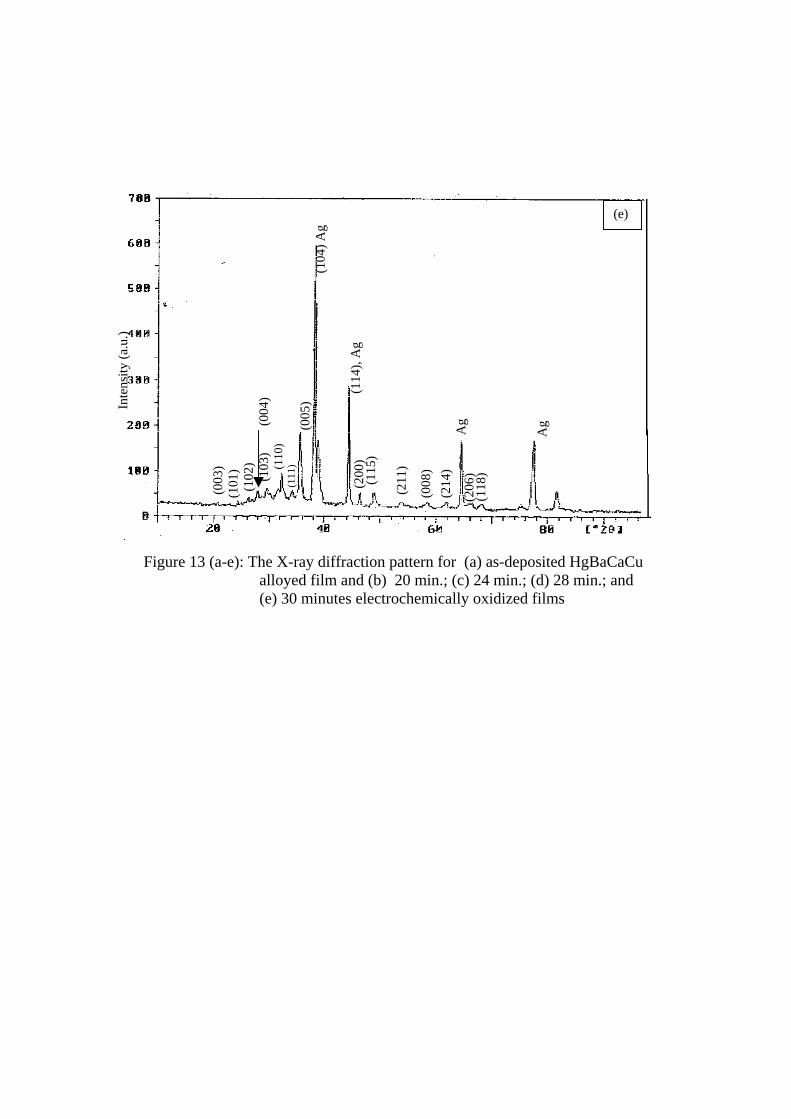
Figure 13 (a-e): The X-ray diffraction pattern for (a) as-deposited HgBaCaCu alloyed film and (b) 20 min.; (c) 24 min.; (d) 28 min.; and (e) 30 minutes electrochemically oxidized films
(0
03)
(1
01)
(
102)
(10
3)
(
004)
(110
)
(
111)
(0
05)
(10
4) A
g
(1
14),
Ag
(115
)
(2
11)
(0
08)
(2
14)
A
g (
118)
Ag
Inte
nsity
(a.u
.)
(2
00)
(206
)
(e)

Figure 14 Variation of a and c parameter with oxidation period
3.852
3.856
3.86
3.864
3.868
3.872
3.876
18 20 22 24 26 28 30 32
Oxidation Period ( minutes)
a- p
aram
eter
(Ao )
12.644
12.648
12.652
12.656
12.66
12.664
c-pa
ram
eter
(Ao )
a (oA)c (oA)
87K
98K
104.7K
101K

(a) (b)
(c) (d)
(e)
Figure 15 (a-e): Scanning electron micrographs for(a) as-deposited HgBaCaCu alloyed film and electrochemically oxidizedfilms for (b) 20 min.; (c) 24 min.; (d) 28 min.; and (e) 30 minutes.

Figure 16. Temperature dependence of normalized resistivity of the Hg-Ba-Ca-CuO films electrochemically oxidized for different periods
0
0.2
0.4
0.6
0.8
1
0 50 100 150 200 250 300Temperature T (K)
Nor
mal
ized
resi
stan
ce
RT/
R(3
00 K
)As-deposited20 minute24 minute28 minute30 minute

Fig. 17 (b). Variation in Tc with δ as observed by Fukuoka [55].
Figure 17(a) Transition temperatures achieved for the films oxidized for different electrochemical oxidation period
80
85
90
95
100
105
110
18 20 22 24 26 28 30 32Oxidation Period (minutes)
Tc (K
)