Ron Cowell - EPLC - 04.07.091 PENNSYLVANIA’S K-12 EDUCATION FUNDING SYSTEM presented to House...
45
Ron Cowell - EPLC - 04.07 .09 1 PENNSYLVANIA’S K-12 EDUCATION FUNDING SYSTEM presented to House Democratic Policy Committee April 7, 2009 Ronald Cowell, President The Education Policy and Leadership Center for the Pennsylvania School Funding Campaign
-
Upload
mabel-mcgee -
Category
Documents
-
view
215 -
download
2
Transcript of Ron Cowell - EPLC - 04.07.091 PENNSYLVANIA’S K-12 EDUCATION FUNDING SYSTEM presented to House...

Ron Cowell - EPLC - 04.07.09 1
PENNSYLVANIA’S K-12 EDUCATION FUNDING SYSTEM
presented to
House Democratic Policy Committee April 7, 2009
Ronald Cowell, President
The Education Policy and Leadership Center
for the
Pennsylvania School Funding Campaign

Ron Cowell - EPLC - 04.07.09 2
The Education Policy and Leadership Center
• Independent, not-for-profit, non-partisan
• Focus on state-level education policy
• Improve development and implementation
• Based in Harrisburg – Programs throughout PA
• Information --- Leadership --- Advocacy
• An information resource for policymakers and the public

Ron Cowell - EPLC - 04.07.09 3
Pennsylvania School Funding Campaign
Successful Schools…Successful Children…
Successful Communitieswww.paschoolfunding.org
See Attached List of Steering Committee Organizations

Ron Cowell - EPLC - 04.07.09 4
DISCUSSION OF EDUCATION POLICY DOES NOT BEGIN WITH DISCUSSION OF MONEY Instead, funding discussion should flow out of a broader set of education policies.
CONSIDER THIS FRAMEWORK FOR DISCUSSION OF EDUCATION POLICY• Governance
• Standards (Expectations – Student Achievement)
• Assessment (How are we doing)
• Consequences (Get everyone to take seriously)
• Educational Capacity (What works)
• EDUCATION FINANCE
• Alignment

Ron Cowell - EPLC - 04.07.09 5
WHY STATE FUNDING FOR EDUCATION
• State Constitutional Mandate for General Assembly to provide for System of Schools
• State Incentive for local government to fund schools
• State funding to reduce local taxes
• Need for Equity
• Need for Adequacy

Ron Cowell - EPLC - 04.07.09 6
PENNSYLVANIA HISTORY
• 1776 State Constitution: “A school or schools shall be established in each county by the legislature, for the convenient instruction of youth….”
• 1790 State Constitution: “The legislature shall, as soon as conveniently may be, provide, by law, for the establishment of schools throughout the State, in such manner that the poor may be taught gratis.”
• 1831: Common School Fund established with $100,000 per year available

Ron Cowell - EPLC - 04.07.09 7
PENNSYLVANIA HISTORY
• 1834: Free School Act required each municipality to establish an elected school board; state funding if matched at least 2:1 by county dollars
• 1835-1897: State school funding to counties based on number of taxable inhabitants in county
• Attempt in 1863 to base funding on number of children failed because of difficulty in counting children in attendance

Ron Cowell - EPLC - 04.07.09 8
PENNSYLVANIA HISTORY
• 1874 PA Constitution: “The General Assembly shall provide for the maintenance and support of a thorough and efficient system of public schools, wherein all the children of this Commonwealth above the age of six years may be educated, and shall appropriate at least one million dollars each year for that purpose.”
• 1895: PA’s first compulsory attendance law• 1897: Number of children ages 6-16 added
to state funding formula
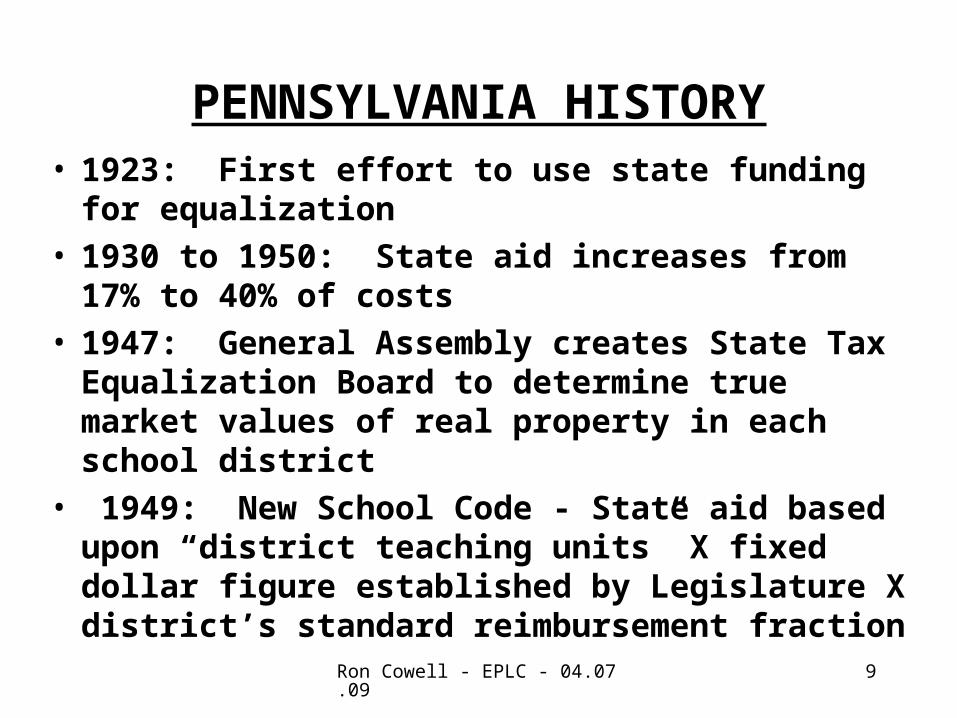
Ron Cowell - EPLC - 04.07.09 9
PENNSYLVANIA HISTORY• 1923: First effort to use state funding for
equalization • 1930 to 1950: State aid increases from 17% to
40% of costs• 1947: General Assembly creates State Tax
Equalization Board to determine true market values of real property in each school district
• 1949: New School Code - State aid based upon “district teaching units” X fixed dollar figure established by Legislature X district’s standard reimbursement fraction

Ron Cowell - EPLC - 04.07.09 10
PENNSYLVANIA HISTORY• 1957: State aid formula begins to consider
“actual instructional expense (AIE)”• Mid 60’s-1983: Statutory goal that the state
pay 50% of the statewide district instructional costs
• 1968: For 1966-67 school year and thereafter, State began to pay on basis of “weighted” pupils and local wealth; state also began to make additional payments for children in poverty, density, sparsity, and homebound instruction

Ron Cowell - EPLC - 04.07.09 11
PENNSYLVANIA HISTORY
• 1971: State income tax established• 1974-75: State reimbursement at 54%• 1977: Personal income valuation becomes a
factor in determining district aid ratio (40%)• 1977-1980: State reimbursement averages
46% per year• 1982: All districts held harmless plus $72
million supplement for “Equalized Supplement for Student Learning (ESSL)

Ron Cowell - EPLC - 04.07.09 12
PENNSYLVANIA HISTORY
• 1983: Equalized Subsidy for Basic Education (ESBE) enacted; includes “Factor for Educational Expense” (FEE); removes 50% funding goal
• 1991: PARSS Equity Suit filed
• 1991: Special Education funding changed
• 1992: ESBE abandoned
• 1993 and 1994: Modest “foundation” funding guarantee included in state funding

Ron Cowell - EPLC - 04.07.09 13
PENNSYLVANIA HISTORY
• 1995-2002: Ridge/Schweiker Administration Vouchers & Charter School Funding Link to Learn; Read to Succeed
• 1998- Commonwealth Court rejects PARSS v. Ridge – funding is not for courts to decide
• 2002 Gubernatorial Campaign/Election
• 2003-04 Budget Debate until 12/03 Accountability Block Grants in 2004-05

Ron Cowell - EPLC - 04.07.09 14
PENNSYLVANIA HISTORY
• 2006: Legislature mandates a Costing-Out Study
• November 2007: Costing-Out Study is reported
• February 2008: Governor proposes 6-Year Plan
• July 2008: Legislature approves 6-Year Plan

Ron Cowell - EPLC - 04.07.09 15
KEY ELEMENTS OF 1980’s ESBE FORMULA
WADMs (Number of Students)X
Aid Ratio (Relative Wealth of District)X
FEE (Cost Factor)=
Basic Subsidy to the District
+
Other Factors (poverty, density, etc.)

Ron Cowell - EPLC - 04.07.09 16
SUBSIDY PLUS “OTHER”
• Poverty
• Density
• Sparsity
• “Hold Harmless” for Basic Subsidy
• Transportation
• Special education
• Charter Schools

Ron Cowell - EPLC - 04.07.09 17
PUBLIC K-12 SPENDING
2006-07 1991-92 Amount Rank Amount Rank
Per Pupil Amounts for Current Spending
US $ 9,683 --- $5,001 ---PA $10,905 14th $6,050 6th
Source: US Department of Education - March 2009

Ron Cowell - EPLC - 04.07.09 18
PUBLIC K-12 SPENDINGCURRENT EXPENDITURES PER STUDENT - 2006-07
Compared to contiguous states, spending in Pennsylvania was far below average and ranked 5th in a group of seven states, exceeding only Ohio and West Virginia, but trailing Delaware, Maryland, New Jersey and New York.
• Pennsylvania $10,905• National 9,663• Delaware 15,511• Maryland 11,975• New Jersey 16,163• New York 15,546• Ohio 9,940• West Virginia 9,727
Source: US Department of Education - March 2009

Ron Cowell - EPLC - 04.07.09 19
SO WHAT’S THE PROBLEM?

Ron Cowell - EPLC - 04.07.09 20
WHAT HAS BEEN WRONG WITH THE PA FUNDING SYSTEM
• State Share in bottom five in nation
• State Appropriations Per Student below national average
• Disproportionate share of state funds are withheld from poorer districts
• Therefore, districts too dependent on Local Wealth & Property Taxes
• Therefore, great Inequity and Inadequacy among 501 school districts

Ron Cowell - EPLC - 04.07.09 21
GOAL OF 50% STATE SHARE ABANDONED (1983)
STATEWIDE ED FUNDING FORMULA ABANDONED (1991)

Ron Cowell - EPLC - 04.07.09 22
SPECIAL EDUCATION FUNDING
• State paid 100% excess cost until 1991
• New formula as of 1991-92
• Assumes 1% and 15% incidence rates
• No consideration of district costs or wealth
• In 2005-06, more than $1 billion non-reimbursed

Ron Cowell - EPLC - 04.07.09 23
CHARTER SCHOOL FUNDING • Approved by district or state appeal board
• No limit on number in state
• Cost borne by local districts
• Law assumes some savings to districts
• More than half-billion/year cost to districts
• Since 2002-03, state will pay up to 30%
• Cyber charter schools

Ron Cowell - EPLC - 04.07.09 24
OTHER COST DRIVERS
• Retirement Costs• Health Care Costs• Construction
• Task Force on School Cost Reduction

Ron Cowell - EPLC - 04.07.09 25
STATE/LOCAL SHARES for Elementary/Secondary Public Education
State Share Local Share PA National PA National
2006-07 36.2% (47.6) 56.5% (43.9)2005-06 35.0% (46.6) 57.1% (44.4)2004-05 35.6% (47.0) 56.2% (43.9)2003-04 35.9% (47.1) 56.1% (43.9)2002-03 36.7% (49.0) 55.8% (42.7)2001-02 37.4% (49.4) 55.3% (42.8)2000-01 37.3% (49.9) 56.3% (43.0)1999-00 37.9% (49.8) 55.8% (43.1)1998-99 38.3% (49.5) 55.8% (43.6)1997-98 38.7% (49.0) 55.5% (44.4)1996-97 39.2% (48.8) 55.4% (44.8)1995-96 39.8% (48.1) 54.8% (45.5)1994-95 40.0% (47.5) 54.8% (46.0)1993-94 40.1% (45.9) 54.5% (47.6)1992-93 39.9% (46.4) 54.2% (47.0)1991-92 41.0% (47.3) 53.3% (46.2)
Source: US Department of Education - March 2009

Ron Cowell - EPLC - 04.07.09 26
STATE/LOCAL SHARES for Elementary/Secondary Public Education
2006-2007
State Share % Local Share %• Pennsylvania 36.2 56.5• National 47.6 43.9• Delaware 63.1 29.4• Maryland 40.3 53.8• New Jersey 42.1 53.5• New York 43.5 49.8• Ohio 44.5 48.4• West Virginia 59.5 28.8Source: US Department of Education - March 2009
1% in PA in 2006-2007 = approximately $230 million

Ron Cowell - EPLC - 04.07.09 27
PUBLIC K-12 REVENUEPER $1,000 PERSONAL INCOME
2005-06 1991-92Amount Rank Amount Rank
US - Total $50.67 --- $48.87 ---PA - Total $52.73 20th $49.98 27th
US Local $22.48 --- $23.25 --- PA Local- $30.11 4th $27.24 13th
US State $23.61 --- $22.43 ---PA State- $18.46 40th $20.25 36th
Differences to 100% come from federal sources. Source: US Census Bureau. 2008

Ron Cowell - EPLC - 04.07.09 28
STATE FUNDING APPROPRIATED PER STUDENT
Source: US Census Bureau April 2008
2005-06 1997-98 1991-92
State $
per pupil
Rank State $ per pupil
Rank State $ per pupil
Rank
US
PA
DE
MD
NJ
NY
OH
WV
5,018
4,532
8,480
4,871
6,913
7,241
4,915
5,896
---
30
3
26
7
5
25
13
3,473
3,186
5,311
3,026
4,196
3,855
2,999
4,485
---
32
4
34
8
16
35
6
2,661
2,775
4,137
2,516
4,060
3,290
2,228
3,603
---
18
4
22
5
9
33
6

Ron Cowell - EPLC - 04.07.09 29
RESULT: 2005-06 BURDEN ON
LOCAL PROPERTY TAXESTotal K-12 State- Local K-12 % fromwide Revenues Property Taxes Prop
Taxes
US $521,116,397 $147,249,385 28.25%
PA $22,772,190 $10,009,710 43.95%
in ooo’s
Source: US Census Bureau April 2008
15.5% Difference = more than $3.575 billion/year

Ron Cowell - EPLC - 04.07.09 30
RESULT: INEQUITY FOR STUDENTS ACROSS PA
Great Inequity for StudentsAmong 501 Districts
In 2005-06, instructional spending per pupil in Pennsylvania school districts ranged
from $4,469 to $14,045
This means, in an average classroom of 25 students, a gap of almost $250,000 per
classroom per year.

Ron Cowell - EPLC - 04.07.09 31
RESULT: INEQUITY FOR TAXPAYERS ACROSS PA
Great Discrepancies in Local Effort and Resultant Burden on Local
Taxpayers

Ron Cowell - EPLC - 04.07.09 32
RESULT: INADEQUATE EDUCATIONAL RESOURCES
IN MANY DISTRICTS
• Qualified Teachers• Class Size• Early Ed/Kindergarten Programs• Curriculum• Books, Computers and Materials• Labs, Foreign Languages, Honors/AP
Courses• Facilities not conducive to learning

Ron Cowell - EPLC - 04.07.09 33
ADEQUATE FOR WHAT?
The Expectations for Student Performance Established by PA’s Academic Standards
The Expectations of No Child Left Behind Law and Related Policies

Ron Cowell - EPLC - 04.07.09 34
NCSL Report on School Finance
An ADEQUATE School Funding System will provide and ensure the use
of sufficient funding to establish and maintain
the effective and necessary educational capacity
to provide every student in every school a meaningful opportunity
to accomplish the academic proficiencies for which he or she will be held accountable.

Ron Cowell - EPLC - 04.07.09 35
PA TAX RELIEF EFFORTS
• Act 72 of 2004• Act 1 of 2006 Special Session on
Property Tax Relief – Legalize slots• Nothing to do with improving
education funding system or meeting the needs of students
• Intentionally limits ability of districts to raise local revenues (referendum)

Ron Cowell - EPLC - 04.07.09 36
ACKNOWLEDGE SOME PROGRESS in 2003-2007
• State Funding for Pre-School started• Basic Subsidy line item increased• Attention to “Foundation” funding• Accountability Block Grants initiated• School districts reimbursed 27% for
charter school payments• Legislature mandates a Costing-Out Study
linked to state’s academic standards
Ron Cowell - EPLC - 04.07.09 37
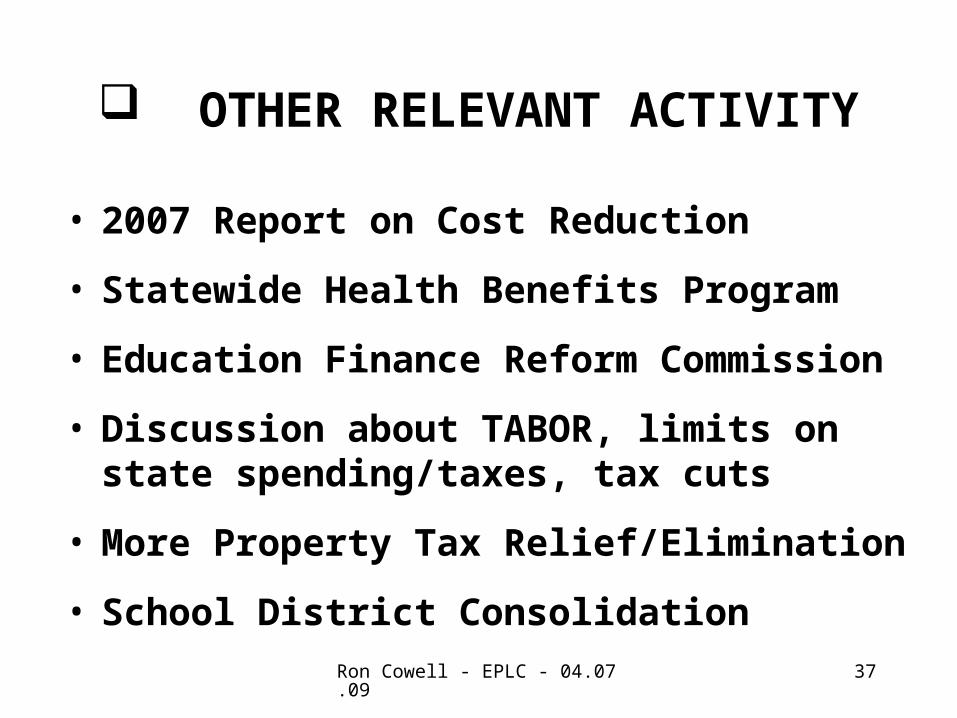
OTHER RELEVANT ACTIVITY
• 2007 Report on Cost Reduction
• Statewide Health Benefits Program
• Education Finance Reform Commission
• Discussion about TABOR, limits on state spending/taxes, tax cuts
• More Property Tax Relief/Elimination
• School District Consolidation

Ron Cowell - EPLC - 04.07.09 38
Principles of a Sound Statewide Education Finance System
• Equity
• Adequacy
• Accountability
• Efficiency
• Predictability

Ron Cowell - EPLC - 04.07.09 39
QUESTIONS FOR STATE POLICYMAKERS
• How much state funding? Appropriate share?• By what formula will state funding be
distributed?• What conditions will be attached to the state
funds?• What taxing authority will be provided to
generate local revenues?• Should state funds be targeted for some
students/districts or generally available for all?• Should state funds be distributed via
categorical purposes vs. basic subsidy?

Ron Cowell - EPLC - 04.07.09 40
BIG ISSUES
• Should every student have a fundamental right to a quality public education?
• What is student or school “success”? What do we value? How do we measure it?
• Does Money Matter? Consider both the amount and how it is used!
• Accountability for what? Inputs or Performance? With what consequences?

Ron Cowell - EPLC - 04.07.09 41
BIG ISSUES • Hold Harmless every year?
• Who should pay for state mandates?
• Tension of Local Control of Funding vs. State Requirements/Conditions attached to some/all of the Funding.
• How can state funding be used most effectively to level the “playing field” of opportunity?

Ron Cowell - EPLC - 04.07.09 42
2007 COSTING-OUT STUDY• Mandated by General Assembly in 2006• Commissioned by State Board of Education• Conducted Augenblick & Palaisch• Reported in November 2007• Cost of all students accomplishing
proficiency in all areas of standards• Considered special ed, poverty, ELL,
regional costs• Identified district-by-district a total spending
gap of $4.6 billion

Ron Cowell - EPLC - 04.07.09 43
NEW BASIC FORMULA IN 2008-2009
• Linked to Costing-Out Study
• Increase State Funding by $2.6 billion over 6 years
• Gets state share to 44% in 6 years

Ron Cowell - EPLC - 04.07.09 44
ACCOUNTABILITY
• Districts receiving basic ed increase above Act 1 inflation index must spend portion above index on “proven school improvement strategies”
• Districts identified as Warning, Improvement or Corrective Action & districts with a school identified for Improvement or Corrective Action must have PDE approval for use of resources above inflation index

Ron Cowell - EPLC - 04.07.09 45
FOR MORE INFORMATION
Ronald CowellThe Education Policy and Leadership Center
717-260-9900
www.eplc.org