Rommel et al., 2016 QEEG in ADHD and BD
12
King’s Research Portal DOI: 10.1007/s10548-016-0508-0 Document Version Publisher's PDF, also known as Version of record Link to publication record in King's Research Portal Citation for published version (APA): Rommel, A-S., Kitsune, G. L., Michelini, G., Hosang, G. M., Asherson, P., McLoughlin, G., ... Kuntsi, J. (2016). Commonalities in EEG Spectral Power Abnormalities Between Women With ADHD and Women With Bipolar Disorder During Rest and Cognitive Performance. Brain topography. DOI: 10.1007/s10548-016-0508-0 Citing this paper Please note that where the full-text provided on King's Research Portal is the Author Accepted Manuscript or Post-Print version this may differ from the final Published version. If citing, it is advised that you check and use the publisher's definitive version for pagination, volume/issue, and date of publication details. And where the final published version is provided on the Research Portal, if citing you are again advised to check the publisher's website for any subsequent corrections. General rights Copyright and moral rights for the publications made accessible in the Research Portal are retained by the authors and/or other copyright owners and it is a condition of accessing publications that users recognize and abide by the legal requirements associated with these rights. •Users may download and print one copy of any publication from the Research Portal for the purpose of private study or research. •You may not further distribute the material or use it for any profit-making activity or commercial gain •You may freely distribute the URL identifying the publication in the Research Portal Take down policy If you believe that this document breaches copyright please contact [email protected] providing details, and we will remove access to the work immediately and investigate your claim. Download date: 13. Feb. 2018
Transcript of Rommel et al., 2016 QEEG in ADHD and BD

King’s Research Portal
DOI:10.1007/s10548-016-0508-0
Document VersionPublisher's PDF, also known as Version of record
Link to publication record in King's Research Portal
Citation for published version (APA):Rommel, A-S., Kitsune, G. L., Michelini, G., Hosang, G. M., Asherson, P., McLoughlin, G., ... Kuntsi, J. (2016).Commonalities in EEG Spectral Power Abnormalities Between Women With ADHD and Women With BipolarDisorder During Rest and Cognitive Performance. Brain topography. DOI: 10.1007/s10548-016-0508-0
Citing this paperPlease note that where the full-text provided on King's Research Portal is the Author Accepted Manuscript or Post-Print version this maydiffer from the final Published version. If citing, it is advised that you check and use the publisher's definitive version for pagination,volume/issue, and date of publication details. And where the final published version is provided on the Research Portal, if citing you areagain advised to check the publisher's website for any subsequent corrections.
General rightsCopyright and moral rights for the publications made accessible in the Research Portal are retained by the authors and/or other copyrightowners and it is a condition of accessing publications that users recognize and abide by the legal requirements associated with these rights.
•Users may download and print one copy of any publication from the Research Portal for the purpose of private study or research.•You may not further distribute the material or use it for any profit-making activity or commercial gain•You may freely distribute the URL identifying the publication in the Research Portal
Take down policyIf you believe that this document breaches copyright please contact [email protected] providing details, and we will remove access tothe work immediately and investigate your claim.
Download date: 13. Feb. 2018

ORIGINAL PAPER
Commonalities in EEG Spectral Power Abnormalities BetweenWomen With ADHD and Women With Bipolar Disorder DuringRest and Cognitive Performance
Anna-Sophie Rommel1 • Glenn L. Kitsune1,2• Giorgia Michelini1 • Georgina M. Hosang3
•
Philip Asherson1• Grainne McLoughlin1
• Daniel Brandeis4,5,6,7• Jonna Kuntsi1
Received: 7 May 2016 / Accepted: 13 July 2016
� The Author(s) 2016. This article is published with open access at Springerlink.com
Abstract While attention-deficit/hyperactivity disorder
(ADHD) and bipolar disorder (BD) denote distinct psy-
chiatric conditions, diagnostic delineation is impeded by
considerable symptomatic overlap. Direct comparisons
across ADHD and BD on neurophysiological measures are
limited. They could inform us on impairments that are
specific to or shared between the disorders and, therefore,
potential biomarkers that may aid in the identification of
the diagnostic boundaries. Our aim was to test whether
quantitative EEG (QEEG) identifies differences or
similarities between women with ADHD and women with
BD during resting-state and task conditions. QEEG activity
was directly compared between 20 ADHD, 20 BD and 20
control women during an eyes-open resting-state condition
(EO) and a cued continuous performance task (CPT-OX).
Both ADHD (t38 = 2.50, p = 0.017) and BD (t38 = 2.54,
p = 0.018) participants showed higher absolute theta
power during EO than controls. No significant differences
emerged between the two clinical groups. While control
participants showed a task-related increase in absolute
theta power from EO to CPT-OX (t19 = -3.77,
p = 0.001), no such change in absolute theta power was
observed in the ADHD (t19 = -0.605, p = 0.553) or BD
(t19 = 1.82, p = 0.084) groups. Our results provide evi-
dence for commonalities in brain dysfunction between
ADHD and BD. Absolute theta power may play a role as a
marker of neurobiological processes in both disorders.
Keywords ADHD � Bipolar disorder � Quantitative EEG �Spectral power � Theta power
Introduction
Attention-deficit/hyperactivity disorder (ADHD) and
bipolar disorder (BD) are common psychiatric disorders,
respectively affecting around 2–4 % and 1–2 % of the
adult population worldwide (Merikangas et al. 2011;
Willcutt 2012). While ADHD and BD denote distinct
psychiatric conditions (American Psychiatric Association
2013), diagnostic delineation is impeded by considerable
symptomatic overlap. Both ADHD and the manic phase of
BD are associated with distractibility, restlessness,
talkativeness and lack of social inhibition (Kent and
Craddock 2003; Galanter and Leibenluft 2008). Both
Electronic supplementary material The online version of thisarticle (doi:10.1007/s10548-016-0508-0) contains supplementarymaterial, which is available to authorized users.
& Jonna Kuntsi
1 King’s College London, MRC Social, Genetic and
Developmental Psychiatry Centre, Institute of Psychiatry,
Psychology and Neuroscience, London, UK
2 King’s College London, Department of Psychological
Medicine, Institute of Psychiatry, Psychology and
Neuroscience, London, UK
3 Department of Psychology, Goldsmiths University of
London, London, UK
4 Department of Child and Adolescent Psychiatry and
Psychotherapy, Central Institute of Mental Health, Medical
Faculty Mannheim, Heidelberg University, Mannheim,
Germany
5 Department of Child and Adolescent Psychiatry and
Psychotherapy, Psychiatric Hospital, University of Zurich,
Zurich, Switzerland
6 Center for Integrative Human Physiology, University of
Zurich, Zurich, Switzerland
7 Neuroscience Center Zurich, University of Zurich, Zurich,
Switzerland
123
Brain Topogr
DOI 10.1007/s10548-016-0508-0

disorders further present with features of mood dysregu-
lation, such as irritability and emotional lability (Skirrow
et al. 2012, 2014). However, ADHD symptoms are chronic
and trait-like, while BD symptoms tend to occur for dis-
tinct periods of time (Asherson et al. 2014). Nevertheless,
symptoms of distractibility and mood dysregulation (Najt
et al. 2007; Peluso et al. 2007; Newman and Meyer 2014),
as well as residual cognitive and functional impairments
(Torres et al. 2007; Henry et al. 2013), persist as milder
stable traits in euthymic BD. Such overlap can lead to
challenges in distinguishing the two disorders, or recog-
nising comorbidity, in clinical practice and may conse-
quently result in inappropriate treatment decisions
(Asherson et al. 2014).
Similar cognitive impairments have also been described
for individuals with ADHD and BD. Both ADHD and
euthymic BD are associated with poor accuracy in atten-
tional and inhibitory processing tasks (Robinson and Fer-
rier 2006; Arts et al. 2008; McLoughlin et al. 2010;
Torralva et al. 2011), as well as increased reaction time
variability (RTV) (Brotman et al. 2009; Kuntsi et al. 2010;
Kuntsi and Klein 2012; Adleman et al. 2014). Yet, similar
cognitive performance could stem from differing underly-
ing mechanisms (Banaschewski and Brandeis 2007).
Consequently, our recent cognitive-electrophysiological
investigations of attentional and inhibitory processing in
women with ADHD and women with BD revealed evi-
dence for disorder-specific impairments, despite indistin-
guishable cognitive performance (Michelini et al. 2016).
Event-related potential (ERP) analyses showed a signifi-
cantly reduced N2 amplitude in participants with BD,
compared to the ADHD and control groups, in response to
NoGo stimuli during a cued continuous performance task
(CPT) (Michelini et al. 2016). As the N2 in response to
NoGo stimuli or in incongruent trials is considered to
reflect conflict-monitoring processing (Yeung and Cohen
2006), the results suggest impaired conflict monitoring in
women with BD, compared to women with ADHD and
control women. Yet, women with ADHD and women with
BD also showed overlapping neurophysiological impair-
ments compared to controls in the NoGo-P3, suggesting
shared inhibitory control deficits (Michelini et al. 2016).
Another method to investigate covert processing and
other underlying mechanisms in the absence of overt per-
formance differences is employing quantitative electroen-
cephalography (QEEG). QEEG allows the direct
examination of subtle changes in cortical activity which
may reflect state regulation and arousal (Banaschewski and
Brandeis 2007). This is of particular relevance in condi-
tions such as ADHD and BD which show abnormalities in
state regulation and arousal (Degabriele and Lagopoulos
2009; Ongur et al. 2010; Cortese et al. 2012; Nigg 2013). In
QEEG, electrophysiological recordings are quantified in
the frequency ranges delta (0.5–3.5 Hz), theta
(3.5–7.5 Hz), alpha (7.5–12.5 Hz), beta (12.5–30 HZ) and
gamma ([30 Hz). The most consistently reported findings
of QEEG studies in children and adults with ADHD during
resting-state conditions are elevated power in slow (delta
and theta) frequency bands, reduced power in fast wave
cortical activity (mainly beta) and an elevated proportion of
slower to faster frequencies in the brain, as reflected in
theta/beta ratio (TBR), particularly apparent at fronto-
central sites (Bresnahan et al. 1999; Bresnahan and Barry
2002; Clarke et al. 2003, 2006; Snyder and Hall 2006;
Clarke et al. 2008; Koehler et al. 2009; Cooper et al. 2014).
This has also been confirmed by meta-analyses, reporting
effect sizes between 0.58 and 1.31 for theta power and
between 0.62 and 3.08 for TBR (Boutros et al. 2005;
Snyder and Hall 2006; Arns et al. 2013). Yet, several recent
studies have failed to replicate these findings (Loo et al.
2009; Ogrim et al. 2012; Liechti et al. 2013; Buyck and
Wiersema 2014; Poil et al. 2014; Kitsune et al. 2015;
Skirrow et al. 2015) and the increased TBR as a marker of
ADHD diagnosis is being contested (Arns et al. 2013;
Lenartowicz and Loo 2014; Jeste et al. 2015; Arns et al.
2016). EEG spectral power in ADHD further seems to
depend on the context, with one study finding elevated
delta and theta activity in individuals with ADHD com-
pared to controls during the resting-state condition at the
start of recording sessions and increased beta power only at
the end of the recording session in ADHD (Kitsune et al.
2015). In BD, elevated delta and theta power, as well as
decreases in alpha power, during resting-state conditions
have been reported (Clementz et al. 1994; Degabriele and
Lagopoulos 2009; Basar et al. 2012). However, direct EEG
comparison studies between ADHD and BD have not yet
been conducted.
Few studies on ADHD have examined cortical activity
patterns during cognitive task conditions and findings are
inconsistent. While some studies have shown no differ-
ences in cortical activation between controls and individ-
uals with ADHD during a CPT (Loo et al. 2009; Skirrow
et al. 2015), others have reported elevated alpha (Swart-
wood et al. 2003; Nazari et al. 2011) and theta (El-Sayed
et al. 2002) power in individuals with ADHD compared to
controls. In addition, lower theta power in adults with
ADHD has been demonstrated in the sustained attention to
response task (SART), owing to task-related increase in
frontal theta activity in control participants that was absent
in participants with ADHD (Skirrow et al. 2015). Treat-
ment with methylphenidate resulted in normalisation of the
resting-state to task activation pattern. These findings may
indicate a lack of modulation of cortical activity from
resting-state to cognitive task in the ADHD group com-
pared to controls. QEEG profiles of individuals with BD
during cognitive tasks have not yet been studied.
Brain Topogr
123

Investigating the oscillatory patters of individuals with
ADHD and BD across conditions, from rest to cognitive
task condition, may allow us to investigate cortical acti-
vation and arousal patterns that could inform us on
impairments that are specific to or shared between the
disorders.
The aim of this study was to test whether quantitative
EEG identifies differences or similarities between women
with ADHD, women with bipolar disorder and controls
during a resting-state condition (eyes open) and an active
task condition (a flanked continuous performance test),
which could inform us on overlapping and distinct elec-
trophysiological impairments in both disorders that may
underlie symptomatic and cognitive similarities.
Method
Sample
The sample consisted of 20 women with ADHD, 20
women with euthymic BD and 20 control women. Partic-
ipants with ADHD were recruited from the Adult ADHD
Clinic at the Maudsley Hospital, London, UK. Participants
with BD were recruited from the Maudsley Psychosis
Clinic, London, UK, or had previously participated in
another research study (Hosang et al. 2012). Control par-
ticipants were recruited from the Mindsearch volunteer
database maintained by the Institute of Psychiatry, Psy-
chology and Neuroscience, King’s College London, UK,
which comprises several thousand potential participants.
Participants for this study were randomly selected from all
those meeting inclusion criteria.
Diagnosis in the clinical groups was first assessed with
the help of medical records, following Diagnostic and
Statistical Manual (DSM-IV) criteria (American Psychi-
atric Association 2000) and later confirmed during the
research assessment using the Diagnostic Interview for
Adult ADHD (DIVA, Kooij and Francken 2007), the Alt-
man Self-Rating Mania Scale (Altman et al. 1997), the
Becks Depression Inventory (Beck et al. 1996), as well as
the Young Mania Rating Scale (Young et al. 1978). The
ADHD participants met current criteria for combined-type
ADHD or inattentive-type ADHD with sufficient symp-
toms of hyperactivity-impulsivity in the past to meet a
childhood combined-type diagnosis. Participants in the BD
group had a diagnosis of bipolar I disorder (BD-I), with
evidence of a past manic episode lasting 1 week or more.
BD-I patients were selected if they were currently euthy-
mic, meaning that they were not experiencing a manic or
depressed episode at the time of the assessment. Exclusion
criteria for all groups were drug or alcohol dependency in
the last 6 months, autism, epilepsy, neurological disorders,
brain injury, past ECT treatment, current involvement in
another research trial likely to alter symptom severity,
pregnancy or a limited proficiency in English language.
Those with a comorbidity of both ADHD and BD, or who
were currently experiencing a manic episode, were also
excluded. In addition, control participants, who reported a
history of psychiatric disorders or who were taking psy-
chiatric medication, were excluded from the study.
All participants had normal or corrected-to-normal
vision. Participants’ IQs were assessed with the Wechsler
Abbreviated Scale of Intelligence–Fourth Edition (WASI-
IV; Wechsler 1999). IQ (F2,58 = 1.37, p = 0.26) and age
(F2,59 = 1.63, p = 0.21), which ranged from 20 to
52 years, did not differ between groups (Table 1). Partic-
ipants with ADHD were asked to come off stimulant
medication 48 h before the assessment. For ethical reasons,
participants were not asked to stop taking mood stabilisers
(70 % of the BD group), anti-psychotic medication (40 %
of the BD group) or anti-depressants (7 % of the ADHD
group and 25 % of the BD group) they had been pre-
scribed. All participants were asked to refrain from caf-
feinated drinks and nicotine 2 h prior to the testing session.
The investigation was carried out in accordance with the
latest version of the Declaration of Helsinki. Ethical
approval for the study was granted by the Camberwell St
Giles Research Ethics Committee (approval number
11/LO/0438) and all participants provided after the nature
of the procedures had been fully explained.
Procedure and Cognitive-Performance Measures
Participants completed the cognitive-EEG assessment,
including an IQ test and clinical interviews, in a single
4.5 h research session. Participants completed a 3-minute
eyes-open resting-state condition (EO) as well as a
3-minutes eyes-closed (EC) resting-state condition prior to
performing on a CPT with flankers (CPT-OX)
(McLoughlin et al. 2010; Doehnert et al. 2010;
McLoughlin et al. 2011). QEEG differences between EO
and CPT-OX are analysed here, in line with recent research
(Nazari et al. 2011; Skirrow et al. 2015), since EO has been
suggested to provide a more appropriate baseline than EC
for tasks involving visual processing (Barry et al. 2007).
The CPT-OX is a cued-Go/NoGo task that probes
attention, preparation and response inhibition. The task
consisted of 400 black letter arrays, made up of a centre
Table 1 Demographic data: mean (SD) and p-value from ANOVA
ADHD BD Controls p-value
Age (years) 37.4 (7.6) 40.3 (7.7) 36.7 (4.3) 0.21
IQ 104.5 (17.9) 108.0 (12.5) 112.4 (14.2) 0.26
Brain Topogr
123

letter and incompatible flankers on each side to increase
difficulty for adults. The presented arrays included the cue
letter ‘O’, the target letter ‘X’ as well as the distractors ‘H’,
‘B’, ‘C’, ‘D’, ‘E’, ‘F’, ‘G’, ‘J’ and ‘L’. Letters were pre-
sented centrally on the computer monitor, subtending
approximately 5�. Cue and target letters (‘O’ and ‘X’
respectively) were flanked by the incompatible letters
(‘XOX’ and ‘OXO’ respectively). Participants were
instructed to ignore the flanking letters and respond as
quickly as possible to cue-target sequences (‘O’-‘X’). 80
Cues (‘XOX’) were followed by the target (‘OXO’) in 40
trials (Go condition), and by neutral distractors in the
remainder of trials (NoGo condition). On 40 trials, the
target letter ‘X’ was not preceded by a cue ‘O’ and had to
be ignored. Letters were presented every 1.65 s for 150 ms
in a pseudo-randomised order. Ten practice trials preceded
the main task and were repeated, if required, to ensure
participant comprehension. Participants were instructed to
respond only to Cue-Go sequences by pressing a button as
quickly as possible with the index finger of their preferred
hand. Participants were further asked to withhold the
response in the presence of a NoGo stimulus, in the pres-
ence of a Go stimulus not preceded by a Cue, or in the
presence of any other irrelevant letters. Task duration was
11 min.
Electrophysiological Recording and Analysis
The EEG was recorded from a 62 channel direct-current-
coupled recording system (extended 10–20 montage),
using a 500 Hz sampling-rate and impedances under
10 kX. FCz and AFz were the recording reference and
ground electrodes, respectively. The electro-oculograms
were recorded from electrodes above and below the left eye
and at the outer canthi. Participants were seated on a
height-adjustable chair in a dimly lit video-monitored
testing cubicle. Stimuli were presented on a computer
monitor at a distance of approximately 120 cm, using the
Presentation software package (www.neurobs.com). EEG
data were analysed using Brain Vision Analyzer 2.0 (Brain
Products, Germany). Researchers were blind to group sta-
tus during EEG pre-processing and analysis. Raw EEG
recordings were down-sampled to 256 Hz, re-referenced to
the average of all electrodes, and digitally filtered using
Butterworth band-pass filters (0.1–30 Hz, 24 dB/oct). All
trials were also visually inspected for electrical artefacts
(due to electrical noise in the EEG recording) or obvious
movement, and sections of data containing artefacts were
removed manually. Ocular artefacts, corresponding to
blink-related and vertical and horizontal eye movements,
were identified using the infomax independent component
analysis (ICA) algorithm (Jung et al. 2000) in segmented
data. The ICA algorithm (Jung et al. 2000) allows for
removal of activity associated with ocular artefacts by
back-projection of all but this activity. The mean number
(and standard deviation) of independent components
removed in the ADHD, BD and control groups respectively
were 3.55 (1.23), 3.65 (1.81) and 3.20 (1.40) during EO;
and 2.35 (0.67), 2.50 (0.76) and 2.45 (2.05) during CPT-
OX. Sections of data with remaining artefacts exceed-
ing ± 100 lV in any channel or with a voltage step greater
than 50 lV were automatically rejected.
Quantitative EEG was investigated for EO and CPT-
OX. Artefact-free data were segmented into 2-second
epochs and power spectra were computed using a Fast
Fourier Transform (FFT) with a 10 % Hanning window.
The mean duration (and standard deviation) of the seg-
mented data in the ADHD, BD and control groups
respectively were 2.90 min (0.22), 2.93 min (0.23) and
2.95 (0.20) during EO; and 7.91 min (1.65), 8.41 min
(1.51) and 8.30 min (1.10) during CPT-OX. In order to
examine specific aspects of stimulus–response processing,
CPT-OX data were also segmented into stimulus-locked
epochs (stimulus window from 0 to 1400 ms) based on
three different response conditions: Cue, Go and NoGo.
Only trials with correct responses (Go) or correctly rejected
trials (NoGo and Cue), and which contained at least 20
artefact-free segments, were included.
Analyses focused on absolute delta (0.5–3.5 Hz), theta
(3.5–7.5 Hz), alpha (7.5–12.5 Hz), beta 1 (12.5–18.5 Hz)
and beta 2 (18.5–30 Hz) frequency band differences, as
well as differences in theta/beta ratio (TBR), between
ADHD, BD and control groups. All data were natural-log
transformed (ln) to normalise the data. The normal distri-
bution of log-transformed data was confirmed using a
Shapiro–Wilk test. In line with previous studies (Loo et al.
2009; Skirrow et al. 2015), absolute EEG power (lV2)
within each frequency band was averaged across frontal
(Fz, F1, F2, F3, F4, F5, F6, F7, F8), central (Cz, C1, C2,
C3, C4, C5, C6) and parietal (Pz, P3, P4, P7, P8) regions
from individual scalp electrodes to reduce the number of
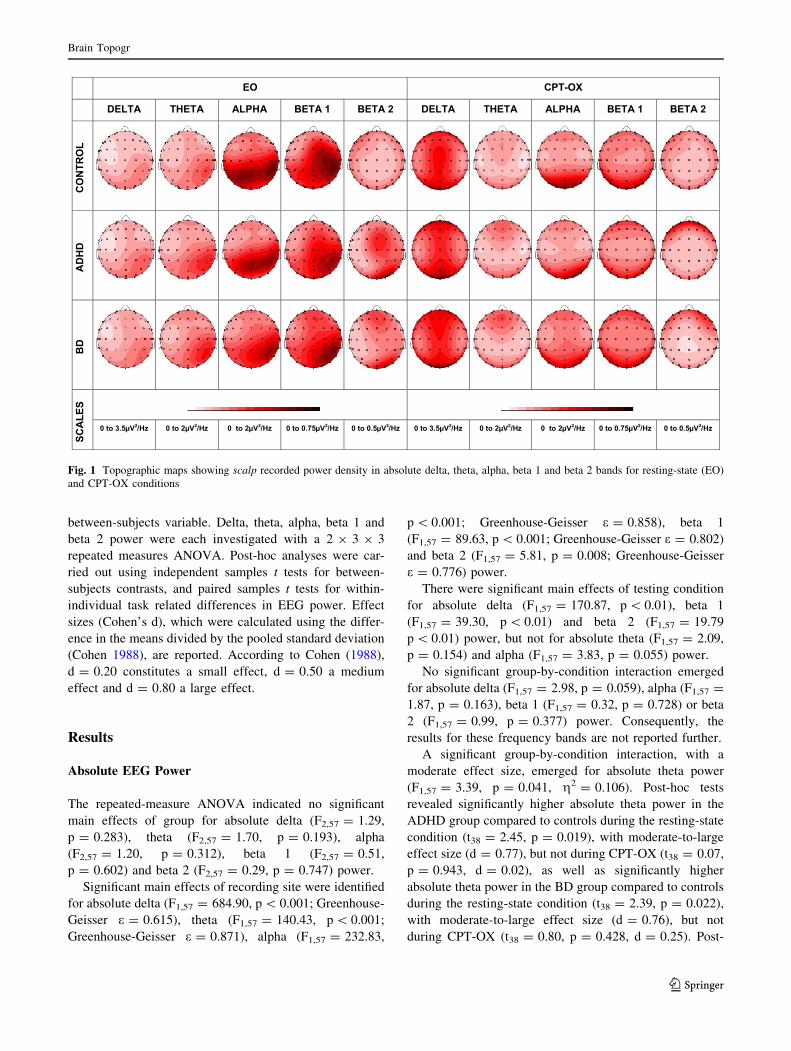
statistical comparisons (see Fig. 1 for topographic maps
showing scalp-recorded power density in delta, theta,
alpha, beta 1 and beta 2 bands). Results for relative EEG
power (lV2) within each frequency band can be found in
the supplementary material (S1).
Statistical Analysis
A repeated-measures analysis of variance (ANOVA),
applying a Greenhouse-Geiser correction when appropri-
ate, was carried out to investigate diagnostic status-related
differences between ADHD, BD and controls in EEG
power. Recording condition (EO, CPT-OX) and recording
site (frontal, central, parietal) were used as within-subject
variables and diagnostic status (ADHD, BD, control) as a
Brain Topogr
123
between-subjects variable. Delta, theta, alpha, beta 1 and
beta 2 power were each investigated with a 2 9 3 9 3
repeated measures ANOVA. Post-hoc analyses were car-
ried out using independent samples t tests for between-
subjects contrasts, and paired samples t tests for within-
individual task related differences in EEG power. Effect
sizes (Cohen’s d), which were calculated using the differ-
ence in the means divided by the pooled standard deviation
(Cohen 1988), are reported. According to Cohen (1988),
d = 0.20 constitutes a small effect, d = 0.50 a medium
effect and d = 0.80 a large effect.
Results
Absolute EEG Power
The repeated-measure ANOVA indicated no significant
main effects of group for absolute delta (F2,57 = 1.29,
p = 0.283), theta (F2,57 = 1.70, p = 0.193), alpha
(F2,57 = 1.20, p = 0.312), beta 1 (F2,57 = 0.51,
p = 0.602) and beta 2 (F2,57 = 0.29, p = 0.747) power.
Significant main effects of recording site were identified
for absolute delta (F1,57 = 684.90, p\ 0.001; Greenhouse-
Geisser e = 0.615), theta (F1,57 = 140.43, p\ 0.001;
Greenhouse-Geisser e = 0.871), alpha (F1,57 = 232.83,
p\ 0.001; Greenhouse-Geisser e = 0.858), beta 1
(F1,57 = 89.63, p\ 0.001; Greenhouse-Geisser e = 0.802)
and beta 2 (F1,57 = 5.81, p = 0.008; Greenhouse-Geisser
e = 0.776) power.
There were significant main effects of testing condition
for absolute delta (F1,57 = 170.87, p\ 0.01), beta 1
(F1,57 = 39.30, p\ 0.01) and beta 2 (F1,57 = 19.79
p\ 0.01) power, but not for absolute theta (F1,57 = 2.09,
p = 0.154) and alpha (F1,57 = 3.83, p = 0.055) power.
No significant group-by-condition interaction emerged
for absolute delta (F1,57 = 2.98, p = 0.059), alpha (F1,57 =
1.87, p = 0.163), beta 1 (F1,57 = 0.32, p = 0.728) or beta
2 (F1,57 = 0.99, p = 0.377) power. Consequently, the
results for these frequency bands are not reported further.
A significant group-by-condition interaction, with a
moderate effect size, emerged for absolute theta power
(F1,57 = 3.39, p = 0.041, g2 = 0.106). Post-hoc tests
revealed significantly higher absolute theta power in the
ADHD group compared to controls during the resting-state
condition (t38 = 2.45, p = 0.019), with moderate-to-large
effect size (d = 0.77), but not during CPT-OX (t38 = 0.07,
p = 0.943, d = 0.02), as well as significantly higher
absolute theta power in the BD group compared to controls
during the resting-state condition (t38 = 2.39, p = 0.022),
with moderate-to-large effect size (d = 0.76), but not
during CPT-OX (t38 = 0.80, p = 0.428, d = 0.25). Post-
EO CPT-OX
DELTA THETA ALPHA BETA 1 BETA 2 DELTA THETA ALPHA BETA 1 BETA 2
CO
NTR
OL
AD
HD
BD
SCA
LES
0 to 3.5µV2/Hz 0 to 2µV2/Hz 0 to 2µV2/Hz 0 to 0.75µV2/Hz 0 to 0.5µV2/Hz 0 to 3.5µV2/Hz 0 to 2µV2/Hz 0 to 2µV2/Hz 0 to 0.75µV2/Hz 0 to 0.5µV2/Hz
Fig. 1 Topographic maps showing scalp recorded power density in absolute delta, theta, alpha, beta 1 and beta 2 bands for resting-state (EO)
and CPT-OX conditions
Brain Topogr
123

hoc tests showed no significant differences in absolute
theta power between the ADHD and BD groups during the
resting-state condition (t38 = 0.21, p = 0.837, d = 0.07)
or during CPT-OX (t38 = 0.59, p = 0.561, d = 0.19).
While control participants showed a task-related increase
in absolute theta power (t19 = 3.34, p = 0.003), no sig-
nificant changes in absolute theta power from EO to CPT-
OX were observed in the ADHD (t19 = -1.23, p = 0.235)
or BD (t19 = -1.50, p = 0.150) groups (Fig. 2). This
change in absolute theta power in the control participants
likely drives the significant group-by-condition interaction.
When CPT-OX was segmented based on stimulus-
locked epochs (Cue, Go and NoGo), no significant group-
by-condition interaction emerged for absolute delta
(F1,57 = 2.81, p = 0.061, Greenhouse-Geisser e = 0.500),
alpha (F1,57 = 2.18, p = 0.114, Greenhouse-Geisser
e = 0.383), beta 1 (F1,57 = 2.68, p = 0.068, Greenhouse-
Geisser e = 0.390) or beta 2 (F1,57 = 2.43, p = 0.078,
Greenhouse-Geisser e = 0.384) power. A significant
group-by-condition interaction, with a moderate effect size,
emerged for absolute theta power (F1,57 = 3.21,
p = 0.019, g2 = 0.101, Greenhouse-Geisser e = 0.598)
when CPT-OX was segmented based on stimulus-locked
epochs (Cue, Go and NoGo).
Post-hoc tests revealed significantly higher absolute
theta power in the ADHD group, compared to controls,
during the resting-state condition (t38 = 2.50, p = 0.017,
d = 0.77), but not during the Cue (t38 = -1.01,
p = 0.317), Go (t38 = -1.05, p = 0.302) and NoGo
(t38 = -0.82, p = 0.417) conditions. Post-hoc tests also
demonstrated significantly higher absolute theta power in
the BD group compared to controls during the resting-state
condition (t38 = 2.54, p = 0.016, d = 0.76), but not dur-
ing the Cue (t38 = 0.07, p = 0.948), Go (t38 = 0.47,
p = 0.640) and NoGo (t38 = 0.24, p = 0.813) conditions.
No significant differences in absolute theta power emerged
between the ADHD and BD groups during the resting-state
condition (t38 = 0.32, p = 0.748), Cue (t38 = -1.01,
p = 0.318), Go (t38 = -1.42, p = 0.164) or NoGo
(t38 = -1.00, p = 0.323) conditions.
Theta/Beta Ratio (TBR)
No significant main effect of group (F1,57 = 1.86,
p = 0.165), condition (F1,57 = 1.44, p = 0.706) or site
(F1,57 = 1.43, p = 0.240) and no significant group-by-
condition interaction emerged for TBR (F1,57 = 0.70,
p = 0.503).
Discussion
In this study investigating the relationship of EEG indices
of cortical activity in women with ADHD, women with BD
and control women, both ADHD and BD participants
showed higher absolute theta power than controls during
the resting-state condition. No significant differences
emerged between the two clinical groups. While control
participants showed a task-related increase in absolute
theta activity from resting-state to cognitive task, no
●
●
●
●
●
●
●
●
−1.2
−1.0
−0.8
−0.6
−0.4
EO CPT−OXCondition
Mea
n ab
solu
te th
eta
pow
er (µ
V2 )
Group●●
●
●
ADHDBDControl
Fig. 2 Mean absolute theta
power across resting-state (EO)
and task (CPT-OX) condition in
the bipolar disorder (dotted line
with triangular marker), ADHD
(solid line with round marker)
and control groups (dashed line
with square marker). Error bars
represent 95 % confidence
intervals
Brain Topogr
123

significant changes in absolute theta power were observed
in the ADHD or BD groups. Our results provide evidence
for commonalities in brain dysfunction between ADHD
and BD. Absolute theta power may act as a marker of
neurobiological processes in both disorders.
Both the ADHD and BD groups showed an elevation of
absolute theta power during the resting-state condition,
compared to controls. To date, no study has directly
compared the cortical activity patterns of individuals with
ADHD and BD. This finding suggests commonalities in
oscillation patters between women with ADHD and BD.
The lack of significant differences between the clinical
groups adds to previous research, which has shown an
elevation of theta power during resting-state conditions
independently in individuals with ADHD (Bresnahan et al.
1999; Bresnahan and Barry 2002; Clarke et al. 2003, 2006;
Snyder and Hall 2006; Clarke et al. 2008; Koehler et al.
2009) and in individuals with BD (Degabriele and Lago-
poulos 2009), compared to controls. It is not fully under-
stood what increased theta power in individuals with
ADHD and BD during resting-state conditions represents.
The findings of elevated resting theta power in younger
compared to older neurotypical children (Benninger et al.
1984; Gasser et al. 1988a, 1988b) led to the development of
a maturational-lag hypothesis (Kinsbourne 1973). This
hypothesis holds that that there is a delay in central nervous
system (CNS) development in individuals with ADHD
because during neurotypical CNS maturation slow wave
activity is replaced with fast wave activity. Yet, our and
other research demonstrating elevated theta power in ado-
lescents and adults with ADHD (Bresnahan et al. 1999;
Bresnahan and Barry 2002; Clarke et al. 2008; Koehler
et al. 2009; Kitsune et al. 2015; Skirrow et al. 2015) and
BD (Degabriele and Lagopoulos 2009) do not support this
hypothesis. Increased theta power in individuals with
ADHD during resting-state conditions has also been
interpreted as representing hypo-arousal (Satterfield and
Dawson 1971; Lubar 1991). Yet, two studies investigating
the relationship between resting EEG power and skin
conductance level (a traditional marker of CNS arousal) in
children with and without ADHD linked increased alpha
rather than theta to under-arousal as indexed by skin con-
ductance level (Barry et al. 2004, 2009). While the sig-
nificance of increased theta power during resting-state
conditions remains to be fully elucidated, our findings may
suggest a role for absolute theta power as a common
marker of neurobiological processes in both ADHD and
BD. This is in line with findings from quantitative genetics
studies, which have found strong phenotypic and genetic
links between ADHD and abnormal theta activity, sug-
gesting it may be a biological marker or intermediate
phenotype (endophenotype) for ADHD (McLoughlin et al.
2014; Tye et al. 2014).
In addition, no differences in EEG power were observed
between the three groups during the cognitive task condi-
tion, even when specific aspects of stimulus and response
processing were investigated separately, and no change in
absolute theta power from resting-state to task condition in
the clinical groups was found. Our study is the first to
investigate the QEEG profile of individuals with BD during
a cognitive task and to directly compare it to an ADHD
group. The findings, therefore, suggest commonalities in
brain dysfunction between ADHD and BD during this
cognitive task. Furthermore, this study is the first to
investigate the EEG patterns during both rest and task
condition in women with adult ADHD. The results support
our previous work in an all-male sample, which showed no
differences in cortical activation between controls and
individuals with ADHD during the CPT and no change in
spectral power from resting-state to cognitive task (Skirrow
et al. 2015); although, previous QEEG studies have yielded
inconsistent results such as elevated alpha (Swartwood
et al. 2003; Nazari et al. 2011) and theta (El-Sayed et al.
2002) power on switching to CPT from resting-state in
individuals with ADHD compared to controls. The seem-
ing lack of task-dependent modulation of absolute theta
power in ADHD and BD participants may potentially be
explained by abnormalities in the default mode network
(DMN), which is typically activated during resting-state
conditions and deactivated during task performance (Broyd
et al. 2009; Raichle 2010). Abnormalities in the DMN
during rest have been demonstrated for both ADHD and
BD (Ongur et al. 2010; Cortese et al. 2012). Yet, while
task-related modulation remains to be examined in BD, the
DMN has been found to be inadequately attenuated when
individuals with ADHD perform a task (Sonuga-Barke and
Castellanos 2007; Fassbender et al. 2009; Cortese et al.
2012). The absence of task-related changes in absolute
theta power in our sample of women with ADHD and BD,
as well as in previous research on ADHD (Skirrow et al.
2015), might therefore indicate inadequate attenuation of
the DMN. A recent review, summarising findings from
studies employing functional magnetic resonance imaging
and EEG simultaneously, provides support for this idea
(Nishida et al. 2015), by concluding that increased theta
power indexes decreased DMN activity. Consequently,
theta power may be vital to the attenuating processes
required for cognitive functioning.
Unlike previous research, this study did not find elevated
delta power in individuals with BD (Degabriele and
Lagopoulos 2009) or decreased beta activity and an
increased theta/beta ratio in individuals with ADHD
(Bresnahan et al. 1999; Bresnahan and Barry 2002; Clarke
et al. 2008; Koehler et al. 2009). These discrepancies may
be due to age and gender effects. Our all-female sample
had a mean age of 38 years and an age range of
Brain Topogr
123

20–52 years. As EEG power tends to decline with age
(Luchinger et al. 2011; Michels et al. 2013; Poil et al.
2014), this wide age range may have reduced power to
detect differences of smaller effect between the groups.
Yet, some recent studies have also failed to replicate pre-
vious findings of decreased beta power and an increased
theta/beta ratio in individuals with ADHD (Loo et al. 2009;
Ogrim et al. 2012; Liechti et al. 2013; Buyck and Wier-
sema 2014; Poil et al. 2014; Skirrow et al. 2015) and the
importance of an increased TBR as a marker of ADHD is
being contested (Arns et al. 2013; Lenartowicz and Loo
2014; Jeste et al. 2015; Arns et al. 2016). A recent meta-
analysis demonstrated that the reported effect size for TBR
abnormalities in ADHD showed a strong relationship with
year of publication, declining over time (Arns et al. 2013).
The paper proposes the trend for reduced sleep duration in
children across time, as well as sample and testing context
differences between studies as possible explanations.
Support for context effects comes from a study of resting-
state EEG power differences between recordings made at
the beginning and the end of a 1.5 h testing session in 76
adolescents and young adults with ADHD and 85 controls,
which showed elevated delta and theta power in the ADHD
group in the beginning and elevated beta power in the
ADHD group at the end of the testing session (Kitsune
et al. 2015).
Several limitations should be considered alongside these
results. Firstly, while participants were asked to come off
stimulant medication 48 h before the assessment, partici-
pants were not asked to discontinue mood-stabilising, anti-
psychotic or anti-depressant medication for ethical reasons.
Although the understanding of the effects of medications
on QEEG is still limited, no significant differences between
medicated and unmedicated individuals with euthymic BD
on QEEG have been found (El-Badri et al. 2001; Degab-
riele and Lagopoulos 2009). It is, therefore, unlikely that
the results in this study were produced by medication
effects. Secondly, this investigation was conducted in a
homogenous all-female sample. Our results support previ-
ous work in an all-male sample, which showed no differ-
ences in cortical activation between controls and
individuals with ADHD during the CPT and no change in
spectral power from EO to CPT (Skirrow et al. 2015).
Nevertheless, future studies are needed to replicate these
findings in more typical adult ADHD and BD populations
with approximately equal distribution of males and females
(Biederman et al. 2004; Ayuso-Mateos 2006; Rucklidge
2010). Finally, two experimental conditions with different
durations (3 min in EO and 11 min in CPT-OX) were
compared in this study. It is possible that these discrepant
experimental timings might have affected the result. Yet,
segmenting the CPT-OX based on stimulus-locked epochs
(Cue, Go and NoGo) resulted in similar findings,
suggesting that the duration of the two experimental con-
ditions is unlikely to have an impact on the results.
Our results provide evidence for commonalities in brain
dysfunction between ADHD and BD, with absolute theta
power potentially playing a role as a marker of shared
neurobiological processes in both disorders. In light of
shared cognitive impairments and the overlapping symp-
tomatology of ADHD and BD, these findings represent a
move towards uncovering biological markers underlying
the pathophysiology shared between the disorders. Cur-
rently, diagnostic manuals such as the DSM (American
Psychiatric Association 2000, 2013) outline clinical diag-
noses in a categorical system based on the description of
behavioural symptoms. Yet, research has revealed sub-
stantial evidence for pathophysiological heterogeneity
within disorders (Sjowall et al. 2013; Burdick et al. 2015;
Jeste et al. 2015), as well as pathogenic overlap between
disorders (Lee et al. 2013; Michelini et al. 2016). Conse-
quently, diagnostic boundaries based on behavioural
symptoms do not seem to correspond seamlessly to find-
ings from neuropsychological and genetic studies, and have
been only moderately successful at predicting treatment
outcome (Insel et al. 2010; Retz and Retz-Junginger 2014;
Ostacher et al. 2015). Future studies should build on the
results from this and similar studies to understand the
relationship between behaviour, neurophysiology and the
genome to identify syndromes based on pathophysiology.
This could lead to more objective and precise approaches
to diagnosis and prognosis and may eventually result in
improved interventions and long-term outcome (Casey
et al. 2014).
Acknowledgments We thank all who make this research possible:
The National Adult ADHD Clinic at the South London and Maudsley
Hospital, Dr. Helen Costello, Prof. Sophia Frangou, Prof. Anne
Farmer, Jessica Deadman, Hannah Collyer, Sarah-Jane Gregori, and
all participants who contributed their time to the study.
Funding Anna-Sophie Rommel is supported by a 1 ? 3 Medical
Research Council studentship (MR/J500380/1). Glenn Kitsune is
supported by an Economic and Social Research Council studentship
(ES/100971X/1). This paper represents independent research part
funded by the National Institute for Health Research (NIHR)
Biomedical Research Centre for Mental Health at South London and
Maudsley NHS Foundation Trust and Institute of Psychiatry, Psy-
chology and Neuroscience, King’s College London and Dementia Unit
at South London and Maudsley NHS Foundation Trust and King’s
College London. The views expressed are those of the author(s) and not
necessarily those of the NHS, the NIHR or the Department of Health.
Compliance with Ethical Standards
Conflict of Interest Philip Asherson has received funding for
research by Vifor Pharma, and has given sponsored talks and been an
advisor for Shire, Janssen–Cilag, Eli-Lilly, Flynn Pharma and Pfizer,
regarding the diagnosis and treatment of ADHD. All funds are
received by King’s College London and used for studies of ADHD.
The other authors report no conflicts of interest.
Brain Topogr
123

Ethical approval All procedures performed in studies involving
human participants were in accordance with the ethical standards of
the Camberwell St Giles Research Ethics Committee (approval
number 11/LO/0438) and with the 1964 Helsinki declaration and its
later amendments or comparable ethical standards.
Informed consent Informed consent was obtained from all individ-
ual participants included in the study.
Open Access This article is distributed under the terms of the
Creative Commons Attribution 4.0 International License (http://crea
tivecommons.org/licenses/by/4.0/), which permits unrestricted use,
distribution, and reproduction in any medium, provided you give
appropriate credit to the original author(s) and the source, provide a
link to the Creative Commons license, and indicate if changes were
made.
References
Adleman NE, Yi JY, Deveney CM et al (2014) Increased intrasubject
variability in response time in unaffected preschoolers at familial
risk for bipolar disorder. Psychiatry Res 219:687–689. doi:10.
1016/j.psychres.2014.06.047
Altman EG, Hedeker D, Peterson JL, Davis JM (1997) The altman
self-rating mania scale. Biol Psychiatry 42:948–955. doi:10.
1016/S0006-3223(96)00548-3
American Psychiatric Association (2000) Diagnostic and statistical
manual of mental disorders, 4th edn. American Psychiatric
Association, Washington
American Psychiatric Association (2013) Diagnostic and statistical
manual of mental disorders, 5th edn. American Psychiatric
Association, Washington
Arns M, Conners CK, Kraemer HC (2013) A decade of EEG
theta/beta ratio research in ADHD: a meta-analysis. J Atten
Disord 17:374–383. doi:10.1177/1087054712460087
Arns M, Loo SK, Sterman MB et al (2016) Editorial perspective: how
should child psychologists and psychiatrists interpret FDA
device approval? Caveat emptor. J Child Psychol Psychiatry
57:656–658. doi:10.1111/jcpp.12524
Arts B, Jabben N, Krabbendam L, van Os J (2008) Meta-analyses of
cognitive functioning in euthymic bipolar patients and their first-
degree relatives. Psychol Med 38:771–785
Asherson P, Young AH, Eich-Hochli D et al (2014) Differential
diagnosis, comorbidity, and treatment of attention-deficit/hyper-
activity disorder in relation to bipolar disorder or borderline
personality disorder in adults. Curr Med Res Opin
30:1657–1672. doi:10.1185/03007995.2014.915800
Ayuso-Mateos J (2006) Global burden of bipolar disorder in the year
2000. In: World Heal. Organ. http://www.who.int/healthinfo/
statistics/bod_bipolar.pdf. Accessed 22 May 2015
Banaschewski T, Brandeis D (2007) Annotation: what electrical brain
activity tells us about brain function that other techniques cannot
tell us—a child psychiatric perspective. J Child Psychol
Psychiatry 48:415–435. doi:10.1111/j.1469-7610.2006.01681.x
Barry RJ, Clarke AR, McCarthy R et al (2004) EEG differences in
children as a function of resting-state arousal level. Clin
Neurophysiol 115:402–408
Barry RJ, Clarke AR, Johnstone SJ et al (2007) EEG differences
between eyes-closed and eyes-open resting conditions. Clin
Neurophysiol 118:2765–2773. doi:10.1016/j.clinph.2007.07.028
Barry RJ, Clarke AR, Johnstone SJ et al (2009) Electroencephalogram
theta/beta ratio and arousal in attention-deficit/hyperactivity
disorder: evidence of independent processes. Biol Psychiatry
66:398–401. doi:10.1016/j.biopsych.2009.04.027
Basar E, Guntekin B, Atagun I et al (2012) Brain’s alpha activity is
highly reduced in euthymic bipolar disorder patients. Cogn
Neurodyn 6:11–20. doi:10.1007/s11571-011-9172-y
Beck AT, Steer RA, Ball R, Ranieri W (1996) Comparison of beck
depression inventories -IA and -II in psychiatric outpatients.
J Pers Assess 67:588–597. doi:10.1207/s15327752jpa6703_13
Benninger C, Matthis P, Scheffner D (1984) EEG development of
healthy boys and girls. results of a longitudinal study. Elec-
troencephalogr Clin Neurophysiol 57:1–12. doi:10.1016/0013-
4694(84)90002-6
Biederman J, Faraone SV, Monuteaux MC et al (2004) Gender effects
on attention-deficit/hyperactivity disorder in adults, revisited.
Biol Psychiatry 55:692–700. doi:10.1016/j.biopsych.2003.12.
003
Boutros N, Fraenkel L, Feingold A (2005) A four-step approach for
developing diagnostic tests in psychiatry: EEG in ADHD as a
test case. J Neuropsychitary Clin Neurosci 17(4):455–464
Bresnahan SM, Barry RJ (2002) Specificity of quantitative EEG
analysis in adults with attention deficit hyperactivity disorder.
Psychiatry Res 112:133–144. doi:10.1016/S0165-1781(02)001
90-7
Bresnahan SM, Anderson JW, Barry RJ (1999) Age-related changes
in quantitative EEG in attention-deficit/hyperactivity disorder.
Biol Psychiatry 46:1690–1697. doi:10.1016/S0006-3223(99)000
42-6
Brotman MA, Rooney MH, Skup M et al (2009) Increased
intrasubject variability in response time in youths with bipolar
disorder and at-risk family members. J Am Acad Child Adolesc
Psychiatry 48:628–635. doi:10.1097/CHI.0b013e3181a27527
Broyd SJ, Demanuele C, Debener S et al (2009) Default-mode brain
dysfunction in mental disorders: a systematic review. Neurosci
Biobehav Rev 33:279–296. doi:10.1016/j.neubiorev.2008.09.002
Burdick KE, Ketter TA, Goldberg JF, Calabrese JR (2015) Assessing
cognitive function in bipolar disorder: challenges and recom-
mendations for clinical trial design. J Clin Psychiatry 76:e342–
e350. doi:10.4088/JCP.14cs09399
Buyck I, Wiersema JR (2014) Resting electroencephalogram in
attention deficit hyperactivity disorder: developmental course
and diagnostic value. Psychiatry Res 216:391–397. doi:10.1016/
j.psychres.2013.12.055
Casey BJ, Oliveri ME, Insel T (2014) A neurodevelopmental
perspective on the research domain criteria (RDoC) framework.
Biol Psychiatry 76:350–353. doi:10.1016/j.biopsych.2014.01.
006
Clarke AR, Barry RJ, McCarthy R et al (2003) EEG activity in girls
with attention-deficit/hyperactivity disorder. Clin Neurophysiol
114:319–328. doi:10.1016/S1388-2457(02)00364-4
Clarke AR, Barry RJ, McCarthy R et al (2006) Quantitative EEG in
low-IQ children with attention-deficit/hyperactivity disorder.
Clin Neurophysiol 117:1708–1714. doi:10.1016/j.clinph.2006.
04.015
Clarke AR, Barry RJ, Heaven PCL et al (2008) EEG in adults with
attention-deficit/hyperactivity disorder. Int J Psychophysiol
70:176–183. doi:10.1016/j.ijpsycho.2008.07.001
Clementz BA, Sponheim SR, Iacono WG, Beiser M (1994) Resting
EEG in first-episode schizophrenia patients, bipolar psychosis
patients, and their first-degree relatives. Psychophysiology
31:486–494
Cohen J (1988) Statistical power analysis for the behavioral sciences.
L. Erlbaum Associates, Hillsdale
Cooper RE, Skirrow C, Tye C et al (2014) The effect of
methylphenidate on very low frequency electroencephalography
oscillations in adult ADHD. Brain Cogn 86:82–89
Brain Topogr
123

Cortese S, Kelly C, Chabernaud C et al (2012) Toward systems
neuroscience of ADHD: a meta-analysis of 55 fMRI studies. Am
J Psychiatry 169:1–18. doi:10.1176/appi.ajp.2012.11101521
Degabriele R, Lagopoulos J (2009) A review of EEG and ERP studies
in bipolar disorder. Acta Neuropsychiatr 21:58–66. doi:10.1111/
j.1601-5215.2009.00359.x
Doehnert M, Brandeis D, Imhof K et al (2010) Mapping attention-
deficit/hyperactivity disorder from childhood to adolescence–no
neurophysiologic evidence for a developmental lag of attention
but some for inhibition. Biol Psychiatry 67:608–616. doi:10.
1016/j.biopsych.2009.07.038
El-Badri SM, Ashton CH, Moore PB et al (2001) Electrophysiological
and cognitive function in young euthymic patients with bipolar
affective disorder. Bipolar Disord 3:79–87
El-Sayed E, Larsson J-O, Persson HE, Rydelius P-A (2002) Altered
cortical activity in children with attention-deficit/hyperactivity
disorder during attentional load task. J Am Acad Child Adolesc
Psychiatry 41:811–819. doi:10.1097/00004583-200207000-
00013
Fassbender C, Zhang H, Buzy WM et al (2009) A lack of default
network suppression is linked to increased distractibility in
ADHD. Brain Res 1273:114–128. doi:10.1016/j.brainres.2009.
02.070
Galanter CA, Leibenluft E (2008) Frontiers between attention deficit
hyperactivity disorder and bipolar disorder. Child Adolesc
Psychiatr Clin N Am 17:325–346. doi:10.1016/j.chc.2007.11.
001
Gasser T, Jennen-Steinmetz C, Sroka L et al (1988a) Development of
the EEG of school-age children and adolescents II topography.
Electroencephalogr Clin Neurophysiol 69:100–109. doi:10.1016/
0013-4694(88)90205-2
Gasser T, Verleger R, Bacher P, Sroka L (1988b) Development of the
EEG of school-age children and adolescents. I, analysis of band
power. Electroencephalogr Clin Neurophysiol 69:91–99. doi:10.
1016/0013-4694(88)90204-0
Henry BL, Minassian A, Patt VM et al (2013) Inhibitory deficits in
euthymic bipolar disorder patients assessed in the human
behavioral pattern monitor. J Affect Disord 150:948–954.
doi:10.1016/j.jad.2013.05.020
Hosang GM, Uher R, Maughan B et al (2012) The role of loss and
danger events in symptom exacerbation in bipolar disorder.
J Psychiatr Res 46:1584–1589. doi:10.1016/j.jpsychires.2012.07.
009
Insel T, Cuthbert B, Garvey M et al (2010) Research domain criteria
(RDoC): toward a new classification framework for research on
mental disorders. Am J Psychiatry 167:748–751. doi:10.1176/
appi.ajp.2010.09091379
Jeste SS, Frohlich J, Loo SK (2015) Electrophysiological biomarkers
of diagnosis and outcome in neurodevelopmental disorders. Curr
Opin Neurol 28:110–116. doi:10.1097/WCO.00000000000001
81
Jung TP, Makeig S, Humphries C et al (2000) Removing electroen-
cephalographic artifacts by blind source separation. Psychophys-
iology 37:163–178
Kent L, Craddock N (2003) Is there a relationship between attention
deficit hyperactivity disorder and bipolar disorder? J Affect
Disord 73:211–221
Kinsbourne M (1973) Minimal brain dysfunction as a neurodevelop-
mental lag. Ann N Y Acad Sci 205:268–273
Kitsune GL, Cheung CHM, Brandeis D et al (2015) A matter of time:
the influence of recording context on EEG spectral power in
adolescents and young adults with ADHD. Brain Topogr
28:580–590. doi:10.1007/s10548-014-0395-1
Koehler S, Lauer P, Schreppel T et al (2009) Increased EEG power
density in alpha and theta bands in adult ADHD patients.
J Neural Transm 116:97–104. doi:10.1007/s00702-008-0157-x
Kooij J, Francken M (2007) Diagnostic interview for ADHD (DIVA)
in adults. In: www.divacentre.eu
Kuntsi J, Klein C (2012) Intraindividual variability in ADHD and its
implications for research of causal links. Curr Top Behav
Neurosci 9:67–91. doi:10.1007/7854_2011_145
Kuntsi J, Wood AC, Rijsdijk F et al (2010) Separation of cognitive
impairments in attention-deficit/hyperactivity disorder into 2
familial factors. Arch Gen Psychiatry 67:1159–1167
Lee SH, Ripke S, Neale BM et al (2013) Genetic relationship between
five psychiatric disorders estimated from genome-wide SNPs.
Nat Genet 45:984–994. doi:10.1038/ng.2711
Lenartowicz A, Loo SK (2014) Use of EEG to diagnose ADHD. Curr
Psychiatry Rep 16:498. doi:10.1007/s11920-014-0498-0
Liechti MD, Valko L, Muller UC et al (2013) Diagnostic value of
resting electroencephalogram in attention-deficit/hyperactivity
disorder across the lifespan. Brain Topogr 26:135–151. doi:10.
1007/s10548-012-0258-6
Loo SK, Hale TS, Macion J et al (2009) Cortical activity patterns in
ADHD during arousal, activation and sustained attention.
Neuropsychologia 47:2114–2119. doi:10.1016/j.neuropsycholo
gia.2009.04.013
Lubar JF (1991) Discourse on the development of EEG diagnostics
and biofeedback for attention-deficit/hyperactivity disorders.
Biofeedback Self Regul 16:201–225. doi:10.1007/BF01000016
Luchinger R, Michels L, Martin E, Brandeis D (2011) EEG–BOLD
correlations during (post-) adolescent brain maturation. Neu-
roimage 56:1493–1505. doi:10.1016/j.neuroimage.2011.02.050
McLoughlin G, Albrecht B, Banaschewski T et al (2010) Electro-
physiological evidence for abnormal preparatory states and
inhibitory processing in adult ADHD. Behav Brain Funct 6:66.
doi:10.1186/1744-9081-6-66
McLoughlin G, Asherson P, Albrecht B et al (2011) Cognitive-
electrophysiological indices of attentional and inhibitory pro-
cessing in adults with ADHD: familial effects. Behav Brain
Funct 7:26
McLoughlin G, Palmer JA, Rijsdijk F, Makeig S (2014) Genetic
overlap between evoked frontocentral theta-band phase variabil-
ity, reaction time variability, and attention-deficit/hyperactivity
disorder symptoms in a twin study. Biol Psychiatry 75:238–247
Merikangas KR, Jin R, He J-P et al (2011) Prevalence and correlates
of bipolar spectrum disorder in the world mental health survey
initiative. Arch Gen Psychiatry 68:241–251. doi:10.1001/arch
genpsychiatry.2011.12
Michelini G, Kitsune GL, Hosang GM et al (2016) Disorder-specific
and shared neurophysiological impairments of attention and
inhibition in women with attention-deficit/hyperactivity disorder
and women with bipolar disorder. Psychol Med 46:1–12. doi:10.
1017/S0033291715001877
Michels L, Muthuraman M, Luchinger R et al (2013) Developmental
changes of functional and directed resting-state connectivities
associated with neuronal oscillations in EEG. Neuroimage
81:231–242. doi:10.1016/j.neuroimage.2013.04.030
Najt P, Perez J, Sanches M et al (2007) Impulsivity and bipolar
disorder. Eur Neuropsychopharmacol 17:313–320. doi:10.1016/
j.euroneuro.2006.10.002
Nazari MA, Wallois F, Aarabi A, Berquin P (2011) Dynamic changes
in quantitative electroencephalogram during continuous perfor-
mance test in children with attention-deficit/hyperactivity disor-
der. Int J Psychophysiol 81:230–236. doi:10.1016/j.ijpsycho.
2011.06.016
Newman AL, Meyer TD (2014) Impulsivity: present during euthymia
in bipolar disorder?—a systematic review. Int J Bipolar Disord
2:2. doi:10.1186/2194-7511-2-2
Nigg JT (2013) Attention deficits and hyperactivity-impulsivity: what
have we learned, what next? Dev Psychopathol 25:1489–1503.
doi:10.1017/S0954579413000734
Brain Topogr
123

Nishida K, Razavi N, Jann K et al (2015) Integrating different aspects
of resting brain activity: a review of electroencephalographic
signatures in resting state networks derived from functional
magnetic resonance imaging. Neuropsychobiology 71:6–16.
doi:10.1159/000363342
Ogrim G, Kropotov J, Hestad K (2012) The quantitative EEG
theta/beta ratio in attention deficit/hyperactivity disorder and
normal controls: sensitivity, specificity, and behavioral corre-
lates. Psychiatry Res 198:482–488. doi:10.1016/j.psychres.2011.
12.041
Ongur D, Lundy M, Greenhouse I et al (2010) Default mode network
abnormalities in bipolar disorder and schizophrenia. Psychiatry
Res 183:59–68. doi:10.1016/j.pscychresns.2010.04.008
Ostacher MJ, Suppes T, Swann AC et al (2015) Patterns of response
to aripiprazole, lithium, haloperidol, and placebo across factor
scores of mania. Int J bipolar Disord 3:11. doi:10.1186/s40345-
015-0026-0
Peluso MAM, Hatch JP, Glahn DC et al (2007) Trait impulsivity in
patients with mood disorders. J Affect Disord 100:227–231.
doi:10.1016/j.jad.2006.09.037
Poil S-S, Bollmann S, Ghisleni C et al (2014) Age dependent
electroencephalographic changes in attention-deficit/hyperactiv-
ity disorder (ADHD). Clin Neurophysiol 125:1626–1638. doi:10.
1016/j.clinph.2013.12.118
Raichle ME (2010) Two views of brain function. Trends Cogn Sci
14:180–190. doi:10.1016/j.tics.2010.01.008
Retz W, Retz-Junginger P (2014) Prediction of methylphenidate
treatment outcome in adults with attention-deficit/hyperactivity
disorder (ADHD). Eur Arch Psychiatry Clin Neurosci
264(1):S35–S43. doi:10.1007/s00406-014-0542-4
Robinson LJ, Ferrier IN (2006) Evolution of cognitive impairment in
bipolar disorder: a systematic review of cross-sectional evidence.
Bipolar Disord 8:103–116. doi:10.1111/j.1399-5618.2006.
00277.x
Rucklidge JJ (2010) Gender differences in attention-deficit/hyperac-
tivity disorder. Psychiatr Clin N Am 33:357–373. doi:10.1016/j.
psc.2010.01.006
Satterfield JH, Dawson ME (1971) Electrodermal correlates of
hyperactivity in children. Psychophysiology 8:191–197
Sjowall D, Roth L, Lindqvist S, Thorell LB (2013) Multiple deficits in
ADHD: executive dysfunction, delay aversion, reaction time
variability, and emotional deficits. J Child Psychol Psychiatry
54:619–627. doi:10.1111/jcpp.12006
Skirrow C, Hosang GM, Farmer AE, Asherson P (2012) An update on
the debated association between ADHD and bipolar disorder
across the lifespan. J Affect Disord 141:143–159. doi:10.1016/j.
jad.2012.04.003
Skirrow C, Ebner-Priemer U, Reinhard I et al (2014) Everyday
emotional experience of adults with attention deficit hyperac-
tivity disorder: evidence for reactive and endogenous emotional
lability. Psychol Med 44:3571–3583. doi:10.1017/
S0033291714001032
Skirrow C, McLoughlin G, Banaschewski T et al (2015) Normali-
sation of frontal theta activity following methylphenidate
treatment in adult attention-deficit/hyperactivity disorder. Eur
Neuropsychopharmacol 25:85–94. doi:10.1016/j.euroneuro.
2014.09.015
Snyder SM, Hall JR (2006) A meta-analysis of quantitative EEG
power associated with attention-deficit hyperactivity disorder.
J Clin Neurophysiol 23:440–455. doi:10.1097/01.wnp.
0000221363.12503.78
Sonuga-Barke EJS, Castellanos FX (2007) Spontaneous attentional
fluctuations in impaired states and pathological conditions: a
neurobiological hypothesis. Neurosci Biobehav Rev 31:977–986.
doi:10.1016/j.neubiorev.2007.02.005
Swartwood JN, Swartwood MO, Lubar JF, Timmermann DL (2003)
EEG differences in ADHD-combined type during baseline and
cognitive tasks. Pediatr Neurol 28:199–204. doi:10.1016/S0887-
8994(02)00514-3
Torralva T, Gleichgerrcht E, Torrente F et al (2011) Neuropsycho-
logical functioning in adult bipolar disorder and ADHD patients:
a comparative study. Psychiatry Res 186:261–266. doi:10.1016/
j.psychres.2010.08.007
Torres IJ, Boudreau VG, Yatham LN (2007) Neuropsychological
functioning in euthymic bipolar disorder: a meta-analysis. Acta
Psychiatr Scand 116:17–26. doi:10.1111/j.1600-0447.2007.
01055.x
Tye C, Rijsdijk F, McLoughlin G (2014) Genetic overlap between
ADHD symptoms and EEG theta power. Brain Cogn
87:168–172. doi:10.1016/j.bandc.2014.03.010
Wechsler D (1999) Wechsler Abbreviated Scale of Intelligence
(WASI) manual. Psychological Corporation, San Antonio
Willcutt EG (2012) The prevalence of DSM-IV attention-deficit/
hyperactivity disorder: a meta-analytic review. Neurotherapeu-
tics 9:490–499. doi:10.1007/s13311-012-0135-8
Yeung N, Cohen JD (2006) The impact of cognitive deficits on
conflict monitoring. Predictable dissociations between the error-
related negativity and N2. Psychol Sci 17:164–171. doi:10.1111/
j.1467-9280.2006.01680.x
Young RC, Biggs JT, Ziegler VE, Meyer DA (1978) A rating scale
for mania: reliability, validity and sensitivity. Br J Psychiatry
133:429–435. doi:10.1192/bjp.133.5.429
Brain Topogr
123