Controller / Evaluator Briefing Controller / Evaluator Briefing.
Upload
nguyenkhanhCategory
view
215download
0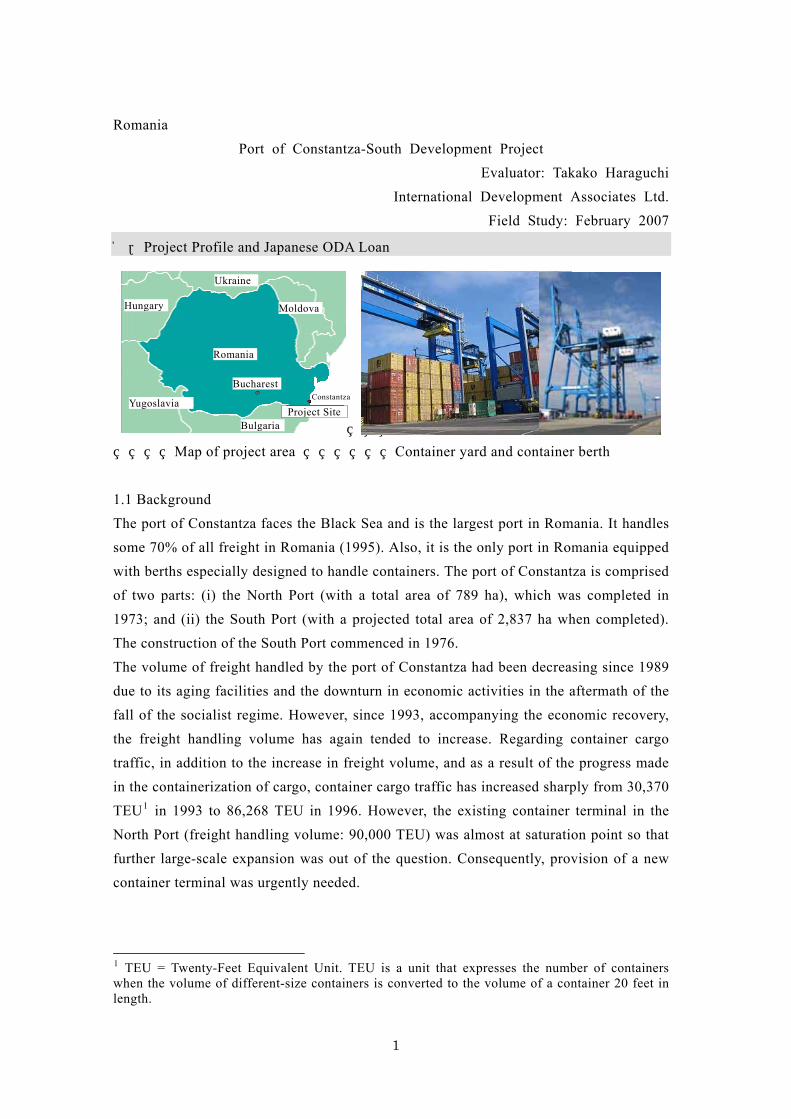
Romania Port of Constantza-South Development Project
Evaluator: Takako Haraguchi International Development Associates Ltd.
Field Study: February 2007
1.Project Profile and Japanese ODA Loan
H
R
Y a
Map of 1.1 Background The port of Conssome 70% of allwith berths especof two parts: (i)1973; and (ii) thThe constructionThe volume of fdue to its aging fall of the socialthe freight handtraffic, in additioin the containeriTEU1 in 1993 toNorth Port (freigfurther large-scacontainer termin 1 TEU = Twenty-when the volume length.
Ukraine
a
B t tza
ugoslavi
a
project ar
tantza fac freight in ially desig
the Northe South P of the Soureight handfacilities aist regimeling volumn to the in
zation of c
86,268 Tht handlinle expansial was urge
Feet Equivof different
Moldov
Bulgarie
esRn ortl
n.
car
Egonn
al-s
Constan
Project Site
uchares
omania
ungary
a Container yard and container berth
the Black Sea and is the largest port in Romania. It handles omania (1995). Also, it is the only port in Romania equipped ed to handle containers. The port of Constantza is comprised
Port (with a total area of 789 ha), which was completed in t (with a projected total area of 2,837 ha when completed). h Port commenced in 1976. ed by the port of Constantza had been decreasing since 1989 d the downturn in economic activities in the aftermath of the However, since 1993, accompanying the economic recovery, e has again tended to increase. Regarding container cargo rease in freight volume, and as a result of the progress made go, container cargo traffic has increased sharply from 30,370
U in 1996. However, the existing container terminal in the volume: 90,000 TEU) was almost at saturation point so that was out of the question. Consequently, provision of a new tly needed.
ent Unit. TEU is a unit that expresses the number of containers ize containers is converted to the volume of a container 20 feet in
1

1.2 Objective This project’s objective was to contribute to the economic development of Romania by meeting the demand generated by the sharp increase in the country’s container cargo traffic by developing the container terminal at Pier 2 of the South-Port zone in the port of Constantza (Romania’s largest trading port facing the Black Sea) and its related facilities.
1.3 Borrower/Executive Agency: Romania/National Company Maritime Ports Administration SA Constantza (Hereinafter referred to as “MPAC”) 1.4 Outline of Loan Agreement
Loan Amount/Loan Disbursed Amount 12.8 billion JPY/9.302 billion JPY
Exchange of Notes/Loan Agreement July 1997/February1998
Terms and Conditions -Interest Rate -Repayment Period (Grace Period) -Procurement
2.7% (consultant portion: 2.3%)
30 years (10 years) Generally untied
Final Disbursement Date January 2005
Main Contractors PENTA-OCEAN CONSTRUCTION CO., LTD. (Japan) / MITSUBISHI HEAVY
INDUSTRIES LTD. (Japan)・TOMEN Corporation (Japan) (JV)
Consulting Services Pacific Consultants International(Japan)
Feasibility Study (F/S), etc. 1994: The Government of Romania 1996: JBIC
2. Evaluation Result (Rating: A) 2.1 Relevance (Rating: a) The project is judged to be highly relevant for two reasons: (i) it is consistent with Romania’s development policy and measures; and (ii) there is a strong demand for container shipping. 2.1.1 Relevance as seen from Romania’s development policy, measures, etc. After Romania became a democratic nation, economic reform went into full effect with the launch of a new government in 19962. In that process, development of the economic 2 Right-of-center CDR (Romanian Democratic Convention) became the No. 1 political party in Romania, and its candidate, Emil Constantinescu, was elected president, thus making the new
2

infrastructure has consistently been treated as an important issue. In January 2007, Romania joined the EU, and as a result Romania came to promote its socio-economic development in line with the framework of the EU’s regional development. For instance, in the “2007–2013 Romanian National Strategic Reference Framework3” (NSRF) (2006), Romania’s basic policy for economic development, developing the country’s economic infrastructure in accordance with EU standards is considered a top priority. In addition, the “2007–2013 Transportation Sector Operation Program,” established in line with NSRF, strives to modernize Romania’s infrastructure with a view to creating a uniform transportation network throughout Europe. Improving access to the port of Constantza both within Romania and from its neighbouring countries is considered the most prominent individual goal Romania has set for itself. Thus the strategic importance of the port of Constantza is clearly demonstrated.
2.1.2 Relevance in terms of freight and container demand The total cargo handled in Romania more than doubled from 1994 to 2005, of which transport by water increased by more than 5 fold (see Table 1). In the period from 1997 to 2005, container cargo traffic in the world’s 10 major ports roughly doubled4, while that in the Black Sea region5 increased by about 7 fold and by more than 8 fold in the port of Constantza, attesting to the robust growth of the demand for container transport (see Table 2). 6 As discussed in “1.1 Background,” in light of the state of saturation at thePort, it can be said that, to meet the growing need fonew terminal in the port of Constantza has intensified
DomestiWater traSource:
Total hanworld’s Total of in BlackTotal coof the poSource:
government the first one in Romania not linked to the form3 Established on the basis of the National DevelopmentGuidelines (2005, the basic regional policy document). 4 World’s 10 major ports are (in 2005, in the order of coKong, Shanghai, Shenzhen, Pusan, Gaoxiong (Taiwan), Angeles. 5 Container ports along the coast of the Black Sea (in 2005Constantza, Illichivsk (Ukraine), Odessa (Ukraine), Novo(Bulgaria), and Bourgas (Bulgaria). 6 For more detail on container cargo traffic in the port of C
3
Table 1.Romania’s Total Cargo (unit: 1,000 tons)
1994 2005 c freight handling 243,875 497,152nsportation 11,253 60,632
Ministry of Transport
Table 2. Container cargo traffic
(unit: 1,000 TEU)1997 2005
dling volume at 10 major ports
6,030 13,380
container volume Sea
130 920
ntainer cargo traffic rt of Constantza
90 770
MPAC, etc.
existing container terminal at North r container transport, the need for a .
er Communist Party.
Program (2005) and the EU Strategic
ntainer cargo traffic): Singapore, Hong Rotterdam, Hamburg, Dubai, and Los
, in the order of container cargo traffic): rossiysk (Russia), Poti (Georgia), Varna
onstantza, see “2.3 Effectiveness.”

2.1.3 The priority of the projects in the master plan The plan to build a container terminal in the port of Constantza-South was part of the South-Port Development Master Plan that was adopted in 1993.7 According to a study conducted by JBIC in 1996, under the Master Plan, a container terminal was to be constructed in three phases in Pier 2, and this project corresponded to Phase I and a part of Phase II of the Master Plan. At the time of appraisal, the basic infrastructure for Pier 2 was already near completion, so it was an area in the port of Constantza where large port installations could be added with a relatively small amount of investment. Considering the aforesaid demand for container handling, the project was given high priority in the Master Plan. At the time of ex-post evaluation, the operator of the terminal (a private company) was planning/implementing a portion of the plan for Piers 2 which was not conducted under the project with its own funds. This development not only confirms the importance of the project but also recognizes the significance of improving facilities with public funding including ODA loans to attract private investment. 2.2 Efficiency (Rating: b) The project yielded more outputs than what were originally planned. The cost of achieving the outputs was within the amount originally planned, but the extension of the project period leads to the conclusion that the project was moderately efficient. 2.2.1 Outputs The outputs planned at the time of appraisal and the outputs that were actually achieved are given below. 79% of the cost of civil works was covered by the Japanese ODA loans, while the full cost of mechanical handling equipment as well as that of consulting services were covered by Japanese ODA loans.
(1) Civil works (i) Works of container wharf: In Pier 2, where the basic infrastructure work was
completed in the 1980s, among other work, the quay side was rehabilitated (the fender in Berths 121-123 were renewed, the crane rails were laid down, etc.) and the apron (about 30,000m2)8 was paved nearly as planned. The berths were 14.5 m in depth and 625 m in length. Pier 2 is big enough to allow two 40,000-ton
7 In the Master Plan, the following development plans were adopted: (i) the South breakwater zone that includes a container terminal (construction of Piers 1-3); (ii) the central artificial island zone (shore protection, dry bulk terminal, etc.); and (iii) the area for barge carriers. At the time of ex-post evaluation, (i) Pier 3, (ii) other than the “shore protection,” and (iii) were being planned. 8 Apron pavement includes Berth 124 in the northern end of Pier 2.
4
container vessels (Panamax class) to dock simultaneously. (ii) Ground leveling: Additional land reclamation, foundation improvement work,
and the like were carried out nearly as planned. (iii) Container yard improvement: Reinforcement, pavement, etc. were carried out
nearly as planned. The actual area of the improved container yard is 92,520 m2 as opposed to the planned area of 90,000 m2 (16,848 m2 of which is an empty container yard). The maximum number of containers that can be placed in the container yard is 9,942 TEU (1,500 TEU is empty).
(iv) Construction of in-harbor railroad and road: Engineering works for the extension portion to connect the container terminal to the existing railroads and roads in the port (800m of rail, 1,000 m of road) as well as a railroad terminal within the container terminal (2 pairs of 600 m long rails) were carried out nearly as planned. Furthermore, as additional work, a new access flyover (1,191-m long) was built at the grade crossing where a railroad intersects with the road that leads to the terminal. Also built was an additional pair of rails in the railroad terminal. These additional works were carried out to reduce congestion by front loading the plan originally set for implementation in Phase II of the Master Plan.
(v) Building construction: The main gate, container freight station,9 administration building, maintenance workshop, substations, etc. were constructed nearly as planned.
(vi) Utilities provision: Power, illumination, water and sewerage, drainage, communications, etc. were provided nearly as planned.
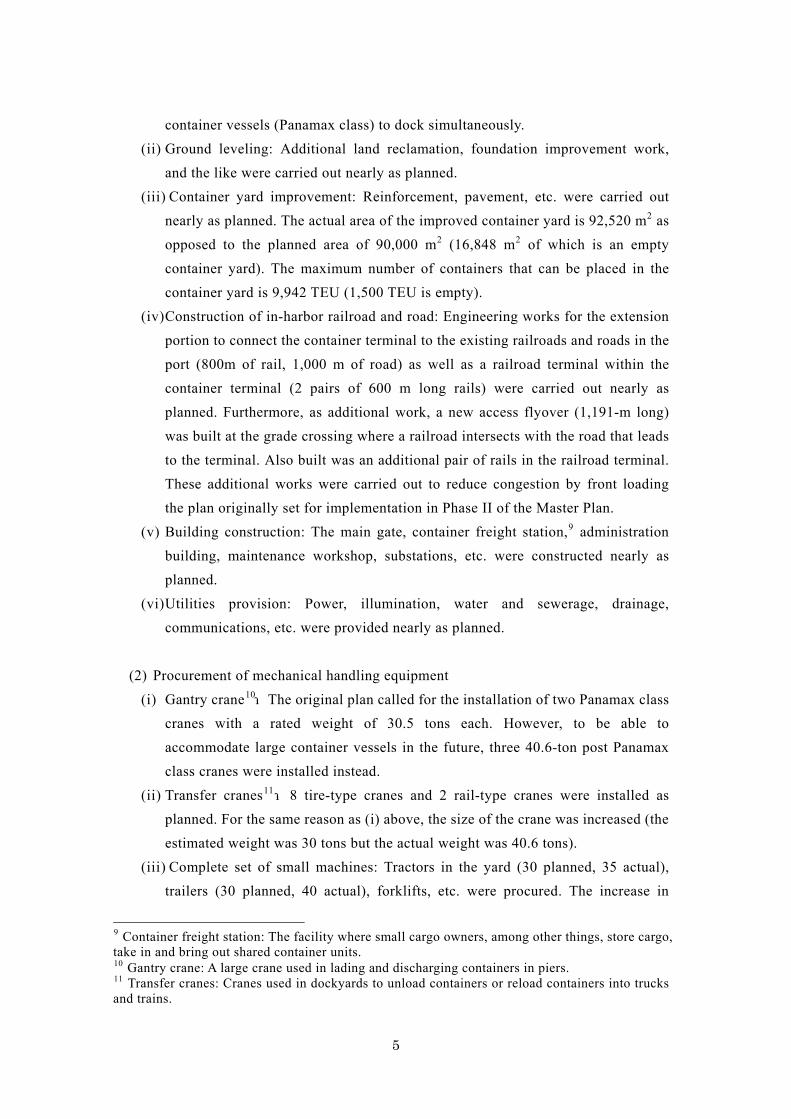
(2) Procurement of mechanical handling equipment
(i) Gantry crane10:The original plan called for the installation of two Panamax class cranes with a rated weight of 30.5 tons each. However, to be able to accommodate large container vessels in the future, three 40.6-ton post Panamax class cranes were installed instead.
(ii) Transfer cranes11:8 tire-type cranes and 2 rail-type cranes were installed as planned. For the same reason as (i) above, the size of the crane was increased (the estimated weight was 30 tons but the actual weight was 40.6 tons).
(iii) Complete set of small machines: Tractors in the yard (30 planned, 35 actual), trailers (30 planned, 40 actual), forklifts, etc. were procured. The increase in
9 Container freight station: The facility where small cargo owners, among other things, store cargo, take in and bring out shared container units. 10 Gantry crane: A large crane used in lading and discharging containers in piers. 11 Transfer cranes: Cranes used in dockyards to unload containers or reload containers into trucks and trains.
5

number resulted when the operation efficiency of the equipment adopted in the detail design was revised.
(3) Consulting services
F/S review, detail design, bid support, execution management, and advice for selecting terminal operator were implemented as planned. The planned service volume was 615 MM while the actual service volume was 677 MM; the reason for this increase is the additional construction and the delay in the implementation of the project (to be described later).
Fig. 1 A Bird’s Eye View of the Project Outputs (at project completion)
Berth 125
Container freight station
2.2.2 Project period
The project period planned a
February 1998 to March 2002,
planned was 5 years and 8 mon
the original plan). The main
services was delayed (8 month
because of the extreme cold
equipment manufacturer went b
3 months).
The completion date for the
12 The number of roads requirinthroughout the country, resulting(especially asphalt).
Rail terminal
Berth 124
Berth 123
Berth 122
Berth 121
Maintenance workshop
Gantry crane
Transfer crane
Container yard
Administration building Main gate
t the time of appraisal was 4 years and 2 months, from
but the actual time it took to achieve the outputs initially
ths, from February 1998 to September 2003 (136% against
reasons for the delay include: (i) the start of consulting
s); (ii) engineering works and procurement were delayed
winter in 2003 (for about 6 to 8 months) 12 ; (iii) the
ankrupt, causing a delay in equipment procurement (about
entire project, including the additional construction, was
g restoration work due to an extremely cold winter increased in delays in the production and delivery of building material
6

October 2004, and the container terminal went into operation in April 2004. 2.2.3 Project cost At the time of appraisal, the total project cost was estimated to be 17,067 million yen (6,073 million yen in foreign currency), but the actual cost was 10,984 million yen (9,302 million yen in foreign currency), or 64% of the planned cost. Reasons for the reduction are: (i) efficient acceptance of orders due to open competition in civil engineering and in procurement of mechanical handling equipment; (ii) reduction in the value of the local currency exceeding inflation; and (iii) since 2003, all of the equipment that MPAC purchased for developing the said port were exempt from taxation. Regarding (ii), although the impact of exchange rate fluctuation on project cost was kept to a minimum by paying out all of the ODA loans in foreign currency instead of paying out 47% in foreign currency and 53% in domestic currency as was originally planned, the domestic currency base cost borne by the Romanian government surged for the civil engineering work to 444.5 billion leu far exceeding the planned cost of 45.6 billion leu. Consequently, despite the fact that the reduction in tariff and tax disbursement brought about by reason (ii) above (actual disbursement of about 36.5 billion leu against the planned 76.3 billion leu), the ratio of planned to actual expenditure was 359% (or 40% when converted on a yen basis). 2.3 Effectiveness (Rating: a) Facilities and equipment constructed in the project are operating at full capacity; the volume of containers projected at the time of appraisal has been exceeded by a large margin. Thus it can be concluded that the project has proved to be highly effective. 2.3.1 Increase in container cargo traffic
Source: MPAC
Fig. 2. Container cargo traffic at the Port of Constantza (summary)
0
200
400
600
800
1,000
1,200
1996 2004 2005 2006
千T
本事業設計取扱能力
Project design handling capacity
本事業ターミナル以外
本事業ターミナル
Terminals other than the project terminal Project terminal
EU1000 TEU
As shown in Fig. 2 and Table 3, the volume of containers handled at the port of Constantza has increased by more than 12 fold from 1996 to 2006. The container cargo traffic at the project’s South-Port terminal surpassed the originally planned handling capacity of 330,000 TEU in 2005, the second year of its operation (nearly the same level of demand is projected for 2008 at the time of appraisal). In the following year (2006), the handling volume reached
7

nearly 870,000 TEU.13 This was because the terminal operator, among other things, purchased additional cranes and other cargo handling equipment and expanded the container yard at its own expense.14
The breakdown of the containers handled at the project terminal (Table 3) shows that the proportion of transshipment that did not exist prior to the project has increased (see “2.4 Impact” for detail).15 The existing North Port container terminals (terminals other than the ones built under the project shown in Fig. 2 and Table 316) also promoted increasing berths for containers and expanding facilities including purchasing cranes and so on, and as a result the handling volume continued to increase until the completion of the project. However, after that, the handling volume tended to decrease. This is because, with the completion of the terminal provided under the project, many marine shipping companies that had been using the North Port switched to South Port. The percentage of the container cargo traffic of the terminal under the project to the container cargo traffic combining both the South Port and North Port was 27% in 2004, 75% in 2005, and 84% in 2006. The percentage of container freight in the Total Cargo handled in the port of Constantza rose from 2% in 1995 to 17% in 2006. Additionally, containerization of freight is believed to be the reason for the volume of general freight decrease (Fig. 3).
Table 3. Container cargo traffic in Constantza Port (unit: TEU) Project terminal in the South-Port zone
Year
Entire Port Total Import Export Transship-
ment
Other than the project
terminal 1996 86,268 0 -- -- -- 88,2682004 373,702 99,785 NA NA 47,415 273,9172005 771,126 581,533 91,979 86,461 403,093 189,5932006 1,037,066 870,657 104,261 109,248 657,133 166,409
Note: Including lucrative and empty containers Source: MPAC, CSCT (the terminal operator)
13 The port of Constantza’s rating in the world in terms of its container cargo traffic as expressed in TEU improved from 148th in 2004 to 98th in 2005. 14 The executing agency announced that the container cargo traffic for 2006 was 1 million TEU for the entire port of Constantza and 800,000 TEU for the project’s terminal. Thus, as of year 2006, the port and the terminal were already at a saturation point. When the improvement project for the east side of Pier 2 currently being formulated and under negotiation by the operator of the project terminal is completed, the handling capacity alone for the two piers (Pier 1 and Pier 2) is expected to reach 2 million TEU. 15 Transshipment refers to reloading of freight headed for other ports in Romania as well as to ports in other countries. 16 In addition to the terminal built under the project in the South-Port zone, there is a small-scale container terminal built by Maersk Company Limited for its own exclusive use, but it is not related to the project, and the handling volume is minimal.
8

Fig. 3 Total Cargo at Constantza Port
0
10
20
30
40
50
60
70
1995
2001
2002
2003
2004
2005
2006
百万
トン
合計
ばら
Source: MPAC
Unloading Freight from a Container Mother Ship
1 m
illio
n to
n
ClG
Bulk Total
2.3.2 Increase container vessels In the Black Sea, container vessregular service prior to the projfeeder vessels (small container vbeen carried on container motheelsewhere. The average load Constantza was 221 TEU, as oppload capacity/vessel of 461 TEUIn addition, only 13% of ships of Constantza had a load capacmore. Since the completion of the vessels entering into the port tended to increase both in num4). In 2006, the total tonnage oarriving in the terminal builtreached 9.8 million tons, and ttonnage and the average load c
17 The table below indicates the geby type and load capacity.
Small Feeder
Load capacity (TEU)
–1,000
Dead weight tonnage (DWT)
–13,500
Source: Prepared by using MAN B&W
ontainers
年
コンテナ
一般
eneral l
Year
entering the port els of 40,000 DWT or more (Panamax class) were not in ect. Vessels that sailed into the port of Constantza were essels for feeder operations) on to which freight that had
r ships were reloaded in ports along the Mediterranean or capacity of a feeder vessel entering into the port of osed to the average in the Black Sea.17 arriving in the port ity of 500 TEU or
Table 4. Number of Container Vessels entering into Constantza Port No. of vessels
(40,000DWT or larger)
Average load capacity/vessel
Entire port 1995 351( 0) 221TEU2004 630( 5) 593TEU2005 897( 23) 860TEU2006 995( 86) 1,042TEU
Terminal provided under the project 2006 852( 86) 1,172TEU
Note: DWT = Dead weight tonnage Source: MPAC, CSCT
project, container of Constantza have ber and size (Table f container vessels
under the project he maximum cargo apacity/vessel were
neral method for determining the number of container vessels
Feeder Panamax Post Panamax Over Post Panamax
1,000–2,500 2,500–4,500 5,000–8,000 8,000–
13,500–31,000 31,000–54,000 54,000–93,000 93,000–
Diesel A/S as reference.
9

61,749 DWT and 1,172 TEU, respectively. At the time of ex-post evaluation, the world’s leading shipping companies were putting post Panamax class container vessels into regular service every week. By providing user friendly facilities for container mother ships, the project has enabled not only new entrants but also shipping companies that had been using the port of Constantza for feeder transport before the project began to have their mother ships call at the port. 2.3.3 Increasing the frequency of use of facilities and freight handling efficiency The actual berths occupation ratio of berths 121-123 built under the project was 53% against the projected berths occupation ratio of 45% at the time of ex-post evaluation. Also, since the average weekly operating rate of the gantry cranes was 80% (about 120 hours), they were operating at an adequate operational rate. Prior to the project, because of aging equipment and narrow container yard, the existing terminal at the North Port was not handling freight very efficiently; it could hacrane per hour. The cranes at the terminal build under the able to handle on average 20 containers per hour at the time the terminal operator, the cranes at the terminal are now acontainers per hour or more. In addition, thanks to the pworkload, even at the existing terminal in the North Pimproved so much so that cranes at the North Port can containers per hour. Other facilities and equipment are also being used for hcontainer freight station is being used not for handling continspection and other purposes. The reason, according to tsince there are only a few small cargo owners that need to usat this point, there is not much need for the center. 2.3.4 Provision of services that meet international standards The terminal built under the project is being operated by thselected through competitive international bidding, as it appraisal. The facilities that were modernized under the prDP World (headquartered in Dubai), which operates 42 concountries. DP World made a successful bid to operate Constantza (see also “2.5 Sustainability”). DP World pr
10
At the existing container terminal in the North Port
ndle only 10 containers per project were projected to be of appraisal, but according to ble to handle on average 25 roject alleviating the heavy
ort, handling efficiency has now handle on average 20
andling containers, but the ainers but rather for customs he terminal operator, is that e the container freight station,
e terminal operator, who was was planned at the time of oject attracted the interest of tainer terminals spanning 22 the terminal in the port of ovides the same quality of

services as it does at terminals in other countries. The shipping companies that use the project terminal have expressed satisfaction with the services provided by the terminal, according to the questionnaire survey and interviews held at the time of Ex-post evaluation18. Another factor that contributed to the success of the agreement with DP World is that the consultant firm for the project supported CPA(Constantza Port Administration; former MPAC) in the preparation of tender documents and the proposed contract agreement so that they complied with international standards. 2.3.5 Recalculation of internal rate of return (1) Financial internal rate of return (FIRR) The financial internal rate of return (FIRR) at the time of appraisal was 12.6%. However, when this was recalculated by applying the actual values at the time of Ex-post evaluation, FIRR increased to 19.1%. For both before and after the project, the project costs included initial investment and additional investment costs, as well as operation and maintenance costs, while the benefits included revenue from port duty (the revenue of the executing agency, MPAC) and revenue from container handling charges (the revenue of the terminal operator). The reasons for why the recalculation of FIRR exceeded the projected value are; (i) the project cost was far less than the planned cost; (ii) the advent of larger container vessels, which caused port duties to exceed the planned port duties;19 and (iii) container handling charges exceeded planned charges. (2) Economic internal rate of return (EIRR) The EIRR estimate calculated in the JBIC survey conducted for the project was 15.4%, as opposed to the 20.1% EIRR obtained in the recalculation conducted at the time of ex-post
18 At the time of the ex-post evaluation, the evaluator sent a questionnaire to thirteen main shipping companies using the project terminal and collected answers from six of them. The questionnaire asked respondents to rate their degree of satisfaction with the project terminal and related facilities at six-point scale ranging from 0 point to 5 points. The average points on each aspect are (in order of high satisfaction): (i) quality of services performed by the terminal operator (4.17 points), (ii) contribution of the terminal to the company's activity and speed and efficiency of the container handling services (4.00 points), (iii) current container handling capacity of the project terminal and future capacity expansion plans of the terminal (3.83 points), (iv) price level of container handling (3.33 points), (v) quality of public river infrastructure for shipping containers (3.25 points), (vi) quality of public road infrastructure for shipping containers (3.00 points) and (vii) quality of public railway infrastructure for shipping containers (1.67 points). Relatively lower satisfaction with public transportation infrastructures, especially railways, is consistent with the situations described in Box 1. 19 Port duties are determined in accordance with the total tonnage and length of a vessel. Thus, the larger the vessel is, the higher the port duty.
11

evaluation. For both before and after the project, the cost included initial investment and additional investment costs, as well as operation and maintenance costs, while the benefits included the savings gained through economy of time (time waiting to use the berth, berthing time, time spent navigating within the port) and the value of time gained through labor cost reduction. The reason why the recalculation of EIRR exceeded the projected value is that the handling efficiency was higher than estimated. Meanwhile, as a form of benefit that was not taken into account in the above calculations, the amount of feeder transport cost (marine transport cost plus time cost) saved by container mother ships that are now able to take up anchor in the port of Constantza thanks to the project was used to calculate EIRR separately. The calculation yielded a significant benefit of 33.1%, which suggests that a substantial reduction in cost can be expected as a result of the advent of large vessels brought about by the project.20 2.4 Impact 2.4.1 Regional economic growth (superior level of achievement) It has been confirmed that the port of Constantza has come to serve as a container hub port for the Black Sea, thus contributing to the development of Romania’s marine transport and trade, and has brought about positive changes in the economic activities of the southeastern region of Romania including Constantza. (1) Development of Constantza as a container hub port for the Black Sea
Containers reloaded to feeder vessels (The crane is procured by terminal
operator)
At the time of appraisal it was assumed that the port of Constantza would become a container hub port for the Black Sea, and therefore facilities built under the project were designed for use by large vessels, however, it was also assumed that for some time after its completion, the port of Constantza would serve as a destination of feeder vessels carrying containers that were reloaded at ports along the Mediterranean Sea and elsewhere.
20 At the time of appraisal, EIRR was not calculated on the grounds that “it is difficult to compute the benefit the project would have on Romania’s national economy.” In contrast, in the ex-post evaluation, the economic benefit that would accrue to the domestic cargo owners was calculated, but because the necessary information was not available, the figures presented here are for reference only. It was hypothesized that the unit cost of feeder transport would be 50% of Japan’s Asian shipping cost (the feeder transport cost in Japan was higher than this, so it was not used). Moreover, it was hypothesized that the feeder transport cost would be cut back to a third of the lucrative containers leaving from and arriving in Romania.
12

Contrary to such an assumption, as noted earlier, transshipment in the South Port began to surge immediately after the project was completed, so much so that by 2006, transshipment accounted for 75% of all container freight handled in the CSCT Terminal (see Table 3). Container vessels on the high seas that sail into the CSCT Terminal do so via China, Singapore, Turkey, Sri Lanka and the like. The containers are transferred to the feeder vessel at the port of Constantza and transported to Ukraine, Turkey, Bulgaria and elsewhere. As a result, the port of Constantza is developing into a physical distribution base linking Europe with the Commonwealth of Independent States (CIS) and Asia. Meanwhile, regarding container transport to the interior of Europe by river, rail and road, as noted above, while future growth is expected, as of the time of ex-post evaluation, the expected growth has hardly been realized due to the delay in infrastructure development.21 Given that Constantza is the starting point of European Corridor-422 (road and railroad) and European Corridor-7 (Danube, Black Sea Canal), development of container transport by land to other countries can also be expected.23 2.4.2 In relation to economic development and tradFrom 2002–2006, Romania’s GDP in real terms repositive growth of 6.1% on average. Additionally,from 4,360 USD in 1995 to about 10,000 USD ingrowth among all central and eastern European cou 21 Although the volume of international container trascertained, from the results of the OD survey the Ministry of Transport conducted in 2005, it can be e(Moldova and Hungary are known destinations). Regariver, in 2006, a major shipping firm began usingConstantza and Bulgaria and between Constantza and Svolume of about 800 TEU in the same year. 22 European Corridor (EC): A transit system comprisedconnecting Central and Eastern Europe with Western Epriority project. 23 In 2006, MPAC conducted a survey of container (Austria) and concluded that the project is economically
13
Table 5. Romania’s Trade and Investment Amount (unit: million euro)
2003 2004 2005 Import 21,201 26,281 32,569Marine transport
2,706 3,739 5,456
Export 15,614 18,935 22,255Marine transport
3,662 4,547 5,981
Foreign investment
1,042 2,454 2,618
Source: Romanian Overseas Investment Promotion Center
Table 6. Project Terminal Import and Export Container cargo traffic (only lucrative
containers) (unit: TEU)
Import Export 2005 82,212 54,4812006 95,431 66,039
Growth rate 16.08% 21.21%Source: CSCT (project terminal operator)
e bounded from the sluggish 1990s to a
GDP (average purchasing power) rose 2006, but this was the lowest level of ntries.
ansport by road or by rail has not been British consultant commissioned by the
stimated to be around 150 TEU per year rding international container transport by barges transporting containers between erbia, and in that year recorded a handling
of the principal roads, railroads and rivers urope, which the EU is constructing as a
transport between Constantza and Krems sound.

Accompanying the growth in domestic demand – the main factor contributing to the economic growth in recent years – the ratio of balance of current account to GDP has tended to deteriorate from minus 4.5% in 1997 to minus 6.6% on average from 2002–2006. Since the 1990s, Romania has consistently suffered from adverse balance of trade. As shown in Table 5, in the marine transport sector, exports are growing faster than imports. Regarding the container cargo (see Table 6), from 2005–2006, exports are increasing gradually. So it can be said that the project has contributed to the economic development in Romania, especially the expansion of exports. Meanwhile, the entire port of Constantza has been a free zone since January 2007. As a result, the port has enjoyed, among other advantages, release from and simplification of customs procedures and exemption from paying added value tax for trade related services.24 At the time of the ex-post evaluation, a total of 590 firms, including shipping companies, carrying companies, banks, construction companies, and retail outlets were doing business in the port. Increase in investment in the free zone and the impact of the project are expected to have synergistic effects. 2.4.3 Economic impact on the southeastern region of Romania25
Along with the development of the port of Constantza, the county of Constantza, where the port is located, is also home to a thriving shipping industry, carrying trade, oil refining industry, and manufacturing industry, among others. As an example of direct impact brought about by the project, the Constantza Chamber of Commerce and Industry cites changes including: (i) that CSCT directly hired more than 350 local residents, and (ii) that the container transport by road business expanded (at least 1,000 people have started new trucking businesses).
Note: Breakdown of “others” for exports: 5–14% share of each region Source: Ministry of Transport (results of OD survey conducted in the 1st and 2nd week of October 2005)
Fig. 4. Domestic Transport Destinations of Containers Departing from and
Arriving at the CSCT Terminal
12
76
24
14
64
10
0% 50% 100%
その他Others 南東地域Southeastern region ブカレストBucharest
輸 入Import
輸 出Export
In addition, a glance at the breakdown of domestic destinations of containers that are unloaded at the CSCT Terminal reveals that the largest portion of container imports are shipped to Bucharest, followed by the southeastern region centering around the county of Constantza, and only a small portion are
24 At the time of appraisal, the plan to establish a free zone in the South Port of Constantza and exempt only that port from tariffs and tax payments requirement and guarantee investments was changed. 25 The analysis in this section is conducted by dividing the entire country of Romania into eight regions – Bucharest, the southern, southwestern, western, northeastern, central, and southeastern regions. The southeastern region includes, in addition to Constantza, the cities of Buzau, Vrancea, Galati, Braila, and Tulcea.
14

shipped to other regions. On the other hand, while the largest portion of container exports originate from the southeastern region, those from other regions of the country are also shipped to the port of Constantza (see Table 4). In addition, although the population of the county of Constantza itself is only 710,000, the number of beneficiaries of the project is estimated to be at least about 2.85 million (the population of the southeastern region of Romania), and may even increase to 22 million (the population of Romania). However, according to the Ministry of Transport and the Constantza Chamber of Commerce and Industry, as noted earlier, owing to the shortage of infrastructure for domestic inland transport of containers, it is still inefficient to transport containers by land. Consequently, the impact of the sharp increase in container cargo on various regions across the country has not yet been optimized (see Boxed Item 1) and the number of beneficiaries might be increased, if the construction of domestic inland transport infrastructure would be promoted. 2.4.4 Impact on the environment No negative impact on the environment caused by the project has been observed. According to an environmental assessment survey conducted in 2004, the project obtained the Level 1 assessment (no negative environmental impact). Concerning the project characteristics, unlike the concern surrounding the impact of particulates and water contamination that sometimes develop when freight is transported separately, it is believed that the project has minimal impact on the environment. In addition, the site of the project is far from any residential district, so the impact of noise, etc. on the residents is negligible. The terminal operator (CSCT) outsources the treatment of waste material and wastewater emitted from the container terminal. Additionally, the project to improve Romania’s waste treatment facilities is being implemented throughout MPAC with funds provided by EIB. From before the project, environmental authorities of local governments have compiled the results of environmental monitoring conducted within the port of Constantza by various agencies and submitted them to the said authorities. None of the reports indicate outstanding issues regarding the project.
15

Boxed Item 1: Issues regarding domestic container transport (factors that inhibit optimization of the project’s regional impact)
(1)Road The domestic road network is being built
sequentially, and construction of a motorway between Bucharest and Constantza (about 250 km) has been launched. But progress is delayed, so motorists have to drive half of the section over a single-lane one-way national highway. Constantza is also one of the most popular beach resorts in Romania, and the traffic congestion during the summer inhibits the smooth shipment of container freight.
(2) Railroad Before the project, most of the container
freight handled within Romania was transported by railroad, but after the completion of the project, the railroad’s share decreased, while that of the roads increased.
Domestic Container Freight Transport by Means of Transport Before After Railroad 70% 33.9%Road 30% 65.8%River 0% 0.3%Source: MPAC
Due to the shortage of railroad infrastructure, trains cannot keep up with the increase in demand for container freight, which can be cited as a reason for the decline in the railroad’s share. Container terminals for use by railroad existed in various places in Romania even prior to the project (each terminal’s handling capacity is between 3,000 TEU to 20,000 TEU per year), but no efforts were made to renew these facilities and equipment during the period leading up to the time of ex-post evaluation.
Container terminal for use by railroad,
in Bucharest
(3)River There are no facilities along the Danube-
Black Sea Canal to unload containers.
2.5 Sustainability (Rating: a) Since there are no outstanding issues regarding the organization and operation or the maintenance system for the operation and maintenance of the CSCT Terminal, the project is judged highly sustainable. 2.5.1 Executing agency 2.5.1.1 Technical capacity MPAC and the terminal operator (CSCT: see next section) both have wide experience in the operation and maintenance of port infrastructure and container terminals, so there are no problems with these two firms being in charge of operating and maintaining the project facilities. While the project was being implemented, suppliers trained staff of the terminal operator in the operation and maintenance of cargo handling machinery. After the project, the senior staff of the terminal operator and those of the head office (Dubai)’s training center conducted various kinds of training. According to the terminal operator, since 410 workers are assigned to the operation and
16

maintenance of the CSCT Terminal, the amount of staff is adequate. 2.5.1.2 Operation and maintenance system National Company Maritime Ports Administration SA Constantza (MPAC) operates and maintains the port of Constantza under the supervision of the Ministry of Transport. The operation and maintenance system has not been changed from the time of appraisal. Since MPAC does not function as a port operator, the terminal operator was selected through international competitive bidding as planned at the time of appraisal. DP World, headquartered in Dubai, won the bidding process. DP World then entered into an 18-year concession agreement with MPAC and has been implementing the agreement since its conclusion. The actual operation is performed by Constantza South Container Terminal Co., Ltd. (CSCT), which was established in April 2004 by DP World. MPAC and CSCT share the responsibility for keeping the project facilities and equipment in good repair. Specifically, MPAC is in charge of the maintenance of the quays, roads, railways, buildings as well as the electric power and water networks, while CSCT is in charge of operation of all facilities and maintenance of cargo handling equipment and storage yard platforms. At the time of ex-post evaluation, no outstanding issue was raised concerning this operation and maintenance system. 2.5.1.3 Financial status The cost of operating and maintaining the project facilities is borne by MPAC and CSCT in accordance with the division of roles described above. MPAC had adopted a self-supporting accounting system dating back to before the project. 26 Generally speaking, the financial status is favorable,27 and this is evidenced by the fact that the balance of payments has been in the black. Revenue is derived from, among other sources, various port duties, sale of power and water, and rentals from private operators. As shown in Table 7, 13–14% of the revenue is used for the operation and maintenance of the facilities. Regarding operation and maintenance cost of entire Constantza Port, it is reported that the annual cost of operation
Table 7. Financial Status of the MPAC (unit: million USD)
2004 2005 Current account 32,135 41,507Current expenditure 24,437 34,946 Operation and maintenance of facilities
4,329 5,626
Fixed assets 152,646 120,687Source: The MPAC
26 Development projects that the MPAC implements are mostly financed with contributions from the government budget and to some extent also with borrowed money (from the European Investment Bank, etc.). Very little of the investment amount is drawn from personal funds. 27 In 2006, the British consultant conducted a careful survey of the financial status of the MPAC and determined that the financial status of the MPAC is favorable.
17
and maintenance for the facilities and equipment that MPAC is responsible for was 4.42 million USD in 2002, 8.43 million USD in 2003, 9.41 million USD in 2004, and 9.67 million USD in 2005. Although the financial status of CSCT has not been made public, CSCT has revenue from the rapidly increasing volume of containers it handles, and given that the users (shipping firms) have expressed satisfaction with how the CSCT Terminal is being operated and the services offered, it can be safely said that there are no outstanding issues regarding CSCT’s financial status. 2.5.1.4 Operation and maintenance status Every year, MPAC and CSCT formulate and conduct regular inspections of the facilities and equipment each party is in charge of. In the field study that was conducted for the ex-post evaluation, it was found that there was a lot of garbage in the vicinity of the railroad terminal (under MPAC’s charge), and containers were piled up in places other than the container yard (under CSCT’s charge). Despite these two issues, generally speaking, it is confirmed that overall the project facilities and equipment are in good condition.
3. Feedback 3.1 Lessons Learned When constructing a container terminal for which demand can be expected to increase,
with appropriate coordination provided by the Ministry of Transport, etc., the impact of
the container terminal can be maximized by simultaneously developing a surface
transport network linked to the terminal. For this reason, at the time of appraisal it is wise
to conduct a survey to determine whether the planned container terminal will have enough
transport network to meet the projected increase in container cargo traffic, whether there
will be a bottleneck or not, and whether the transport network plan is prepared or not.
3.2 Recommendations The implementation of the project and its effectiveness are both favorable, but to maximize the project’s impact, the following steps are proposed: (1) For MPAC and the terminal operator (CSCT): It is desirable that infrastructure development plans related to the project be implemented in an appropriate fashion. Plans with particular relevance to the project include two plans formulated by MPAC: (i) expansion of the railroad marshal area of the South Port and (ii) a bridge across the Danube-Black Sea Canal (a shortcut to the South Port and North Port);
18

and two plans formulated by CSCT: (i) expansion to the eastern side of Pier 2 of the container terminal and (ii) construction of Pier 3. (2) For the Ministry of Transport: It is desirable that the development plans related to the project be completed in a timely fashion. They include: (i) building a motorway between Bucharest and Constantza (at present, half completed); (ii) building a bypass from the national highway to the port of Constantza (to enable drivers to access the port without driving through city streets); (iii) building a railroad between Bucharest and Constantza (currently being implemented with Japanese ODA loans, which was signed in 2001). In addition, along with the above, it is desirable that container transport bottlenecks in the country (which are also mentioned in the current Transport Sector Operation Program) be eliminated by realizing the construction of a terminal for railroads and rivers.
19

Comparison of Original and Actual Scope
Item Plan Actual
(a) Outputs
1) Civil engineering work
1-1) Works of container
wharf
1-2) Pier ground
leveling
1-3) Construction of a
container yard
1-4) In-harbor railroad,
road
1-5)Building
construction
1-6) Utilities
2) Procurement of cargo
handling machinery
2-1) Gantry crane
2-2) Transfer crane
2-3) A set of small
machines
3) Consulting services
Depth: 14.5 m, length: 625 m
Additional land reclamation,
foundation improvement, etc.
90,000 ㎡
Extension portion of access
railroad (800 m)
Extension portion access road
(1,000 m)
Railroad terminal
(600 m×2)
Main gate, container freight
station, administrative
building, maintenance, etc.
Electric power, illumination,
water and sewerage,
drainage, communication,
etc.
30.5 tons (2)
30 tons (tire-type, 8;
rail-type, 2)
30 tractors in the yard,
30 trailers, forklift, etc.
92 foreign workers/month
522.5 Romanian man/month
As planned
As planned
92,520㎡
As planned
Added an overhead crossing
(1,191m)
Added 1 set of track rails
Nearly as planned
Nearly as planned
40.6 tons (3)
40.6 tons (amount as
planned)
35 tractors in the yard,
40 trailers, forklift, etc.
130.8 foreign man/month
546.5 Romanian man/month
(b) Project Period
1) Conclusion of ODA Loan
Agreement
Feb. 1998
Feb. 1998
20

2) Provision of consulting
services
3) Civil engineering work
4) Procurement of cargo
handling machinery
Oct. 1998–Mar. 2002
Sep. 2000–Mar. 2002
Sep. 2000–Sep. 2001
Jun. 1999–Oct. 2004
Feb. 2002–Oct. 2004
Feb. 2002–Nov. 2003
(c) Project Cost
Foreign currency
Local currency
Total
ODA loan portion
Exchange rate
6.073 billion JPY
10.944 billion JPY
(314.144 billion leu)
17.067 billion JPY
12.8 billion JPY
1 leu = 0.035 yen
(as of Dec.1996)
9.302 billion JPY
1.682 billion JPY
(480.918 billion leu)
10.984 billion JPY
9.302 billion JPY
1 leu = 0.0035 yen
(1999–2005 annual
average)
21