Romania Macroeconomic overview Ionut Dumitru · Ionut Dumitru Chief-economist, Raiffeisen Bank...
28
1 Romania Macroeconomic overview Ionut Dumitru Chief-economist, Raiffeisen Bank Romania chapter 1
Transcript of Romania Macroeconomic overview Ionut Dumitru · Ionut Dumitru Chief-economist, Raiffeisen Bank...

1
Romania Macroeconomic overview
Ionut Dumitru Chief-economist, Raiffeisen Bank Romania
chapter 1

2
Sustained upward trend of economic activity driven by private consumption
2

3
Economic growth pace has further accelerated in 2017 (6.9%), coming close to pre-crisis levels. GDP advance is supported by all
major demand segments: private consumption, gross fixed investments, and exports of goods and services. Still, the rapid growth
of private consumption is the main driver of the economic growth.
We expect real GDP to resume its growth starting Q2 after unexpectedly stalling in the first quarter of this year.
3
Sustained upward trend of economic activity
Source: National Institute of Statistics, Eurostat, Raiffeisen BANK
-15%
-10%
-5%
0%
5%
10%
15%
20%
13Q4 14Q4 15Q4 16Q4 17Q4
Real GDP and domestic demand
Real GDP (% yoy)
Private consumption (% yoy)
Gross fixed capital formation (% yoy)
-4
-2
0
2
4
6
8
2012 2013 2014 2015 2016 2017
Contribution to GDP growth
Net exports
Change in inventories
Gross fixed capital formation
Public consumption
Households' consumption
Real GDP (% yoy)
-9
-3
3
9
15
04Q1 07Q3 11Q1 14Q3 18Q1
Economic growth
Real GDP (% yoy)
Real GDP excluding agriculture (% yoy)

4
All major economic sectors except constructions had positive contributions to the GDP growth in 2017. Also, agriculture had a
consistent positive contribution (0.7 percentage points) to GDP advance in 2017.
4
Broadly based economic growth
Source: National Institute of Statistics, Eurostat, Raiffeisen BANK
Note: 4-quarter moving averages
-2
0
2
4
6
8
2013 2014 2015 2016 2017
Contribution of sectors to GDP growth
Services Industry
Construction Agriculture
Net taxes on products Real GDP (% yoy)
95
100
105
110
115
120
125
130
12Q4 13Q4 14Q4 15Q4 16Q4 17Q4
Gross value added by sectors (2012=100)
IndustryReal GDP
excluding
agriculture
Private
services
Construction

5
Investments showed signs of rebounding in 2017 and we expect the upward trend to remain intact in the subsequent quarters.
5
Rebound of private investments under way
Source: National Institute of Statistics, Ministry of Public Finances, Eurostat, Raiffeisen BANK
Note: 4-quarter moving averages
-15
-10
-5
0
5
10
15
20
10
Q4
11Q
4
12
Q4
13
Q4
14Q
4
15
Q4
16
Q4
17Q
4
Gross fixed capital formation
Quarterly dynamics (% qoq)
Annual dynamics (% yoy)
-60
-40
-20
0
20
40
07Q4 09Q4 11Q4 13Q4 15Q4 17Q4
Net investments, by segments
(% yoy)
New construction works
Equipments and transport means
Total investments
4
8
12
16
12
24
36
48
07Q4 09Q4 11Q4 13Q4 15Q4 17Q4
Gross fixed capital formation
Private sector (current RON bn, sa)
Public sector (current RON bn, sa, RHS)

6
Households’ disposable income keeps growing as labor market conditions are improving. Also, wages in the public sector and
pensions are again increased in 2018.
6
Growing disposable income boosts consumption
Note: Number of employees is based on a monthly survey on public sector and on private companies with at least 4 employees
Source: National Institute of Statistics, Eurostat, Raiffeisen BANK
Note: wage earnings stated in prices of December 2017
3
4
5
6
7
8
9
Ma
r-0
4
Ma
r-06
Ma
r-0
8
Ma
r-1
0
Ma
r-1
2
Ma
r-1
4
Ma
r-1
6
Ma
r-1
8
Unemployment rates
Recorded unemployment rate (%)
ILO unemployment rate (%)
850
900
950
1000
1050
3000
3250
3500
3750
4000
Ma
r-0
6
Ma
r-0
8
Ma
r-1
0
Ma
r-12
Ma
r-1
4
Ma
r-1
6
Ma
r-1
8
Employees in the economy
Employees in private sector (thous.)
Employees in public sector (thous., RHS)
500
1000
1500
2000
2500
3000
3500
Mar-03 Mar-06 Mar-09 Mar-12 Mar-15 Mar-18
Monthly net wages in the
economy (RON, constant prices)
Private sector Public sector

7
Some of macroeconomic indicators published at monthly frequency had a poor performance in Q1 2018, pointing to a deceleration
of economic growth in Q1. This was confirmed by flash Q1 GDP estimates released on 15 May (0.0% qoq, and 4.0% yoy).
7
Economic growth decelerated sharply in Q1 2018…
Note: confidence indicators are stated as deviations
from their long-term averages (2002-2018)
-40
-30
-20
-10
0
10
20
30
Ap
r-04
Ap
r-0
6
Ap
r-0
8
Ap
r-1
0
Ap
r-1
2
Ap
r-14
Ap
r-1
6
Ap
r-1
8
Confidence indicators
Consumer confidence indicator
Economic Sentiment Index (ESI)
Macroeconomic indicators published at monthly frequency
Source: National Institute of Statistics, Raiffeisen BANK
Q2-17 Q3-17 Q4-17 Q1-18
Industrial output 3.7 0.1 2.9 -0.6
Turnov er in industry, deflated 0.9 2.3 2.9 2.6
Exports of goods, in EUR equiv . 1.2 0.9 3.3 3.9
Retail sales turnov er, deflated 3.1 3.9 1.8 -1.6
Turnov er in market serv ices for
population 6.7 5.3 -1.7 -3.9
Turnov er in market serv ices for
enterprises 4.2 2.6 2.0 0.0
Construction output -5.7 1.8 -2.8 6.9
Economic sentiment index (lev el) 105.1 104.5 103.9 102.3
Consumer sentiment index (lev el) -14.0 -15.4 -22.7 -25.8
Number of employees (% qoq) 0.6 0.5 0.6 0.4
Quarterly change (% qoq)

8
1.6 1.6
1.2 1.2
0.9 0.90.8 0.8
0.7 0.70.6
0.50.4 0.4 0.4 0.4 0.4
0.3 0.3 0.30.2
0.10
-0.1
-0.5
0
0.5
1
1.5
2
Ire
lan
d
Gre
ec
e
Cro
atia
Cy
pru
s
Lux
em
bo
urg
Ma
lta
Latv
ia
Po
lan
d
Hu
ng
ary
Fin
lan
d
Lith
ua
nia
Slo
va
kia
Bu
lga
ria
Au
stri
a
Sp
ain
Sw
ed
en
Slo
ve
nia
Ne
the
rla
nd
s
EU
Eu
ro a
rea
Cze
ch
Re
pu
blic
De
nm
ark
Po
rtu
ga
l
Be
lgiu
m
Ge
rma
ny
Ita
ly
Fra
nc
e
Un
ite
d K
ing
do
m
Ro
ma
nia
Est
on
ia
Average qoq growth in 2017 qoq growth in Q1 2018
…Romania being one of the worst performers in Q1 2018
at the EU level
Source: Eurostat
Note: Seasonally adjusted data

9
Exports of goods and services should continue on an upward trend, helped by growing external demand. However, imports should
increase faster, fuelling a gradual enlargement of foreign trade deficit and of current account deficit.
9
Exports on an upward trend, imports are increasing faster
Source: National Bank of Romania, Raiffeisen BANK
Note: 6-months moving averages
-6
-3
0
3
6
9
12
15
Mar-13 Mar-14 Mar-15 Mar-16 Mar-17 Mar-18
Foreign trade with goods
Imports of goods (% yoy, EUR equiv.)
Exports of goods (% yoy, EUR equiv.)
-6
-5
-4
-3
-2
-1
0
1
2
Mar-13 Mar-14 Mar-15 Mar-16 Mar-17 Mar-18
External imbalances
Foreign trade balance: goods, services (% of GDP, last 6M)
Current account balance (% of GDP, last 6M)

10 10
12.6 12.5
10.2
8.0 7.9
6.4
5.04.5
3.7 3.5 3.2 3.2 3.2 2.8 2.81.9 1.9
1.4 1.1 0.8 0.7 0.5 0.3
-0.2-0.8 -0.8 -0.8
-2.1
-3.4-4.1
-6.7
-10.0
-5.0
0.0
5.0
10.0
15.0M
alta
Ire
lan
d
Ne
the
rla
nd
s
Ge
rma
ny
De
nm
ark
Slo
ve
nia
Luxe
mb
ou
rg
Bu
lga
ria
Cro
atia
Eu
ro a
rea
Est
on
ia
EU
ex
clu
din
g U
K
Sw
ed
en
Ita
ly
Hu
ng
ary
Sp
ain
Au
stri
a
EU
Cze
ch
Re
pu
blic
Lith
ua
nia
Fin
lan
d
Po
rtu
ga
l
Po
lan
d
Be
lgiu
m
Latv
ia
Fra
nc
e
Gre
ec
e
Slo
va
kia
Ro
ma
nia
Un
ite
d K
ing
do
m
Cy
pru
s
Source: AMECO database
Romania is one of the few countries in EU with current account deficit
Current account balance (% of GDP, 2017)

11
Inflows in EU funds decreased substantially in 2017 as absorption rate at the start of the new budgeting period 2014-2020 was low.
Still, stable foreign capital inflows (FDIs and capital transfers in EU funds) provided a good coverage of the current account deficit in 2017.
Substantial decline of EU funds inflows
Source: National Bank of Romania, Eurostat, Raiffeisen BANK
Note: Adjusted current account balance = current account balance + FDIs + Capital account balance
-2
0
2
4
6
8
10
20
03
20
04
20
05
200
6
20
07
20
08
20
09
201
0
20
11
20
12
20
13
20
14
20
15
20
16
201
7
Foreign direct investments
(% of GDP)
Equity Debt instruments Total FDIs
-15
-10
-5
0
5
10
Ma
r-06
Ma
r-08
Ma
r-10
Ma
r-12
Ma
r-14
Ma
r-16
Ma
r-18
Structure of adjusted current account
balance
Capital account balance (% of GDP, last 12 months)
FDIs (% of GDP, last 12 months)
Current account balance (% of GDP, last 12 months)
311
1,4081,443
1,0371,422
2,111
4,149 4,259
4,882
5,888
3,413
1,653
8001,188
0
1,000
2,000
3,000
4,000
5,000
6,000
7,000
20
07
20
08
20
09
20
10
20
11
20
12
20
13
20
14
20
15
20
16
20
17
20
16Q
1
20
17Q
1
20
18Q
1
Net inflows from the EU (EUR, mn)

12
Public finances - the most important macroeconomic risk
12

13
Public budget deficit target was kept at 3% of GDP in 2018, but we see risk for the deficit to outpace this level in the absence of
corrective measures.
Fiscal deficit reached once again 3% of GDP (ESA2010)
Source: AMECO database, Ministry of Finance
Note: in-house seasonally adjusted data; cash
methodology
-1.4
-2.4
-2.8
-0.7
-3.0
-4
-3
-2
-1
0
1
2
Jan
Feb
Ma
r
Ap
r
Ma
y
Jun
Jul
Au
g
Sep
Oc
t
No
v
De
c
Year-to-date public budget
execution (% of GDP)
2015 2016 2017
2018 2018 Target
-10.0
-9.0
-8.0
-7.0
-6.0
-5.0
-4.0
-3.0
-2.0
-1.0
0.0
200
0
200
1
200
2
200
3
200
4
200
5
200
6
200
7
200
8
200
9
201
0
201
1
201
2
201
3
201
4
201
5
201
6
201
7
201
8f
201
9f
Effective deficit Structural deficit
Maastricht criterion Medium term objective (MTO)

14 14
-10
-9
-8
-7
-6
-5
-4
-3
-2
-1
0
20
03
20
04
20
05
20
06
20
07
20
08
20
09
20
10
20
11
20
12
20
13
20
14
20
15
20
16
20
17
20
18f
20
19
f
European Union
Romania
Opposite direction of the fiscal deficit in Romania vs EU average (% of GDP, ESA2010)
Source: AMECO database

15
-4
-3
-2
-1
0
1
2
3C
yp
rus
Cze
ch
Re
pu
blic
Ge
rma
ny
Ma
lta
Lux
em
bo
urg
Sw
ed
en
Cro
atia
Ne
the
rla
nd
s
Bu
lga
ria
Slo
ve
nia
Lith
ua
nia
Gre
ec
e
Est
on
ia
De
nm
ark
Ire
lan
d
Au
stri
a
Eu
ro a
rea
Eu
ro a
rea
Fin
lan
d
Eu
rop
ea
n U
nio
n
Po
rtu
ga
l
Slo
va
kia
Latv
ia
Be
lgiu
m
Po
lan
d
Ita
ly
Un
ite
d K
ing
do
m
Fra
nc
e
Hu
ng
ary
Sp
ain
Ro
ma
nia
Effective balance Structural balance Maastricht criterion
Romania would have the highest budget deficit (% of GDP, ESA2010) in the EU in 2018
Source: AMECO database

16
In 2017, fiscal revenues reached the 23-year low,
being the second lowest at the EU level
16
27.6
25.9
26.4
29.1
31.2
30.7
28.8
28.4
27.927.7
28.3
28.928.7
27.3
26.2
27.2
28.2
27.8
27.327.4
28.0
26.6
25.8
25.0
26.0
27.0
28.0
29.0
30.0
31.0
32.0
199
5
199
6
199
7
199
8
199
9
200
0
200
1
200
2
200
3
200
4
200
5
200
6
200
7
200
8
200
9
201
0
201
1
201
2
201
3
201
4
201
5
201
6
201
7
40.0
38.4
35.1
29.9
25.8
20.0
25.0
30.0
35.0
40.0
45.0
50.0
Fra
nc
e
De
nm
ark
Be
lgiu
m
Sw
ed
en
Fin
lan
d
Au
stria
Ita
ly
Gre
ec
e
Eu
ro a
rea
Ge
rma
ny
Eu
rop
ea
n U
nio
n
Luxe
mb
ou
rg
Ne
the
rla
nd
s
Hu
ng
ary
Cro
atia
Po
rtu
ga
l
Slo
ve
nia
Cze
ch
Re
pu
blic
Un
ite
d K
ing
do
m
Po
lan
d
Cyp
rus
Sp
ain
Est
on
ia
Ma
lta
Slo
va
kia
Latv
ia
Lith
ua
nia
Bu
lga
ria
Ro
ma
nia
Ire
lan
d
Source: AMECO database, ESA2010
Development of fiscal revenues (% of GDP) in Romania Fiscal revenues (% of GDP) in 2017 in the EU countries

17
Public sector wage bill would reach the pre-crisis high in
2018 (ESA2010)
17
6.66.4
5.4
5.8
8.17.9
8.38.5
8.1 8.1
8.7
9.29.4
10.1
10.4
9.6
7.8 7.8
8.1
7.7 7.7
8.9
9.7
10.410.3
5.0
6.0
7.0
8.0
9.0
10.0
11.0
Development of wage bill in the public sector (% of GDP, ESA2010) in Romania
Source: AMECO database

18
57.1
59.4
55.9 56.4
58.9 57.1
62.5 62.7
59.5 61.2
62.4 62.2 64.0
73.1
86.1
82.1
69.9 68.2 68.7
66.4 65.1
73.5
79.6 81.3
82.3
45
50
55
60
65
70
75
80
85
90
199
5
199
6
199
7
199
8
199
9
200
0
200
1
200
2
200
3
200
4
200
5
200
6
200
7
200
8
200
9
201
0
201
1
201
2
201
3
201
4
201
5
201
6
201
7
201
8f
201
9f
Source: AMECO database; Note: Social spending=wage spending plus social benefits
60.0
64.3
69.771.8
79.6
45.0
50.0
55.0
60.0
65.0
70.0
75.0
80.0
85.0
Ne
the
rla
nd
s
Ge
rma
ny
Sw
ed
en
Cze
ch
Re
pu
blic
Hu
ng
ary
Lux
em
bo
urg
Un
ite
d K
ing
do
m
Ma
lta
Be
lgiu
m
Ire
lan
d
Eu
rop
ea
n U
nio
n
Eu
ro a
rea
Cro
atia
Latv
ia
Fra
nc
e
De
nm
ark
Au
stri
a
Lith
ua
nia
Slo
va
kia
Est
on
ia
Ita
ly
Bu
lga
ria
Slo
ve
nia
Po
lan
d
Fin
lan
d
Po
rtu
ga
l
Gre
ec
e
Cy
pru
s
Sp
ain
Ro
ma
nia
The burden of social spending in Romania is the highest in EU
Development of social spending as % of fiscal revenues in Romania Social spending as % of fiscal revenues in EU countries, 2017

19
4.1 3.9
2.6
1.8 1.6
3.4
2.7
3.2 3.5
2.8 2.8
5.2
6.1
6.5
5.8 5.7 5.5
4.8
4.5 4.3
5.1
3.6
2.8
1.0
2.0
3.0
4.0
5.0
6.0
7.0
1995
1996
1997
1998
1999
2000
2001
2002
2003
2004
2005
2006
2007
2008
2009
2010
2011
2012
2013
2014
2015
2016
2017
19
4.4
3.7
2.8 2.7
1.0
1.5
2.0
2.5
3.0
3.5
4.0
4.5
5.0
5.5
6.0
Est
on
ia
Gre
ec
e
Sw
ed
en
Hu
ng
ary
Luxe
mb
ou
rg
Latv
ia
Fin
lan
d
Po
lan
d
Ne
the
rla
nd
s
De
nm
ark
Fra
nc
e
Cze
ch
Re
pu
blic
Slo
va
kia
Lith
ua
nia
Au
stria
Slo
ve
nia
Ro
ma
nia
Cy
pru
s
Eu
rop
ea
n U
nio
n
Cro
atia
Un
ite
d K
ing
do
m
Eu
ro a
rea
Ma
lta
Be
lgiu
m
Ge
rma
ny
Bu
lga
ria
Sp
ain
Ita
ly
Ire
lan
d
Po
rtu
ga
l
Public investments reached in 2017 the 13-year low, being very close to the EU average
Development of public investments (% of GDP) in Romania Public investments (% of GDP) in 2017 in the EU countries
Source: AMECO database, ESA2010

20
Apr 2018/Apr
2017
Jan-Apr 2018/
Jan-Apr 2017
Buget
2018/Execution 2017
Total revenues 12.7% 11.8% 14.2%
Fiscal revenues including SSC 15.3% 10.5% 11.8%
Fiscal revenues excluding SSC 3.4% -0.3% 3.5%
Corporate income tax 4.2% -0.2% 2.0%
Personal income tax -29.6% -18.2% -31.0%
Property taxes 28.6% 6.7% 8.6%
Taxes on goods and services 11.0% 4.1% 14.5%
VAT -2.0% 1.1% 14.5%
Excises 50.0% 14.7% 13.6%
Social security contributions (SSC) 40.9% 33.6% 28.0%
Non-fiscal revenues 3.5% 13.9% -7.0%
EU funds (2014-2020) -28.4% 26.0% 66.4%
Total expenditures 19.5% 21.5% 13.9%
Current expenditures 20.9% 18.2% 14.0%
Wages 26.9% 20.4% 16.6%
Goods and services 11.1% 12.2% -1.7%
Interest expenses 147.6% 56.2% 19.5%
Subsidies 33.3% 26.8% 16.3%
Social assistance 8.0% 10.8% 6.5%
EU funds (2014-2020) -19.8% 28.7% 75.1%
Capital expenditures -20.7% 156.8% 5.6%
Total investment spending -16.7% 103.4% 44.3%
Surplus(+) / Deficit(-) 854.3%
-0.65% of GDP
in 2018 vs
+0.16% of GDP
in 2017
11.1%20
Budget spending is growing too fast and the “room for
maneuver” (=cutting investments) is much lower
Source: Ministry of Finance, cash
methodology;
If the annual growth of revenues is
higher/lower than the budgeted one for the
full year, then the cell is filled with green/red.
If the annual growth of expenditures is
higher/lower than the budgeted one for the
full year, then the cell is filled with red/green.

21
Monetary policy tightening as inflation rate increases rapidly
21

22
Elevated inflation rate (5.2% yoy as of April) was fuelled by strengthening of underlying inflationary pressures, by increase of administered
prices, and by increase of fuel prices (increase of excises and of oil price).
Annual inflation rate would likely stabilize around 5.0% in Q2 – Q3 2018, before decreasing towards 3.5% at the end of the year.
22
Strengthening of underlying inflationary pressures
Source: National Bank of Romania, National Institute of Statistics, Raiffeisen BANK
Note: CORE 3 = CPI excluding administered prices, volatile prices
of foods and fuels, and tobacco and alcohol
5.2
4.0
7.2
2.6
-8
-4
0
4
8
12
Apr-13 Apr-14 Apr-15 Apr-16 Apr-17 Apr-18
Inflation dynamics by components
CPI (% yoy) Foods (% yoy)
Non-foods (% yoy) Services (% yoy)
-4
-2
0
2
4
6
8
Dec-13 Dec-14 Dec-15 Dec-16 Dec-17 Dec-18
Inflation outlook
CORE 3 inflation measure (% yoy)
CPI (%, yoy)
NBR mid-point target (%, yoy)
Outlook

23
-4
-3
-2
-1
0
1
2
3
4
5
6
Apr-13 Apr-14 Apr-15 Apr-16 Apr-17 Apr-18
Annual inflation rate (national definition)
Poland Hungary Romania
Inflation rate in Romania increased the fastest and it is the
highest in EU – we cannot blame “exogenous” factors
23
-0.3-0.1
0.30.5
0.60.7 0.7
0.80.9
1.11.2
1.31.4 1.4 1.4 1.4
1.61.7
1.8 1.8 1.81.9 1.9
2.12.2
2.4
2.93.0
4.3
-1.0
0.0
1.0
2.0
3.0
4.0
5.0
Cy
pru
s
Ire
lan
d
Po
rtu
ga
l
Gre
ec
e
Ita
ly
De
nm
ark
Ne
the
rla
nd
s
Fin
lan
d
Po
lan
d
Sp
ain
Eu
ro a
rea
Luxe
mb
ou
rg
Eu
rop
ea
n U
nio
n
Ge
rma
ny
Cro
atia
Ma
lta
Be
lgiu
m
Bu
lga
ria
Cze
ch
Re
pu
blic
Fra
nc
e
Sw
ed
en
Au
stria
Slo
ve
nia
Latv
ia
Lith
ua
nia
Hu
ng
ary
Est
on
ia
Slo
va
kia
Ro
ma
nia
Dec-16 Apr-18
Annual inflation rate (HICP) in the EU countries (%)
Source: Eurostat, National Statistical Institutes
24
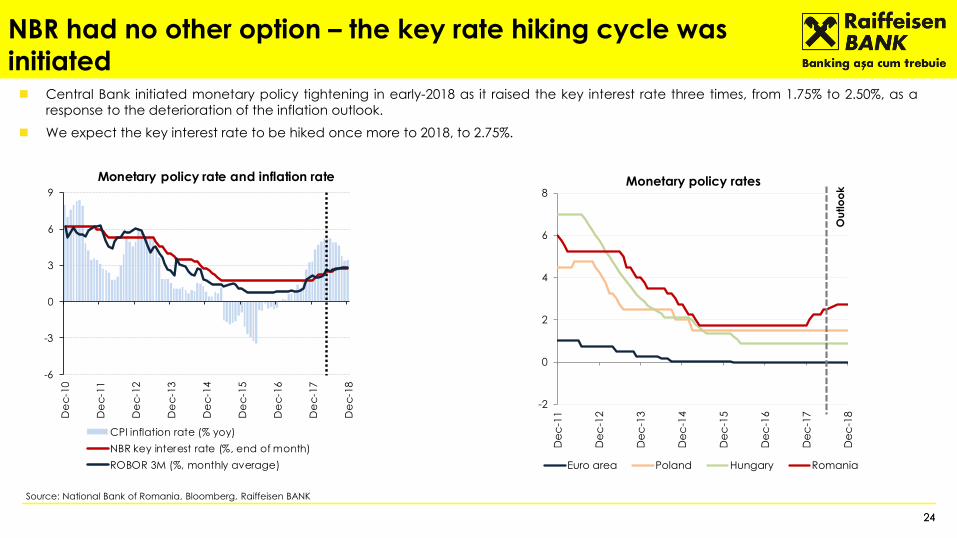
Central Bank initiated monetary policy tightening in early-2018 as it raised the key interest rate three times, from 1.75% to 2.50%, as a
response to the deterioration of the inflation outlook.
We expect the key interest rate to be hiked once more to 2018, to 2.75%.
24
NBR had no other option – the key rate hiking cycle was
initiated
Source: National Bank of Romania, Bloomberg, Raiffeisen BANK
-6
-3
0
3
6
9
De
c-1
0
De
c-1
1
De
c-1
2
De
c-1
3
De
c-1
4
De
c-1
5
De
c-1
6
De
c-1
7
De
c-1
8
Monetary policy rate and inflation rate
CPI inflation rate (% yoy)
NBR key interest rate (%, end of month)
ROBOR 3M (%, monthly average)
-2
0
2
4
6
8
De
c-1
1
De
c-1
2
De
c-1
3
De
c-1
4
De
c-1
5
De
c-1
6
De
c-1
7
De
c-1
8
Monetary policy rates
Euro area Poland Hungary Romania
Ou
tlo
ok

25 25
Disclaimer Financial Analysis
Risk notifications and explanations
Warnings
Figures on performance refer to the past. Past performance is not a reliable indicator for future results and the development of a financial instrument, a financial index or a securities service. This is
particularly true in cases when the financial instrument, financial index or securities service has been offered for less than 12 months. In particular, this very short comparison period is not a reliable indicator
for future results.
Performance of a financial instrument, a financial index or a securities service is reduced by commissions, fees and other charges, which depend on the individual circumstances of the investor.
The return on an investment in a financial instrument, a financial or securities service can rise or fall due to exchange rate fluctuations.
Forecasts of future performance are based purely on estimates and assumptions. Actual future performance may deviate from the forecast. Consequently, forecasts are not a reliable indicator for future
results and the development of a financial instrument, a financial index or a securities service.
A description of the concepts and methods used in the preparation of financial analyses is available here.
Detailed information on sensitivity analyses (procedure for checking the stability of potential assumptions made in the context of financial analyses) is available here.
Disclosure of circumstances and interests which may jeopardise the objectivity of Raiffeisen Bank Romania (RBRO) is available here.
The distribution of all recommendations relating to the calendar quarter prior to the publications date, as well as the distribution of recommendations in the context of which services of investment firms set
out in Sections A investment services and activities) and B (ancillary services) of Annex I of Directive 2014/65/EU of the European Parliament and of the Council have been provided in the past 12 months is
available here.
Detailed up-to-date information regarding methodology, conflicts of interest and disclaimer are available on the website of Raiffeisen Bank Romania SA, at the following web address:
https://www.raiffeisen.ro/despre-noi/guvernanta-corporativa/cercetare-economica/

26 26
Disclaimer Financial Analysis
Important: Please read the references at the end of this report to possible conflicts of interest and disclaimers/disclosures.
Publisher: Raiffeisen Bank Romania S.A.
Raiffeisen Bank Romania S.A. (herein after referred to as “RBRO”), a credit institution with registered office at Sky Tower, 246C Calea Floreasca, 1st District, code 014476, Bucharest, Romania, e-mail: [email protected],
website: www.raiffeisen.ro, Unique identifier 361820, Fiscal Code RO014460, BIC Code RZBRROBU, registered at Trade Register under no. J40/44/1991, listed in the Banking Register under no. RB-PJR-40-009/1999, in its
capacity as an Intermediary, registered with the Romanian Financial Supervisory Authority under no. PJR01INCR/400009 is authorized and supervised by Romanian National Bank (as credit institution), 25 Lipscani Street,
District 3, Postal code 030031, Bucharest, Romania, website: www.bnro.ro and by Financial Supervision Authority (as intermediary on capital markets by Decision no. A75/ 30.01.2014, completed by Decision no.
A239/27.03.2014), 15 Splaiul Independenţei, District 5, Postal Code 050092, Bucharest, Romania, website: www.asfromania.ro.
The shares of RBRO are not listed on any stock exchange. RBRO is a issuer of bonds’ that are traded on Bucharest Stock Exchange, therefore RBRO is acting and treated as an issuer on Romanian capital markets. For
further details on our issuer quality, please refer to the following address: https://www.raiffeisen.ro/despre-noi/guvernanta-corporativa/detinatori-de-obligatiuni.
RBRO is part of Raiffeisen Group, a financial group providing financial services in Austria and 15 Central Eastern European countries. Additionally, the Group comprises numerous other financial service providers, for
instance in the fields of leasing, asset management as well as mergers and acquisitions. RBRO offers a wide spectrum of financial services and products.. The Economic and Sectorial Research Directorate within RBRO
produces and disseminates reports and analyses covering the main macroeconomic developments in Romania.
RBRO´s ultimate parent company is Raiffeisen Bank International AG ("RBI") (Vienna Stock Exchange; ticker RBI AV). RBI is a credit institution domiciled in Austria. For many years RBI has been operating in Central and
Eastern Europe (CEE), where it maintains a network of subsidiary banks, leasing companies and numerous financial service providers in several markets. Although in the past 12 months RBI or its affiliated entities may have
concluded transactions with products or services (including but not limited to investment banking services) or with the subject company or companies mentioned in this report, no employee of RBI or of its affiliates has the
ability to influence the substance of the macroeconomic research reports prepared by the analysts of RBRO.
This research report is for information purposes only and may not be reproduced or distributed to other persons without RBRO´s permission. This document is governed by Romanian legislation in force and constitutes
neither a solicitation of an offer nor is it a prospectus in the sense of the Romania Capital Market Law no. 297/2004 or any other comparable foreign law. Unless otherwise explicitly set out herein, references to legal acts
refer to acts which are in force in Romania.
Any investment decision in respect of securities, financial products or investments may only be made on the basis of (i) an approved and published prospectus or (ii) the complete documentation that will be or has been
published in connection with the securities, financial products or investments in question and must not be made on the basis of this document. This document does not constitute a personal recommendation to buy or sell
financial instruments, or consultancy in the sense of the Capital Market Law no. 297/2004 or counseling/advisory of any kind.
Neither this document nor any of its components shall form the basis for any kind of contract or commitment whatsoever. This document is not a substitute for the necessary advice on the purchase or sale of securities,
investments or other financial products. In respect of the sale or purchase of securities/financial instruments, investments or financial products, an authorized advisor may provide individualized advice which might be
suitable for investments and financial products.
This document is fundamentally based on generally available information and not on any confidential information which the author that has prepared this document has obtained exclusively on the basis of his/her client
relationship with a third person. RBRO deems all of the information included herein to be reliable, but does not make any warranties regarding its accuracy and completeness. Nonetheless, where there is any doubt as to
whether a source is reliable, RBRO will clearly indicate this fact in the report.

27 27
Disclaimer Financial Analysis
Past performance is no guarantee for the future performance of the financial instruments. No assurance can be given regarding the favorable return of the financial instruments portfolio or of an issuer described in this
report. It is possible that, due to various factors, the projections are not met. Nor RBRO, nor any of its directors, officers or employees is responsible for any loss or damage that may result from the use of this document, of
its content or in some other way.
Any transaction with financial instruments involves risks among which are included but not limited to: the fluctuation of the prices in the relevant market; the unpredictability of dividends, profitability and profits; the
fluctuation of the exchange rates, of the interest rates and of the yields.
This document may include references to financial instruments in relation to which RBRO or any person closely associated with RBRO or part of the same financial group may act as market maker or liquidity provider,
lead manager or co-lead manager over the previous 12 months or is party to an agreement with the issuer relating to the provision of investment services offered by RBRO or relating to the production of present report.
As well, RBRO or any person closely associated with RBRO or part of the same financial group might have a long or short position at any time, including possibly a position that was accumulated on the basis of the
information contained herein prior to its dissemination. RBRO may engage in transactions, for its own account or with customers, in a manner inconsistent with the views taken in this document. Others within RBRO,
including strategists, sales staff and other analysts, may take views that are inconsistent with those taken in this document.
This document might have been disclosed to the issuer to which the recommendation, directly or indirectly, relates and might have been subsequently amended. Unless otherwise expressly stated herein, the analyst
that has drafted (or contributed to) this report is not compensated by RBRO for specific investment banking transactions. Compensation of the analyst or analysts of this report is based (among other things) on the
overall profitability of RBRO, which includes, inter alia, earnings from investment banking and other transactions of RBRO. In general, RBRO prohibits its analysts and persons contributing to the report to acquire securities
or other financial instruments of any company which is covered by the analysts (and contributing persons), unless such acquisition is authorized by RBRO´s compliance department in advance.
RBRO has established the following organizational and administrative agreements, including Chinese walls, to impede or prevent conflicts of interest in relation to recommendations: RBRO has designated fundamentally
binding confidentiality zones. Confidentiality zones are units within credit institutions, which are isolated from other units by organizational measures governing the exchange of information, because compliance-relevant
information is continuously or temporarily processed in these zones.
Compliance-relevant information must not leave a confidentiality zone and is to be treated as strictly confidential in internal business operations, including interaction with other units. This is not applicable to the transfer
of information necessary for usual business operations. Such transfer of information is limited, however, to what is absolutely necessary (need-to-know principle). The exchange of compliance-relevant information
between two confidentiality zones must only be conducted with the involvement of the compliance officer.
RBRO may have effected a proprietary transaction in any investments mentioned herein or in related investments and or may have a position or holding in such investments as a result. RBRO may have acted, or might
be acting, as a manager or co-manager in a public offering of any securities mentioned in this report or in any related security.
RBRO and/or its employees have no obligation to update, modify or amend or otherwise notify a recipient of this report if the information or recommendation stated herein changes or subsequently becomes
inaccurate. The frequency of subsequent reports, if any, remains in the discretion of the author and RBRO.

28 28
Disclaimer Financial Analysis
Disclosure Aspects as per legislation in force
1. RBRO or one of its affiliated legal entities owns a net long or short position exceeding the threshold of 0,5 % of the total issued share capital of the issuer, calculated in accordance with Article 3 of Regulation (EU) No
236/2012 and with Chapter III and IV of Commission Delegated Regulation (EU) No 918/2012;
2. RBRO or one of its affiliated legal entities holds more than 5% of the entire issued share capital of the issuer;
3. The issuer holds more than 5% of the entire issued share capital of RBRO or one of its affiliated legal entities;
4. RBRO or its affiliated companies have significant financial interests with respect to the issuer;
5. RBRO or one of its affiliated legal entities is a market maker (or specialist) or designated sponsor or stabilization manager or liquidity provider in the financial instruments of the issuer;
6. During the last 12 months, RBRO or one of its affiliated legal entities played a major role or was co-leader (e.g. as manager or co-manager) in a public offering of the financial instruments of the issuer;
7. During the last 12 months, RBRO or one of its affiliated legal entities has entered into an agreement on the provision of other investment banking services with the issuer (including assuming a role as a payment office)
or received compensation for such services during the same period (in this case, disclosure only occurs if it does not breach confidentiality in relation to business information);
8. RBRO or one of its affiliated legal entities has entered into an agreement with the issuer on the provision of investment recommendations;
9. The responsible analyst owns financial instruments of the issuer which s/he analyses;
10. The responsible analyst is a member of the executive board, the board of directors or supervisory board of the issuer which s/he analyses;
11. The responsible analyst or other natural persons, who are involved in preparing the financial analysis, received or acquired stocks in the issuer s/he analyses prior to the public offering of such. Prices at which stocks
have been acquired and the dates of acquisitions will be disclosed;
12. Compensation of the responsible analyst or other natural persons, who are involved in preparing the financial analysis, is linked to a RBRO’s transactions with the issuer in question, on own account or on the
account of one of its affiliated legal entities.
Applicable disclosures: No disclosures
This report was completed on: 15 May 2018, 11:50 AM
First dissemination on: 16 May 2018, 10:30 AM