Romana Hasnain-Wynia, PhD Director, Center for Healthcare Equity Associate Professor
19
Between Hospitals for Between Hospitals for Inpatient Quality of Inpatient Quality of Care: Targeting Care: Targeting Resources to Close the Resources to Close the Gap Gap Romana Hasnain-Wynia, PhD Romana Hasnain-Wynia, PhD Director, Center for Healthcare Equity Director, Center for Healthcare Equity Associate Professor Associate Professor Institute for Health Care Studies Institute for Health Care Studies Division of General Internal Medicine Division of General Internal Medicine Northwestern University, Feinberg School of Medicine Northwestern University, Feinberg School of Medicine The authors acknowledge the assistance of the IFQHC and the Centers for Medicare and Medicaid Services (CMS) in providing data which made this research possible. The conclusions prescribed are solely those of the author(s) and do not represent those of
-
Upload
wanda-barry -
Category
Documents
-
view
18 -
download
0
description
Disparities Within and Between Hospitals for Inpatient Quality of Care: Targeting Resources to Close the Gap. Romana Hasnain-Wynia, PhD Director, Center for Healthcare Equity Associate Professor Institute for Health Care Studies Division of General Internal Medicine - PowerPoint PPT Presentation
Transcript of Romana Hasnain-Wynia, PhD Director, Center for Healthcare Equity Associate Professor

Disparities Within and Disparities Within and Between Hospitals for Between Hospitals for Inpatient Quality of Inpatient Quality of
Care: Targeting Care: Targeting Resources to Close the Resources to Close the
GapGapRomana Hasnain-Wynia, PhDRomana Hasnain-Wynia, PhD
Director, Center for Healthcare EquityDirector, Center for Healthcare Equity
Associate ProfessorAssociate Professor
Institute for Health Care StudiesInstitute for Health Care Studies
Division of General Internal MedicineDivision of General Internal Medicine
Northwestern University, Feinberg School of MedicineNorthwestern University, Feinberg School of Medicine
The authors acknowledge the assistance of the IFQHC and the Centers for Medicare andMedicaid Services (CMS) in providing data which made this research possible. Theconclusions prescribed are solely those of the author(s) and do not represent those of IFQHC or CMS. The study was funded by the Commonwealth Fund and the Robert Wood Johnson Foundation’s Changes in Health Care Financing and Organization (HCFO) Initiative

Co-AuthorsCo-Authors
Raymond Kang
Mary Beth Landrum
Christine Vogeli
David W. Baker
Joel S. Weissman

BackgroundBackground
Racial and ethnic disparities in quality of care Racial and ethnic disparities in quality of care persistpersist
Studies suggest that factors related to patient-Studies suggest that factors related to patient-physician encounter such as physician encounter such as miscommunication, cultural misunderstanding, miscommunication, cultural misunderstanding, racism, and bias contribute to disparitiesracism, and bias contribute to disparities
Other studies suggest that differential quality Other studies suggest that differential quality in treatment settings contribute to disparitiesin treatment settings contribute to disparities

QuestionQuestion
Who You Are?:
Patient-Centered Care
Where You Go?:
Quality differences in
various settings


“… hospitals that were lower performers tended to serve a larger proportion of minority patients…”
Hasnain-Wynia R, Baker DW, Nerenz, D, et al. Archives of Internal Medicine, June 2007
Disparities in Health Care Are Driven by Where Minority Patients Seek Care
Examination of Hospital Quality Alliance Measures
Disparities in Health Care Are Driven by Where Minority Patients Seek Care
Examination of Hospital Quality Alliance Measures

Bottom performing hospitals had a much higher percentages Bottom performing hospitals had a much higher percentages of minority patients compared with top performing hospitalsof minority patients compared with top performing hospitals
10 20 30 40 50 60
AMI SmokingCessation
HF SmokingCessation
CAP SmokingCessation
CHF D/CInstructions
% MINORITY PATIENTS
Bottom Performers Top Performers
Hasnain-Wynia, R., Baker, DW, Nerenz, DR, et al. “Are Disparities Driven by Who You Are or Where You Go: An Examination of the Hospital Quality Alliance Measures: Archives of Internal Medicine June 25, 2007 627:1233-1239..

Limitations of Previous Limitations of Previous StudiesStudies
Looked only at Medicare patientsLooked only at Medicare patients Focused only on one condition such as AMIFocused only on one condition such as AMI Examined only hospital level variables such Examined only hospital level variables such
as proportion of minorities treated, without as proportion of minorities treated, without examining if disparities existedexamining if disparities existed
Examined quality in teaching hospitals onlyExamined quality in teaching hospitals only Limited to comparisons with larger groups Limited to comparisons with larger groups
(Blacks, Hispanics).(Blacks, Hispanics).

Current HQA StudyCurrent HQA Study
Previously unavailable, patient-level Previously unavailable, patient-level HQA database obtained from CMSHQA database obtained from CMS
Expanded list of measuresExpanded list of measures n = 19n = 19
All U.S. acute care hospitals All U.S. acute care hospitals n > 4000 hospitalsn > 4000 hospitals n > 2 million patients n > 2 million patients

Groups by Race/Ethnicity Groups by Race/Ethnicity
BlackBlack HispanicHispanic AsianAsian American Indian/Alaska NativeAmerican Indian/Alaska Native Native Hawaiian/Pacific IslanderNative Hawaiian/Pacific Islander WhiteWhite

MethodsMethods
Multivariate modelsMultivariate models Model 1: unadjustedModel 1: unadjusted Model 2: adjusted for individual Model 2: adjusted for individual
characteristics, including co-characteristics, including co-morbidities, payer, age, gender (Total morbidities, payer, age, gender (Total Disparity)Disparity)
Model 3: Model 2 + adjusted for Model 3: Model 2 + adjusted for organizational effects ( random organizational effects ( random effects, between hospital variation)effects, between hospital variation)

Results

Within and Between Disparities Within and Between Disparities Depend Depend
on the Quality Metric and on the Quality Metric and Racial/Ethnic GroupRacial/Ethnic Group
•Constructed 95 disparities measures
•Clinically and statistically significant disparities in 37 measures
•Disparity eliminated when adjusting for site of care: 11 measures
•Magnitude of disparity reduced when adjusting for site of care : 26 measures
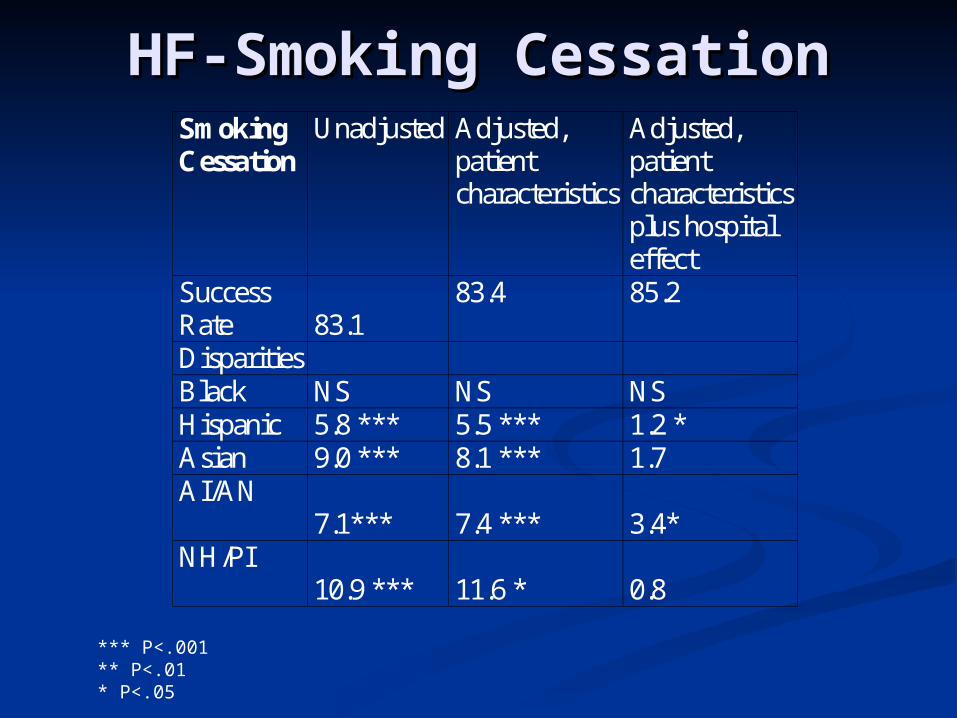
HF-Smoking CessationHF-Smoking CessationSmoking Cessation
Unadjusted Adjusted, patient characteristics
Adjusted, patient characteristics plus hospital effect
Success Rate 83.1
83.4 85.2
Disparities Black NS NS NS Hispanic 5.8 *** 5.5 *** 1.2 * Asian 9.0 *** 8.1 *** 1.7 AI/AN
7.1*** 7.4 ***
3.4*
NH/PI 10.9 ***
11.6 *
0.8
*** P<.001** P<.01* P<.05

HF Discharge HF Discharge InstructionsInstructionsDischarge
Instructions Unadjusted Adjusted,
patient characteristics
Adjusted, patient characteristics plus hospital effect
Success Rate 58.5
58.4 58.8
Disparities Black NS NS NS Hispanic 6.6 *** 6.3 *** -0.1 Asian 9.4 (*** 8.9 *** 2.8 *** AI/AN
10.3 *** 10.3 ***
3.3**
NH/PI 11.4 ***
10.9 ***
1.3
*** P<.001** P<.01* P<.05

AMI-PCIAMI-PCIPCI within 120 minutes
Unadjusted Adjusted, patient characteristics
Adjusted, patient characteristics plus hospital effect
Success Rate 68.9 69.1 68.3 Disparities Black 14.9*** 13.0*** 10.5*** Hispanic 9.1 *** 8.6*** 3.9** Asian 6.5** 6.8** 4.5 * AI/AN NS NS NS NH/PI 28.9*** 29.4*** 27.8***
*** P<.001** P<.01* P<.05

PN-PN VaccinationPN-PN VaccinationPneumonia Vaccination
Unadjusted Adjusted, patient characteristics
Adjusted, patient characteristics plus hospital effect
Success Rate 63.9
63.8 62.0
Disparities Black 14.9*** 13.5*** 10.9 *** Hispanic 16.6 *** 15.2 *** 9.4 *** Asian 18.1*** 16.7*** 9.0 *** AI/AN
6.7 *** 5.9*
8.8***
NH/PI 23.3***
22.0***
13.9***
*** P<.001** P<.01* P<.05
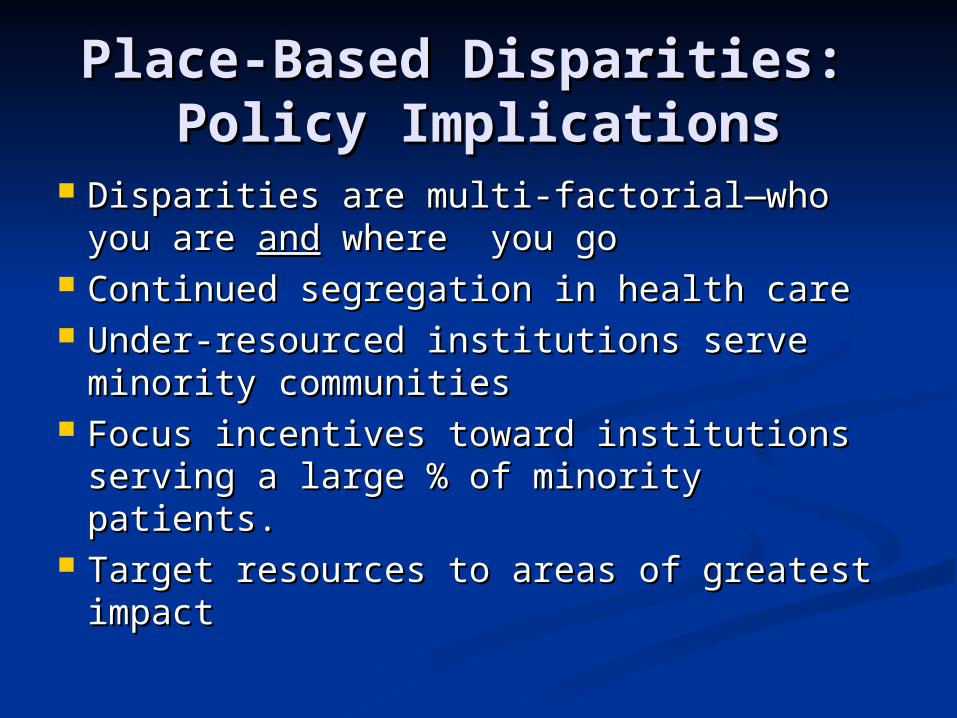
Place-Based Disparities: Place-Based Disparities: Policy ImplicationsPolicy Implications
Disparities are multi-factorial—who you Disparities are multi-factorial—who you are are andand where you go where you go
Continued segregation in health care Continued segregation in health care Under-resourced institutions serve Under-resourced institutions serve
minority communitiesminority communities Focus incentives toward institutions Focus incentives toward institutions
serving a large % of minority patients.serving a large % of minority patients. Target resources to areas of greatest Target resources to areas of greatest
impact impact

Policy ImplicationsPolicy Implications
Risks of unintended consequences of Risks of unintended consequences of forcing action through P4P and public forcing action through P4P and public reportingreporting
Need protections of vulnerable Need protections of vulnerable populationspopulations Pay for improvementPay for improvement Pay for disparity reductionsPay for disparity reductions