Rollins Scholarship Online is the institutional repository ...
136
Rollins College Rollins Scholarship Online SunTrust Portfolios 4-1-2012 SunTrust Portfolio Recommendations: Crummer Investment Management [2012] Boston Russell Fernanda Vanea Josh Aguilar Ian Aguilar John Humphrey See next page for additional authors Follow this and additional works at: hp://scholarship.rollins.edu/suntrust Part of the Finance and Financial Management Commons is Investment Protfolio is brought to you for free and open access by Rollins Scholarship Online. It has been accepted for inclusion in SunTrust Portfolios by an authorized administrator of Rollins Scholarship Online. For more information, please contact [email protected]. Recommended Citation Russell, Boston; Vanea, Fernanda; Aguilar, Josh; Aguilar, Ian; Humphrey, John; Apap, Carly; Hoffecker, Mike; Karime, Chad; and Brinkman, Chris, "SunTrust Portfolio Recommendations: Crummer Investment Management [2012]" (2012). SunTrust Portfolios. Paper 27. hp://scholarship.rollins.edu/suntrust/27
Transcript of Rollins Scholarship Online is the institutional repository ...
Rollins CollegeRollins Scholarship Online
SunTrust Portfolios
4-1-2012
SunTrust Portfolio Recommendations: CrummerInvestment Management [2012]Boston Russell
Fernanda Vanetta
Josh Aguilar
Ian Aguilar
John Humphrey
See next page for additional authors
Follow this and additional works at: http://scholarship.rollins.edu/suntrustPart of the Finance and Financial Management Commons
This Investment Protfolio is brought to you for free and open access by Rollins Scholarship Online. It has been accepted for inclusion in SunTrustPortfolios by an authorized administrator of Rollins Scholarship Online. For more information, please contact [email protected].
Recommended CitationRussell, Boston; Vanetta, Fernanda; Aguilar, Josh; Aguilar, Ian; Humphrey, John; Apap, Carly; Hoffecker, Mike; Karime, Chad; andBrinkman, Chris, "SunTrust Portfolio Recommendations: Crummer Investment Management [2012]" (2012). SunTrust Portfolios.Paper 27.http://scholarship.rollins.edu/suntrust/27

AuthorsBoston Russell, Fernanda Vanetta, Josh Aguilar, Ian Aguilar, John Humphrey, Carly Apap, Mike Hoffecker,Chad Karime, and Chris Brinkman
This investment protfolio is available at Rollins Scholarship Online: http://scholarship.rollins.edu/suntrust/27

+
2012
Crummer/SunTrust Portfolio RecommendationsCrummer Investment Management

2
Crummer Investment Management
Dear members of the oversight committee,
Although many of us have taken classes at Crummer that offer hypothetical business simulations, this class has
been a brand new experience. The uniqueness of this class comes from the fact that we are working with real,
not virtual, money, making decisions for a live Crummer/SunTrust Portfolio and we have learned a great deal.
We (the students) all assumed extra responsibility when it came to the final investment recommendations.
First, our decisions will affect future scholarships offered at Crummer and the students who depend on them.
Second, because the portfolio has performed extremely well over the long haul, we recognized a greater
accountability to continue the portfolio’s legacy. In fact, because the portfolio has done so well recently, the
cash requirement for the scholarships has been increased from $25,000 in 2011 to $30,000 in 2012. We discuss
the account’s performance since its inception in 1999 later in this report.
This portfolio is unique. We have only one at bat to get it right because we only trade once a year. Therefore,
we must execute our trades in mid April 2012 without regard to the market cycle. As much as we might be
tempted to try to hit a home run for the next 12 months, our decisions must be both short and long term
oriented. Our recommendations came from a thorough analysis of the past, present and forecasted market
performance. We relied largely on the past performances of various asset classes to develop the portfolio’s
asset allocation. Analysis of the current economic conditions supported our asset class allocation
recommendation and provided consistency for the sector analysts’ individual security selections. In addition,
based on the current market conditions and analysis of the common circumstances affecting market sectors, a
tactical sector tilt was adopted relative to the sector market weights of the S&P 500 Index. Both long and short‐
term strategies adopted by the management team are consistent with the IPS requirements.
We look forward to discussing our analysis with you on April 11, 2012, and hope to receive your approval to
implement our portfolio recommendations.

3
Crummer Investment Management
TableofContentsExecutive Summary ................................................................................................................................................. 7
Crummer Investment Management Team ............................................................................................................. 9
Performance of the Crummer SunTrust Portfolio ................................................................................................. 10
Long‐Term Asset Allocation Recommendation ..................................................................................................... 14
Economic Outlook ................................................................................................................................................. 17
U.S. Economic Growth (GDP) ............................................................................................................................ 17
The European Debt Crisis .................................................................................................................................. 17
Financial Markets .............................................................................................................................................. 17
Conclusion ......................................................................................................................................................... 17
Sector Analysis ...................................................................................................................................................... 19
Consumer Discretionary .................................................................................................................................... 20
Lowe’s Companies Inc. (LOW) ....................................................................................................................... 21
Abercrombie & Fitch Co. ANF ....................................................................................................................... 22
Autoliv Inc. ALV ............................................................................................................................................. 24
The Walt Disney Company DIS ...................................................................................................................... 25
Einstein Noah Restaurant Group, Inc. (BAGL) ............................................................................................... 27
McDonald’s Corporation (MCD) .................................................................................................................... 28
Staples, Inc. SPLS ........................................................................................................................................... 30
Ford Motor Company (F) ............................................................................................................................... 32
Health Care Sector ............................................................................................................................................ 34
Abbott Laboratories ABT ............................................................................................................................... 36
Quest Diagnostics Inc. (DGX) ......................................................................................................................... 37
Johnson & Johnson JNJ ................................................................................................................................. 38
Merck & Co. Inc. MRK ................................................................................................................................... 39
Stryker Corporation SYK ................................................................................................................................ 40
Teva Pharmaceutical Industries (TEVA) ........................................................................................................ 41
PDL Biopharma (PDLI) ................................................................................................................................... 43
Wellpoint, Inc. (WLP) .................................................................................................................................... 44
Energy ................................................................................................................................................................ 45
Chevron Corp. CVX ........................................................................................................................................ 46

4
Crummer Investment Management
Clean Energy Fuels Corp. CLNE ...................................................................................................................... 48
Exxon Mobil Corp. XOM ................................................................................................................................ 50
Helmerich & Payne HP .................................................................................................................................. 52
OYO Geospace OYOG .................................................................................................................................... 53
Suncor Energy SU .......................................................................................................................................... 55
PetroChina Co Ltd ADR (PTR) ........................................................................................................................ 57
Calumet Specialty Products Partners LP (CLMT) ........................................................................................... 59
Transocean LTD (RIG) .................................................................................................................................... 61
Consumer Staples Sector .................................................................................................................................. 63
Avon Products Inc. AVP ................................................................................................................................. 64
Church and Dwight CHD .............................................................................................................................. 65
Unilever PLC ADR (UL) ................................................................................................................................... 66
CVS Caremark Corp. CVS ............................................................................................................................... 68
The Coca‐Cola Company KO ........................................................................................................................ 69
ITT Educational Services (ESI) ........................................................................................................................ 70
PepsiCo Inc (PEP) ........................................................................................................................................... 71
Proctor & Gamble CO. (PG) ........................................................................................................................... 72
Tesco PLC ADR (TSCDY) ................................................................................................................................. 73
Financial ............................................................................................................................................................ 74
Annaly Capital Management (NLY) ............................................................................................................. 76
BlackRock Inc. (BLK) ...................................................................................................................................... 77
Branch Banking & Trust (BBT) ....................................................................................................................... 78
Epoch Investment Partners, Inc. EPHC .......................................................................................................... 79
Goldman Sachs GS ......................................................................................................................................... 80
JPMorgan Chase JPM .................................................................................................................................... 81
Morgan Stanley (MS) ..................................................................................................................................... 82
US Bancorp (USB) .......................................................................................................................................... 84
Utilities .............................................................................................................................................................. 85
Vanguard Utilities ETF (VPU). ........................................................................................................................ 87
Entergy Corporation (ETR) ............................................................................................................................ 88
Exelon Corporation (EXC) .............................................................................................................................. 89

5
Crummer Investment Management
Cleco Corporation (CNL) ................................................................................................................................ 90
Telecommunication Services ............................................................................................................................ 91
iShares S&P Global Telecom. (iXP) ................................................................................................................ 92
American Tower Corporation (AMT) ............................................................................................................. 93
Crown Castle International Corp. (CCI) ......................................................................................................... 94
AboveNet Inc (ABVT) ..................................................................................................................................... 95
Technology ........................................................................................................................................................ 96
Apple Inc. (AAPL) ........................................................................................................................................... 97
Automatic Data Processing ADP ................................................................................................................... 98
Paychex Inc. (PAYX) ....................................................................................................................................... 99
Hewlett‐Packard (HPQ) ............................................................................................................................... 100
International Business Machines (IBM) ...................................................................................................... 101
Intel Corporation INTC ................................................................................................................................ 102
Microsoft Corporation (MSFT) .................................................................................................................... 103
Industrials ........................................................................................................................................................ 104
The Boeing Co BA ................................................................................................................................... 105
Chicago Bridge &Iron Company (CBI) .......................................................................................................... 106
Diebhold, Inc. (DBD) .................................................................................................................................... 107
Heico Corp HEI ....................................................................................................................................... 108
Jacobs Engineering Group JEC ............................................................................................................... 109
United Technologies Corp (UTX) .............................................................................................................. 110
Brady Corporation BRC ............................................................................................................................... 111
3M (MMM) .................................................................................................................................................. 112
Grupo Aeroportuario del Sureste ASR ........................................................................................................ 113
Snap‐On, Inc. SNA ....................................................................................................................................... 114
Materials Sector .............................................................................................................................................. 115
Vale S.A. (ADR) VALE ................................................................................................................................... 116
The Dow Chemical Company (DOW) .......................................................................................................... 117
Rio Tinto ADR (RIO) .................................................................................................................................. 118
International Flavors and Fragrances (IFF) ............................................................................................... 119
Tronox Inc. TROX ......................................................................................................................................... 120

6
Crummer Investment Management
Fixed Income Assets ........................................................................................................................................ 121
Appendix ...................................................................................................................................................................
Crummer/SunTrust Portfolio Investment Policy Statement ........................................................................... 123
Mean‐Variance Efficiency Analysis .................................................................................................................. 128
Technical Analysis Tools .................................................................................................................................. 130
Value at Risk .................................................................................................................................................... 130
Sector Allocations ............................................................................................................................................ 132
Portfolio Class Allocations: Current and Proposed ......................................................................................... 133

7
Crummer Investment Management
ExecutiveSummary
Dear Members of the Committee,
We would like to start by thanking you for your service to the Crummer Suntrust Portfolio. Without your
participation, Crummer students would not benefit from the unique insight you bring to managing an active
portfolio. We have all learned a great deal from the opportunity and are excited to do our part to contribute
to the scholarship program.
Our challenge is to establish a portfolio position that takes advantage of economic opportunities while
minimizing risk and conforming to the standards of the Crummer Suntrust Investor Policy Statement. The
volatility of recent years has presented substantial challenges as well as great opportunities.
Last year’s student analysis positioned the portfolio to take advantage of a recovery that only just recently
arrived. While economic data in April 2011 indicated the beginning of a recovery, economic headwinds from
Europe and elsewhere stalled the economy and the markets. Even though we believe the recovery began in
earnest this January, the portfolio’s performance was disappointing for the twelve months ended February
2012. The portfolio underperformed in all but a few sectors, and underperformed the market as a whole.
That said, we see ourselves in a much better position to add value this year. Like last year’s analysts, we have
concluded that the market is anticipating an economic recovery. Improving employment figures, a stabilizing
housing market and a loose monetary policy will ease the economy back onto its feet.
The primary difference between this and last year is that the markets appear to support the recovery. Last
year market performance lagged behind the nascent recovery. Eventually headwinds from Greece and the
developing world caused a flight to quality that suppressed market activity even as the US economy grew
slowly. This year we are looking at a significantly more confident capital market. Some of the fears stemming
from the European debt crisis have abated. Employment has stabilized significantly. The market has spent the
better part of 2012 growing with renewed confidence. Moreover, the growth has resembled a classic
recovery, with highly cyclical sectors taking the lead.
Based on our confidence in the new market we have opted to maintain our recovery‐oriented sector
allocation, while keeping within the boundaries if the ISP. We are recommending that the portfolio tilt its
allocation in favor of cyclical sectors such as consumer discretionary, while shifting away from counter cyclical
sectors such as telecommunications. By doing so, we should be able to take advantage of the market growth
of the recovery.
Within the sectors, our stock picking strategy revolves around discovering equities that have been punished
unduly by the market or are otherwise undervalued. We believe that fear stemming from the European debt
crisis suppressed the value of both European firms and US firms beyond what was rational. With a season of
recovery in our near future, these securities should see a great deal of appreciation.

8
Crummer Investment Management
We are aware of the risks inherent in our strategy. The class before us reasoned along the same lines and the
portfolio suffered for it. The European debt crisis is far from over. Furthermore, considering the rapid gains in
the market since January it is possible that we have missed the recovery entirely. While we recognize these
risks, we firmly believe that this recovery has legs. Europe has proven itself capable of avoiding outright
disaster. The US recovery is bolstered by both fundamental and capital market support. Finally, while timing
might not be ideal, we believe that our strategy of choosing heavily undervalued stocks will see returns
throughout the coming fiscal year.
We look forward to sharing the results of our analysis with you in person.

9
Crummer Investment Management
CrummerInvestmentManagementTeam
Managing Editor: Boston Russell
Consumer Discretionary Sector Analyst: Fernanda Vanetta
Consumer Staples Sector Analyst: Josh Aguilar
Energy Sector Analyst: Ian Aguilar
Financial Sector Analyst: John Humphrey
Fixed Income Analysts: Ian Aguilar
Fernanda Vanetta
Healthcare Sector Analyst: Carly Apap
Industrial Sector Analyst: Mike Hoffecker
Technology Sector Analyst: Chad Karime
Materials Sector Analyst: Chad Karime
Telecommunications Sector Analyst: Boston Russell
Utilities Sector Analyst: Chris Brinkman

10
Crummer Investment Management
PerformanceoftheCrummerSunTrustPortfolio Since Inception
The Crummer SunTrust portfolio invested the first $100,000 SunTrust contribution in April 1999. As the chart
shows, the performance lagged the S&P 500 index until early 2002. Since then the portfolio has had a higher
return with less volatility than the index. By the end of February 2012, the portfolio’s since‐inception return
was 12.63% (with a standard deviation of 15.03%) versus the S&P 500 index’s annual return of 10.05% (with a
standard deviation of 16.17%) over the same period. This risk‐return comparison is all the more noteworthy
because the portfolio has held varying amount of bonds over time.
11
Crummer Investment Management
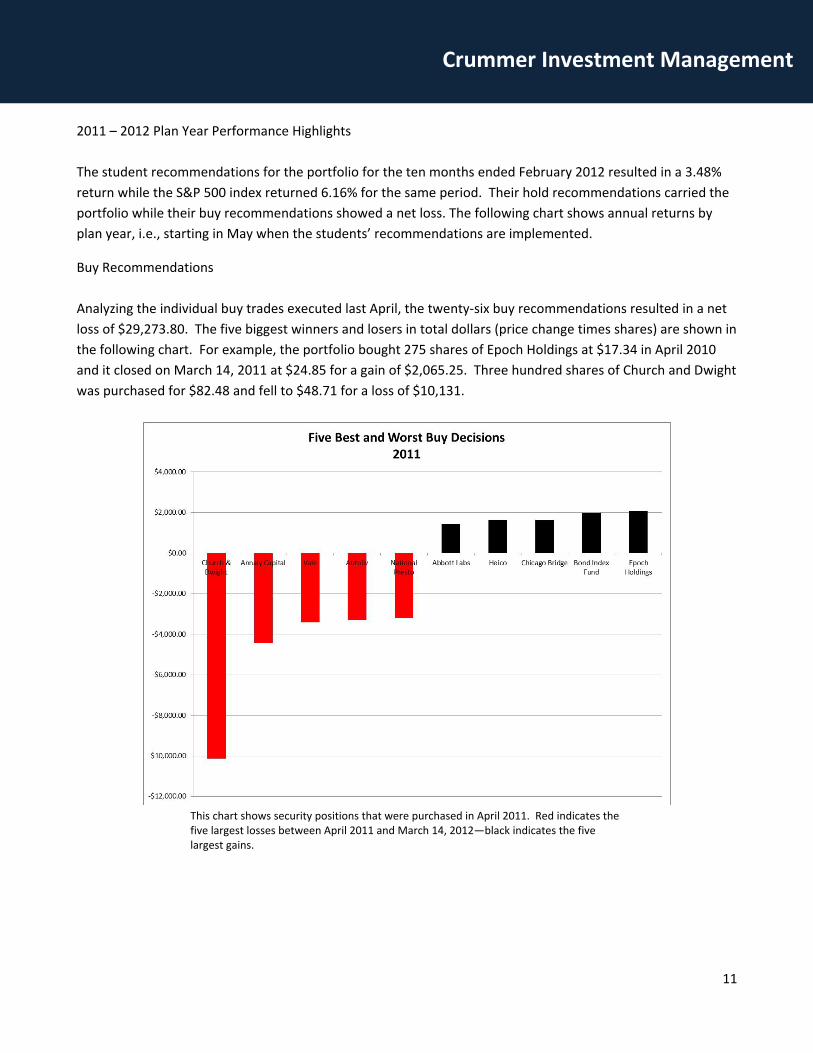
2011 – 2012 Plan Year Performance Highlights
The student recommendations for the portfolio for the ten months ended February 2012 resulted in a 3.48%
return while the S&P 500 index returned 6.16% for the same period. Their hold recommendations carried the
portfolio while their buy recommendations showed a net loss. The following chart shows annual returns by
plan year, i.e., starting in May when the students’ recommendations are implemented.
Buy Recommendations
Analyzing the individual buy trades executed last April, the twenty‐six buy recommendations resulted in a net
loss of $29,273.80. The five biggest winners and losers in total dollars (price change times shares) are shown in
the following chart. For example, the portfolio bought 275 shares of Epoch Holdings at $17.34 in April 2010
and it closed on March 14, 2011 at $24.85 for a gain of $2,065.25. Three hundred shares of Church and Dwight
was purchased for $82.48 and fell to $48.71 for a loss of $10,131.
This chart shows security positions that were purchased in April 2011. Red indicates the five largest losses between April 2011 and March 14, 2012—black indicates the five largest gains.

12
Crummer Investment Management
Sell Recommendations
The students’ sell recommendations were timely. The twenty‐nine positions they sold would have resulted in
a $9,547 loss for the portfolio as losers outpaced winners in this group, due primarily to the poor performance
of inflation‐protected bonds. The chart below illustrates the point with the five biggest winners and losers. On
the plus side of avoiding losses, the portfolio sold its position in the Vanguard Inflation‐Protected Bond Fund in
April 2011. The loss on this position alone would have been $29,753. On the other hand, the portfolio missed
a gain of $2,292 by selling Cisco Systems, which went from $17.02 to $20.84.
This chart shows security positions that were sold in April 2011. Red indicates securities that subsequently lost value through March 14, 2012—security positions that gained value are shown in black. In this chart, avoiding losses benefits the portfolio and vice‐á‐versa.

13
Crummer Investment Management
Hold Recommendations
The students analyze each portfolio position and make a buy, sell, or hold recommendation. The twenty‐seven
hold recommendations performed well, enabling the portfolio to show a 3.48% gain for the plan year. As the
chart shows, IBM and McDonalds were among the biggest gainers while Hewlett‐Packard and Suncor were
among the biggest losers. In dollar value, however, winners outpaced losers with a net gain of $15,871. In fact
only nine of these twenty‐seven hold recommendations lost value.
This chart shows security positions that were continued through the plan year—April 2011 to March 14, 2012. Red indicates securities that lost value over the year while security positions that gained value are shown in black.
Bonds and Cash
The portfolio began the plan year with 5% allocated cash (to fund scholarships), 84% to equity, and 11% to
bonds (Vanguard’s Total Bond Market Fund). This investment started the plan year at $80,897 and ended at
$82,871. The gain in these two asset classes was not material to the portfolio’s performance. As of March 14,
2012, the portfolio still held 5% in cash after a $20,000 contribution to scholarships, 12% allocated to fixed
income, and 83% allocated to equities.

14
Crummer Investment Management
Long‐TermAssetAllocationRecommendationThe Crummer/SunTrust portfolio asset allocation guidelines provide a wide range of alternatives for the class
allocation decision. To choose the most desirable allocation the management team looked at the past
performance and volatility of each asset class. The asset class benchmarks and their target range are provided
by the IPS as constraints to make a decision for the desired class allocation suitable for the portfolio’s long‐
term strategy. We conducted a mean‐variance optimization to compare our recommendation to an optimal
portfolio (the portfolio with the smallest risk for a desired level of expected return). Our portfolio, while not
mathematically optimal, is reasonably mean‐variance efficient.
The tables and charts included in this section show the proposed portfolio allocation compared to the portfolio
designed last year.
The 2011 portfolio was over weighted in value and underweighted in growth. This year’s proposal continues
the value tilt of last year’s asset allocation, consistent with our optimistic view.
Cash4%
Fixed Income12%
Large Growth21%
Large Value31%
Mid Growth10%
Mid Value9%
Small Cap Value
5%
Small Growth8%
Allocation 2011

15
Crummer Investment Management
Our sector allocation is over weighted in cyclical sectors like consumer discretionary and industrials as shown
below:
international6.0%
large growth25.7%
large value31.8%
mid-cap growth
5.4%
mid-cap
value9.5%
small growth8.4%
small value13.2%
Proposed Allocation 2012
Consumer Staples,
9.9%
Energy, 9.6%
Financial, 8.0%
Health Care, 11.2%
Industrial, 18.2%
Materials, 6.1%
Telecommunications, 3.9%
Utilities, 3.8%
Consumer Discretionary,
13.70%
Technology, 15.7%
Proposed Sector Allocation2012

16
Crummer Investment Management
For contrast, the market weights as of the end of February 2012 are shown below.
While our intention was to design an aggressive portfolio that over weighted cyclical sectors, the sector
allocations we inherited constrained us to some extent. For example, the current market weight in technology
is 20.04% while our proposed allocation is only 15.7%, up from 11.2% in the current portfolio. These
discrepancies are due primarily to the substantial below market weighting of cyclical sectors in the existing
portfolio and the scarcity of undervalued investments in the targeted sectors. Even so, this portfolio is well
positioned to take advantage of our anticipated economic recovery.
Consumer Staples10.70% Energy
11.70%
Financial,4.70%
Health Care11.30%
Industrial10.70%
Materials3.50%
Telecommunications, 2.80%
Utilities3.40%
Consumer Discretionary,
10.90%
Technology20.40%
Market Sector WeightsFebruary 2012
17
Crummer Investment Management
EconomicOutlook
U.S.EconomicGrowth(GDP)Unfortunately for investors, economic growth after a balance sheet recession rarely shoots up as normal
recoveries do. Consensus estimates predict modest economic growth in 2012 and 2013. The IMF sees the US
economy growing at a real rate of 1.8% in 2012, and accelerating to 2.3% in 2013. Morgan Stanley recently
revised its predictions upward to 2.25% in 2012 and 2% in 2013. While the GDP perspective does not paint a
particularly exciting picture, we believe it combines with other elements to form a positive equity scenario.
TheEuropeanDebtCrisisThe debt crisis that began with Greece and spread to several European nations has cast a cloud over capital
markets for the past year. We believe there is light at the end of the tunnel. So far, the crisis of contagion that
analysts feared has not materialized. Europe has shown some ability to assemble and pass measures to
prevent the financial crisis from deepening. While this does not mean the threat is over, we believe Europe is
unlikely to descend into a full‐blown meltdown.
One side effect of the crisis is the spread of austerity across European governments. This, combined with
other headwinds, is likely to keep Europe in recession or limited growth through 2013. Therefore, we expect
poor performance for most European equities. However, we also believe the irrational panic that spread
through the markets in the worst days of the debt crisis suppressed equity values unduly and created value
purchase opportunities. We have also seen the correlations between the developed world (EAFE) and the US
rise to unprecedented levels. At the same time the less developed world is less correlated, therefore offers
both diversification and growth opportunities not available in the EAFE countries. Our research turned up a
number of undervalued investments in both the Euro zone and less developed countries.
FinancialMarketsAfter years of intense volatility, the capital markets are experiencing an exciting correction upward. In 2012
year to date, the S&P 500 has increased in value by 12%. Furthermore, cyclical stocks are outperforming. The
market appears to endorse the coming recovery.
ConclusionWe find ourselves in the same position as our predecessors; endorsing a recovery and shifting the portfolio
towards a cyclical asset allocation. Unlike last year, however, the market appears to endorse an upcoming
recovery. With fears of European crisis dimmed and a growth friendly federal reserve, we believe that the

18
Crummer Investment Management
current stock market recovery has legs. Furthermore, we believe overblown fears from Europe led to several
strong equities being undervalued more than was rational. These firms, located either in Europe or with
significant European exposure or outside the EAFE countries, will make excellent value buys in the upcoming
fiscal year.

19
Crummer Investment Management
SectorAnalysis
20
Crummer Investment Management
ConsumerDiscretionary Historical Behavior is Volatile
The consumer sector encompasses consumer related industries and tends to be the most sensitive to economic cycles. Its manufacturing segment includes automotive, household durable goods, textiles & apparel and leisure equipment. The services segment includes hotels, restaurants and other leisure facilities, media production and services, and consumer retailing services. Over 40% of the sector’s assets are tied to retailers, restaurants, about 23% are media‐based companies, and about 22% are apparel and consumer goods companies. During the recent recessionary, this sector took a hard hit on total return. The S&P 500 consumer discretionary total return in October 2008 fell 19.19% (its worst return in over 20 years), rivaling the other losses recorded by Energy (‐22.48%) and Materials (‐22.07%). This sector typically averages a 1.5% total annual return in a more normalized market. However, we have identified specific opportunities within our analysis that we believe can exceed this return to meet the objective return for the portfolio. We believe that there are still sufficient opportunities to reap gains from the economic recovery as consumers continue to shift away from their skittish view on the market.
Forward Look is Positive
We believe that this overall sector will benefit from even slight increases in macroeconomic factors like
employment and consumer confidence, but most of the factors that will warrant growth in this sector are
company‐specific. The consumer confidence index has been increasing since December of 2012 and hit all‐time
high for a 12‐month period, despite mixed economic signs in March along with higher energy and food prices.
The better a firm did to manage itself during the economic downturn the more faith we have that it has
developed a forward‐looking plan for success that it can execute. In addition, we know that some companies
were more susceptible to downturns in the economy. However, those firms that managed to minimize
earnings losses are generally better positioned for strong recoveries. We also know that some of these firms
managed to stave off losses by cutting expenses while revenues stayed flat—painting a better picture to
investors. Other firms grew margins but hoarded cash and are ready to begin to grow organically, inorganically,
or both. We view the discretionary sector as poised for a good comeback, but we think that specific firms
within the sector are better postured for growth because of their unique operating plans.

21
Crummer Investment Management
Lowe’sCompaniesInc.(LOW)
Technical Analysis
Bollinger Bands Neutral
Money Flow Positive
Relative Strength Neutral
Introduction
Lowe's Companies, Inc., together with its subsidiaries, operate as a home improvement retailer in the United States and Canada. The company offers a range of products for home decorating, maintenance, repair, remodeling, and property maintenance.
Fundamental Analysis
Lowe’s continues to be plagued by a housing market that continues to be depressed. As
Americans shift from home ownership to rentals, the demand for this industry continues to be low. This industry is also heavily reliant on transportation costs to maintain its margins and rising gas prices will further place a strain on company margins.
Financial Statement Analysis
After a brief recovery in 2010, Lowe’s has experienced net income contraction from 2010 to 2011 from $2,000MM to $1,840MM. While revenues have grown at an anemic rate, the company has experienced higher operating costs that increased 63bsp YOY. This is the company’s highest levels of costs for the last five years.
Conclusion & Recommendation
The housing market will still need a couple of years to recover and with that there will still be some very difficult years ahead for Lowe’s and the home improvement industry. Any gains in revenues in the near future may be a direct result of sacrificing margins. For that reason, we recommend a sell on this security.
Recommendation Sell
Valuation $21.03
Last Price $31.07
As of 3/30/12
Style Sub‐sector Large‐Core Home Improvement
22
Crummer Investment Management
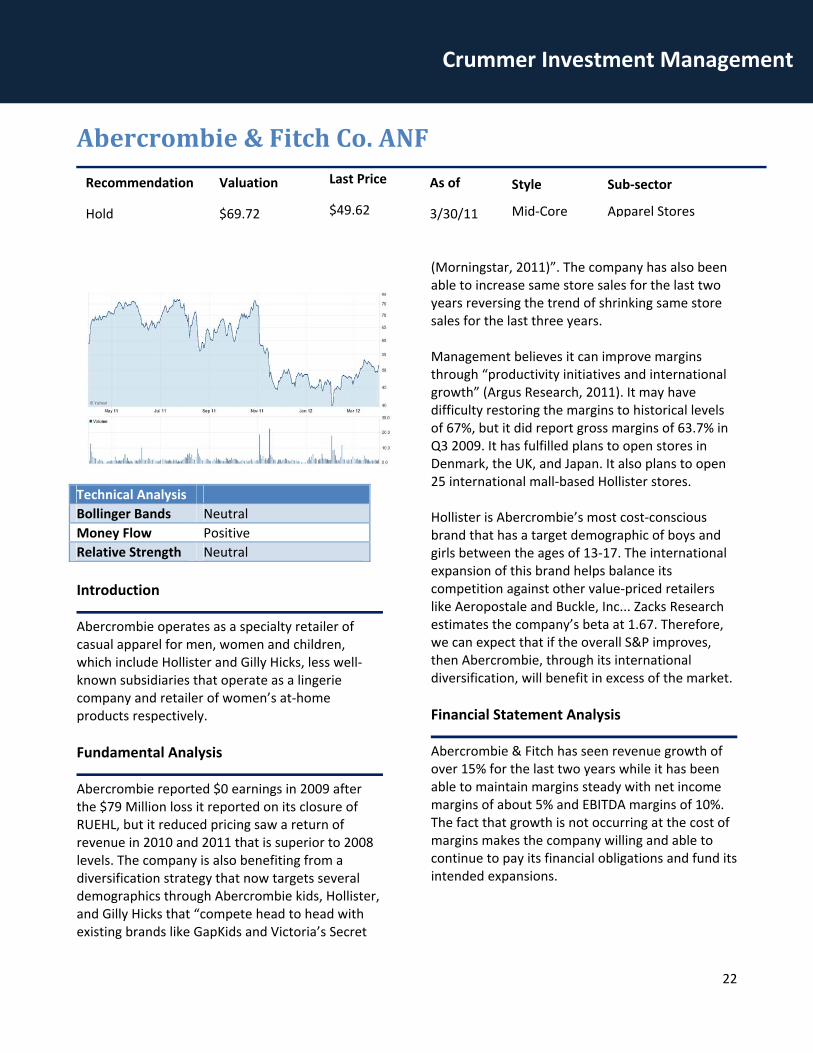
Abercrombie&FitchCo.ANF
Technical Analysis
Bollinger Bands Neutral
Money Flow Positive
Relative Strength Neutral
Introduction
Abercrombie operates as a specialty retailer of casual apparel for men, women and children, which include Hollister and Gilly Hicks, less well‐known subsidiaries that operate as a lingerie company and retailer of women’s at‐home products respectively.
Fundamental Analysis
Abercrombie reported $0 earnings in 2009 after the $79 Million loss it reported on its closure of RUEHL, but it reduced pricing saw a return of revenue in 2010 and 2011 that is superior to 2008 levels. The company is also benefiting from a diversification strategy that now targets several demographics through Abercrombie kids, Hollister, and Gilly Hicks that “compete head to head with existing brands like GapKids and Victoria’s Secret
(Morningstar, 2011)”. The company has also been able to increase same store sales for the last two years reversing the trend of shrinking same store sales for the last three years. Management believes it can improve margins through “productivity initiatives and international growth” (Argus Research, 2011). It may have difficulty restoring the margins to historical levels of 67%, but it did report gross margins of 63.7% in Q3 2009. It has fulfilled plans to open stores in Denmark, the UK, and Japan. It also plans to open 25 international mall‐based Hollister stores. Hollister is Abercrombie’s most cost‐conscious brand that has a target demographic of boys and girls between the ages of 13‐17. The international expansion of this brand helps balance its competition against other value‐priced retailers like Aeropostale and Buckle, Inc... Zacks Research estimates the company’s beta at 1.67. Therefore, we can expect that if the overall S&P improves, then Abercrombie, through its international diversification, will benefit in excess of the market.
Financial Statement Analysis
Abercrombie & Fitch has seen revenue growth of over 15% for the last two years while it has been able to maintain margins steady with net income margins of about 5% and EBITDA margins of 10%. The fact that growth is not occurring at the cost of margins makes the company willing and able to continue to pay its financial obligations and fund its intended expansions.
Recommendation
Hold
Valuation
$69.72
Last Price
$49.62
As of
3/30/11
Style Sub‐sector
Mid‐Core Apparel Stores

23
Crummer Investment Management
Conclusion & Recommendation
Through a discounted cash flow method forecasting the next 5 years of growth from 0 % to
2% over the long term correlated with consumer confidence rises, the company is undervalued and the position should be held for at least another year.

24
Crummer Investment Management
AutolivInc.ALV
Technical Analysis
Bollinger Bands Neutral
Money Flow Positive
Relative Strength Neutral
Introduction
Autoliv is a Swedish‐based company that develops, manufactures and supplies automotive safety systems to automotive the industry. It primarily markets its products to the North America, Europe and Asia regions.
Fundamental Analysis
Last year a growth in the demand of the company products were predicted due to the per‐capita wealth increases in emerging markets. Morningstar states that the “global average of safety content per vehicle is $260 (Morningstar, 2011)”. However, China’s safety content per vehicle is nearly $200 and India’s is just $70. Because China is perceived to be growing out of its emerging market
perception (but still below the average) and India is still well within it, there is potential for increased demand from both markets. Since Last year, however the Chinese consumer market has experienced an economic slowdown and is expected to suffer further in 2012. This will make growth from international demand in the Asian region unlikely. The growing troubles in Europe over the Euro Sovereign Debt crisis make it unlikely the company will see growth from that segment as well. Organic growth is not likely to be experienced by Autoliv within the next investment year.
Financial Statement Analysis
Autoliv has exhibited strong revenue growth for the past two years, recovering from the great recession that undermined the majority of the automotive industry in 2008. In 2011, the Company was finally able to reach pre‐recessionary levels of revenue but in order to reach growth the company has sacrificed margins in a way that makes future growth a very risky proposition. Conclusion & Recommendation
There is no strong evidence that the company will be able to reach its aggressive growth benchmarks. As a result of the discounted free cash flow model method, this company is correctly priced by the market and therefore should see no further returns in the near future. We recommend the sale of this security.
Recommendation
Sell
Valuation
$66.20
Last Price
$66.12
As of
3/30/12
Style Sub‐sector
Mid‐Value Automotive Parts

25
Crummer Investment Management
TheWaltDisneyCompanyDIS
Technical Analysis
Bollinger Bands Neutral
Money Flow Positive
Relative Strength Neutral
Introduction
Disney operates a worldwide entertainment company. According to its annual report, Disney’s Media Networks segment includes television production and distribution operations and domestic television, radio and cable network stations, including ESPN and ABC. The company’s Parks and Resorts segment owns and operates the Walt Disney World Resort in Florida that includes theme parks, hotels, dining, a sports complex, conference centers, campgrounds, golf courses and water parks. This segment also owns and operates Disneyland Resort in California, Disney Vacation Club and Disney Cruise Line, and it manages Disneyland Resort Paris and Hong Kong Disneyland Resort. Its Studio Entertainment segment produces and acquires live‐action and animated motion pictures, direct‐to‐video programming, musical recordings, and live stage plays. The company’s Consumer Products segment licenses Disney
characters and visual and literary properties to manufacturers, retailers, show promoters, and publishers, and it publishes books and magazines. Its Disney Interactive Media Group segment creates and delivers Disney‐branded entertainment and lifestyle content across interactive media platforms.
Fundamental Analysis
Disney is under the strong leadership of CEO Robert Iger who is continuously looking to make business changes that keep the company proactive in the technological shift of the media industry. Recent developments include a partnership with Apple to supply Disney/ABC content to the iTunes store. In addition, Disney signed an agreement with Hulu in late 2009 to distribute its content over the internet, announced an agreement with the Chinese government for a new park in Shanghai and acquired Marvel Entertainment (Argus Research, 2010). It also struck a short‐term deal with Netflix for select ABC and Disney channel shows. Disney plans to deliver its titles to video‐on‐demand on the same day it releases the DVD to maximize rentals. It has also stood to refocus its cast of characters to produce quality franchises, including Toy Story 3 and Cars 2. Exploiting some of these branded characters should also help its Parks and Resorts and its cruise line segment bounce back from globally poor consumer confidence and discretionary spending. Further, ESPN is 75% contributor to earnings from cable network sales, and its media networks in general generate more than half of the company’s operating profit, benefitting from advertising fees and affiliate fees. The potential to compete with
Recommendation
HOLD
Valuation
$58.86
Last Price
$43.29
As of
3/30/12
Style Sub‐sector
Large‐Core Services

26
Crummer Investment Management
ESPN is slim, so we see this and its media networks continuing to be the backbone of the company. Disney can also see great potential benefits from initiatives from the current administration that would make it easier for foreign visitors to obtain visas. The main beneficiaries of lightening visa restrictions, the Brazilians and the Chinese are among the fastest growing visitor demographic.
Financial Statement Analysis
Disney was able to sustain a compound annual growth rate of 4.2% in revenue since 2008, but a more impressive EBITDA growth of over 12% for the same time period. The company has been able to decrease operating expense costs and improve operating margin consistently for the past three years. A quick look at the company’s free cash flows reveals the company’s distributions are sustainable and should see further growth within the next few reporting periods. .

27
Crummer Investment Management
EinsteinNoahRestaurantGroup,Inc.(BAGL)
Technical Analysis
Bollinger Bands Neutral
Money Flow Positive
Relative Strength Neutral
Introduction
Einstein Noah Restaurant Group, Inc. owns, operates, franchises, and licenses bagel specialty restaurants in the United States. The company operates, franchises, or licenses various restaurant concepts primarily under the Einstein Bros. Bagels, Noah’s New York Bagels, Manhattan Bagel Company, and Kettleman Bagel Company brands. As of January 3, 2012, its retail system consisted of approximately 773 restaurants in 39 states and the District of Columbia.
Fundamental Analysis
Einstein Noah Restaurant Group, Inc. is a leader in the quick casual segment of the restaurant industry. While it serves meals through all of its retail stores, it is well positioned in the growing breakfast market. According to market‐research firm NPD Group, over the past five years, breakfast has accounted for nearly 60% of the restaurant
industry's traffic growth. During that period, breakfast traffic grew 2% on average, while lunch visits were flat and dinner fell 2%. The company has been able to capitalize on that growth and outperform the trend by growing EBT by 5.9%. For the near future, the company plans to capitalize on same‐store sales growth as well as enhancing margins through supply chain, manufacturing and store level efficiency. The company also hopes to expand into the gourmet coffee line and smart options which can add additional growth to the brands as it targets a growing need within the U.S. population for smarter on the go eating options. According to Nielsen, there is a 10% growth rate in spending by Americans in healthy dining. The company will also be rolling out a new loyalty program in the second quarter of 2012.
Financial Statement Analysis
The Company has been generating strong free cash flow and even a modest growth of 5% for the forecasted period will see free cash flow continue to be generated at a strong pace. The company has large amount of debt but has systematically been paying it off and has seen an improvement in both its current ratio (from 0.59 in 2009 to 1.01 in 2011) and interest coverage (from 4.12 in 2009 to 7.38 in 2011).
Conclusion & Recommendation
The breakfast and healthy eating markets are showing strong growth trends ranging from 5% to 20% of restaurant spending. With a conservative projection of 5% growth Einstein is undervalued.
Recommendation
Buy
Valuation
$17.44
Last Price
$14.90
As of
3/30/12
Style Sub‐sector
Small‐Growth Restaurants

28
Crummer Investment Management
McDonald’sCorporation(MCD)
Technical Analysis
Bollinger Bands Neutral
Money Flow Positive
Relative Strength Neutral
Introduction
McDonald’s operates as a worldwide foodservice retailer. It franchises and operates McDonald’s restaurants that offer various food items, soft drinks, coffee, and other beverages.
Fundamental Analysis
The company successfully adapted to changes in consumer demand through the recession by
changes to its menu. For instance, McDonald has introduced its iced coffee drinks when premium branded coffee, similar to that sold by Starbucks, became less attractive to the cash‐strapped consumer. It also has successfully transformed itself to more of a convenience store in reaction to consumers having less time to spend on eating and more time on jobs absorbing more workload during the recession. On that note, McDonald has also introduced its Snack Wrap to target individuals like those who have been laid off or are seeking inexpensive alternatives to full meals. At one point, McDonald’s was selling more Snack Wraps than it was Big Macs. The company also adapted to the health‐ conscious demographic by introducing oatmeal and fruit smoothies to its menu. It has also worked to accommodate a more professional and tech‐savvy environment in its stores by offering free Wi‐Fi. All of this translated into earnings of $27,000MM in 2011, compared to $24,000MM in 2010. We think that this impressive adaptation is convincing enough to support our forecasted future growth and continue to offer an increasing dividend. The dividend has grown approximately 30.5% over the last ten years. Through its system of 80% franchised restaurants and average unit volume of $2.2MM, the McDonald’s brand name sits far above its competition. McDonald’s operates nearly 14,000 units, which is second to Subway who operates the greatest number of units‐ 23,000. Its structure of franchising 80% of its units provides the company with “an annuity like stream of rent and royalties, even during challenging economic times, with minimal corresponding capital needs (Morningstar, 2011).” These royalties carry much more weight when considering that they are based on the strongest average unit volume among its
Recommendation
Hold
Valuation
$118.08
Last Price
$99.40
As of
3/30/12
Style Sub‐sector
Large‐Growth Restaurants

29
Crummer Investment Management
competitors. Further, McDonald’s carries much weight through its brand name in bargaining power and labor expenses that will help it focus on operating margin improvement in the near term.
Financial Statement Analysis
McDonald’s has exhibited steadily improving margins for the last 5 years from 10% net income margins in 2007 to 20% in 2011. The company’s return on equity according to a DuPont analysis has also seen improvement for the last five years from 15% in 2007 to 37% in 2011. Both the balance sheet and income statement show steady turns
and steady margins with increasing revenues, which have directly affected an increasing bottom line.
Conclusion & Recommendation
We recommend buying McDonald’s due to its proactive management plan and its strong unit performances. Even with very conservative revenue growth estimates McDonald’s will be able to deliver to investors both growth and dividend returns.

30
Crummer Investment Management
Staples,Inc.SPLS
Technical Analysis
Bollinger Bands Neutral
Money Flow Positive
Relative Strength Neutral
Introduction
Staples operates as an office products company. The company sells various office supplies and services, business machines and related products, computers and related products, and office furniture. It also provides high‐speed, color and self‐service copying, other printing services, faxing, and pack and ship services.
Fundamental Analysis
It is estimated that Staples can maintain and extend its leading market share positioning through “continuous product line extensions and additional service offerings (Morningstar, 2011).” It aims to expand these margins through a shift to higher‐margin products and services while it
leverages economies of scale realized from its acquisition of Corporate Express. As Staples’ increases its efforts to grow its margins, it also quietly but quickly slips into the focus of more investors as it emerges as a stronger quality retailer. Its operating margins of 6.8% in Q4 2011 yielded a 30bp increase YOY. There is strong confidence that management, under the leadership of CEO Ron Sargent, will be able to control costs and introduce higher‐margin products and services. The company, according to its annual report, estimates that its North American Delivery will increase 380bps to 12%. An increase in marketing effort is expected to midsized companies, “winning more contracts with states and the federal government, encourage customers to buy a wider array of products, emphasize Staples‐brand products, and encourage clients to shop more efficiently by consolidating small orders (Argus Research, 2011).“
Financial Statement Analysis
The Company’s top line growth has been adversely affected by the slow small business environment in the US and abroad and revenue has seen anemic growth of fewer than 2% for the last two years. However, operating margins have also improved from 3% net income margins in 2009 to 4% in 2011. This has resulted in a net income increase of $249MM. The company is ahead of both major competitors office max and office depot in both categories.
Recommendation
Hold
Valuation
$31.77
Last Price
$16.50
As of
3/30/12
Style Sub‐sector
Mid‐Value Specialty‐Retail

31
Crummer Investment Management
Conclusion & Recommendation
Even with very modest revenue growth, the company has been able to make an impact on its bottom line. We believe the company has increased potential for both top and bottom line
growth over the next years as business spending recovers as well as continued efforts of management to control and minimize costs. We recommend a hold of this security.

32
Crummer Investment Management
FordMotorCompany(F)
Technical Analysis
Bollinger Bands Neutral
Money Flow Positive
Relative Strength Neutral
Introduction
Ford Motor Company engages in the development, manufacture, distribution, and service of vehicles and related parts worldwide. The company operates through two sectors, Automotive and Financial Services.
Fundamental Analysis
Ford was the only U.S. Auto Manufacturer not to appeal to the government for bailout money in 2008. Under the leadership of Alan Mulally, the company was also the fastest to rebound back to profitability and has been showing strong growth for the last 3 years. The company has achieved positive net income since 2009 and has recently announced and paid dividends for the first time
since September 2006 when the company found itself to be heavily indebted. The main drivers of growth for Ford are the rebounding American economy in search for a line of cars that is fuel efficient and American. Ford is ahead of both its domestic competitors with a wider range of gas friendly models. Ford will also benefit from the growth of new international markets like China. Even though the Chinese auto market is only estimated to have near future growth of 5%, this segment is a huge opportunity for Ford to see strong sales growth. Currently the company has about 17% market share in the United States and more than 8% share in Europe. Ford and Lincoln brand sales in North America and Europe made up 59% and 26% of 2011 auto revenue, respectively. The Asian market should more than compensate for any revenue lost in Europe due to the Euro crisis. At a very conservative growth, range of 1% to 5% based on U.S. future demand for cars as well as future Chinese demand Ford will generate strong free cash flow growth that will support further re‐investment and strong and rapid growth for the company.
Financial Statement Analysis
Ford has experienced a compound annual growth of over 8% in the last three years but has seen a much greater 82.2% growth in EBIT margins. The company has been able to accomplish this by streamlining costs as part a massive restructuring project. Operating Expenses have decreased from 11.15% in 2009 to 8.47% by the end of 2011. The company has also been able to pay down a substantial amount of debt. Ford has paid down more than $15 billion in debt over the past three
Recommendation
BUY
Valuation
$18.02
Last Price
$12.64
As of
3/30/12
Style Sub‐sector
Large Value Auto‐Manufacturers

33
Crummer Investment Management
years. This has in large part also been achieved by the sales of the least profitable segments of the company like Jaguar/Land Rover to Tata Motors.
Conclusion & Recommendation
Ford shows strong leadership, great sustainable growth potential and successful cost management. The company is poised to continue a strong recovery and we recommend the purchase of this security.

34
Crummer Investment Management
HealthCareSector
The Crummer Portfolio currently holds five health care stocks: Abbott Laboratories, Johnson & Johnson, Merck & Co. Inc., Stryker Corporation, and Teva Pharmaceuticals Industries. The healthcare portion of the portfolio represents a diversified group of companies with businesses in branded pharmaceuticals, generic pharmaceuticals, medical equipment, and diagnostics and research. Three stocks in the portfolio, Johnson & Johnson, Stryker Corporation, and Teva Pharmaceuticals have realized their underlying value in the current market price, and thus they warrant a sell recommendation. One stock, Merck & Co Inc. has come close to realizing its fundamental value but there is stillroom for capital appreciation. To be conservative, it is recommended that the portfolio continue to hold the stock. One stock in the portfolio, Abbott Laboratories, still has room for an increase in stock price between its price and underlying value and thus, it is recommended that the portfolio increase its position. Three new stocks are also being added. They are PDL BioPharma, Quest Diagnostics, and WellPoint. The first of these is primarily in pharmaceutical sales, the second is primarily in diagnostics and research, and the last is in the health care plans. Health Care Reform Healthcare reform, as defined by the Patient Protection and Affordable Care Act (PPACA), was signed into law by President Obama on March 23, 2010, and requires most U.S. citizens and legal residents to have minimum essential health insurance coverage. While Republican critics have called for repeal of the law, it is unlikely this will be the case, at least in the near‐term. The reason is that this would require a filibuster‐proof, 60‐vote Republican majority in the Senate and control of the presidency. The Supreme Court will soon hear oral arguments on whether or not Congress does in fact have this individual mandate power. The Obama administration will argue this is a natural extension of the Federal Commerce power while states will argue it is an infringement on their police powers. The penalties for not carrying insurance in comparison with the cost of health benefits, however, are modest. Furthermore, the provision lacks a strong enforcement mechanism. The primary tool as a means of government enforcement is the withholding of tax receipts. The court could rule that the case is not ripe for decision making because taxes have yet to be collected. This would cause greater uncertainty to the health care system. Regardless of the outcomes, the negatives are likely netted out by other positives. If the law is upheld this is likely to be favorable to our new holding WellPoint. Patent Expirations It is widely known that large capitalization pharmaceutical companies are facing a large quantity of patent expirations in the near future. A June 2011 report by EvaluatePharma states that approximately $255 billion sales of pharmaceuticals are at risk. Furthermore, an expected cumulative sales loss of about $139 billion is supposed to occur between the years 2011‐2016 as generics threaten the gamut of patentless brand drugs. The projected impact of this patent cliff is about one‐fifth of global prescription drug sales in 2010. Singulair is the only major patent expiration for Merck in 2012 one of our holdings. The picture for Merck, however, looks much more optimistic after the merger with Schering‐Plough. Our new holding PDL Biopharma’s patent expirations are largely offset by its robust dividend yield and the potential for capital appreciation should it prevail in patent protection litigation against its partners.
35
Crummer Investment Management
Comparative Effectiveness Research: Opportunities for Manufacturers
Healthcare reform and CER presents a host of opportunities for equipment manufacturers. Increased
insurance coverage should expand the customer base of cardiology and orthopedic device makers, as well as
manufacturers of healthcare capital equipment. The medical device industry was relieved when the Institute of
Medicine recommended to Congress that the new CER studies focus on comparisons of entire treatment
regimens rather than the narrow comparisons of particular technologies. AdvaMed believes that CER will
improve clinical outcomes. The success of CER depends ultimately on how well it is executed. The Patient‐
Centered Outcomes Research Institute, a non‐profit, non‐federal government overseeing CER created by the
PPACA, may not mandate coverage, reimbursement, or policy changes. Even so, CER findings may eventually
have an impact on Medicare and Medicaid reimbursement and possibly private health insurance coverage. The
latter could be in the form of tiered reimbursements or pay‐for‐performance bonus payments. Under this
scenario, CER could significantly influence future product development and even the sales of certain
technologies. Thus, while CER could increase the size and costs of clinical trials, it may ultimately lead to
devices that are more effective and fewer “me‐too” products. This will ultimately help propel the growth of
companies such as Quest Diagnostics and Abbott Laboratories.
Conclusion
We feel that the uncertainty surrounding the healthcare industry and the subsequent fear from investors
poses an opportunity to purchase undervalued securities. Health insurance in the United States has pricing
power. Finding the insurance with the strongest competitive advantage, which is related to local economies, is
key. WellPoint is the clear choice in this arena due to its local concentration, and currently it is trading at a very
attractive price (and far less than what it appears to be due to the amount of cash on the balance sheet). PDL
BioPharma is also a recent addition to the portfolio. The problem with most pharmaceutical companies is that
they have stable cash stream from their portfolios of their existing paths of drugs, and then they give it away in
the research and development process. PDLI however split off its royalties on its existing drugs from the R&D
process and boasts an attractive dividend. Quest diagnostics dominates its business and faces only one real
threat in a smaller competitor. Merck will continue its success but due to its price nearly equaling fair value,
we recommend a hold.

36
Crummer Investment Management
AbbottLaboratoriesABT
Technical Analysis
Bollinger Bands Neutral
Money Flow Positive
Relative Strength Positive
Introduction
Abbott Labs is an Illinois corporation with its principal business being devoted to the discovery, development, manufacture and sale of a broad and diversified line of health products. Due to positive drivers of growth from Humira we recommend to increase our position
Fundamental Analysis
The biggest competitive advantage Abbott has is its plethora of patents to curtail the threat of generics. Humira has experience 20% growth in recent years and the drug should continue to produce low double‐digit growth in sales in 2012. Other positive drivers for growth in 2012 include the acquisitions of Solvay’s pharmaceuticals business, and Piramal
Healthcare solutions, which should add exposure to emerging market and increase long‐term shareholder value. The firm has also added to its vascular line, which positions the company for favorable growth. The firm has returned positive clinical data on its new drug‐coated stent Xience versus the incumbent Boston Scientific’s stent Taxus, which has resulted in increased market penetration. We believe that Abbott’s plan to separate into two publicly traded companies, one in diversified products and the other in research‐based pharmaceuticals, will serve as a catalyst that unlocks shareholder value and bridges the gaps between price and intrinsic value. Financial Statement Analysis
Abbott consistently delivers high returns on equity above 20% and has done so for the past ten years. We expect this trend and outperformance of other companies in the industry to continue into the future. Moreover, the company’s dividend has increased at a steady and predictable rate over time. The company has less cash on its balance sheet than its industry peers due to its recent acquisitions. This is not a cause for concern due to the increasing healthy free cash flow that is generated over time. Conclusion & Recommendation
Abbott’s stellar growth from Humira, its recent acquisitions, the promising outlook for Xience, and the company’s huge network of patents makes ABT a continuously attractive vehicle for long‐term growth. Our DCF valuation of $75.03 suggests that there is still some value in spite of the run‐up in price. We recommend increasing our position.
Recommendation Buy
Valuation $75.03
Market Price $61.29
As of 3/30/12
Style Large Value
Industry Drug Manufacturers

37
Crummer Investment Management
QuestDiagnosticsInc.(DGX)
Technical Analysis
Bollinger Bands Neutral
Money Flow Neutral
Relative Strength Positive
Introduction
Quest Diagnostics is the leading independent provider of diagnostic testing, information, and services in the United States. Due to positive drivers for growth in the industry and the company’s ability to outpace growth in medical supplies because of its competitive position, we recommend a buy.
Fundamental Analysis
The independent diagnostic testing business in the United States is essentially a duopoly that is dominated by the firm and its chief rival Laboratory Corporations. The two companies operate most of the independent commercial labs that comprise about 33% of the approximately $45 billion market in the United States. The vast networks of laboratories have permitted Quest to erect modest barriers to
entry. This in turn has allowed Quest to capture greater market share and to generate strong cash flow. The industry is predicted to experience high single digit short‐term growth but Quest is pursuing a strategy that should allow it to grow its business at a higher rate than the industry and further widen their competitive advantage. This strategy includes overseas acquisitions to consolidate the fragmented international market and shifting its product mix to higher margin and complex test that require technicians to administer. Financial Statement Analysis
Quest has several characteristics that make it an attractive purchase. Both operating margins and net margins far exceed that of the industry while the company trades at a lower multiple to earnings than the industry average. Return on equity also exceeds the industry average by ten percent. Moreover, the company also trades cheaper than the industry average on price to book and price to sales ratios. Lastly, downside risk is limited because debt to equity is far below the industry average. Conclusion & Recommendation
Quest is likely to outpace the modest short‐term industry growth rate. The company has carved itself a sustainable competitive advantage and its acquisition and product mix strategy is likely to reward the company with greater market share and help it generate more cash flow. Our DCF valuation of $76.37 suggests attractive upside potential if Quest executes this growth strategy. As a result, we recommend purchasing the stock.
Recommendation Buy
Valuation $76.37
Market Price $61.15
As of 3/30/12
Style Mid Value
Industry Diagnostics

38
Crummer Investment Management
Johnson&JohnsonJNJ
Technical Analysis
Bollinger Bands Neutral
Money Flow Neutral
Relative Strength Neutral
Introduction
Johnson & Johnson is a diversified health care company that develops manufacturers, and markets products in pharmaceuticals, medical devices and diagnostics, and consumer health care products. Due to the stock’s price realizing intrinsic value, we recommend a sell.
Fundamental Analysis
Johnson & Johnson has not lived up to its high standards recently, and as a result, the stock’s performance has lagged in the market. The company got into trouble recently when it had to recall 574,000 bottles of Tylenol because issues arose regarding the dosage. As a result, the quality and safety of JNJ’s products have received scrutiny. Increased
competition has further eroded JNJ’s sustainable competitive advantage, such as when competitors Proctor & Gamble and Teva Pharmaceuticals entered into a partnership to sell over‐the‐counter drugs last spring. Because the firm’s patents for its OTC products have begun to expire, JNJ has lost market share. The company has also had to deal with having to recall a sizeable amount of hip implants and as well as quantities of Motrin and Benadryl is produces. As a result, the US Health Department ended up taking temporary control of three production plants that belong to JNJ because of these massive recalls. The hip replacements alone will cost the company $3 billion. Aside from the daunting threats of litigation, we no longer express confidence in JNJ’s current management. Financial Statement Analysis
JNJ trades at a higher earnings multiple than the rest of the industry yet has narrower net margins and a lower return on equity. Earnings per share have decreased in the past three years and revenue growth lags by more than three‐fourths of the industry average. Workings capital requirements have also increased over the years. We believe that margins will continue to be squeezed by at least 100 basis points. Conclusion & Recommendation
JNJ has failed to live up to its reputation of standard and quality as of recently. Management has made too many errors as of recently and we feel that the market price of the stock is at fair value. Our DCF valuation arrived at $65.26. Because there are more compelling opportunities in other healthcare stocks, we recommend a sell.
Recommendation Sell
Valuation $65.26
Market Price $65.96
As of 3/30/12
Style Large Value
Sub sector Healthcare
39
Crummer Investment Management
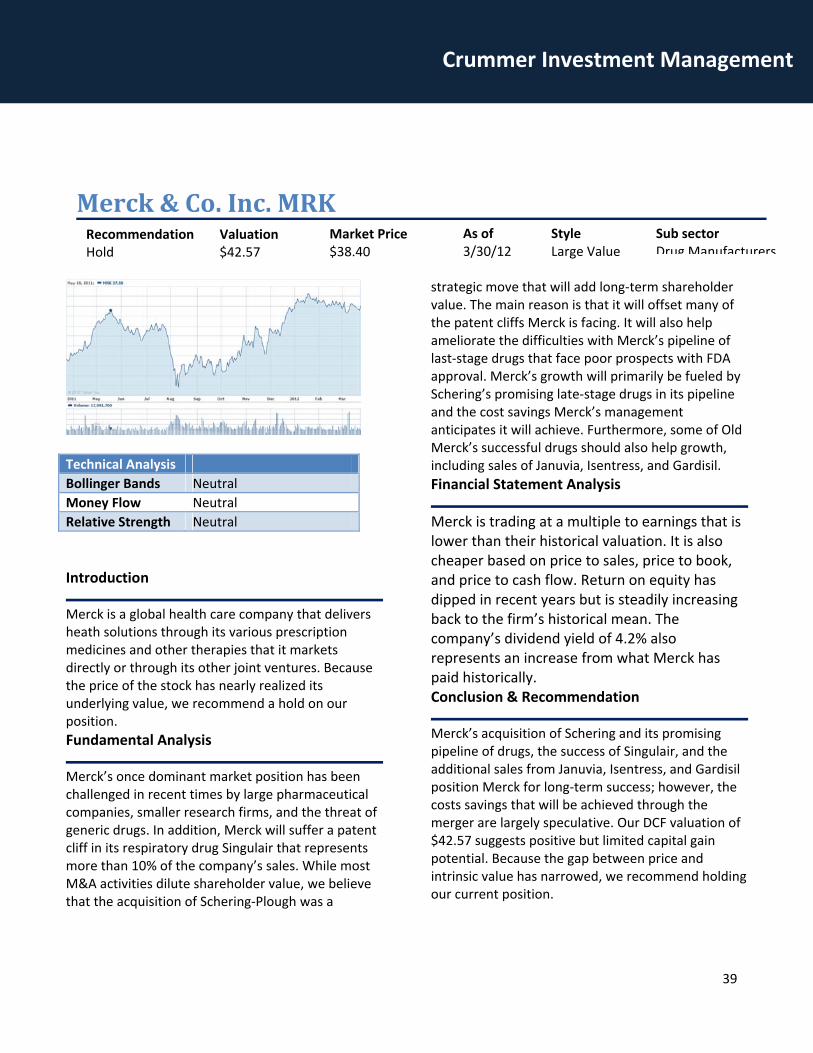
Merck&Co.Inc.MRK
Technical Analysis
Bollinger Bands Neutral
Money Flow Neutral
Relative Strength Neutral
Introduction
Merck is a global health care company that delivers heath solutions through its various prescription medicines and other therapies that it markets directly or through its other joint ventures. Because the price of the stock has nearly realized its underlying value, we recommend a hold on our position.
Fundamental Analysis
Merck’s once dominant market position has been challenged in recent times by large pharmaceutical companies, smaller research firms, and the threat of generic drugs. In addition, Merck will suffer a patent cliff in its respiratory drug Singulair that represents more than 10% of the company’s sales. While most M&A activities dilute shareholder value, we believe that the acquisition of Schering‐Plough was a
strategic move that will add long‐term shareholder value. The main reason is that it will offset many of the patent cliffs Merck is facing. It will also help ameliorate the difficulties with Merck’s pipeline of last‐stage drugs that face poor prospects with FDA approval. Merck’s growth will primarily be fueled by Schering’s promising late‐stage drugs in its pipeline and the cost savings Merck’s management anticipates it will achieve. Furthermore, some of Old Merck’s successful drugs should also help growth, including sales of Januvia, Isentress, and Gardisil.
Financial Statement Analysis
Merck is trading at a multiple to earnings that is lower than their historical valuation. It is also cheaper based on price to sales, price to book, and price to cash flow. Return on equity has dipped in recent years but is steadily increasing back to the firm’s historical mean. The company’s dividend yield of 4.2% also represents an increase from what Merck has paid historically. Conclusion & Recommendation
Merck’s acquisition of Schering and its promising pipeline of drugs, the success of Singulair, and the additional sales from Januvia, Isentress, and Gardisil position Merck for long‐term success; however, the costs savings that will be achieved through the merger are largely speculative. Our DCF valuation of $42.57 suggests positive but limited capital gain potential. Because the gap between price and intrinsic value has narrowed, we recommend holding our current position.
Recommendation Hold
Valuation $42.57
Market Price $38.40
As of 3/30/12
Style Large Value
Sub sector Drug Manufacturers

40
Crummer Investment Management
StrykerCorporationSYK
Technical Analysis
Bollinger Bands Neutral
Money Flow Neutral
Relative Strength Positive
Introduction
Stryker Corporation is a medical technology company that provides innovative orthopedic implants and state of the art medical and surgical equipment. Due to a mix of negative drivers and the minimal difference between the stock’s price and value, we recommend a sell.
Fundamental Analysis
We have reduced our fair value estimate from last year for several reasons. First, we feel less confident in the company’s prospects now that Chairman and CEO Stephen MacMillan have stepped down from his role. MacMillan and his team were very effective and without him, we feel that the firm faces more uncertainty, both in terms of capital allocation and in strategic direction. Thus, we no longer believe the
firm will reach its projected growth targets. Other short‐term difficulties exist: Although all outstanding FDA warnings letters directed at the company were lifted we feel that the company will struggle with improving its manufacturing operations. In addition, third‐party payers have increased scrutiny of the spine market. Stryker specializes in niche strategies and this increased scrutiny could inhibit Stryker’s growth, especially in the absence of a CEO. Lastly, the regulatory environment and health care reform is likely to reduce long‐term returns in Stryker’s domestic operations, which accounted for 65% of the company’s business.
Financial Statement Analysis
Return on invested capital has incrementally decreased in recent years, having hovered around 20% and is now at 15%. Moreover, Stryker’s operating margins have seen a squeeze of 300 basis points this year and this trend is likely to continue in the face of the regulatory climate. In addition, Stryker is trading at a greater multiple than to its other industry counterparts on several bases including price to book, price to sales, and price to cash flow.
Conclusion & Recommendation
The lack of a CEO and definite strategic direction, the effects of an increased regulatory environment, and the company’s short‐term manufacturing difficulties are all a cause for concern. Our DCF valuation of$57.96 suggests that there is little margin for capital appreciation. Given our new fair value estimate and our assessment of the company’s position, we recommend a sell.
Recommendation Sell
Valuation $57.96
Market Price $55.48
As of 3/30/12
Style Large Core
Sub sector Medical Devices

41
Crummer Investment Management
TevaPharmaceuticalIndustries(TEVA)
Technical Analysis
Bollinger Bands Neutral
Money Flow Neutral
Relative Strength Positive
Introduction
Teva Pharmaceutical Industries engages in the development, production, and sale of generic and branded pharmaceuticals, biogenerics, and active pharmaceutical ingredients worldwide. Due to short‐term negative growth drivers, we recommend to sell the stock.
Fundamental Analysis
We believe that the main negative drivers that will adversely affect Teva stock in the short‐term is two‐fold: 1) The decline in generic drug launch opportunities near 2014 and 2) the impending generic competition on Teva’s most highly profitable drugs Provigil and Copaxone. We also vastly prefer pharmaceutical companies whose
drugs are protected by patents and Teva derives most of its revenue from the sale of generics, which we feel is far less a competitive advantage. Moreover, patent expiration opportunities will likely substantially decline after the patent cliff in 2013. The company touts its opportunities with so‐called biosimilars, however, Teva has had mixed success and slow market share gains with its European biosimilar launches. We believe that such product launches in the U.S. will be met with similar mixed results. Once Teva’s most profitable drugs expire, we feel that margins will be adversely impacted in a serious manner. Furthermore, it will be difficult for management to replace these drugs once they do expire, especially after recent failings in the pipeline to win FDA approval.
Financial Statement Analysis
Teva’s recent returns on invested capital of 8% have dipped below our current estimation of what the firm’s cost of capital is. Thus, we feel that any growth is potentially destructive to shareholder value. Operating margins have wildly fluctuated between 9‐26% in recent years. We feel that they will be in the lower range in the next two years due to the company’s patent cliff. Moreover, returns on equity have been erratic over the past decade, suggesting that it is very difficult to project the cash flows of the company.
Conclusion & Recommendation
Teva’s lack of generic drug launch opportunities, the patent cliff from its most profitable drugs, and a heavy reliance on the sale of generics are
Recommendation Sell
Valuation $42.02
Market Price $45.06
As of 3/30/12
Style Large Growth
Sub sector Drug Manufacturers

42
Crummer Investment Management
negative drivers for sustainable growth. Our DCF valuation of $42.02 implies that fair value has already been realized in the market.

43
Crummer Investment Management
PDLBiopharma(PDLI)
Technical Analysis
Bollinger Bands Neutral
Money Flow Neutral
Relative Strength Positive
Introduction
PDL Biopharma discovers and develops humanized monoclonal antibodies and receives royalties from marketed products licensed under its patents. Due to its undervaluation and attractive, robust dividend yield, we recommend buying the stock.
Fundamental Analysis
PDLI is essentially a royalty and patent defending company. The firm’s assets consist of antibody humanization patents and royalty assets containing its Queen et. al patents and licensing agreements. The Queen et. al patents are four patents owned in the U.S. and five supplementary patents in the E.U. and extend until December 2014.These patents are then licensed to various biotech and pharmaceutical companies. The income derived from these activities is then returned to
shareholders in the form of a dividend and convertible note paybacks. The income stream from the company acts like an annuity with depreciating assets. This is why the company is able to employ only nine employees. The reason for the market’s undervaluation is the threat of litigation from its partners that use it products including Herceptin, Avastin, and Lucentis. A court case is currently pending for May 13, 2013 against Genentech and Roche, and if PDLI prevails, the company could receive up to $1 billion for breach of a royalty contract. Financial Statement Analysis
The company has recently distributed a quarterly dividend of $.15 per share for the past eight quarters. This amounts to about a 9.5% yield from its royalty income stream and this is likely to continue until its patents expire. Margins are wide and will continue to be so because the company has no R&D costs. Return on assets have been high at 73% and will continue to be high until the date of expiration of the patents.
Conclusion & Recommendation
PDLI’s wide margins, its high returns on capital, sizeable dividend yield, and potential for capital appreciation should it prevail in litigation all make the firm an attractive purchase. The firm also has the advantage of no R&D costs, which is atypical of biotech companies. Our valuation of $10.17 suggests attractive upside potential with limited downside exposure. Because of this, we are recommending to buy the stock.
Recommendation Buy
Valuation $10.17
Market Price $6.36
As of 3/30/12
Style Small Value
Sub sector Biotech

44
Crummer Investment Management
Wellpoint,Inc.(WLP)
Technical Analysis
Bollinger Bands Positive
Money Flow Positive
Relative Strength Positive
Introduction
Wellpoint is a U.S. health benefits company and an independent licensee of the Blue Cross and Blue Shield Association. Due to its regionally entrenched competitive advantage and deep discount to intrinsic value, we recommend a buy.
Fundamental Analysis
Wellpoint is the largest publicly traded health benefits company in terms of membership in the United States, and its member base experiences organic growth nearly every year. The company has a very powerful local position, only in 17 states. As such, Wellpoint enjoys a meaningful cost advantage that separates the company from its competitors. The scale Wellpoint enjoys is critical because it allows the organization to spread fixed administrative costs over more members and helps
it to negotiate the best discount with health care providers. The company also has a shareholder orientation: It sold its sub‐scale subscription drugs service at a very good price to the industry leader and distributed most of the money to its shareholders. It has also aggressively bought back its own shares. From 2005 to 2010, the firm retired a third of its shares, and this trend has continued into 2011. The company also announced, for the first time in its history, the payout of a dividend. Financial Statement Analysis
Wellpoint is trading at a relatively attractive P/E ratio of 9.2 compared to its industry. The multiple is actually far lower because of the cash embedded in the company’s balance sheet. Margins have remained relatively stable and earnings and book value have grown at a steady, predictable pace. The company generates free cash flow between 2 billion and 4 billion a year. Because capex is low, 90% of the company’s earnings are converted into free cash flow permitting management to continue buying back shares.
Conclusion & Recommendation
Health insurers are likely to continue to experience organic growth for many years to come, and Wellpoint will continue to add to its already large membership base because of its competitive advantages. We believe that the market has overreacted to the threat of health reform legislation, and as such, we recommend buying the stock.
Recommendation Buy
Valuation $114.44
Market Price $73.80
As of 3/30/12
Style Large Value
Sub sector Health Plans
45
Crummer Investment Management
Energy
The energy sector currently represents about 11.74% of the S&P 500, and 8% of the Crummer Portfolio. The sector has performed extremely well due to the recent spike in oil prices over the past few months. Typically, the energy sector performs well at the top of the economic cycle, and is commonly seen as a laggard in the economic expansionary cycle. However, growing demand for refined products has supported the quick rebound and improved financial returns. The securities in the energy sector are heavily impacted by the commodity prices of oil and natural gas. The price of oil, as represented by the WTI benchmark, has risen significantly to around $105 per barrel, from a low of around $45 per barrel in 2008. Middle East uprisings continue to push the price of oil higher, due to an anxiety premium over a supply decrease. This higher price should drive increased revenues in exploration and integrated firms. Conversely, the price of natural gas has remained stagnant at around 2.06/mmBtu, due to a domestic supply glut plus an unseasonably warm winter, which weakened recent demand. Any rise in this price would benefit integrated and drilling firms. The Crummer Portfolio currently has holdings in six firms, separated into three large cap companies, one mid and two small cap companies. The stocks in the portfolio track the overall sector well, with over a 96% correlation. Selling our positions in Helmirich and Payne, Suncor, Clean Energy Fuels Corp, and OYO Geospace would allow the fund to lock in gains seen from the upswing in Oil prices, and protect us from the prediction of Oil prices to come back down to a more reasonable level in the coming year. The stocks which were added all carried heavy dividends while still providing solid positive cash flow, and were added in an effort to supply good steady returns from a sector, which is heavily tied to the volatile and unpredictable movements of oil and gas commodity prices. Calumet Specialty Products Partners is a solid investment that will give us more exposure to small cap equity while also having a low beta due to its lower sensitivity to changing commodity prices. Transocean is an undervalued play, which will take advantage of the hunt for oil offshore, and Petro China will serve as a way to invest in the heavy energy demand of the non‐OECD countries of the east.

46
Crummer Investment Management
ChevronCorp.CVX
Technical Analysis
Bollinger Bands Neutral
Money Flow Negative
Relative Strength Neutral
Introduction
Chevron Corp. is a global integrated oil company and the second largest oil company in the United States. The company targets both oil and natural gas plays, and is engaged in both upstream and downstream operations, primarily in the United States, Africa, and Australasia. The upstream operations involve the exploration, extraction, and shipping of crude oil and natural gas. The downstream operations include refining and marketing the raw materials extracted. In addition, Chevron manufactures and markets industrial‐use petrochemicals, and holds stakes in renewable energy operations.
Fundamental Analysis
Higher oil prices favor the integrated structure of Chevron, as the company has control over the entire supply chain and is able to sell its extracted
crude oil for more. If oil prices stay high as expected for the long term, the company stands to increase its revenues and earnings this year, as its costs along the supply chain should stay level. Higher oil prices also provide a larger cash flow for the company, encouraging future oil exploration and new capital expenditures, leading to increased oil reserves. Chevron is also a large producer of natural gas, increasing its position in the Marcellus shale gas region with its takeover of Atlas Energy done last year. With the recent supply glut of natural gas, prices have come down to record lows, but leave positive things looking forward as natural gas is expected to bounce back due to increase use for electric power and a return of normal weather patterns going forward. Chevron has been able to overcome the growing difficulty to expand production and meet demands. It has done so through partnerships with other oil companies and through its push in deep‐water exploration. As more of these projects start producing, returns will become more and more favorable going forward. Chevron’s solid exposure to the Asian markets through properly placed refineries will position the company to take advantage of the faster growing demand in the region. That paired along with Chevron’s diesel refined products should overcome sluggish demand seen from U.S. and European economies. Should commodity prices come back down to lower levels due to lower demand from European and American economies then Chevron’s
Recommendation HOLD
Last Price $107.21
Valuation $140.65
As of Date 3/30/12
Style Sub‐sector Large Value Energy

47
Crummer Investment Management
performance will be affected enough to cause push down on profits. With Chevron being exposed to both the upstream and downstream side of the oil markets, it can be more resistant than most to oil price fluctuations. The resistance is seen in Chevron’s beta of .77. Chevron has exposure to legislation risk, which is concentrated in an incident in Ecuador that took place over 18 years ago. Ecuador is still in the process of going through the case but it is not expected to affect performance in the short term. Much of Chevron’s deep‐water exploration is in the Gulf of Mexico where the BP spill took place. Were any problems were to occur in the region with exploration it would be a huge hit to the company’s bottom line. Other threats for Chevron come from exposure to many unstable regions in the world such as the Middle East and West Africa. Chevron’s international projects diversify its geo‐political risk, but also leave the companies illiquid projects vulnerable. Chevron has large‐scale projects ready to support the company in the future. Most notable is the Gorgon Project, a liquid natural gas facility in construction off the north‐west corner of Australia that is expected to produce 15 million‐metric‐tons‐per‐year of LNG. Chevron holds a 47.3% interest in the project, and already has 90% of its supply under contract to be delivered upon opening of the plant in 2014. Chevron has a diverse renewable energy portfolio, although it currently only contributes a small amount of revenue. The company desires renewable energy to be a part of its future operations, and with the growth in this field, one can expect Chevron to increase its stake, either organically or through acquisitions.
Financial Statement Analysis
Chevron’s 2011 annual report showed a tremendous improvement in earnings from 19 to 27 billion dollars. The increase in earnings has been put to use through more investments in PP&E while also increasing dividends by 12.5% and $4.25 billion worth of stock repurchases. With the 2.9% dividend yield and increase in investments, free cash flow has still dramatically increased 24.27% and will looks to improve with the completion of projects started by Chevron.
Conclusion & Recommendation
Chevron’s exposures to both upstream and downstream parts of the oil and gas production process give it a level of protection from volatile commodity prices. The geo‐political risk that it picks up from international operations is counter‐ balanced by gaining exposure to the growth markets present in Asia. Chevron’s diversification and long‐term projects are poised to give Chevron solid steady growth in the coming years making our recommendation a hold for the Crummer portfolio.

48
Crummer Investment Management
CleanEnergyFuelsCorp.CLNE
Technical Analysis
Bollinger Bands Neutral
Money Flow Negative
Relative Strength Positive
Introduction
Clean Energy Fuels Corp. services natural gas fleet vehicles primarily in the United States and Canada. The company maintains and operates over 200 fueling stations, providing compressed natural gas (CNG), liquid natural gas (LNG), and bio‐methane fuel. The company has around 400 fleet customers, ranging from airport, public transit, refuse, and government vehicles. The company first issued public stock in May 2007, and its largest shareholder at 30% is T. Boone Pickens, the company’s co‐founder and board member.
Fundamental Analysis
Clean Energy Fuels has increased the number of fueling stations it serves from 147 in 2004, to 224 in 2011. Although the network of stations has improved, the growth rate of this expansion is relatively slow, most likely because the recession created a slow expansionary environment. The
company had a solid rebound this past fiscal year, as its revenue grew by over 60% to $211 million. The company increased the amount of fuel delivered from 101.0 Million gasoline gallon equivalents in 2009 to 122.7 in 2010. Finally, the company’s EPS has improved to (.04) in 2010, from (.60) in 2009. As of September 30, 2010, the company had over $48 million in debt due within one year and short‐term borrowings. Comparatively, the company only had $2.4 million in similar debt the previous year. Unless the company somehow modifies these debt payments, or offsets these figures with increased revenue, the company’s financials should be impacted negatively this next fiscal year. Clean Energy Fuels’ business model is heavily dependent on government subsidies for success. The company’s revenues are supported by a tax credit of $.50 for every gasoline gallon equivalent of CNG or LNG. Although this credit had expired in December 2009, it recently reappeared and passed in H.R. 4853 on December 17, 2011. Even more so, the bill retroactively reimbursed the company back to January 1, 2010. This bill provides a significant percentage of revenue, approximately 13.7%, 11.8%, and 7.6% in years 2008‐2010. Two bills still in Congress would provide further governmental support. The Clean Energy Jobs and Oil Company Accountability Act would provide 50% ‐ 80% of the cost of purchasing new or converting to natural gas vehicles. If passed, it would be easier to convince customers to invest large amounts of capital to convert a fleet of vehicles to run on natural gas. In addition, the bill would provide rebates between $10,000 and $64,000 for purchasing alternative fuel vehicles, subsidies up to
Recommendation Sell
Last Price $21.38
Intrinsic Value $14.53
As of 3/30/12
Style Sub‐sector Small Growth Oil & Gas Refining & Marketing

49
Crummer Investment Management
$50,000 to install a natural gas station, and loans to convert buildings to produce alternative fuel vehicles. The bill has been read twice and is placed on the Senate Legislative Calendar. It is unclear whether it will pass. The second bill, dubbed the NAT GAS Act, was referred to recently in a speech by President Obama. The bill would provide subsidies in the purchase of natural gas trucks instead of diesel vehicles, and provides tax credits for natural gas refueling stations. The bill appears to be gaining bipartisan support, and the company’s stock price has recently jumped in optimism of its passing. The West Texas Intermediate spot price of crude oil has risen dramatically since 2009. This rise benefits the company, as gasoline that is more expensive will push companies to search for cheaper ways to fuel their vehicles. Even more so, natural gas is at a depressed price of $4.25/MMBtu, has such a disparity to oil easily shows the benefits of switching to natural gas. This should help the company secure new accounts this year, which should lead to higher revenue. The impact of new accounts was apparent on February 22, as the stock price jumped around 10% upon news that the company secured contracts to provide natural gas to 48 UPS trucks. However, if the spot price of natural gas falls too low, the company will suffer financially. The company sources much of its natural gas through futures and long‐term fixed contracts. The company needs natural gas to stay at a reasonable level to benefit from the contracts, as the cost of natural gas represented around 50% of its total cost of sales. Clearly, the company is bound by the prices of not only natural gas, but also its relationship to crude oil. In October 2009, Clean Energy Fuels completed the acquisition of BAF Technologies, a company specializing in converting vehicles to natural gas
operation and other alternative fuels. The company now can offer customers a means to convert their fleets to running on natural gas, as well as supporting warranties and repairs. This is a proper move for the company and makes its proposition more convincing to customers. The company also purchased IMW Industries in September of 2010, a company that manufactures and services natural gas fueling compressors. This acquisition should provide cost benefits as an international presence, as over 32% of IMW’s revenues came from outside North America.
Conclusion & Recommendation
Clean energy has become overvalued now due to the low price of natural gas along with the large spread between Oil and gas prices. The company has had three straight years of negative net income with this past year being the worst performing year of them all. Cash flow from operations is at its lowest in the past three years and free cash flow has been trending downward. With no dividend or extended growth in income foreseen in the near future, the current oil/gas spread provides an ideal selling opportunity for this stock.

50
Crummer Investment Management
ExxonMobilCorp.XOM
Technical Analysis
Bollinger Bands Neutral
Money Flow Negative
Relative Strength Neutral
Introduction
Exxon mobile has become the largest public “super major” energy company in the world. The integrated company controls all aspects of the supply chain, from exploration and drilling, to extracting and shipping, to refining and marketing. The company deals primarily in crude oil, natural gas, petroleum products and petrochemicals.
Fundamental Analysis
The uprisings in the Middle East have shot the spot price of the WTI up to around $105 per barrel. This is still far off the peak of $145 per barrel the commodity hit during the the summer of 2008, yet far above the low of $30 per barrel seen in the winter of 2008. The increasing prices in Oil should drive higher revenues over the following year, leading to larger free cash flow and a greater ability to finance long‐term m capital expenditure projects to increase the company’s reserves.
In an operating environment where so many countries are nationalizing resources, plenty of countries are looking for expertise in extracting and refining those resources. Exxon has been able to capitalize on this through partnerships, which has increased revenues and reserves. Exxon has also managed to increase revenues through projects of their own such as exploration projects taking place in the Russian artic along with 21 other project start‐ups expected to take place by 2014. Exxon has managed to replace reserves by 116% of 2011 production. Exxon is heavily influenced by the price of oil, but is equally exposed to the price of gas as well. Half of the company’s production mix is dedicated to natural gas and is expected to become the number one produced product by 2015. With the stock still performing well despite natural gas struggling as a commodity, the company is well positioned to take advantage of the growth to come from natural gas price increases as indicated by natural gas futures contracts, which indicate natural gas prices to increase by 45% by April 2013. Exxon has significant holdings of natural gas plays through its acquisition of XTO Energy. Any increase in the price of natural gas will benefit the company financially. Over the past 5 years, Exxon has had an average distribution yield of 7.3 percent. With over $40 billion dollars paid out in dividends and an annual growth rate of 5.7% since 1983 dividends have provided good value and steady cash with an unpredictable commodity. Exxon also uses their excess cash to buy back stocks and repurchased $30 billion dollars’ worth of shares in 2011, and expect to continue buying back in the future. Even despite the continuation of distribution growth Exxon has still grown free cash flow over 13% in 2011.
Recommendation BUY
Last Price $86.07
Valuation $120.59
As of 3/30/12
Style Sub‐sector Large Value Energy

51
Crummer Investment Management
The need to have a growing presence in the emerging markets of Asia has led to the largest refining chemical complex being built in Singapore. It is near completion and is well needed since two‐thirds of the company’s chemical growth comes from Asian markets. Exxon is not without risk. Exposures to regions with instability leave it exposed to geo‐political risk. Some capital‐intensive projects in these regions have yet to develop and can lose the substantial investment that have been put into them. Exxon also risk relying on partnerships with NOC’s since much of the benefit for Exxon relies upon the favorability of the contracts. With the increasing competition for these contracts becoming fierce, Exxon may not see the same results going into the future.
Financial Statement Analysis
Exxon improved earnings nearly 35% this past fiscal year. The increase in free cash flow from increased efficiencies has allowed the company to increase
its dividend yield along with repurchasing stocks. The company continues to put forth increasing investments in PP&E while still maintaining a solid distribution yield. Return on capital employed increased 24% in 2011, which is high above the competitor average. Exxon is one of the few companies still given an AAA debt rating due to their strong balance sheet and a debt to equity ratio of .1, which allows it access to cheap debt giving it the option to follow through on attractive projects or acquisitions going forward.
Conclusion & Recommendation
Exxon’s very diverse operations spread out its risk to many different factors and make its growth slightly more predictable than that of other energy companies. Exxon’s industry expertise along with its good positioning in relation to natural gas and the strong demand of Asian markets give it solid growth prospects moving forward. With the addition of managements, strong dedication to buying back stocks and increasing dividends Exxon is an attractive and stable play, which is why we recommend it as a buy for the Crummer portfolio.
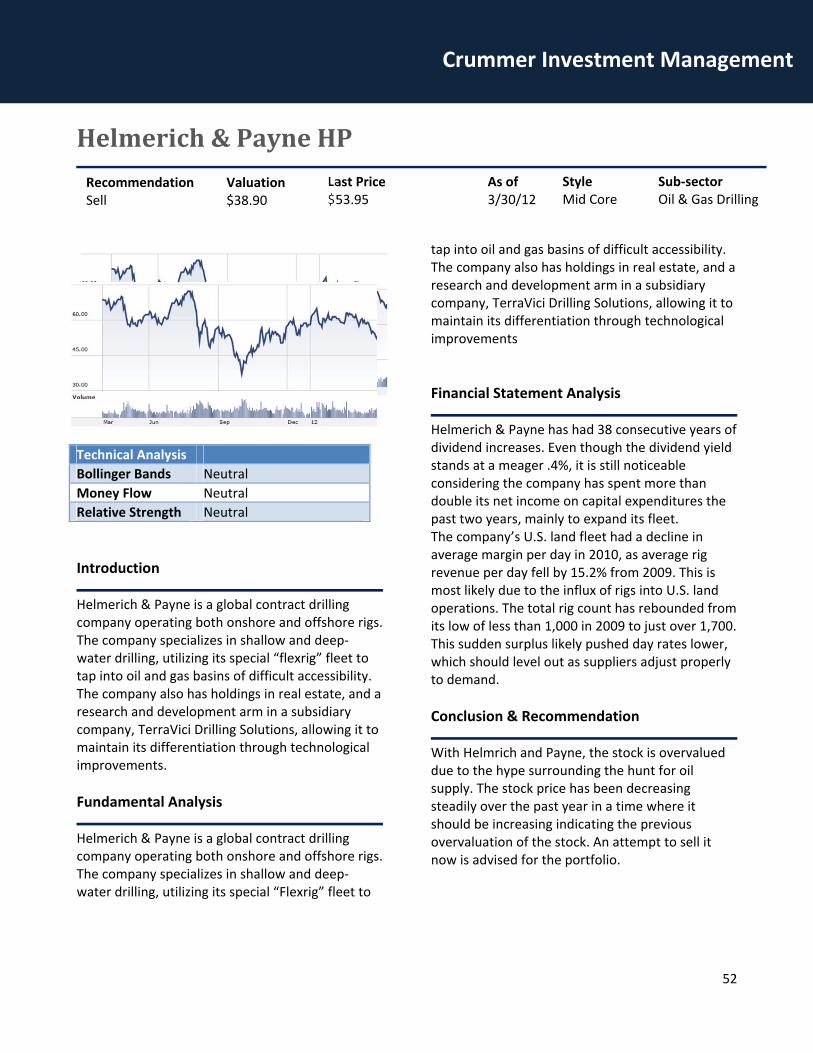
52
Crummer Investment Management
Helmerich&PayneHP
Technical Analysis
Bollinger Bands Neutral
Money Flow Neutral
Relative Strength Neutral
Introduction
Helmerich & Payne is a global contract drilling company operating both onshore and offshore rigs. The company specializes in shallow and deep‐water drilling, utilizing its special “flexrig” fleet to tap into oil and gas basins of difficult accessibility. The company also has holdings in real estate, and a research and development arm in a subsidiary company, TerraVici Drilling Solutions, allowing it to maintain its differentiation through technological improvements.
Fundamental Analysis
Helmerich & Payne is a global contract drilling company operating both onshore and offshore rigs. The company specializes in shallow and deep‐water drilling, utilizing its special “Flexrig” fleet to
tap into oil and gas basins of difficult accessibility. The company also has holdings in real estate, and a research and development arm in a subsidiary company, TerraVici Drilling Solutions, allowing it to maintain its differentiation through technological improvements
Financial Statement Analysis
Helmerich & Payne has had 38 consecutive years of dividend increases. Even though the dividend yield stands at a meager .4%, it is still noticeable considering the company has spent more than double its net income on capital expenditures the past two years, mainly to expand its fleet. The company’s U.S. land fleet had a decline in average margin per day in 2010, as average rig revenue per day fell by 15.2% from 2009. This is most likely due to the influx of rigs into U.S. land operations. The total rig count has rebounded from its low of less than 1,000 in 2009 to just over 1,700. This sudden surplus likely pushed day rates lower, which should level out as suppliers adjust properly to demand.
Conclusion & Recommendation
With Helmrich and Payne, the stock is overvalued due to the hype surrounding the hunt for oil supply. The stock price has been decreasing steadily over the past year in a time where it should be increasing indicating the previous overvaluation of the stock. An attempt to sell it now is advised for the portfolio.
Recommendation Sell
Last Price $53.95
Valuation $38.90
As of 3/30/12
Style Sub‐sector Mid Core Oil & Gas Drilling

53
Crummer Investment Management
OYOGeospaceOYOG
Technical Analysis
Bollinger Bands Neutral
Money Flow Neutral
Relative Strength Positive
Introduction
OYO Geospace manufactures equipment used to capture and analyze seismic data of oil and gas reserves, to determine productivity. The company also produces thermal imaging equipment and film, for use in a variety of markets worldwide. Its seismic business segment operates in both land and marine environments, serving customers who are mainly seismic contractors and large oil companies. The company operates primarily domestically, but has an international presence.
Fundamental Analysis
The steady climb in the price of oil should lead to more sales and rentals of GSR equipment. Oil drilling and extraction companies should have more free cash to spend on capital expenditures, which should flow to seismic contractors hired to search for new producing fields. In turn, contractors will utilize more of OYO’s equipment,
providing the company higher revenues while the price of oil stays high. Although the company’s financials are inherently linked to the price of commodities, the price of oil should stay high in the coming year, while any increase in natural gas would be a boon for the company. Finally, the company has a reputation for manufacturing durable products that perform well in harsh climates. Oil exploration is moving towards areas with extreme environmental conditions, as easily accessible fields be extracted, which should help increase market share in years to come. The company’s stock is relatively illiquid with a relatively small float of 4.2 million shares held by non‐affiliates. This leads to a relatively volatile stock price, as volume only averages 25,000 a day. Interestingly, the company’s top management has been selling off shares in the company. The CEO has sold about 30,000 shares since September of last year, over 10% of his total holdings. Likewise, the CFO and other management figures have been selling stock recently. These sales could simply be moves to provide income or rebalance portfolios, but are troubling nonetheless.
Financial Statement Analysis
The company’s net income jumped from $1.7 million in 2009 to over $14 million in 2010. This figure is still down from the company’s net income in 2007 of $19.5 million, which should be surpassed this year. In addition, the company has no long‐term debt, which will provide a significant amount of free cash in the coming quarters to expand production and diversify the company’s product line. Finally, OYO has had an average earnings growth of over 12% over the last 5 years.
Recommendation Sell
Last Price $105.33
Valuation $78.86
As of 3/30/12
Style Sub‐sector Small Growth Scientific and Technical
Instruments

54
Crummer Investment Management
Conclusion & Recommendation
Before the recent rise in demand for supply of oil, OYOG was priced correctly, but has shot up due to its high correlation to Oil. OYOG acted similarly
during last year’s spike in demand and went down to its valuation after its passing. The recommendation is to sell and take advantage of the stock’s overvaluation.

55
Crummer Investment Management
SuncorEnergySU
Technical Analysis
Bollinger Bands Neutral
Money Flow Negative
Relative Strength Positive
Introduction
Suncor Energy is Canada’s third‐largest oil producer by market value, primarily through its mining and extraction of oil sands deposits in the Athabasca oil region located in northeast Alberta. The company has an integrated structure that provides for the refining and marketing of the extracted materials through its Sunoco brand. The company is also involved in the joint venture of Synrcrude, a consortium of seven companies created to refine specific oil sands deposits into usable products. Suncor energy also has oil holdings in international and offshore locations, as well as natural gas locations primarily in Western Canada.
Fundamental Analysis
Suncor stands to take advantage of the rising price of oil with its integrated structure. Since the company controls all aspects of the supply chain, whatever it extracts from the ground will now sell
for a higher price. As a result, the company will post higher revenues this coming year, as well as earn more cash to spend on capital expenditures, such as ramping up its oil sands production. The company’s oil production jumped at an opportune time last year, rising from 202,300 barrels per day in the first quarter, to 325,900 barrels per day in the fourth fiscal quarter. The upcoming financial statements should reflect this improved economic climate, with higher total revenue and EPS. As mentioned before, the company has a stake in Syncrude, which contributes about 5% of the company’s revenue. Synthetic crude, the product produced in this operation, is trading close to 15$ a barrel premium over the WTI. The premium is not expected to remain at this level, but it should support this year’s financial returns. Suncor’s natural gas operations have not been profitable for the past two years. The depressed price of natural gas, around $3.70 permmBtu, has led to operating losses of $88 and $187, in 2010 and 2009, respectively. In addition to the low price, large royalties to the Canadian government have kept its natural gas earnings in negative territory. The company is in the process of divesting many of its natural gas holdings, and sold around $3.5 billion non‐core assets last fiscal year. These divestitures pare off selected underperforming assets and contribute cash to the company’s oil sands production.
Conclusion & Recommendation
Before the recent rise in demand for supply of oil,
OYOG was priced correctly, but has shot up due to
its high correlation to Oil. OYOG acted similarly
Recommendation Sell
Last Price $33.42
Valuation $20.02
As of 3/30/12
Style Sub‐sector Large Value Oil and Gas Integrated

56
Crummer Investment Management
during last year’s spike in demand and went down
to intrinsic value after its passing. The
recommendation is to sell to capture the current
price.

57
Crummer Investment Management
PetroChinaCoLtdADR(PTR)
Technical Analysis
Bollinger Bands Neutral
Money Flow Neutral
Relative Strength Neutral
Introduction
PetroChina is the largest integrated oil and gas company in China. PetroChina was initiated to reform China’s oil and gas industry and give it the ability to compete internationally. It became an international energy company with strong competitiveness and is one of the major producers and distributors of petroleum and petrochemical products in the world. It engages in a wide range of activities related to oil and natural gas, including: exploration, development, production and marketing of crude oil and natural gas; refining, transportation, storage and marketing of crude oil and oil products; the production and marketing of primary petrochemical products, derivative chemicals and other chemicals; transportation of natural gas, crude oil and refined oil, and marketing of natural gas.
Fundamental Analysis
PetroChina is the only super major oil and gas company in China. Its majority owner is the Chinese government, which uses it to supply a nation, which is in a region that has a higher demand for energy than any other region in the world. Non‐ OECD Asian countries are paced to increase energy demand an annual 2.9% per year all the way till 2035, outpacing all other regions. Although China has attempted to slow down its economic growth to not overextend itself, it still is expected to grow at high levels of 7.5%, down from the 8.9% economic growth seen in the last quarter of 2011. The company is running into troubles finding other sources of oil to meet the rapid year over year demand increases. Recently the company acquired 20% of Shell’s Montney acreage in GroundBirch. This is an example of the acquisitions and joint ventures that PetroChina is going to have to go through with in order to have more upstream exposure. The upstream exposure is needed in order to not have to import oil to meet the demand levels. The company has looked in places like Canada, Europe, Australia, and the Middle East for such exposure and has made sizeable investments to do so. This upstream exposure will alleviate the fact that China’s refined products are set at government decided levels. With the increase in prices for finished petroleum products worldwide, these acquisitions are necessary so that losses are not recorded due to importing the needed oil volumes. Good news was received as of late as the Chinese government raised gas and diesel prices by 6.4% and 7.0% respectively. This lessens the losses that the company was running from importing expensive oil to sell at the legal
Recommendation Buy
Last Price $144.65
Valuation $206.53
As of 3/30/12
Style Sub‐sector International Oil and Gas Integrated

58
Crummer Investment Management
gasoline price. The movement by the government shows dedication to PTR and their willingness to bend for them. PetroChina has recognized their inability to service the oil sections as efficiently and thus has shifted a lot of their focus toward natural gas prospects. Long‐term natural gas demand is expected to grow at faster rates than oil and PetroChina has access to three large deposits in China that have been deemed as having a sufficient level of supply to meet that demand. The company has been hard at work to set up the infrastructure needed to transport and distribute gas throughout China in order to prepare itself for increased production of natural gas. As China’s main producer and distributor of oil and gas, its position is extremely favorable. The lack of supply that China has leaves it exposed to the control that the government has on the price of refined products. Although this may limit margins, the reliance of China upon PetroChina to fuel its economic growth, quite literally, along with the governments shown willingness to raise prices shows the close tie that PetroChina has with the fast growing Chinese economy.
Financial Statement Analysis
PetroChina as expected has a lower operating margin % than the industry average, but has a revenue growth rate of 20.6%, much higher than the industry average of ‐3.6%, which makes up for the lower margins. With increasing levels of incoming cash flows along with a low debt to equity ratio of .2 compared to the industry average of .6, there is a solid chance that PetroChina continues to increase its dividend. The past two years of dividends have shown an increase of 34% in dividend disbursements. The dividend yield currently sits at about 3.16% while still leaving room for the company to be making investments in capital expenditures.
Conclusion & Recommendation
Although the company is being squeezed on their margins through regulated prices and high cost imports, it is more than making up for it through other avenues. The increase in acquisitions for more upstream exposure, the strong ties to fast Chinese economic growth, the movement toward natural gas, the governments close interest in the company’s success, and solid dividend yield all make PetroChina a valuable addition to the Crummer portfolio as an international play.

59
Crummer Investment Management
CalumetSpecialtyProductsPartnersLP(CLMT)
Technical Analysis
Bollinger Bands Neutral
Money Flow Neutral
Relative Strength Positive
Introduction
Calumet Specialty Products is a refiner and processor of hydrocarbon products. The company contains seven plants across the U.S. located in Louisiana, Texas, Pennsylvania, Wisconsin, and Illinois. Calumet’s product lines include a full line of naphthenic and paraffinic oils, aliphatic solvents, white mineral oils, petroleum waxes, petrolatum and hydrocarbon gels, and fuel products. These products are refined from crude oil, which is acquired in order to service industrial, consumer, and automotive goods companies.
Fundamental Analysis
Much of Calumet’s strengths come from its diversification. The company offers over 1,500 specialty products to their clients, which not only spreads their risk, but also makes it easier to mold new products to specifications of their customers, and to serve as a one‐stop shop to the wide base of customers that they do have already.
Calumet has managed to diversify their risk in the refined products market by not only having their large product base, but by having a large customer base. Calumet has over 2,700 active customers and not even one of those customers makes up more than 10% of sales in any of the past three years of operation. In an attempt to expand its operations, even further Calumet has maintained its style of continual acquisitions with three having taken place in the past year. The three acquisitions are of the Superior refinery from Murphy Oil, the synthetic lubricants business from Hercules incorporated, and the specialty petroleum packaging and distribution company of TruSouth Oil. The largest of the three was of the Superior refinery, which gave Calumet not only further product diversification, but also gave the company greater geographic diversification. The Superior refinery is well equipped to service the upper mid‐west region of the U.S. and Canada with gasoline, diesel, asphalt, heavy fuel oils and other specialty petroleum products. The acquisition improves the company’s scale by increasing the total refining throughput capacity by 50%. Despite diversifying product offerings, Calumet still is affected by the volatile movements of the oil and gas commodities. Calumet’s position as a refining business makes it so that it has to acquire raw materials, mainly crude oil, in order to conduct business. Although this raises the cost of goods sold, a decent portion of that cost is passed on to the customer in order to maintain a solid level of operational margins. Although this may hamper returns for when oil prices do rise, it also offers the
Recommendation Buy
Last Price $25.17
Valuation $32.12
As of 3/30/12
Style Sub‐sector Small Value Oil and Gas Midstream
60
Crummer Investment Management
company a certain level of protection for when oil prices fall.
Calumet may not have as much exposure to gains seen throughout the energy sector due to rising oil prices, but it does have the benefit of a healthy distribution yield. Dividend distributions have increased steadily over the past 3 years and are projected to yield 8.55% for the coming year. Financial Statement Analysis
Calumet has had recent equity offerings and has acquired debt in order to follow through with its recent acquisitions. The company’s debt to equity ratio still sits below the industry average, and its EPS have managed to double despite the equity offering. The company maintains healthy cash flows despite the squeeze on margins from rising oil prices, and has grown operating incomes from
$71 million to $125 million. Dividends have increased 7.77% over the past three years providing a steady flow of cash to investors. The dividends along with a lower correlation to unpredictable commodity prices as evident with the low beta of .37 are both positives for Calumet.
Conclusion & Recommendation
Despite the squeeze on margins, rising earnings levels continue to help the company’s bottom line. The higher earnings show Calumet’s ability to capture the upside of the rise in oil prices, while the company’s high dividends, exposure to downstream refining operations, and broad product and customer base serve as a hedge against the possibility of lower commodity prices. The company’s steady financials along with its ability to provide liquidity make it a buy recommendation for the Crummer portfolio.

61
Crummer Investment Management
TransoceanLTD(RIG)
Technical Analysis
Bollinger Bands Neutral
Money Flow Negative
Relative Strength Positive
Introduction
Transocean is an offshore drilling company. It has a fleet of over 132 vessels including drill ships, semisubmersibles, and jack‐ups operating in technically demanding environments such as Brazil, Nigeria, and the North Sea. It is the largest deep‐water exploration company in the world and contracts primarily with some of the largest global exploration and production companies.
Fundamental Analysis
Transocean was and still is the leader in offshore drilling. Despite a slowdown seen due to out of service days for deployed rigs, the company has more than $21.7 billion in backlogged orders to make up for those $1.7 billion dollar in out of service cost. Many point to the problems the company faces due to the legal problems resulting from the
Macondo incident as problematic. The market felt similarly and de‐valued the stock past its true valuation and is now primed to reach its valuation and beyond due to the company’s position to take advantage of the growing need for oil and gas. The macondo case has already seemed to take its effect on the stock price valuation, and has been announced that a $1 billion settlement is estimated, but will not be settled likely for some time. Servicing their equipment has forced slowdowns in service, but is an industry wide issue. The age of Transocean’s rigs has caused for even more down time though than some of the competition’s younger fleets. Transocean has struggled to limit the down time of their rigs, but has used that time to further service and update their rigs to better service their customers going forward. The fact that operationally cash flow is still highly positive in these struggling times shows that once re‐certification and blowout preventions are applied to the inoperable rigs, Transocean’s large fleet will be well positioned to take advantage of the surge in deep‐water drilling. The fact that Transocean has the largest fleet will allow it to have an edge when bidding for service contracts going forward. The company has a strong balance sheet and loss some money this past year due to impairment losses and the Macondo incident. Now that downtime for rigs is expected to decrease due to the extensive maintenance done, Transocean is expected to take advantage. There is still a strong presence of operational cash flow into the company and will only improve with fewer impairment charges and more revenues coming with higher utilization rates expected to come by late 2012 – early 2013. The increase in utilization
Recommendation Buy
Last Price $54.70
Valuation $69.10
As of 3/30/12
Style Sub‐sector Large Growth Oil and Gas Drilling

62
Crummer Investment Management
rates along with the expectation of higher expected day rates place the company in good position cash wise. With the prospects of good cash flows also come the prospects of stock repurchases or higher dividends. Higher dividends are unlikely given the company’s already attractive dividend yield of 5.44%. The cash will more than likely go toward paying down debt that the company has been faced to take on due to the spike in recent expenses and lack of revenues.
Financial Statement Analysis
Transocean’s earnings were negative this past year due to a negative operating income, which resulted from high impairment expenses and higher maintenance cost. Those are expected to decrease as time passes into through 2012. The higher debt to equity ratio in comparison to the industry average means money will flow to paying off debt
in the coming years. This has not stopped investment, as there are sure to be a steady level of capital expenditures in 2012 as set out by their guidance measures, meaning a likely need to take on more debt at some time in the near future.
Conclusion & Recommendation
Transocean’s undervaluation due to negative sentiment from the Macondo incident along with increased skepticism of its fleets capabilities have made it an attractive purchasing opportunity. With much of the company’s current money going toward improving the current fleet, once the fleet is operational and ready to attend to demands for drilling projects the company is poised to improve greatly in operating revenues. The high amount of previously backlogged orders along with a high dividend yield of 5.44% make Transocean a recommended buy position for the Crummer Portfolio

63
Crummer Investment Management
ConsumerStaplesSector
Consumer Staples tend to outperform the rest of the market during recessions but lag during recoveries.
During recessions as people are reducing spending, they spend less on discretionary items; however, staples
sales remain relatively stable. Consequently, during a recovery consumers tend to buy more discretionary
items while staples sales once again, remain quite constant.
This past year, there has been further volatility in food prices, including the impact of a wet planting season,
followed by hot and dry conditions during the summer in parts of the United States. There was particularly an
acceleration of food price inflation for U.S. consumers as higher manufacturing costs were increasingly being
passed on to consumers. Percentage increases at the grocery store, however, are typically far less than
changes in raw material costs. Over the longer term, it is likely that the upward trend in food prices will
continue which will help our new holdings such as Pepsi, Tesco, and Unilever. This upward trend is attributable
to factors such as increasing international demand, rising biofuel production, and the declining value of the
dollar and the euro. Looking outside of the United States, food is likely to represent a larger portion of
available incomes. Moreover, in a rising cost environment, we believe that business will largely depend on
price increases to bolster profit margins. This is why we believe Pepsi is a good add to the portfolio. It
dominates the snack industry and has the pricing power to achieve this end.
Household durable companies experienced declining sales growth in 2011. Any growth in sales was largely
fueled by a rise in prices and favorable foreign currency exchange fluctuations. For this reason, we have
decided to sell of our position in Proctor & Gamble. Food inflation continues to affect food retailers manage
their products based on gross profit margins and therefore, very low inflation or a deflationary product‐pricing
environment can hurt earnings. Likewise, high inflation can negatively affect earnings if consumers are
unwilling to pay higher product prices. Thus, we feel confident with our new holding Tesco and its Clubcard
reviews; consumers have switched from their normal food retailer due to the company’s various incentives.
We also feel our new holding Avon Product is ideal for current market conditions because it targets more
value‐conscious consumers as opposed to the upper echelons of society. Moreover, growth is possible in
emerging markets than in the more mature North American market, and 80% of the company’s sales are
derived internationally.
The for‐profit sector is not without its problems but we believe the current environment presents a buying
opportunity for a quality issue. Schools in the industry are currently adjusting to new federal regulations,
including “gainful employment” rules that have made it harder for its students to qualify for federal aid. The
so‐called “90/10” which limits that amount of Title IV disbursements also makes growth more difficult and can
adversely affect enrollment trends. However, we believe that ITT educational services remains a well‐managed
business and should be muddle through the murky lending waters as it has in the past, and thus, we have
decided to add it to the portfolio..

64
Crummer Investment Management
AvonProductsInc.AVP
Technical Analysis
Bollinger Bands Neutral
Money Flow Neutral
Relative Strength Positive
Introduction
Avon is a global manufacturer and marketer of beauty and related products. The company is undervalued on a risk‐adjusted forward rate of return basis. Given our new fair value estimate and the discrepancy between it and the stock’s selling price, we recommend to buy the stock.
Fundamental Analysis
Unlike most consumer packaged goods companies, which sell their products through third party retail establishments, Avon primarily sells its products to the ultimate consumer through the direct‐selling channel to 6.4 million active independent representatives. We believe that this is an effective niche strategy and gives the company a sustainable competitive advantage in this limited space. This asset light model also offers the company the advantage of having to employ relatively little
capital expenditures in order to maintain its competitive position. While the beauty care business suffers from numerous problems, we believe that the powerful brand and customer satisfaction positions the company in a unique manner. Moreover, this direct‐selling model, with the right management, can be beneficial in order to permeate new untapped markets in order to fuel greater growth similar to growth the company has enjoy in the past. Lastly, we feel that the market has overreacted to the threat of litigation and the company’s near‐term challenges. Financial Statement Analysis
Currently, the company is trading at a lower multiple to earnings than its five‐year historic valuation and the industry average. Return on equity has decreased in recent years but is still an impressive 32 % for the trailing twelve‐month period and is a full 11% greater than the industry average. Revenues has also grown at a faster pace than the industry, and the company is also cheaper on a price to sales, price to book, and price to cash flow basis than the rest of the industry.
Conclusion & Recommendation
Avon’s durable competitive advantage in its niche market and its asset light model will help the company continue growth in spite of current problems. Our DCF valuation of $25.57 suggests the stock is somewhat undervalued and represents an attractive opportunity. As such, we recommend buying the stock
Recommendation Buy
Valuation $25.57
Last Price $19.36
As of 3/30/12
Style Sub‐sector Mid‐Value Personal Products

65
Crummer Investment Management
ChurchandDwightCHD
Technical Analysis
Bollinger Bands Neutral
Money Flow Negative
Relative Strength Neutral
Introduction
Church & Dwight is world’s leading producer of baking soda; its products are sold under the Arm & Hammer brand, along with its Xtra, Trojan, OxiClean, First Response, Spinbrush, Nair, and Orajel brands. Shares of the company are overvalued and thus, we are recommending a sell.
Fundamental Analysis
Although Church & Dwight has been successful in the market as of late, we are remiss to believe this is permanent. There are many challenges that may inhibit the company’s continued growth in the future. First, we are convinced that rising commodity, packaging, and distribution costs could limit Church & Dwight’s margin expansion potential. Second, increased competition has eroded whatever competitive advantage CHD may have. For example, P&G recently has entered into
the laundry additive business and while CHD’s OxiClean remains the market leader, we are concerned P&G may eventually overtake CHD because it lacks an economic moat. This is also the case in several business segments. If larger competitors increase brand investment to gain market share, then CDH would have limited resources that it could employ to defend its space. Lastly, competitors may choose not to pay the higher prices the firm is charging for its products and may favor lower‐price, private‐label substitute goods.
Financial Statement Analysis
Church & Dwight is trading at a much higher multiple to earnings at 23.3 than the industry average of 19.3 and its five‐year historical valuation of 20. Despite the higher multiple, CHD has a much lower return on equity compared to the industry average. Margins have also declined by 50 basis points this past year and 120 basis points this past quarter. We believe top line growth will remain relatively flat due to global macro conditions.
Conclusion & Recommendation
Rising costs, the erosion of barriers to entry by deeply entrenched players, the lack of pricing power, and the threat of substitute goods are all reasons we doubt that Church & Dwight’s recent success is sustainable. Our DCF valuation of $42.40 validates what we have postulated. Because the shares are overvalued, we recommend selling our position.
Recommendation Sell
Valuation $42.40
Last Price $49.19
As of 3/30/12
Style Sub‐sector Mid Core Household Products

66
Crummer Investment Management
UnileverPLCADR(UL)
Technical Analysis
Bollinger Bands Neutral
Money Flow Neutral
Relative Strength Neutral
Introduction
Unilever PLC and Unilever NV are the parent companies of the Unilever Group, which operates as a single unit. We feel that concerns over the European Debt Crisis have made the shares modestly undervalued and because of this, we recommend initiating a position.
Fundamental Analysis
Unilever is a packaged foods business and household and personal products business, each component representing about 50% of the firm’s total sales. Unilever is the third largest packaged foods business in the world, with numerous valuable brands such as Lipton and Ben & Jerry’s. This business generates an enormous 23 billion Euros in sales every year. The firm’s household and personal products are also home to powerful
brands, such as Dove and its 3 billion Euros in sales and Knorr’s jelly, which grew by 60% last year. We are optimistic for further growth due to increasing emerging and developing market exposure that now comprises 50% of the company’s total sales; growth in those markets increased by lower double digits during the past year. We are also confident that management will be able to implement cost savings in every step of the value chain in order to help widen Unilever’s economic moat. We feel the moat exists because margins were able to withstand pressure even in the midst of weak consumer demand in 2011, and should increase during higher demand in future years. We also like that UL generates a heavy cash flow as a percentage of its overall sales.
Financial Statement Analysis
Both Unilever is operating and net margins are wider than the industry average, and were resilient when facing serious headwind. Return on equity is more than twice the industry average and we feel this will continue into the future. UL’s return on invested capital also consistently exceeds what we compute to be the firm’s cost of capital, so any growth the company experiences will likely add shareholder value well into the future.
Conclusion & Recommendation
Unilever’s powerful brand names and a supply chain of global scale and local ability are the sources of UL’s moat. Our DCF valuation of $40.70 suggests the shares of the company are
Recommendation Buy
Valuation $40.70
Last Price $33.05
As of 3/30/12
Style Sub‐sector Large Core Packaged Foods

67
Crummer Investment Management
undervalued, and thus, we recommend buying the stock.

68
Crummer Investment Management
CVSCaremarkCorp.CVS
Technical Analysis
Bollinger Bands Positive
Money Flow Negative
Relative Strength Neutral
Introduction
CVS Caremark combines one of the largest retail pharmacy chains in the United States with one of the largest pharmacy benefit managers (PBMs). Due to the company being overvalued in the marketplace, we recommend to sell the stock.
Fundamental Analysis
While CVS’s acquisition of Caremark RX was a benefit to its retail stores, we believe that this acquisition has destroyed more value in the PBM than it has created on the retail side. The company has struggled to sell its value proposition to PBM customers as evidenced by recent contract reprising. This has resulted in declining operating profit while the firm’s competitors have experienced rapid growth. CVS’s Maintenance Choice Program, which allows its PBM members to
fill 90‐day prescriptions in stores for the same reduced copay as mail order, has been somewhat controversial. Independent PBMs argue that CVS is directing customers away from the most cost‐effective mail order option, and others stating that the program is anticompetitive. Moreover, the firm’s retail pharmacy must compete with diversified retailers like Wal‐Mart who have an incentive to slash pharmaceutical prices in order to increase store traffic. In addition, health reform could represent future reimbursement pressure. Lastly, we are concerned with recently negotiated agreements such as Caterpillar with Wal‐Mart and Walgreens that threaten the PBM’s business model.
Financial Statement Analysis
Return on invested capital has incrementally decreased over the past decade, beginning around 12% and decreasing to approximately 7%. Gross and operating margins have also started to experience a slight squeeze in recent years and we believe this trend will continue. Earnings growth has lagged behind the firm’s competitors. Lastly, the company is trading at a higher multiple to earnings than that of the industry average.
Conclusion & Recommendation
CVS’s erosion of shareholder value on the PBM side, contract repricing the firm has had to endure, declining operating profit, increased litigation, and new competitive threats are all cause for concern. Our DCF valuation of $40.09 suggests that shares of the firm are overvalued.
Recommendation Sell
Valuation $40.09
Last Price $44.80
As of 3/30/12
Style Sub‐sector Large Core Pharmaceutical Retail

69
Crummer Investment Management
TheCoca‐ColaCompanyKO
Technical Analysis
Bollinger Bands Positive
Money Flow Neutral
Relative Strength Positive
Introduction
Coca‐Cola is the largest nonalcoholic beverage company in the world. The company generates 70% of its revenue from overseas and boasts brands such as Coca‐Cola, Sprite, Dasani, Powerade, and Minute Maid. Because the company is fair value by the market, however, we recommend a sell.
Fundamental Analysis
Despite the popularity of Coca‐Cola’s flagship brand, cola consumption has been declining in the United States. Furthermore, Coke’s revenue base is relatively undiversified compared with rival PepsiCo. Coke’s business has not been as resilient as PepsiCo’s snack business during economic downturns. We feel that Coke’s margins will be pressured with Coke’s move to acquire its bottlers, mostly because Coke’s core business is its
concentrate and syrup business. In addition, governments may look to increase taxes on sugary drinks, which would affect Coke far greater than PepsiCo, and could potentially stunt Coke’s volume growth. Moreover, tastes have changed in mature markets as consumers have moved towards other drinks, such as enhanced water, coffee, and teas. The company has one of the widest economic moats of any company in the world, however, we feel that the market has recognized this and it is a disadvantage to us that this is one of the most followed companies on the securities market.
Financial Statement Analysis
Coke’s return on invested capital has suffered recently, and it is currently the lowest is has been in a decade at about 14%. We feel that this indicates that the business is not as strong as it once was. Both gross margins and operating margins have also decreased year after year. The company is trading at a greater multiple to earnings than its historic valuation. Earnings growth has lagged the industry average, as has return on equity.
Conclusion & Recommendation
Given Coke’s relatively undiversified business and PepsiCo’s snack business resilience in downturns, we prefer our new holding PepsiCo. Our DCF valuation of $69 a share suggests that the market has fairly valued the stock and there is little room for capital gain. Based on a risk‐adjusted forward rate of return we feel that there are other more attractive opportunities in the market.
Recommendation Sell
Valuation $69.00
Last Price $74.01
As of 3/30/12
Style Sub‐sector Large Core Beverages‐Soft Drinks
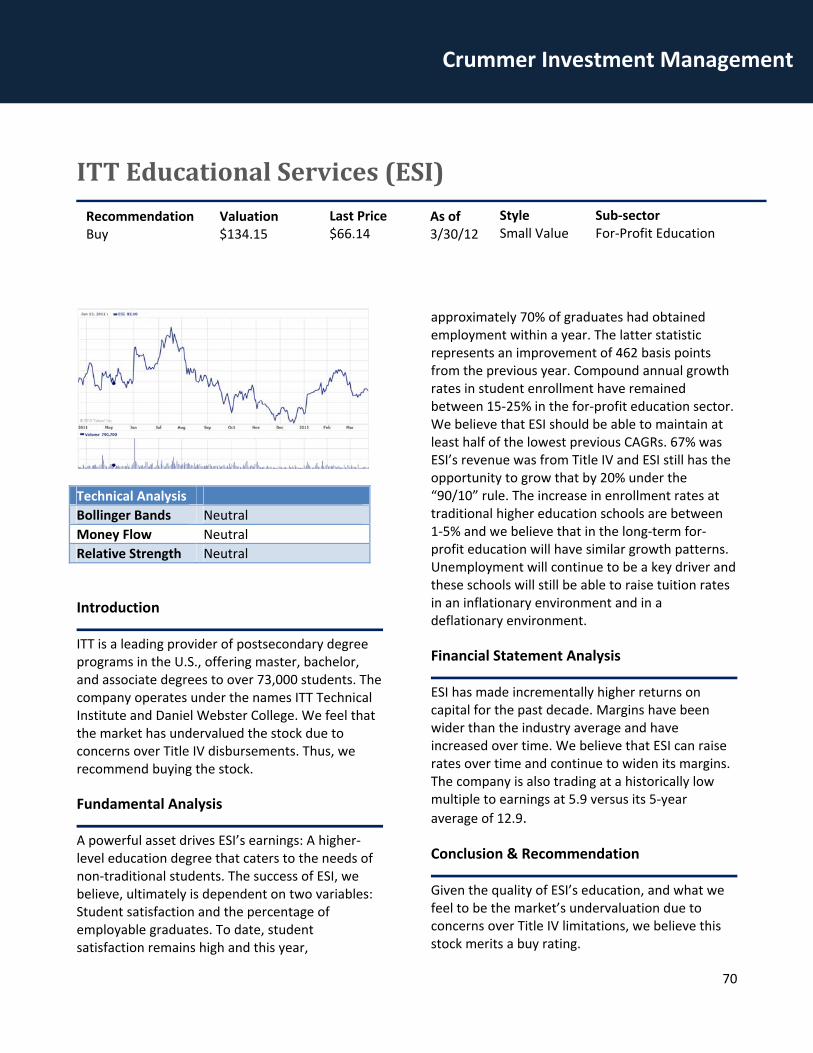
70
Crummer Investment Management
ITTEducationalServices(ESI)
Technical Analysis
Bollinger Bands Neutral
Money Flow Neutral
Relative Strength Neutral
Introduction
ITT is a leading provider of postsecondary degree programs in the U.S., offering master, bachelor, and associate degrees to over 73,000 students. The company operates under the names ITT Technical Institute and Daniel Webster College. We feel that the market has undervalued the stock due to concerns over Title IV disbursements. Thus, we recommend buying the stock.
Fundamental Analysis
A powerful asset drives ESI’s earnings: A higher‐level education degree that caters to the needs of non‐traditional students. The success of ESI, we believe, ultimately is dependent on two variables: Student satisfaction and the percentage of employable graduates. To date, student satisfaction remains high and this year,
approximately 70% of graduates had obtained employment within a year. The latter statistic represents an improvement of 462 basis points from the previous year. Compound annual growth rates in student enrollment have remained between 15‐25% in the for‐profit education sector. We believe that ESI should be able to maintain at least half of the lowest previous CAGRs. 67% was ESI’s revenue was from Title IV and ESI still has the opportunity to grow that by 20% under the “90/10” rule. The increase in enrollment rates at traditional higher education schools are between 1‐5% and we believe that in the long‐term for‐profit education will have similar growth patterns. Unemployment will continue to be a key driver and these schools will still be able to raise tuition rates in an inflationary environment and in a deflationary environment.
Financial Statement Analysis
ESI has made incrementally higher returns on capital for the past decade. Margins have been wider than the industry average and have increased over time. We believe that ESI can raise rates over time and continue to widen its margins. The company is also trading at a historically low multiple to earnings at 5.9 versus its 5‐year
average of 12.9.
Conclusion & Recommendation
Given the quality of ESI’s education, and what we feel to be the market’s undervaluation due to concerns over Title IV limitations, we believe this stock merits a buy rating.
Recommendation Buy
Valuation $134.15
Last Price $66.14
As of 3/30/12
Style Sub‐sector Small Value For‐Profit Education

71
Crummer Investment Management
PepsiCoInc(PEP)
Technical Analysis
Bollinger Bands Neutral
Money Flow Neutral
Relative Strength Positive
Introduction
PepsiCo is a global food, snack and beverage com‐pany. The stock is undervalued on a risk‐adjusted forward rate of return basis.
Fundamental Analysis
Pepsi should really be known as “Frito‐Lay” as it is the most dominant snack business on the planet. We feel that the market has failed to understand the value of the Frito‐Lay brand and see potential for greater growth as the company continues to leverage its products. The company controls 64% of the U.S. salty snack business, 46% of the U.K. market, and 60% of the Brazilian market. The North American snack business with brands such as Lays, Fritos, Cheetos, and Doritos generated 24% of the firm’s total revenues in 2011, and 41% of its operating profits. Management has laid out a
clearly articulated strategy for building and expanding its macro snack portfolio. The company is also likely to continue its past success due to its understanding of consumer tastes trending toward healthier alternatives. Pepsi has worked to push its Good‐for‐You portfolio of products and we applaud the acquisition Wimm‐Bill‐Dann Foods OJSC, expecting nutritional revenues to rise by 30%.
Financial Statement Analysis
PepsiCo’s financial statements provide support of a wide moat. Return on equity has hovered between 30‐40% for the past ten years. Earnings have grown at a steady and predictable rate for the past 10 years and operating margins have remained relatively steady between 14‐18%. Debt to equity has risen sizably in recent years due to Pepsi’s acquisition of its North American bottlers, though we believe the firm is financially healthy. The company is currently trading at a lower multiple of earnings than its historic valuation.
Conclusion & Recommendation
Pepsi’s snack portfolio expansion, the acquisition of its bottlers, its buildup of its healthy food portfo‐lio, and the leadership of Indra Nooyi all position the company for continued success. Our DCF valua‐tion of $79.25 suggests limited downside risk and attractive upside potential. Because this is a busi‐ness with a wide moat and steady, predictable re‐turns selling at a fair price, we recommend buying the stock.
Recommendation Buy
Valuation $79.25
Last Price $66.35
As of 3/30/12
Style Sub‐sector Large Core Food/Beverage

72
Crummer Investment Management
Proctor&GambleCO.(PG)
Technical Analysis
Bollinger Bands Neutral
Money Flow Negative
Relative Strength Neutral
Introduction
Proctor & Gamble is the world’s largest consumer product manufacturer and boasts a lineup of well‐known brands, including Gillette, Crest, Tide, and Pantene Shampoo. Due to the market fairly valuing the stock we recommend a sell.
Fundamental Analysis
As of late, macro factors have contributed to the stock's underperformance. The global market growth for P&G’s categories is roughly 3% on a dollar basis. It is difficult for us to foresee a circumstance where the firm will be able to sustain top line growth greater than 1‐2% of this number. Furthermore, the firm has had recent inventory issues. It recently underestimated the strength of some of its new product launches that resulted in supply constraints and out‐of‐stock situations.
P&G’s barriers to entry have also been eroded somewhat recently with the advent of private label manufacturers, who gained market share during the worst of the downturn when consumers adjusted their spending habits. We are also bearish on the stock because it has hardly budged in recent times, and we see no catalyst in the near future to overturn this scenario. Sluggish top‐line growth seems to be a theme that will continue far into the future. Lastly, promotion spending does not appear to have curtailed. This time of spending has not seemed to add shareholder value and we doubt it will in the near future.
Financial Statement Analysis
P&G’s returns on invested capital have fallen in recent years from the upper teens at the beginning of the decade to about 10 percent in the most recent year. Revenue growth has been sluggish and this is a cause for concern. Return on equity has trailed the industry average. Furthermore, even though profitability ratios have fallen recently, P&G is trading at a higher multiple of earnings than its five‐year historical valuation.
Conclusion & Recommendation
P&G has several macro headwinds, inventory issues, has had its barriers to entry eroded, and lacks a catalyst, and thus, we believe there are other more compelling opportunities. We are also yet uncertain about the effects of P&G’s recent cost cutting efforts and are not willing to speculate. Our DCF valuation of $69.72 implies that the stock is fair value and no longer makes sense to hold in the portfolio. As such, we recommend a sell.
RecommendationSell
Valuation $69.72
Last Price $67.21
As of 3/30/12 Style Sub‐sector
Large Core Household Products
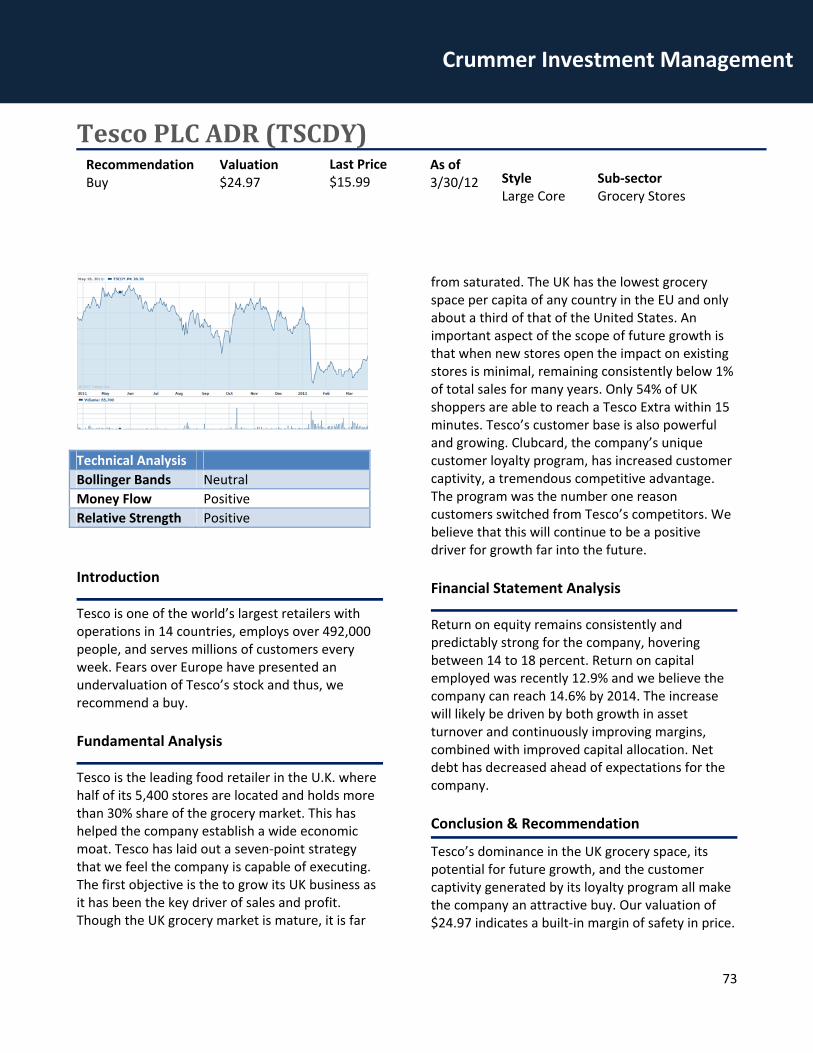
73
Crummer Investment Management
TescoPLCADR(TSCDY)
Technical Analysis
Bollinger Bands Neutral
Money Flow Positive
Relative Strength Positive
Introduction
Tesco is one of the world’s largest retailers with operations in 14 countries, employs over 492,000 people, and serves millions of customers every week. Fears over Europe have presented an undervaluation of Tesco’s stock and thus, we recommend a buy.
Fundamental Analysis
Tesco is the leading food retailer in the U.K. where half of its 5,400 stores are located and holds more than 30% share of the grocery market. This has helped the company establish a wide economic moat. Tesco has laid out a seven‐point strategy that we feel the company is capable of executing. The first objective is the to grow its UK business as it has been the key driver of sales and profit. Though the UK grocery market is mature, it is far
from saturated. The UK has the lowest grocery space per capita of any country in the EU and only about a third of that of the United States. An important aspect of the scope of future growth is that when new stores open the impact on existing stores is minimal, remaining consistently below 1% of total sales for many years. Only 54% of UK shoppers are able to reach a Tesco Extra within 15 minutes. Tesco’s customer base is also powerful and growing. Clubcard, the company’s unique customer loyalty program, has increased customer captivity, a tremendous competitive advantage. The program was the number one reason customers switched from Tesco’s competitors. We believe that this will continue to be a positive driver for growth far into the future.
Financial Statement Analysis
Return on equity remains consistently and predictably strong for the company, hovering between 14 to 18 percent. Return on capital employed was recently 12.9% and we believe the company can reach 14.6% by 2014. The increase will likely be driven by both growth in asset turnover and continuously improving margins, combined with improved capital allocation. Net debt has decreased ahead of expectations for the company.
Conclusion & Recommendation
Tesco’s dominance in the UK grocery space, its potential for future growth, and the customer captivity generated by its loyalty program all make the company an attractive buy. Our valuation of $24.97 indicates a built‐in margin of safety in price.
RecommendationBuy
Valuation $24.97
Last Price $15.99
As of 3/30/12 Style Sub‐sector
Large Core Grocery Stores

74
Crummer Investment Management
Financial Introduction
Financial firms tend to fare well during times of market recovery. Because of our outlook for market growth
over the next twelve months, we are able to identify various financial stocks that will be profitable additions to
our portfolio. The two major financial genres we believe will be profitable are asset managers and investment
banks.
Asset Managers
Asset management firms present attractive buying opportunities during times of market growth because top
line revenues will grow without an increase in overhead costs. In this regard, asset managers are perhaps the
most scalable financial institutions during market growth, because their revenues are derived from
management fees taken off the total value of assets under management. Thus, when the market value of
assets appreciates, management fees increase as well, without any need to grow operating costs. Coupled
with this is an element of consumer confidence, in which investors pour assets into asset managers to
participate in the period of market growth. Because of these reasons, we see asset managers as appealing
investments during the market growth of the next 12 months.
Investment Banks
Although investment banks have suffered as of late due to added regulations and client risk aversion, our
outlook for investment banking activity is positive. It is well known that corporations have masses of cash on
the sidelines. We foresee late 2012 and early 2013 as the time when companies will use up this cash via
mergers, acquisitions, and other activity that requires the consultation of investment banks. We also anticipate
a continuation and increase in the current rate of IPO activity throughout the next year. Finally, we expect
trading volume to rise, which will require the use of larger investment banks’ trading and execution services.
Because of increases in these three forms of investment banking activity, we have sought out well‐rounded
investment banks that are poised to profit during the next year.
Other Factors
Financial institutions come in many different sizes and operate a wide range of business units under one
umbrella. Although this variation introduces an element of complexity in selecting investments, it also allows
us to pinpoint certain firms that may be more prepared than others to profit from different kinds of market
activity. For example, we anticipate an increase in medium‐sized business borrowing activity and private
wealth management. On the contrary, we foresee negative implications for firms heavily reliant on mortgage
growth. Because of the size and diversity of financial institutions, these factors allow us to select firms that are
well suited to grow earnings during the next year.

75
Crummer Investment ManagementEquity Analyst: Nicole Hession
Conclusion
The financial holdings in our portfolio have been adjusted to more adequately reflect our outlook for the
sector. These changes include two sell and two buy decisions; changes which position our holdings to be more
aligned with our anticipation of asset manager and investment banking success. As a hedge, we have included
one commercial bank that has proven its ability to grow lending and deposits during a time when other banks
suffered. We feel that our new portfolio allocation will yield positive returns on our investment into the
financial sector.

76
Crummer Investment ManagementEquity Analyst: Nicole Hession
AnnalyCapitalManagement (NLY)
Introduction
Annaly Capital Management is a Real Estate
Investment Trust (REIT) that invests in high quality,
AAA rated and government guaranteed mortgage‐
backed securities and short‐term investments. As a
REIT, Annaly must pay 95% of its income to its
investors. We recommend selling our position in
NLY because of negative recent performance and a
negative outlook for mortgage‐backed securities.
Fundamental Analysis
NLY is the largest mortgage REIT listed on the
NYSE. The company’s main interest is to generate
income for shareholders by widening the spread in
income generated from mortgages versus cost of
borrowing. Because mortgages are at an all‐time
low, this spread has diminished and NLY’s business
cannot be optimized in these sort of economic
conditions. Although NLY does pay a large
dividend, we feel that the decrease in stock price
value will offset any dividend income gained from
holding the stock. Thus, we recommend selling our
position.
Financial Statement Analysis
NLY lost nearly a billion dollars in FY 2011 and
generated negative ($0.98) earnings per share.
Stock price fell 10% over the past year. Because we
do not anticipate NLY will be able to generate
greater income with mortgage rates at an all‐time
low, we recommend selling our position in NLY.
Conclusion & Recommendation
We recommend selling NLY because low mortgage
rates negatively affect the company’s earnings. The
company has not been performing well for the past
year, and we do not believe that the dividend yield
can justify holding the stock during times of price
decreases.
.
Technical Analysis
Bollinger Bands Negative
Money Flow Negative
Relative Strength Neutral
Recommendation Sell
Valuation $12.08
Last Price $15.82
As of 3/30/12
Style Sub‐sector Large Value Financials

77
Crummer Investment Management
BlackRockInc.(BLK)
Technical Analysis
Bollinger Bands Positive
Money Flow Positive
Relative Strength Neutral
Introduction
BlackRock, Inc. (BLK) is the world’s largest asset manager with $3.5 Trillion AUM. BLK’s clients are “sticky,” meaning BLK has established long‐term relationships with large institutional investors who will not typically stray from using BLK’s services. BLK’s immense level of AUM coupled with its client base presents an opportunistic buying prospect during periods of market growth.
Fundamental Analysis With $3.5 Trillion in AUM, BLK is the world’s largest asset manager. The main reason for buying is the scalability of the BLK business model during market growth. Since BLK generates revenue by charging management fees on client assets, the appreciation of those assets immediately generates more revenue with zero added
overhead. Just as we saw a two‐fold increase in BLK operating margin and net income during the market recovery of 2010, we expect a similar result during the hypothesized strong market of 2012. A significant portion of BLK’s assets under management comes from abroad. Because BLK’s clients are institutional and not individuals, we believe the client makeup reinforces a buying opportunity because BLK’s clients will not pull money from asset managers during times of volatile markets.
Financial Statement Analysis BLK has seen three consecutive years of positive earnings growth as well as a widening operating margin. AUM has also steadily increased since the market crash of 2008, and currently about 43% of AUM is comprised of equities. This means that BLK will see a large increase in management fees when the stock markets rise, which is an appealing factor contributing to our buy recommendation. BLK stock has risen 8.5% over the past year, and our price target is a 21% increase up to $246.
Conclusion & Recommendation BLK is a buy because it will be a valuable addition to the portfolio during the next 12 months in which we anticipate market growth. As BLK’s earnings will increase along with market growth, this is an attractive opportunity and we should buy it before the market grows any higher.
Recommendation Buy
Valuation $245.99
Last Price $203.58
As of 3/30/12
Style Sub‐sector Large Growth Financials

78
Crummer Investment Management
BranchBanking&Trust(BBT)
Introduction BB&T is a regional bank focused in the southeast U.S. Due to the recent initiatives regarding asset write‐downs, we recommend selling our position in BBT.
Fundamental Analysis Although BBT had a strong year in terms of earnings, the company decided in Q4 to begin a process of eliminating foreclosed assets from the balance sheets. This means that BBT must write‐
down the value of these foreclosed assets and earnings will suffer, as they did in the fourth quarter. Because this initiative will last at least a few quarters, we feel that BBT stock price will suffer over the next 12 months and thus we recommend selling our position.
Financial Statement Analysis BBT experienced a positive year in terms of stock price and earnings growth in 2011. The company was able to grow lending activity and increase credit quality. In an effort to make the bank stronger, management believes it is the proper time to begin eliminating non‐performing assets from the balance sheets. Because of this, they will write down the value of their assets and sell them off. This will cause losses for at least a couple of quarters.
Conclusion & Recommendation We recommend selling BBT for the aforemen‐tioned reasons. BBT is undergoing a necessary step to position itself for future prosperity. However, this re‐positioning will come at a price and will be harmful to stock price
Technical Analysis
Bollinger Bands Positive
Money Flow Positive
Relative Strength Neutral
Recommendation Sell
Valuation $27.68
Last Price $31.39
As of 3/30/12
Style Sub‐sector Large Value Financials

79
Crummer Investment Management
EpochInvestmentPartners,Inc.EPHC
Technical Analysis
Bollinger Bands Positive
Money Flow Neutral
Relative Strength Neutral
Introduction
EPHC is a registered investment advisor with $17.9 Billion assets under management (AUM). EPHC saw an earnings increase during the past four quarters, which coupled with our hypothesis of market growth presents an attractive “hold” opportunity.
Fundamental Analysis
EPHC uses separately managed accounts (SMAs) and mutual funds to service their institutional and high‐net‐worth private clients. All of EPHC’s revenue is generated from management fees taken from their assets under management. Because of this revenue model, EPHC can increase earnings without incurring extra overhead when the financial markets appreciate. Similarly, behavioral finance dictates that investors are more likely to allocate their assets to financial advisors during times of market growth. These two factors exhibit
a strong case to hold shares of EPHC, as earnings should easily increase given a market growth period as we are anticipating. EPHC also generates 35% of assets from abroad. Therefore, they are not fully dependent on the United States’ market, which is attractive because we see an element of additional growth potential.
Financial Statement Analysis
EPHC has steadily increased its AUM over the past four quarters. Operating margin has also increased significantly from 37% in Q1 2011 to 46% by the end of Q4 2011. EPHC has shown no signs of increases in operating expenses, so we expect operating margin to increase further during Q1 2012 and throughout fiscal 2012. EPHC also yields a 3.4% dividend payout, which is generous compared to industry standards. Even though the stock has gained 62% in the past year, we remain bullish on this stock and forecast 38% growth over the next year.
Conclusion & Recommendation
EPHC is a strong buy due to a variety of factors. Most notably, EPHC is able to easily grow revenue without incurring added overhead costs when the market gains. EPHC also should be able to add institutional and high‐net‐worth clients when the market appreciates, because of incentives to participate in a bull market. Finally, EPHC has proven it can generate assets abroad while having a limited dependence on European assets. Because the outcome of the European debt crisis remains unclear, EPHC can rely on American and non‐European international asset growth.
Recommendation Hold
Valuation $33.54
Last Price $25.36
As of 3/30/12
Style Sub‐sector Small Growth Financials

80
Crummer Investment Management
GoldmanSachsGS
Introduction Goldman Sachs (GS) is the world’s most prominent investment bank, leading the industry in mergers & acquisitions and underwriting activity, and remains a major force in providing liquidity and market making. Other than investment banking, GS offers investment management and trading & execution services. GS has lately undergone a period of layoffs and cost cutting, and now appears lean and poised to capitalize from a year of forecasted investment banking activity growth.
Fundamental Analysis GS still leads the industry in mergers, acquisitions, and underwritings. These types of deals are what GS has built its reputation on, and we foresee the year ahead as a rebound in this sort of activity. Since GS has been able to cut overhead costs by cutting personnel expenses and remain the
industry leader in investment banking activity, we believe GS will be able to react to the increase in acquisitions positively and grow earnings as a result. Our decision to hold our position in GS represents our outlook for investment banking over the next 12 months, and we believe reputation will be important for success in obtaining contracts for IPOs or M&A deals. GS has the reputation that will enable it to win contracts in 2012‐2013.
Financial Statement Analysis GS experienced a decrease in earnings during both the prior quarter and the prior year. This was a result of client aversion and lack of willingness to transact during a time of such great market volatility, coupled with a weak year for mergers and acquisitions. However, GS still generated $4.51 EPS in FY 2011 and cut staff by 7% and compensation expenses by 21%. GS awaits the uptick in investment banking activity with excitement as management predicts company growth in sync with the economic recovery. GS stock price fell 20% over the past year, but due to our positive outlook, we anticipate a growth of 32% up to $167.09.
Conclusion & Recommendation The last year was a necessary period of rebuilding for GS to adequately position itself for growth in 2012‐2013. Because we do not doubt GS’s ability to lead the industry in investment banking activity, we recommend holding our position in GS and anticipate a solid year of stock and earnings growth.
Technical Analysis
Bollinger Bands Neutral
Money Flow Positive
Relative Strength Neutral
Recommendation Hold
Valuation $167.09
Last Price $124.59
As of 3/30/12
Style Sub‐sector Large Value Financials

81
Crummer Investment Management
JPMorganChaseJPM
Introduction JP Morgan (JPM) is a well‐rounded financial institution that offers investment banking, commercial lending, and private wealth management services. JPM has widely expanded its number of retail location within the last year, and is well positioned to prosper because of the economic recovery. JPM profitability heavily depends on consumer and commercial borrowing activity, investment banking, and the overall health of the financial markets.
Fundamental Analysis In FY 2011, JPM added 260 retail‐banking locations. These additions are allowing JPM to take hold of increases in consumer deposits and lending activity. In 2011 they were able to grow lending activity and deposits when other financial institutions saw a decrease. Recent advertising campaigns highlight JPM’s initiatives to lend and help finance small to medium‐sized business
activity. Thus, JPM is improving its reputation among borrowers and we feel this will be an invaluable asset moving forward into FY 2012. Aside from operations, we have faith in the leader of JPM, Jamie Dimon, and feel that he is a great asset for the company. In the most recent stress test on American banks, JPM proved to be the strongest American financial institution.
Financial Statement Analysis JPM is fresh off a down quarter in Q4 2011, but the company still experienced a record year of net income with $19 billion and $4.48 earnings per share. The record year can be attributed to an increase in credit quality, higher lending and depository activity, and decreased levels of net charge‐offs and non‐performing assets. Although JPM experienced a slow‐down in investment products, credit cards, and investment banking activity, we feel that the company is poised to grow earnings over the next 12 months in accordance with our outlook for the market. JPM looks ready to experience another record year of earnings.
Conclusion & Recommendation The strongest bank in the United States shows a variety of positive factors that will promote growth through FY 2012. JPM’s increase in locations will provide greater income from lending and deposits, while a pickup in investment banking activity will allow for further growth. Because of such factors, we recommend holding JPM.
Technical Analysis
Bollinger Bands Neutral
Money Flow Positive
Relative Strength Positive
Recommendation Hold
Valuation $57.95
Last Price $45.58
As of 3/30/12
Style Sub‐sector Large Value Financials
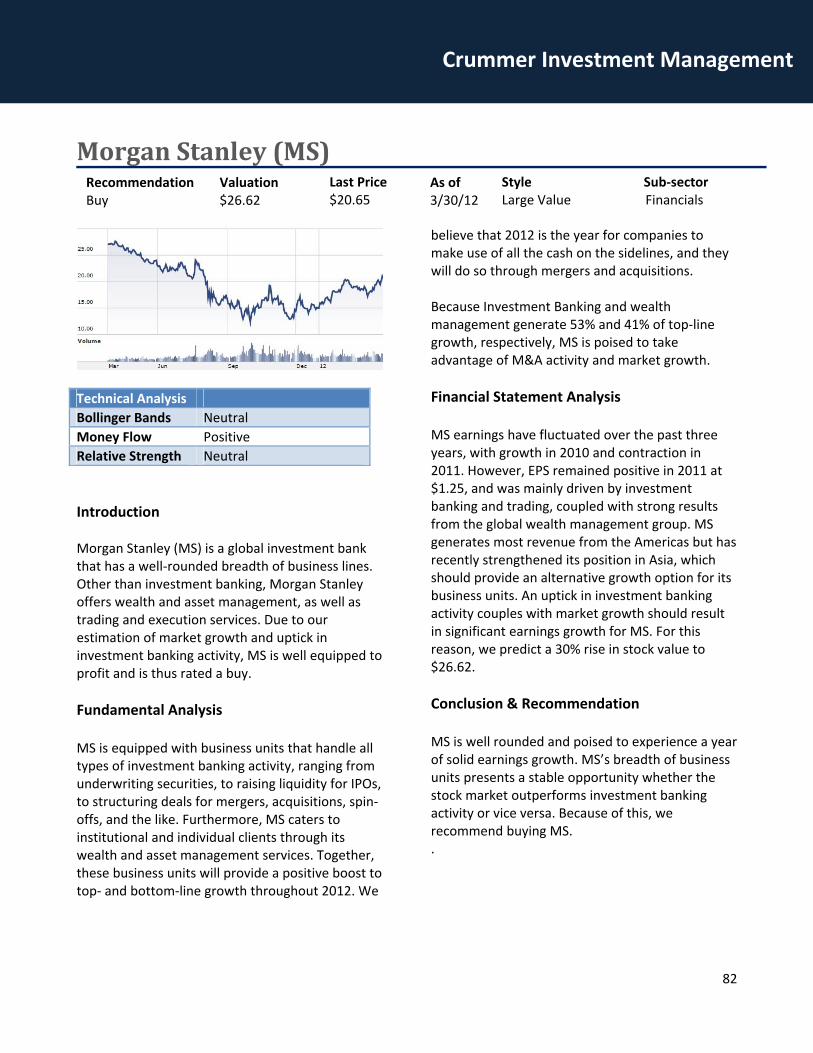
82
Crummer Investment Management
MorganStanley(MS)
Introduction Morgan Stanley (MS) is a global investment bank that has a well‐rounded breadth of business lines. Other than investment banking, Morgan Stanley offers wealth and asset management, as well as trading and execution services. Due to our estimation of market growth and uptick in investment banking activity, MS is well equipped to profit and is thus rated a buy.
Fundamental Analysis MS is equipped with business units that handle all types of investment banking activity, ranging from underwriting securities, to raising liquidity for IPOs, to structuring deals for mergers, acquisitions, spin‐offs, and the like. Furthermore, MS caters to institutional and individual clients through its wealth and asset management services. Together, these business units will provide a positive boost to top‐ and bottom‐line growth throughout 2012. We
believe that 2012 is the year for companies to make use of all the cash on the sidelines, and they will do so through mergers and acquisitions. Because Investment Banking and wealth management generate 53% and 41% of top‐line growth, respectively, MS is poised to take advantage of M&A activity and market growth.
Financial Statement Analysis MS earnings have fluctuated over the past three years, with growth in 2010 and contraction in 2011. However, EPS remained positive in 2011 at $1.25, and was mainly driven by investment banking and trading, coupled with strong results from the global wealth management group. MS generates most revenue from the Americas but has recently strengthened its position in Asia, which should provide an alternative growth option for its business units. An uptick in investment banking activity couples with market growth should result in significant earnings growth for MS. For this reason, we predict a 30% rise in stock value to $26.62.
Conclusion & Recommendation MS is well rounded and poised to experience a year of solid earnings growth. MS’s breadth of business units presents a stable opportunity whether the stock market outperforms investment banking activity or vice versa. Because of this, we recommend buying MS. .
Technical Analysis
Bollinger Bands Neutral
Money Flow Positive
Relative Strength Neutral
Recommendation Buy
Valuation $26.62
Last Price $20.65
As of 3/30/12
Style Sub‐sector Large Value Financials

83
Crummer Investment Management
Seriously Delinquent Mortgage Loans by State

84
Crummer Investment Management
USBancorp(USB)
Introduction US Bancorp (USB) is a commercial bank that offers commercial lending, mortgages, and retail banking services on a consumer and small‐business scale. USB has seen increased credit quality from clients over the recent several quarters, and was able to grow loans, mortgages, and deposits during a time when other banks suffered. Because of this and our outlook for mid‐sized commercial lending, we recommend holding our position in USB.
Fundamental Analysis Our outlook for USB depends heavily on the lending environment of the United States over the next 12 months. Since we predict market growth, we also predict that small‐ and medium‐sized commercial lending will increase as companies seek to re‐position themselves for growth during our economic recovery. USB was able to increase
net interest income over the past year, which was a result of higher credit quality and a lower provision for non‐performing loans and credit losses. Furthermore, USB’s performance also weighs on the level of deposits it can attract to the bank. USB deposits increased in 2011, and we foresee another year of increases due to an increase in the quality of our economy.
Financial Statement Analysis USB is coming into FY 2012 with momentum after a stellar fourth quarter in 2011. During Q4, USB saw net income of $1.35 billion and EPS of $0.69, representing a 38% increase from Q4 2010. This earnings increase is a reflection of USB’s ability to increase lending, deposits, and commercial mortgages through a time where other banks were hesitant to lend. Although USB stock rose 18% over the past year, we predict another year of 28% growth to bring the stock price to $40.62.
Conclusion & Recommendation USB looks ready to grow earnings because of increased lending and deposits. We foresee small‐ to medium‐sized business loans increasing over the next 12 months, and USB should be able to capture a good portion of this lending activity. USB is currently on the right path and we anticipate the company to continue to capitalize during our economic recovery. Therefore, we recommend holding our position in USB.
Technical Analysis
Bollinger Bands Positive
Money Flow Positive
Relative Strength Neutral
Recommendation Hold
Valuation $40.62
Last Price $31.79
As of 3/30/12
Style Sub‐sector Large Core Financials

85
Crummer Investment Management
UtilitiesWe recommend an underweighting of the utilities sector. Utilities are counter‐cyclical and given our outlook
on the U.S. economy, we believe utilities will underperform cyclical stocks. Utilities rose approximately 15% in
2011 as the S&P 500 remained mostly flat. We believe there will be a reversal as the S&P 500 increases due to
better economic conditions.
U.S. Economy: Weak Housing and Power Markets
The overall U.S. economy is expecting to continue to increase for 2012, albeit at a modest rate. Although many
economic indicators have improved, housing is improving at a lethargic rate. Housing starts increased
approximately 6% in 2010 and 3.75% in 2011 but this comes after a roughly 60% decrease from peak to trough.
Housing prices have a similar story. We have seen some recent gains in a few selected areas in the U.S. but
these small gains are frivolous in relation to the decrease in home prices from peak to trough. The graph below
shows the decrease in home prices over the last five years.

86
Crummer Investment Management
Energy Prices
The chart below shows the expected U.S. residential electricity prices. Show is the minimal rise in energy prices
in 2012 followed by a 0.9% decrease in prices in 2013. This is another negative for the industry as lower energy
prices means lower revenues for utilities.
Cost of Capital
The utilities sector tends to carry a heavy debt load and build very capital‐intensive projects, which makes it
sensitive to changes in interest rates and reliant on access to cheap capital for financing. Currently interest
rates are extremely low; however, a rise in interest rates could significantly affect utilities. The fear of high
inflation as a result to the excessive amount of stimulus can cause a hike in interest rates.
Conclusion
We recommend underweighting the utilities because we believe the sector will underperform other S&P 500
sectors in 2012. Contributors to sector headwinds include the possibility of increasing interest rates, poor
sector sentiment due to recent events, and a recovering U.S. economy tilting investor preference to riskier
assets. While we do believe that the utilities sector will underperform, the selected securities are positioned to
best weather the expected pullback in utilities.

87
Crummer Investment Management
VanguardUtilitiesETF(VPU)
Description
The investment seeks to track the performance of a benchmark index that measures the investment return of utilities stocks. The fund employs a “passive management”‐or indexing‐investment approach designed to track the performance of the MSCI US Investable Market Index (IMI)/ Utilities 25/50, an index made up of stocks of large,
medium‐size, and small U.S. companies within the utilities sector, as classified under the Global Industry Classification Standard (GICS).
Fundamental Analysis
We believe that utilities will underperform this year due to the expected economic recovery that is currently taking place. Investors seeking shelter and yield flew into utilities during the most recent economic downtown. As the economic recovery gains more traction, we believe investors will have a risk on appetite.
Conclusion & Recommendation
We believe that the Vanguard Utilities ETF has appreciated in value to be fairly priced in the market. We expect a pullback in utilities and believe that the selected securities will outperform the industry as a whole. For this, we recommend selling this ETF.
.
Technical Analysis
Bollinger Bands Neutral
Money Flow Negative
Relative Strength Positive
Recommendation Sell
Valuation $74.81
Last Price $74.45
As of 3/30/12
Style Sub‐sector ETF
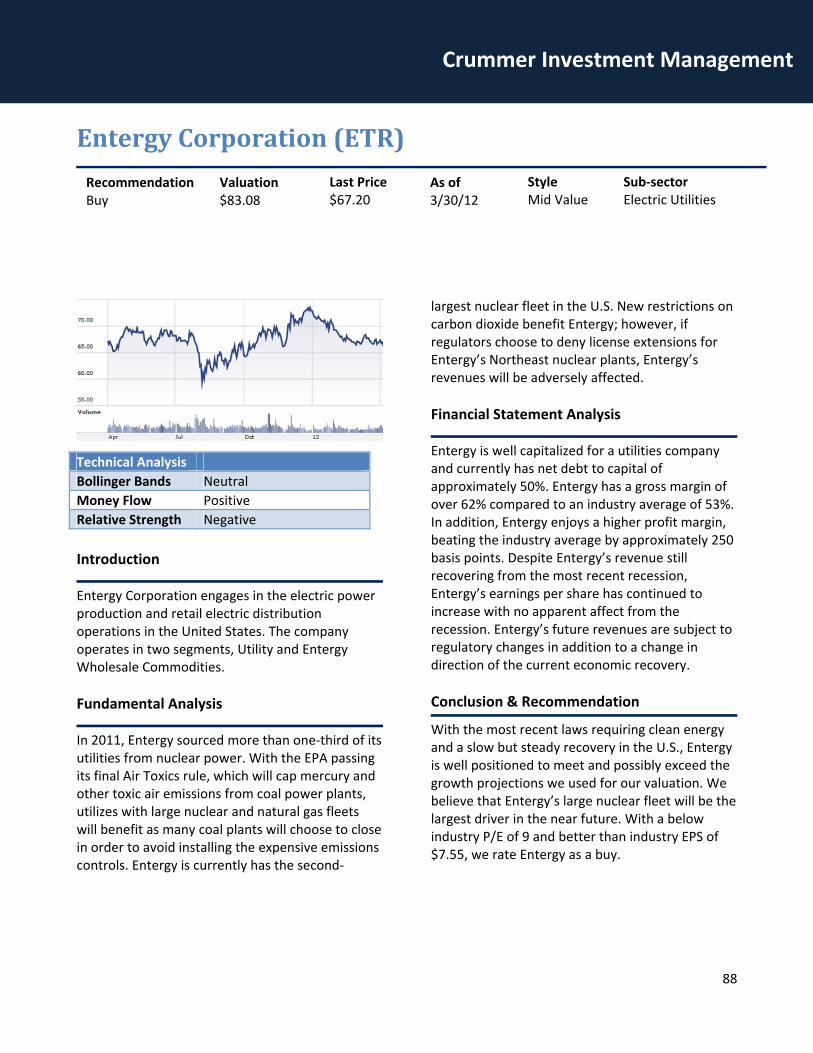
88
Crummer Investment Management
EntergyCorporation(ETR)
Introduction
Entergy Corporation engages in the electric power production and retail electric distribution operations in the United States. The company operates in two segments, Utility and Entergy Wholesale Commodities.
Fundamental Analysis
In 2011, Entergy sourced more than one‐third of its utilities from nuclear power. With the EPA passing its final Air Toxics rule, which will cap mercury and other toxic air emissions from coal power plants, utilizes with large nuclear and natural gas fleets will benefit as many coal plants will choose to close in order to avoid installing the expensive emissions controls. Entergy is currently has the second‐
largest nuclear fleet in the U.S. New restrictions on carbon dioxide benefit Entergy; however, if regulators choose to deny license extensions for Entergy’s Northeast nuclear plants, Entergy’s revenues will be adversely affected.
Financial Statement Analysis
Entergy is well capitalized for a utilities company and currently has net debt to capital of approximately 50%. Entergy has a gross margin of over 62% compared to an industry average of 53%. In addition, Entergy enjoys a higher profit margin, beating the industry average by approximately 250 basis points. Despite Entergy’s revenue still recovering from the most recent recession, Entergy’s earnings per share has continued to increase with no apparent affect from the recession. Entergy’s future revenues are subject to regulatory changes in addition to a change in direction of the current economic recovery.
Conclusion & Recommendation
With the most recent laws requiring clean energy and a slow but steady recovery in the U.S., Entergy is well positioned to meet and possibly exceed the growth projections we used for our valuation. We believe that Entergy’s large nuclear fleet will be the largest driver in the near future. With a below industry P/E of 9 and better than industry EPS of $7.55, we rate Entergy as a buy.
Technical Analysis
Bollinger Bands Neutral
Money Flow Positive
Relative Strength Negative
Recommendation Buy
Valuation $83.08
Last Price $67.20
As of 3/30/12
Style Sub‐sector Mid Value Electric Utilities

89
Crummer Investment Management
ExelonCorporation(EXC)
Introduction
Exelon Corporation engages in the generation of electricity in the United States. It generates electricity from nuclear, fossil, hydro, and renewable energy sources. It currently has the largest nuclear fleet in the United States.
Fundamental Analysis
With the EPA passing its final Air Toxics rule, which will cap mercury and other toxic air emissions from coal power plants, utilizes with large nuclear and natural gas fleets will benefit as many coal plants will choose to close in order to avoid installing the expensive emissions controls. With the largest nuclear fleet in the U.S., Exelon is positioned best to benefit from the government’s desire to increase clean energy.
Exelon is currently in the process of merging with Constellation energy to create the largest competitive energy producer in the U.S. The merger will grant Exelon enhanced scale and financial strength to benefit the most from a recovery in power markets.
Financial Statement Analysis
Being one of the largest energy producers in the U.S., Exelon was significantly affected by the slowdown in the U.S. economy. Its earnings per share have yet to return to pre‐recession levels; however, its revenue for 2011 was close to its revenue peak in 2007. Despite the compression in profit margins since the economic slowdown, Exelon has been able to keep a healthy profit margin that has not fallen below thirteen percent. Its current profit margin of 13.2% is nearly 4% higher than the industry average. It also enjoys a significantly higher return on equity than the industry average.
Conclusion & Recommendation
With the U.S. economy beginning to rebound, Exelon will be able to use the increased financial strength and scale resulting from the merger with Constellation to best benefit from a recovery in the power markets industry. Exelon, the largest nuclear power provider, will also benefit from the increase in regulation requiring clean energy. With a valuation of $46.61, we rate Exelon a buy.
Technical Analysis
Bollinger Bands Neutral
Money Flow Negative
Relative Strength Negative
Recommendation Buy
Valuation $46.61
Last Price $38.83
As of 3/30/12
Style Sub‐sector Large Value Electric Utilities

90
Crummer Investment Management
ClecoCorporation(CNL)
Introduction
Cleco Power is a regulated electric utility that produces and distributes electricity to 276,000 customers in central and southeastern Louisiana. Midstream is an unregulated merchant energy company with operations in Louisiana and Texas. Midstream owns and operates merchant power plants, which produce and sell electricity in the wholesale market. Cleco Power has a generation capacity of 1,318 megawatts.
Fundamental Analysis
Cleco is a low cost energy provider in Louisiana. It has a long‐standing reputation for being a customer centric company for more than 70 years. It has won numerous awards for its actions
following the severe hurricanes that struck Louisiana and caused a great deal of destruction. Along with its subsidiaries, Cleco has a diversified approach to providing electricity. It uses a mixture of western coal, petroleum coal (petcoke), lignite, oil and natural gas to serve its customers. This diversification allows Cleco to protect itself from sudden fluctuations in prices of different energy sources.
Financial Statement Analysis
Cleco Corporation is a strong financial situation has it has many growth factors that separate it from the competition. Cleco has an operating margin that is 8% higher than the industry average. Furthermore, Cleco’s net margin of 17.5% is nearly double the industry average of 9.1%. Cleco currently has a debt to equity ratio that is par with the industry average but has a superior price to earnings and earnings per share growth.
Conclusion & Recommendation
With the diversification and financial strength, Cleco is well positioned to weather the utilities pullback we are expecting this year. Its lean operations lead to higher margins that will remain attractive for investors. We believe Cleco has the ability to continue on its track of offering earnings per share that are superior to the industry, offering a great value to investors. With a valuation of $46.48, we rate Cleco a buy.
Technical Analysis
Bollinger Bands Neutral
Money Flow Negative
Relative Strength Positive
Recommendation Buy
Valuation $46.48
Last Price $39.65
As of 3/30/12 Style Sub‐sector
Small Value Utilities
91
Crummer Investment Management
TelecommunicationServices Overview
A neutral fundamental environment and an unfavorable capital markets position led us to predict that telecommunications will be an underperformer in 2012. The Telecommunications sector is broken down into the wireless and wire line sub sectors. The major names in the industry organize as integrated wireless firms, participating in both sides of the industry. The wireless industry has been expanding but at a declining rate. Contract penetration rates reaching levels over 100% are negatively affecting growth. Large companies have expanded their product offerings and variety by offering bundles, triple or quadruple solutions (internet, landline phone, cell phone and TV solutions). These complete bundles have become more mainstream in the last several years increasing revenues for Telecom companies and offering multiple streams of revenue. The industry is soon likely to see the end of “unlimited” data plans. The rapidly growing demand for data is putting pressure in provider’s infrastructure. Already firms are “throttling” higher using customers, a process by which there is no cap on data but data is delivered at a much slower rate.
Fundamental Outlook
Like many industries, telecommunications is seeing growth opportunities slow in the developed world in favor of developing nations. The demand for wired communication is increasing dramatically. Wireless contracts, the engine of sector growth, are saturated in the developed world. Developing nations have substantially greater demand for additional wireless service. The developed world is seeing rapid growth in the demand for data powered by increasingly ubiquitous smart phones and tablets. Cisco systems predict a 75% compound annual growth rate in data demand for the next five years. Current wireless infrastructures are stretched then, driving up the cost of new data streams. This development benefits tower operating firms but places pressure on provider’s margins. Furthermore, providers are likely to see intense price pressures in the near future. Prepaid wireless plans are becoming increasingly popular. While many of the established carriers are getting involved in the prepaid market, margins are thinner and cash flows less certain without contracts. Furthermore, the coming establishment of new‐tiered data plans will lead to intense price competition.
Market Outlook
Telecommunications is a counter cyclical sector. Therefore, we expect it to underperform in the market during the upcoming recovery. This sentiment has proven correct so far this year, with telecom returning less than a percent in 2012 to the S&P 500’s nearly 12%. Telecom outperformed in 2011, showing modest gains to the S&P’s losses. Furthermore, Telecom is currently trading at 15.8x consensus 2012 earnings projections, while the S&P is trading at 13.7x. The data paints a picture of a market overbought during the recession period and likely to underperform during the recovery.
Conclusion and Recommendation
While the fundamentals for the telecom industry are reasonably positive, the market outlook suggests that they are overpriced. With a recovery in full swing, the portfolio should shift away from high multiple counter cyclical and into undervalued cyclical securities. Therefore, we are recommending an underweight for the telecommunications sector in 2012.

92
Crummer Investment Management
iSharesS&PGlobalTelecom.(iXP)
Technical Analysis
Bollinger Bands Neutral
Money Flow Negative
Relative Strength Negative
Introduction
iXP was selected last year a s means of attaining diversified sector exposure with a minimum of transaction costs. Due to our decreased allocation to the telecom sector, a diversified ETF becomes even more important for providing diversification.
Fund Description
A description of the fund as per iShares Fund Fact Sheet: The iShares S&P Global Telecommunications Sector Index Fund seeks investment results that correspond generally to the price and yield performance, before fees and expenses, of companies that Standard & Poor’s deems part of the telecommunications sector of the economy and important to global markets, as represented by the Standard & Poor’s Global
Telecommunications Sector Index. The index is a subset of the Standard & Poor’s Global 1200 Index.
Fundamentals
The fundamentals of the telecom industry present a mixed picture. While the demand for wireless data is undoubtedly increasing, the demand for wire line services is decreasing in turn. Furthermore, high customer churn rates and intense price competition place a great deal of pressure on margins. Most analysts see the end of “unlimited” data plans in the near future. The pricing shakeup to follow will further weaken customer loyalty and pressure margins. Furthermore, penetration rates are reaching 100% in most of the developed world. The developing world represents the greatest hope for development in the sector. Finally, the industry faces regulatory concerns in both the developed and developing world.
Conclusion & Recommendation
Not only does the industry face a mixed fundamental picture, the trading picture is dim as well. Telecom outperformed the S&P during the volatility of 2011, making it unlikely to do so in the bull market of 2012. Trends through February reinforce this underperformance. In this environment the safest path to diversification in a diversified ETF. iXP’s strong international presence provides exposure to faster growing developing markets while avoiding overinvesting in any particular market.
Recommendation Hold
52‐week range $59.40
Last Price $56.51
As of 3/30/12
Style Sub‐sector LV ETF

93
Crummer Investment Management
AmericanTowerCorporation(AMT)
Technical Analysis
Bollinger Bands Neutral
Money Flow Negative
Relative Strength Neutral
Introduction
American Tower Corporation is the largest publicly traded cell tower operator in the U.S. and a favorite trade for many analysts. It continues to stay in front of its competition because of its superior margins, well‐diversified portfolio, and comparatively low leverage. It recently reorganized as a REIT in order to obtain preferential tax treatment.
Fundamental Analysis
The tower holding industry is well placed to ride the positive trends in the telecom industry while avoiding many of the struggles. By simply owning, the bandwidth tower companies are positioned to see an increase in demand through the adaptation of smart phones and tablets without the struggle of increased price competition. They represent a purer play on the growth of wireless data than integrated telecom firms.
Among Tower Companies AMT boasts an enviable portfolio. With exposure not only to the United States but also to coveted emerging markets such as South America and India, AMT maintains a diversified cash flow. Increased data demand in the US and increased penetration in the developing world should translate to healthy profits for AMT.
Financial Analysis
AMT beat earnings estimates in 2011 by 20% and is expected to grow by 60% in 2012. Rapid expansion and the growth of new tower sites should power earnings growth. Furthermore, they maintain a net debt to EBITDA of 3.7x, far below the industry average. Both margins and growth rates exceed peer averages.
Conclusion & Recommendation
AMT represents a compelling investment story for the Crummer portfolio. AMT has reported accelerating EPS growth rates for the past three years and the trends appears likely to continue. Exposure to both the US and the developing world diversifies the revenue base and enables profiting on all positive telecom trends. Due the the restructuring as a REIT the Crummer Portfolio can guarantee that the growing EPS will translate into dividend income. The relatively low debt load means that AMT has a great deal of flexibility to expand operations without negatively affecting margins. Our models value AMT at $70.04. While this is not dramatically above the current market price, it also represents more than enough upside to justify holding onto the shares.
Recommendation Hold
Last Price $63.17
As of 3/30/12
Valuation $70.04
Style Sub‐sector LG REIT Tower H ldi
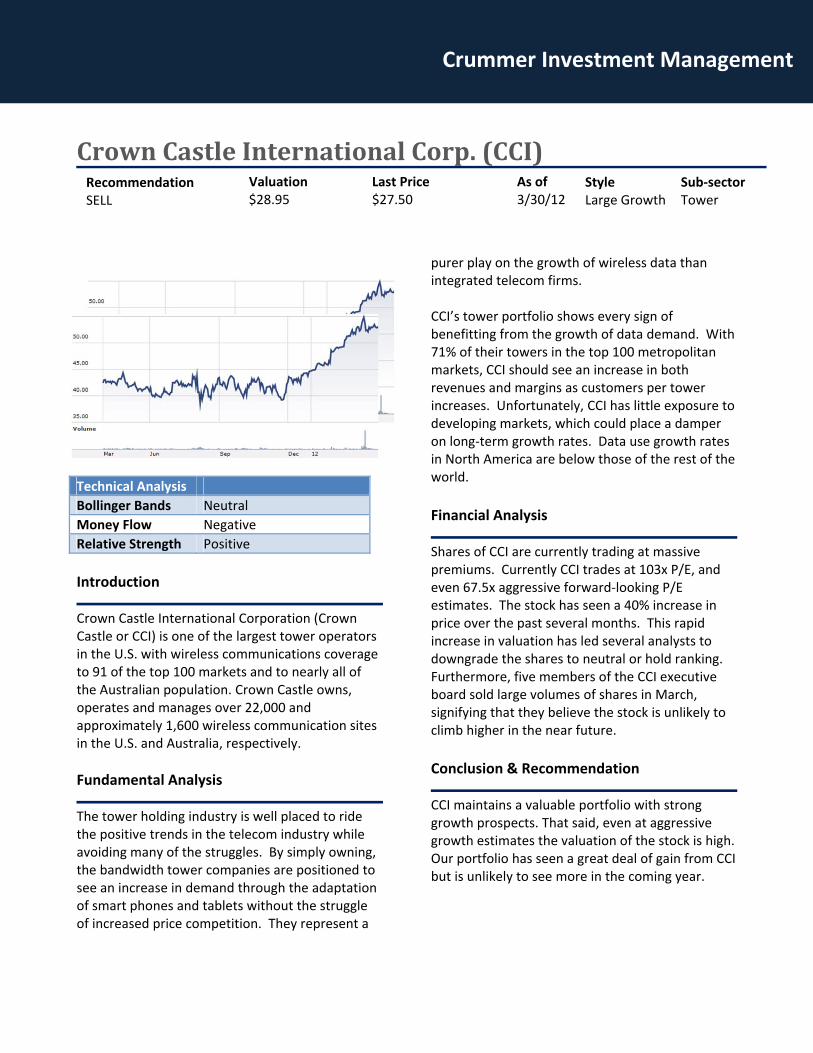
Crummer Investment Management
CrownCastleInternationalCorp.(CCI)
Technical Analysis
Bollinger Bands Neutral
Money Flow Negative
Relative Strength Positive
Introduction
Crown Castle International Corporation (Crown Castle or CCI) is one of the largest tower operators in the U.S. with wireless communications coverage to 91 of the top 100 markets and to nearly all of the Australian population. Crown Castle owns, operates and manages over 22,000 and approximately 1,600 wireless communication sites in the U.S. and Australia, respectively.
Fundamental Analysis
The tower holding industry is well placed to ride the positive trends in the telecom industry while avoiding many of the struggles. By simply owning, the bandwidth tower companies are positioned to see an increase in demand through the adaptation of smart phones and tablets without the struggle of increased price competition. They represent a
purer play on the growth of wireless data than integrated telecom firms. CCI’s tower portfolio shows every sign of benefitting from the growth of data demand. With 71% of their towers in the top 100 metropolitan markets, CCI should see an increase in both revenues and margins as customers per tower increases. Unfortunately, CCI has little exposure to developing markets, which could place a damper on long‐term growth rates. Data use growth rates in North America are below those of the rest of the world.
Financial Analysis
Shares of CCI are currently trading at massive premiums. Currently CCI trades at 103x P/E, and even 67.5x aggressive forward‐looking P/E estimates. The stock has seen a 40% increase in price over the past several months. This rapid increase in valuation has led several analysts to downgrade the shares to neutral or hold ranking. Furthermore, five members of the CCI executive board sold large volumes of shares in March, signifying that they believe the stock is unlikely to climb higher in the near future.
Conclusion & Recommendation
CCI maintains a valuable portfolio with strong growth prospects. That said, even at aggressive growth estimates the valuation of the stock is high. Our portfolio has seen a great deal of gain from CCI but is unlikely to see more in the coming year.
Recommendation SELL
Last Price $27.50
As of 3/30/12
Valuation $28.95
Style Sub‐sector Large Growth Tower

Crummer Investment Management
AboveNetInc.(ABVT)
Technical Analysis
Bollinger Bands Negative
Money Flow Negative
Relative Strength Positive
Introduction
AboveNet provides high‐bandwidth connectivity solutions primarily to large corporate enterprise clients and communication carriers, including Fortune 1000 and FTSE 500 companies. AboveNet’s communications infrastructure and global Internet protocol (“IP”) network are used by a broad range of companies such as commercial banks, brokerage houses, insurance companies, media companies, social networking companies, web‐centric companies, law firms and medical and health care institutions. Their customers rely on AboveNet’s high speed, private optical network for electronic commerce and other mission‐critical services, such as business Internet and cloud applications, regulatory compliance, disaster recovery and business continuity.
Fundamental Analysis
Abovenet’s major strength comes from its portfolio of wireline networks in major US cities. These assets will become increasingly valuable as the demand for data grows. While the demand for traditional wireline is diminishing, the market for b2b high‐speed wireline is strong. A powerful asset portfolio and growing revenues should ensure Abovenet’s prosperity in the future. Furthermore, the growth of the economy thus far has primary been in business rather than consumer spending. Growth among small businesses and large corporations will increase the strain on office complexes and grow Abovenet’s customer base.
Financial Statement Analysis
Abovenet’s most striking financial feature is its low debt ratio. With long‐term debt at approximately 7% of assets, Abovenet is dramatically below industry norms. This puts it in a strong position for future growth. Moreover, it makes Abovenet a prime takeover target for large telecoms looking to grow their bottom lines.
Conclusion & Recommendation
Zayo Group recently expressed its intention to acquire Abovenet at $84 per share. We should take advantage of this opportunity to realize the 13% upside to the market price before the announcement.
Recommendation SELL
Last Price $27.50
As of 3/30/12
Valuation $82.15
Style Sub‐sector Small Growth Wireline
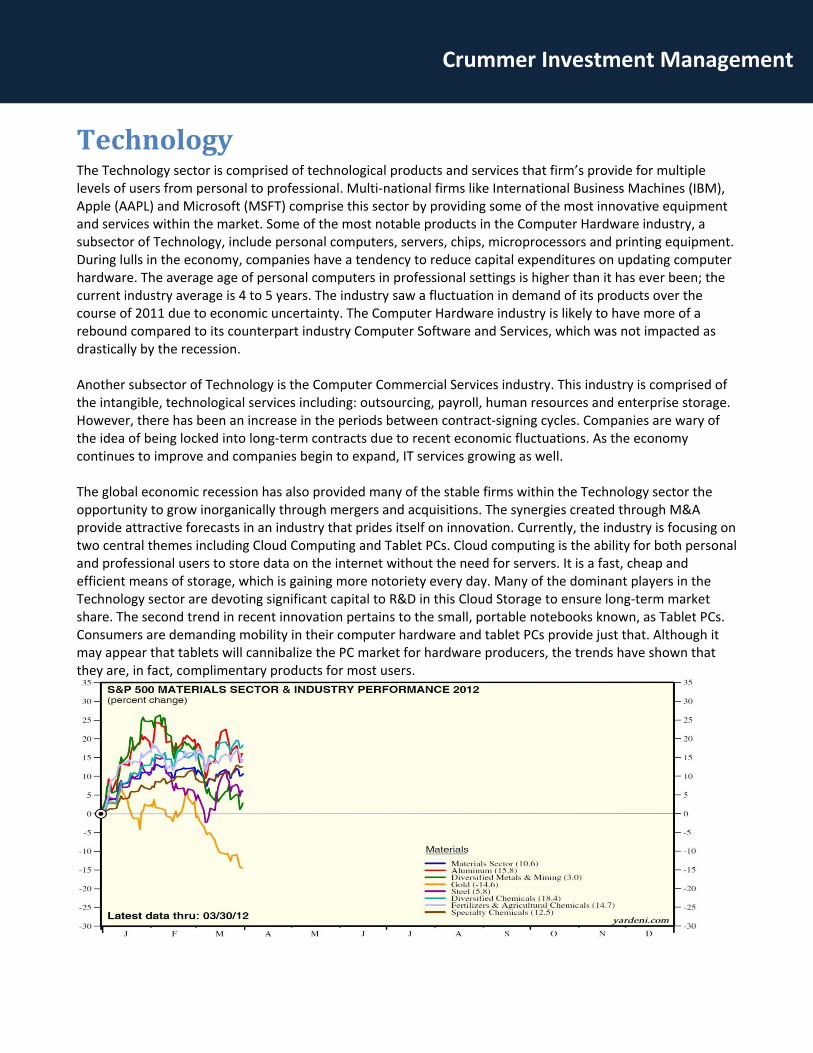
Crummer Investment Management
TechnologyThe Technology sector is comprised of technological products and services that firm’s provide for multiple levels of users from personal to professional. Multi‐national firms like International Business Machines (IBM), Apple (AAPL) and Microsoft (MSFT) comprise this sector by providing some of the most innovative equipment and services within the market. Some of the most notable products in the Computer Hardware industry, a subsector of Technology, include personal computers, servers, chips, microprocessors and printing equipment. During lulls in the economy, companies have a tendency to reduce capital expenditures on updating computer hardware. The average age of personal computers in professional settings is higher than it has ever been; the current industry average is 4 to 5 years. The industry saw a fluctuation in demand of its products over the course of 2011 due to economic uncertainty. The Computer Hardware industry is likely to have more of a rebound compared to its counterpart industry Computer Software and Services, which was not impacted as drastically by the recession. Another subsector of Technology is the Computer Commercial Services industry. This industry is comprised of the intangible, technological services including: outsourcing, payroll, human resources and enterprise storage. However, there has been an increase in the periods between contract‐signing cycles. Companies are wary of the idea of being locked into long‐term contracts due to recent economic fluctuations. As the economy continues to improve and companies begin to expand, IT services growing as well. The global economic recession has also provided many of the stable firms within the Technology sector the opportunity to grow inorganically through mergers and acquisitions. The synergies created through M&A provide attractive forecasts in an industry that prides itself on innovation. Currently, the industry is focusing on two central themes including Cloud Computing and Tablet PCs. Cloud computing is the ability for both personal and professional users to store data on the internet without the need for servers. It is a fast, cheap and efficient means of storage, which is gaining more notoriety every day. Many of the dominant players in the Technology sector are devoting significant capital to R&D in this Cloud Storage to ensure long‐term market share. The second trend in recent innovation pertains to the small, portable notebooks known, as Tablet PCs. Consumers are demanding mobility in their computer hardware and tablet PCs provide just that. Although it may appear that tablets will cannibalize the PC market for hardware producers, the trends have shown that they are, in fact, complimentary products for most users.

Crummer Investment Management
AppleInc.(AAPL)
Technical Analysis
Bollinger Bands Positive
Money Flow Negative
Relative Strength Positive
Introduction
Apple Inc. is a large company that has a very positive outlook both in the near and far future. For this reason, we recommend buying shares of Apple Inc.
Fundamental Analysis
Apple Inc. has been through a troubled past most recently with the passing of CEO Steve Jobs. Despite this fact, the company has been able to strive and become a leader in the industry. It has record significant profits and maintains its competitive edge, all of which has been translated into to the stock price. Over the next year, several
factors will continue to bolster the price of Apple Inc. skyward. The company has announced to use its huge cash holdings to increase dividends in the near future raising the yield of the stock. The release of the new iPhone 5 will is a large driver behind the anticipated positive movement in the stock. The new smart phone will be released in October of 2012. The new universal remote that Apple Inc. is in the process of development will complement all of its products most notably the iTV and iCloud. This remote will allow all apple products to be integrated while all digital information is already in the iCloud and at the user’s fingertips.
Financial Statement Analysis
Apple Inc. growth potential is very attractive. Net income grew by around 84% relative to 2010 and doubled in the last quarter of 2011 as relative to the previous year. Apple Inc. is holding an enormous amount of cash and equivalents reported to be $81,570 million at the end of 2011. As previously mentioned, a portion of the cash will be distributed to investors.
Conclusion & Recommendation
Due to the continued innovation in the products, which produced a cult consumer base we recommend to buy shares in Apple Inc. We anticipate a stock appreciation to $657.01 a share within the next year.
Recommendation
Buy
Valuation $657.01
Last Price $599.55
As of 3/30/12
Style Sub‐sector Large Growth Technology

Crummer Investment Management
AutomaticDataProcessingADP
Technical Analysis
Bollinger Bands Neutral
Money Flow Negative
Relative Strength Neutral
Introduction
ADP is an HR outsourcing company with few prospects that will raise the stock value. For this reason, we recommend divesting of our current holdings in ADP’s stock.
Fundamental Analysis
ADP is a large company within the industry; however, as a technology company it has not been able to maintain its competitive edge. Much smaller companies have been able to imitate the HR outsourcing functions that ADP performs in a much more efficient way. The lack of innovation has hurt the company’s stock devaluating it over the past year that it was held by the portfolio. This issue does not seem to be being addressed by management by coming up with new services to its current customers or to significantly increase its customer base and revenue stream. Furthermore, its large, heavily beauraucratic company is not lean in the face of smaller competition of the imitators in the industry.
Financial Statement Analysis
ADP has only seen a 3.89% increase in net income over the past year. An increase in revenue by 10.1% was attained at the cost of an increase in revenue expenses of 12.4% over the last half of 2011 relative to the previous one.
Conclusion & Recommendation
Because ADP does not have any real abnormal growth potential we feel that it is fairly valued for, the time being and the assets can be placed in investments that are more attractive.
Recommendation
Sell
Valuation $55.53
Market Price $55.19
As of 3/30/12
Style Sub‐sector Large Growth Technology

Crummer Investment Management
PaychexInc.(PAYX)
Technical Analysis
Bollinger Bands Neutral
Money Flow Negative
Relative Strength Positive
Introduction
Paychex is small and growing company that provides new and innovative ways for HR outsourcing. We recommend buying into the company stock due to the upward pressures in price in the coming year.
Fundamental Analysis
Paychex provides easy to use solutions for companies to outsource their human resources departments. They provide three main categories for business, which include Payroll & Taxes, HR and
Employee Benefits. The first category is self‐explanatory; HR includes hiring, compliance and management. The third includes mainly savings plans and insurance plans. As stated Paychex is a small company that focuses on small businesses and is, nibble enough to take on new clients at little cost, stretching their margins. At the same time, it is highly technologically advanced which is what allows additional clients at a minimal cost. With the economy in a recovery stage Paychex is posed to have a much larger client base due to the inexperience of new business owners in HR management and merely offering or creating a new product.
Financial Statement Analysis
With a small force of around 12,000 employees, Paychex has earned a little over $2 billion in revenues. The $2 billion has translated into a net income of $515.3 million. With a rough 25% after tax margin Paychex is going to expand rapidly in the coming future. Although revenue did not reach significant growth from 2010 to 2011, the 4.1% increase only incurred a 1.7% increase in expenses and an 8% increase in net income.
Conclusion & Recommendation
For Paychex’ heavy income growth with low expenses is expected for this small company. We recommend purchasing stock in Paychex to capitalize in the stock appreciation.
Recommendation Buy
Valuation $38.27
Market Price $30.99
As of 3/30/12
Style Sub‐sector Small Core Technology

Crummer Investment Management
Hewlett‐Packard(HPQ)
Technical Analysis
Bollinger Bands Negative
Money Flow Neutral
Relative Strength Negative
Introduction
Hewlett‐Parkard manufactures and sells technology products such as laptops and printers to both business and regular consumers. HPQ has not been able to grow significantly enough to justify a share price increase, therefore we recommend divesting our current holdings for more favorable investment.
Fundamental Analysis
Currently HPQ is consolidating its two main business units of pcs and printers. The
consolidation of their major business units signals a lack of growth and profitability. Although the company hopes to gain efficiency, the increase in earnings would be due to cutbacks rather than real growth potential. The laptop industry is constantly changing and some pc providers have established a niche customer base such as gamers or business professionals on the go; HPQ has attempted to cater to the whole market and is therefore not a primary provider in any class of laptop or pc provider.
Financial Statement Analysis
The company has increased revenue by less than 1% over 2011 at the expense of a 2.6% increase in expenses over the same period. This has also translated towards a roughly 20% loss in net income. Although a large company, HPQ seems to be slowly declining in value due to its financial statement performance.
Conclusion & Recommendation
HPQ will continue to operate but with the decreasing margins, or even steady margins due to consolidation of business lines, the stock price will not appreciate. We recommend selling our current holdings in HPQ because we expect a share price decline over the next year.
Recommendation Sell
Valuation $21.43
Market Price $23.83
As of 3/30/12
Style Sub‐sector Large Value Technology

Crummer Investment Management
InternationalBusinessMachines(IBM)
Technical Analysis
Bollinger Bands Positive
Money Flow Negative
Relative Strength Positive
Introduction
IBM both hard and software for business but still remains present in the personal computer industry. Because of the positive drivers of the company, we recommend holding our current position in the company.
Fundamental Analysis
IBM is a large established company that focuses on business clients large and small. In the current market, many companies are holding their breaths and cash in order to see where the economy goes.
In our opinion, corporations are going to be offloading this cash in mainly dividends and new assets. With the stimulus for businesses, IBM will benefit from this cash offloading due to the increasing focus on technological solutions, which are offered by IBM. IBM is currently in a lawsuit over the loss of a government contract. The state is suing IBM for the $400 million already payed while IBM is suing them back for $100 million that it claims the state already owes them. Despite the outcome IBM will be able be able to sustain it with their close to $12 billion in cash and equivalents.
Financial Statement Analysis
Even during the cash hording period of companies, taking into the huge size, IBM has still been able to grow revenue in 2011 by 7% compared to 2010 while increase expensive by 5.4% during the same period. Furthermore, IBM has reduced its risky short‐term receivable by 14.5% showing the strength of the company and reliability of their revenue stream.
Conclusion & Recommendation
IBM has been through thick and thin and has endured, which is commendable but not enough. The company has been able to maintain its competitive edge even in the dynamic and constantly changing technology industry. Pending the offloading of the cash deposits of most companies, IBM is in a very good position to take advantage of investment over the next year.
Recommendation Hold
Valuation $211.15
Market Price $208.65
As of 3/30/12
Style Sub‐sector Large Core Technology

Crummer Investment Management
IntelCorporationINTC
Technical Analysis
Bollinger Bands Positive
Money Flow Negative
Relative Strength Positive
Introduction
Intel Crop. provides semiconductor chips for clients all of the world and for an enormous variety of products. We recommend holding our position in Intel’s stock because it is poised to see a rise in its stock price.
Fundamental Analysis
Intel is another company that will profit from the cash hording of all companies that are waiting to see how the US and world economy are going to behave. As we become more technologically
centered, the more appliances are used and the “smarter” they are. Each one of these appliances needs a chip, more likely than not the chip is sold by Intel. As companies begin to offload their cash in reinvestments, Intel is in the right place to see a sharp increase in their semiconductor ships. Furthermore, Intel recently announced the production of a “superchip” which is aimed at, naturally, super‐computing. This innovation will further put Intel at the top of the list for mid to large corporations’ computing needs.
Financial Statement Analysis
Over 2011 Intel Corp. has realized a 23.8% increase translating into a 10.82% increase in income. They have a strong balance sheet with a 0.35 debt to asset ratio, allowing it to take on heavy new investments in plants when need be as demand rises sharply. Hence, if their new “superchip” takes off, starting up a new production facility will be relatively easy for the company.
Conclusion & Recommendation
Intel Corp. is a solid company that has retained its proficient semiconductor chips and already has a wide and diverse clientele for an endless list of products. With the coming surge in company’s reinvestment, Intel’s revenues will be able to grow significantly, which will translate to a rise in stock price. Because of these factors, we recommend holding our position in Intel Corp.
Recommendation Hold
Valuation $31.53
Market Price 28.11
As of 3/30/12
Style Sub‐sector Large Core Technology

Crummer Investment Management
MicrosoftCorporation(MSFT)
Technical Analysis
Bollinger Bands Neutral
Money Flow Negative
Relative Strength Positive
Introduction
Microsoft is the largest producer, distributor and licenser of software in the world. Microsoft has a positive outlook in the coming year, which is why we recommend holding our current stake in the company.
Fundamental Analysis
Microsoft has a deep stronghold in the computer software for businesses industry, which is not going to disappear any time soon. Even with Apple’s cult‐like following, Microsoft retains the crown for businesses that need an easy interface for their employees and even customers to use.
With each new addition, Microsoft is releasing better security measures to prevent use without purchase of a license, which is increasing their revenue from developing countries and expanding their direct exposures to the new clientele base. With the current release of Windows 8, Microsoft is raising the bar and taking notes from Apple by allowing users to back up their data online. At least for the private person this will be a secure enough location to utilize and keep their mind at ease in case of computer crashes. Because Microsoft is such a large company and has enjoyed market leadership in the late 90s and 2000s, Apple is providing a fire under Microsoft who has risen up to the challenge and till date has been to take this competition in a healthy way to become more innovative and strive in the industry.
Financial Statement Analysis
Microsoft has been operations has increased expenses and revenues by around 12% but has made their operations leaner making the 12% increase in revenue into a 23% increase in net income.
Conclusion & Recommendation
Due to increased innovation, Microsoft is retaining their customers, utilizing the licenses of their software more efficiently and is posed to see an increase in their stock price. For these reasons, we believe we should hold our current positions in Microsoft Corp.
Recommendation Hold
Valuation $43.02
Market Price $32.26
As of 3/30/12
Style Sub‐sector Large Core Technology

Crummer Investment Management
Industrials
Riding the Economic Upswing
We expect the Industrials sector to be a strong performer in 2012. Historically speaking, the industrials sector
has performed very well in the early and middle stages an economic recovery out‐performing the S&P 500
during these periods. During these healthier financial periods, companies have more cash on hand which they
can use to invest in capital‐intense projects, such as the construction of a new oil refinery. This, in turn, leads
to more projects that are available and more revenues for industrials companies. This also helps some
companies, such as aerospace companies, to develop a strong backlog to benefit them not only this year but in
the years ahead. Another factor is the fact that over the past few, rough years, companies have adapted their
cost structures and improved efficiencies in order to handle the difficult economic times. Now that we are in a
better economic period, those Industrial companies that made difficult decisions a few years ago should see
improvement and better results with their higher levels of efficiency.
Some risks to this sector include a sudden stop to the economic recovery and oil/materials prices. Oil and
material prices directly affect the costs of Industrial goods/services, and a spike in either could strongly affect
their costs and profits. To illustrate, a company such as Boeing uses metals to make airplanes, and if the price
of aluminum goes up, their costs increase. While these are concerns, we expect the economic recovery to
continue and the new cost structures in effect to supersede these risks. We expect the industrials sector to
outperform the S&P 500, and, therefore, we have elected to overweight the Industrials sector for the 2012
portfolio.

Crummer Investment Management
TheBoeingCo BA
Technical Analysis
Bollinger Bands Neutral
Money Flow Negative
Relative Strength Neutral
Introduction
The Boeing Company is based in Chicago, Illinois. It is one of the world’s largest commercial airplane producers and military weapons maker. Boeing is divided into three operating segments: Boeing Commercial Airplanes, Boeing Defense, Space & Security, and Boeing Capital Corp., which is used to finance aircraft for airlines.
Fundamental Analysis
While Boeing is an iconic brand with a reputation for making excellent products, we feel that better opportunities exist for the portfolio.
Again, our outlook for Boeing is generally positive. Following a global economic downturn, improvement in the global economy and growth in commercial air traffic will aid results in commercial aerospace. However, our outlook is less optimistic on the defense industry as the high levels of deficit spending in the U.S. and a trend toward increasing spending on social programs will mean continued pressure on the U.S. defense budget going forward.
Financial Statement Analysis
While Boeing has a strong dividend yield of 2.38%, the company has an expensive price/book ratio and about 50% more inventory compared to last year. Last year, the company poured a lot of capital into R&D, but with lingering questions regarding defense spending in the coming year, we have doubts about whether the company can actually sell its inventory in a timely manner.
Conclusion & Recommendation
In conclusion, we believe we should sell our position in Boeing. The company should realize some growth in 2012, but not enough compared to other options in the sector. The company pays a strong dividend and performs well financially. The risks to keeping Boeing right now stem mostly upon America’s upcoming election and the questions regarding spending in the next twelve months.
Recommendation Sell
Valuation $83.31
Last Price As of $74.37 3/30/12
Style Sub‐sector Large Growth Aerospace and Defense

Crummer Investment Management
ChicagoBridge&IronCompany(CBI)
Technical Analysis
Bollinger Bands Positive
Money Flow Neutral
Relative Strength Neutral
Introduction
Chicago Bridge and Iron Company is based in the Netherlands. Chicago Bridge and Iron Company is a global engineering, procurement and construction (EPC) company specializing in turnkey projects for customers that produce, process, store and distribute the world's natural resources.
Fundamental Analysis
Like Boeing, Chicago Bridge should seem some growth in the coming 12 months. However, other companies in the sector will see more growth. Last year, it was mentioned here that Chicago Bridge and Iron Company’s success is dependent on the number of projects it takes on. As the
economy continues to improve, there would be more projects for CBI. However, as of this writing, CBI has only grown 5.42% since last year, when numerous positive factors should have moved the stock much higher, including the fact that President Obama was not running for reelection yet. We do not believe that construction in itself will play a major role during this election year, as President Obama will focus his attention on reelection, not infrastructure. We believe that the business itself is sound but that the financials of the company are holding it back: it is fairly valued.
Financial Statement Analysis
Chicago Bridge has a quick ration below one and a paltry (compared to other offerings in this portfolio) 0.39% dividend. The company enjoys a relatively high return on equity and a low debt/equity ratio but, again, is fairly valued. The high price/book and price/sales ratios compared to the industry do not help matters either.
Conclusion & Recommendation
Chicago Bridge and Iron Company is a good company that has two main hindrances keeping it from booming this year: the 2012 Presidential Election and our belief that the company is fairly valued. While we project that the share price will climb a bit, we are not as optimistic about the drivers for Chicago this coming year.
Recommendation Sell
Valuation $47.07
Last Price As of $43.19 3/30/12
Style Sub‐sector Mid Growth Engineering and Construction

Crummer Investment Management
Diebhold,Inc.(DBD)
Technical Analysis
Bollinger Bands Positive
Money Flow Negative
Relative Strength Neutral
Danaher Corp. is based in Washington D.C. Danaher Corp. is a leading maker of hand tools and process and environmental controls. The company has four reporting segments: professional instrumentation (39% of 2009 sales), industrial technologies (24%), tools and components (9%), and medical technologies, formerly included in professional instrumentation (28%). The company seeks to expand revenues through a combination of internal growth and acquisitions. The company should continue its tradition of successful acquisition integrations. During 2009, the company bought 15 businesses for an aggregate purchase price of $704 Million, versus 17 businesses for about $423 Million in 2008, and 12 businesses in 2007 for approximately $3.6 Billion.
Introduction
Diebold is an international self‐service and security equipment maker. The company is headquartered
in the U.S. and has been in existence over 150 years. We recommend buying the company’s shares.
Fundamental Analysis
Diebold is a well‐diversified corporation with strong positions in a high‐growth field such as financial security. In a world increasingly dangerous world, Diebold offers products that help alleviate much of that concern. The company is able to mesh a number of services for banks into one system. Diebold has recently announced a number of positive developments including an account with TD and awards at the SDM awards (Central Station of the Year for 2011). The company intends to grow aggressively with a focus on financial companies. We especially like this play if the global economy picks‐up as we expect it to.
Financial Statement Analysis
Diebold enjoys positive financial metrics such as a low debt/equity compared to industry competitors, a quick ration above 2:1, and an earnings per share mark that is vastly improved compared to 2009’s record (0.39 v. 2.25). The company is projected to give a 2.93% yield.
Conclusion & Recommendation
Diebold is a small value company with strong growth potential at it invests more into financial security. The company’s financials are already strong and should only improve as our economy (foreseeably) grows in the next 12 months.
Recommendation Buy
Valuation $47.27
Last Price As of $38.52 3/30/12
Style Sub‐sector Small Value Business Equipment

Crummer Investment Management
HeicoCorpHEI
Technical Analysis
Bollinger Bands Neutral
Money Flow Negative
Relative Strength Neutral
Introduction
Heico Corp. is based in Hollywood, Florida. HEICO Corp. makes jet engine replacement parts and electronic equipment through two segments: The Flight Support Group and the Electronic Technologies Group.
Fundamental Analysis
As mentioned in last year’s report, we see improvement in the global economy and growth in commercial air traffic aiding results in commercial aerospace. However, our outlook is less optimistic on the defense industry as the high levels of deficit spending in the U.S. and a trend toward increasing
spending on social programs, will mean continued pressure on the U.S. defense budget in the future. During this election year, we see even less of a reason why Heico should see increased defense spending. Of course, world events in areas such as Afghanistan or Iran could alter this overnight, but we cannot know that. We do expect air travel to increase in the coming year as the economy is expected to improve. This should offset some of the loss we see in the defense side of business.
Financial Statement Analysis
Heico has a pricey P/E ratio, high price/sales, and low return on equity compared to its industry. Heico has realized an increase in sales, operating income, and net income over the past year, however. Because Heico is so expensive now, it is difficult to justify paying (or overpaying) for the stock when others look just as good if not better in the next year.
Conclusion & Recommendation
Heico Corp. has seen growth in sales and income in the past year, but because of the upcoming election, we do not foresee an increase in defense spending for the coming year. In addition, the stock itself is rather pricey and proves difficult for us to justify keeping it at this time.
Recommendation Sell
Valuation $53.14
Last Price As of $51.59 3/30/12
Style Sub‐sector Small Growth Aerospace and Defense

Crummer Investment Management
JacobsEngineeringGroup JEC
Technical Analysis
Bollinger Bands Neutral
Money Flow Negative
Relative Strength Neutral
Introduction
Jacobs Engineering is based in Pasadena, California. Jacobs Engineering focuses on providing a broad range of technical, professional and construction services to a large number of industrial, commercial and governmental clients worldwide. The company offers project services; consulting services; operations and maintenance services; and construction services, via offices primarily in North America, Europe, Asia and Australia.
Fundamental Analysis
As mentioned before, we believe that construction will not be as big of a focus in the coming year to the Presidential Election. President Obama will likely focus much of his attentions upon getting
reelected and not push for costly initiatives such as engineering and infrastructure. Jacobs itself has a unique business model which we feel positions it to succeed in the future. It puts a strong emphasis on building relationships with clients in hope of gaining repeat business. It also focuses on more small projects, as opposed to fewer large ones, which are less risky, yet contribute strong and steady revenues. Aside from the Amtrak deal the company has signed into (to perform 100% of renovation and repair work), we cannot justify holding the position due to national trends and other opportunities for the portfolio.
Financial Statement Analysis
Jacobs yields no dividend and is going to have a difficult time replicating past earnings given the factors described earlier. We believe the company will continue to grow but not at the clip that other offerings in the sector will provide. The huge jump in net cash for investing activities is a bit concerning in the near term and suggests that the firm might see a boom beyond our 12‐month horizon.
Conclusion & Recommendation
Jacobs is a good company that will grow in the next year but not as much as other offerings. Because of our projected decrease in spending from the Executive Branch and the increase in investment activity, we recommend selling this position.
Recommendation Sell
Valuation $50.58
Last Price As of $44.37 3/30/12
Style Sub‐sector Mid Core Engineering and Construction

Crummer Investment Management
UnitedTechnologiesCorp (UTX)
Technical Analysis
Bollinger Bands Neutral
Money Flow Negative
Relative Strength Neutral
Introduction
United Technologies is a diversified industrial company that does extensive work in the construction and aerospace businesses. Products such as Otis elevators and Carrier air conditioners also make‐up the UTX portfolio of products.
Fundamental Analysis
United Technologies is another industrial firm that
should see growth in the next twelve months due
to our projected increase in the market as a whole.
The firm is making inroads in emerging markets
and with major acquisitions of Goodrich and IAE
International Aero Engines.
These acquisitions should help create synergies
that assist UTX in the fast‐growing aerospace
market in the near future. Goodrich has business in
aircraft landing gear and braking systems, for
example, which UTX did not prior. The IAE
acquisition will assist the Pratt and Whitney
segment for stronger growth as the two segments
mesh well.
The company has had a recent operational focus that has increased margins for products such as Carrier.
Financial Statement Analysis
UTX has enjoyed an improvement in margins thanks to more of an operational focus within the company. United Technologies has a lower debt to equity ratio compared to the industry and a ROE that beats the industry by about 50%. UTX seems to have recovered nicely from the financial crisis as revenue, net income, and EPS have all risen in the last three years.
Conclusion & Recommendation
UTX is poised to grow because of key acquisitions and a growing market. We recommend holding our position in the stock.
Recommendation Hold
Valuation $100.09
Last Price As of $82.94 3/30/12
Style Sub‐sector Large Core Diversified Industrials

Crummer Investment Management
BradyCorporationBRC
Introduction
Brady Corporation is an international manufacturer of business solutions such as security and safety. Because the company has high growth potential and strong leadership, we recommend buying its shares.
Fundamental Analysis
Brady is a small value company that is employing a detailed, common‐sense strategy for growth in the near‐term. By focusing its energies on untapped niche areas such as precision die‐cut products, the company is growing a stronger portfolio of products and differentiating its products from competitors’ brands. The company has a unique culture that values innovation and valuing the individual. Most of
Brady’s top leadership has been with the company for at least ten years. Brady enjoys market leadership in niche areas and has been able to sustain growth in recent years. Well‐managed financials and a solid business model have contributed to this. The company is diversified in a number of growing industries and with products that are in high demand, thus suggesting that the company should see increased revenue in the near term.
Financial Statement Analysis
Brady enjoys low debt compared to its industry, a quick ratio of over 2:1, and over twice as much cash and cash equivalents compared to 2009. The company also offers a 2.24% expected yield. Even though the company experienced a loss recently due to competition in Asia, we still see the company as a strong value. The company is well diversified around the globe and amongst industries.
Conclusion & Recommendation
Brady Corporation is a small value play that enjoys high growth potential and product differentiation. The company’s strong culture and expertise in a number of critical niches will lead it to increased growth in a stronger global economy. We recommend buying these shares
.
Technical Analysis
Bollinger Bands Neutral
Money Flow Neutral
Relative Strength Neutral
Recommendation Buy
Valuation $43.40
Last Price $32.35
As of 3/31/11 Style Sub‐sector
Small Value Business Services
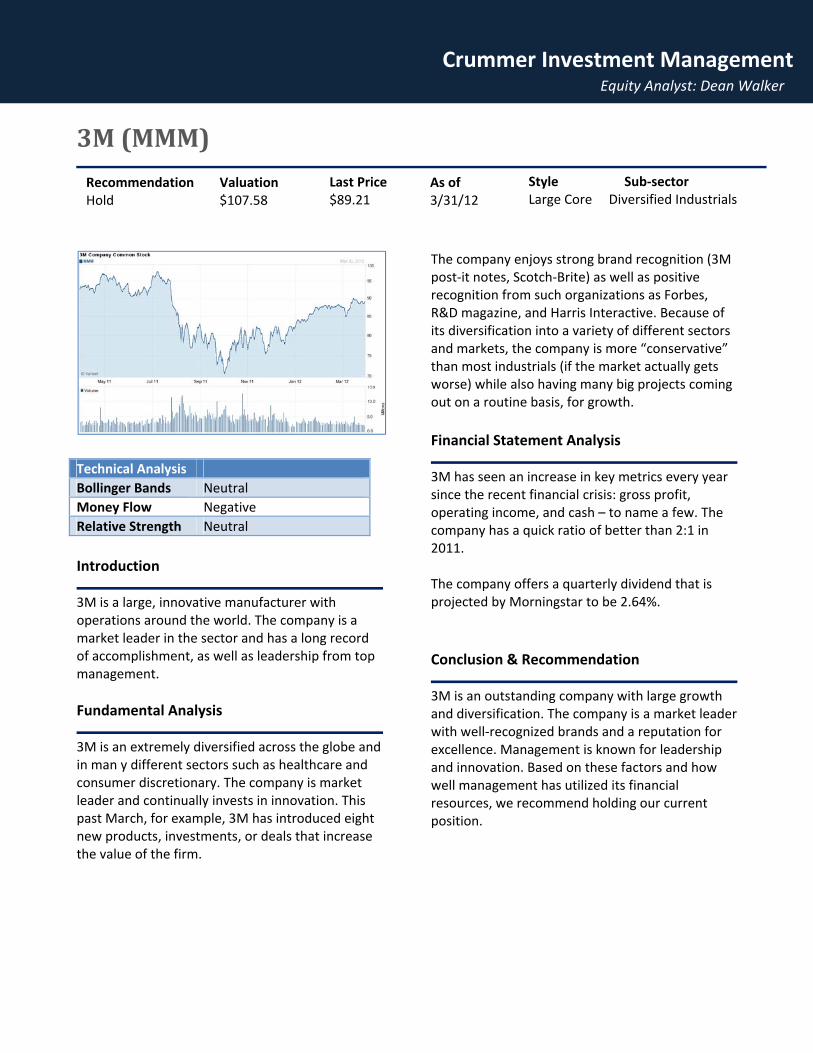
Crummer Investment ManagementEquity Analyst: Dean Walker
3M(MMM)
Introduction
3M is a large, innovative manufacturer with operations around the world. The company is a market leader in the sector and has a long record of accomplishment, as well as leadership from top management.
Fundamental Analysis
3M is an extremely diversified across the globe and in man y different sectors such as healthcare and consumer discretionary. The company is market leader and continually invests in innovation. This past March, for example, 3M has introduced eight new products, investments, or deals that increase the value of the firm.
The company enjoys strong brand recognition (3M post‐it notes, Scotch‐Brite) as well as positive recognition from such organizations as Forbes, R&D magazine, and Harris Interactive. Because of its diversification into a variety of different sectors and markets, the company is more “conservative” than most industrials (if the market actually gets worse) while also having many big projects coming out on a routine basis, for growth.
Financial Statement Analysis
3M has seen an increase in key metrics every year since the recent financial crisis: gross profit, operating income, and cash – to name a few. The company has a quick ratio of better than 2:1 in 2011. The company offers a quarterly dividend that is projected by Morningstar to be 2.64%.
Conclusion & Recommendation
3M is an outstanding company with large growth and diversification. The company is a market leader with well‐recognized brands and a reputation for excellence. Management is known for leadership and innovation. Based on these factors and how well management has utilized its financial resources, we recommend holding our current position.
Technical Analysis
Bollinger Bands Neutral
Money Flow Negative
Relative Strength Neutral
Recommendation Hold
Valuation $107.58
Last Price $89.21
As of 3/31/12
Style Sub‐sector Large Core Diversified Industrials

Crummer Investment ManagementEquity Analyst: Dean Walker
GrupoAeroportuariodelSuresteASR
Introduction
Grupo is a Mexican holder of airports and airport services in southeast Mexico. According to Morningstar, “A geographic monopoly over air travel in tourist‐heavy southeast Mexico has created a wide economic moat that should allow Grupo Aeroportuario del Sureste, or ASUR, to generate robust long‐term economic profits.” We recommend buying these shares.
Fundamental Analysis
Grupo controls airports in some of most travelled to destinations in the world. The company has a dominant stake in this business and earns money in a variety of different ways, including charging for rental services and airport user fees.
According to the CBC, Mexico is trying to lure more Canadians south of the border after record tourism figures. U.S. News and World Report has named Mexico as one of its top retirement destinations outside of the U.S.
Drug lord issues remain a concern, but it does not appear that those groups have overtaken this region.
Financial Statement Analysis
Grupo has no debt, a 44.9% operating margin, net margin percentage of 32.9%, and EPS growth of 34.7%. All of these figures dominant the entire industry and go to prove Morningstar’s quote in the Introduction. The company has a 3.61% projected yield. Grupo has been able to manage its resources due to its fundamentally superior business model.
Conclusion & Recommendation
Grupo is an international play into the tourism industry. We believe that its market position is so strong that it warrants a buy despite the potential risks within Mexico. The company’s financial ratios compared to its industry are stellar, and the push by the Mexican government to increase tourism should offer additional revenue. We recommend buying these shares.
Technical Analysis
Bollinger Bands Positive
Money Flow Neutral
Relative Strength Neutral
Recommendation Buy
Valuation $94.59
Last Price $68.52
As of 3/31/12 Style Sub‐sector
Small Core Airports and Services

Crummer Investment ManagementEquity Analyst: Dean Walker
Snap‐On,Inc.SNA
Introduction
Snap‐On, founded in 1920, is a maker and marketer of professional tools and a variety of other equipment. Due to the company’s positive financials and distinct market advantage, we recommend holding our position.
Fundamental Analysis
The company has a track record of creating high‐quality products for many years. The brand is strong and well recognized amongst professionals in a variety of industries. Snap‐on is innovative and understands the needs of its customers and creating products that solve some of those needs.
With clients around the world, Snap‐on enjoys getting a piece of the growth around the world. With increases in construction and/or development in areas such as Brazil (which is going to host the World Cup and Olympics in the near future), we see great opportunities outside the country.
Financial Statement Analysis
While it has taken three years for Snap‐On to achieve the revenue marks it saw before the financial crisis, we believe that Snap‐On is poised to continue its market dominance and offer solutions for clients around the globe. Some key metrics for Snap‐on include a doubling of its earnings per share in just two years, low debt‐to‐equity compared to the industry average, and an operating margin percentage almost 50% than the industry, to name a few.
Conclusion & Recommendation
Snap‐On has a strong portfolio of products that have been used for nearly 100 years. The company’s financials as well as its product differentiation make it an attractive company to own at this time. We recommend holding our current position.
Technical Analysis
Bollinger Bands Positive
Money Flow Positive
Relative Strength Neutral
Recommendation Hold
Valuation $75.01
Last Price $60.97
As of 3/21/12 Style Sub‐sector
Mid Value Tools and Accessories

Crummer Investment ManagementEquity Analyst: Dean Walker
MaterialsSector
The SunTrust Portfolio overweighed in relation to the S&P weighting of 3.7% by 2.4% at a total of 6.1%.The
Materials Sector encompasses a wide range of commodity‐related manufacturing industries. Included in this
sector are companies that manufacture chemicals, construction materials, glass, paper, forest products and
related packaging products, and metals, minerals and mining companies, including producers of steel. Due to
effective realignment of cost structures and predicted further rises in key commodity prices, we recommend
overweighting the materials sector. In the near future, we expect to see further recovery in both domestic and
overseas‐developed markets, as well as continued growth in emerging markets. Particularly in the BRIC
nations, we expect to see increasing demand for metals and mining products because of additional growth.
The combination of these factors ensures a further rise in world industrial production, whilst continually high
barriers to entry in the mining industry keep supply at similar levels. In spite of these potential factors, the
sector is expected to strengthen over the coming 12 months.

Crummer Investment ManagementEquity Analyst: Dean Walker
ValeS.A.(ADR)VALE
Technical Analysis
Bollinger Bands Negative
Money Flow Negative
Relative Strength Negative
Introduction
Vale is a Brazilian based company that mines for several different ores including but not limited to nickel, copper and iron. Due to promising signs, we recommend holding our position in the company.
Fundamental Analysis
Vale has operations all over the world both in the locations of the mines and its customers. Vale has bought two new huge freighters in 2011 and is planning the purchase of a third. Naturally, this indicated not only an increase of production but also of demand since it would not be mined if it
was not already spoken for. This heavy investment signals growth in the near future for the company and we feel that holding our position will be ensure our capitalization of a price increase. Furthermore, the CEO has plans to become the lead supplier over the current Russian company within the next two years in the production of Nickel. Currently the company is now accountable for a new mining tax in Brazil where a third of its operations are based. Mixed reviews of how much this will affected the company’s bottom line.
Financial Statement Analysis
Over the past year, Vale has increased its revenue by 30.2% while keeping the rise in expenses during the same period to 25.2%. The company translated this to an increase in operating income of 38.7% showing an increasingly efficient operation. During the same period, the company has made a move on the balance sheet towards a much more long‐term approach. Both current assets and liabilities where significantly reduced, while long‐term debt and fixed assets increased.
Conclusion & Recommendation
Due the ambitious plans and hard evidence of an increase in demand and production, we recommend holding our current position in the company.
Recommendation Hold
Valuation 29.85
Last Price $23.33
As of 3/30/12
Style Sub‐sector Large Value INT Materials

Crummer Investment ManagementEquity Analyst: Dean Walker
TheDowChemicalCompany(DOW)
Technical Analysis
Bollinger Bands Neutral
Money Flow Neutral
Relative Strength Neutral
Introduction
Dow provides chemical, plastic and agricultural products. No real growth potential has been observed by the company; consequently, we recommend selling the current holdings in equity.
Fundamental Analysis
Dow has been attempting to normalize their earnings by focusing more on non‐cyclical products but has not meat with much success. The company’s main problem has been to attempt to provide many different products to many different clients. Although a stable company, Dow has not consolidated its client base or grown that base in order for the stock price to appreciate over the past year. Although the company will continue to function, more work in a focused strategy needs to be implemented in order for the stock to appreciate.
Financial Statement Analysis
Dow has only been able to maintain the growth in its costs and revenue at the same pace. Even with its acquisition activities, the company has not been able to maintain an edge in the industry.
Conclusion & Recommendation
Due to the lack of real growth potential and a significant competitive edge, we recommend divesting the company for more favorable assets.
Recommendation Sell
Valuation $32.11
Last Price 34.64
As of 3/30/12
Style Sub‐sector Large Core Materials

Crummer Investment ManagementEquity Analyst: Dean Walker
RioTintoADR (RIO)
Technical Analysis
Bollinger Bands Negative
Money Flow Negative
Relative Strength Negative
Introduction
Rio Tinto is a mining company based out of London and Australia. We believe that Rio Tinto is overpriced and we should divest our holdings in the company.
Fundamental Analysis
Although Rio Tinto is not in danger, there are no real elements that will bolster the stock price. Most of the company’s plans are much more long‐term while this is important, the price will not be affected any time soon. The company should be reviewed a few years from now to see if the plans are having a more direct effect on operations and will translate into the stock price.
Financial Statement Analysis
In 2011, the company had a huge asset write down amounting to $9,174 million. The company is half debt and equity.
Conclusion & Recommendation
We recommend selling our current holdings in the company because its plans, if successful, are more long‐term focused and will not be raising the stock price anytime soon.
Recommendation Sell
Valuation $50.56
52‐Week Range $55.59
As of 3/30/12
Style Sub‐sector Large Core INTL Materials

Crummer Investment ManagementEquity Analyst: Dean Walker
InternationalFlavorsandFragrances (IFF)
Technical Analysis
Bollinger Bands Neutral
Money Flow Neutral
Relative Strength Neutral
Introduction
IFF is manufactures enhancers for aromas and tastes. The company has not been able to perform well and we recommend selling our equity in the company.
Fundamental Analysis
IFF has attempted to expand more in international markets but it has not had enough
market penetration to for this expansion to translate into stock appreciation. From a consumer perspective, the exotic tastes and aromas come from Western Europe and IFF has to deal with consumer perceptions when selling their product, which has not been entirely successful.
Financial Statement Analysis
IFF is not in danger of going bankrupt but it seems to be in late maturity of the company tiptoeing to the decline of the company. It has only increased revenue by 6.29% while incurring an additional 10% in expenses. Net income only rose by 1.26% in 2011 compared to the previous year.
Conclusion & Recommendation
Because there are no observed factors that will bring the company back to significant growth and the lack of financial performance, we recommend selling our current holdings in the company.
Recommendation Sell
Valuation $53.24
Last Price $58.60
As of 3/30/12
Style Sub‐sector Mid Core Materials

TronoxInc.TROX
Technical Analysis
Bollinger Bands Neutral
Money Flow Neutral
Relative Strength Positive
Introduction
Tronox Inc. is one of the top producers of titanium oxide to the world. Titanium oxide is a major component for most paints, coating and paper. A rise in the stock price is anticipated which is why we recommend buying into Tronox Inc.
Fundamental Analysis
Tronox Inc. serves many clients both in the US and internationally. Its product is essential in many products that are used daily by both businesses and individuals. With the anticipated pick up of the economy, we expect Tronox to profit from the increased consumption, which should translate into a rise in stock price. Tronox filed for voluntary bankruptcy in early 2011. Major reorganization took place and the company has not looked back since. The stock price has only claimed since the
reorganization and they are once again experiencing healthy growth.
Financial Statement Analysis
In a little under a year (11 months) the new management has been able to generate $241.5 million in net income. Furthermore, expenses in the same period are a fraction of what the company used to incur to operate the company. Although the company has taken on new current debt of $28.6 million after restructuring, current assets have grown by $33 million. The company is financially stable and able to cover both short‐term and long‐term debt. It has a current ratio of 2.7 and is 37.82% debt financed.
Conclusion & Recommendation
Tronox has an essential product that will be in high demand with the economy upturn and has only been doing well since the restructuring of February of 2010. We recommend buying equity shares in the company to take advantage of the expected stock price appreciation.
Recommendation Buy
Valuation $185.65
Last Price $174.25
As of 3/31/12
Style Sub‐sector Small Growth Materials

Crummer Investment Management
FixedIncomeAssets
Allocation Recommendation
Low short‐term interest rates depressing treasury yields, a steep yield curve increasing risk uncertainty, declining credit spreads and the willingness of investors to move money into riskier assets combine to make fixed income relatively less attractive than equities in 2012. We recommend an allocation at the low end of the portfolio’s range for fixed income assets. Given the current outlook, we recommend holding the Vanguard Total Bond Index Fund (VBMFX) as it falls in line with our fixed income strategy.

Crummer Investment Management
Appendix
Crummer Investment Management
Crummer/SunTrustPortfolioInvestmentPolicyStatement(Revised April 6th 2008)
Crummer/SunTrust Portfolio
1.1 History: The SunTrust Banks of Central Florida Foundation contributed all of the Crummer/SunTrust Portfolio’s (Portfolio) initial assets, totaling $500,000 beginning with $100,000 per year in 1999, and no additional contributions are expected. The Portfolio is part of the Rollins College endowment and is exempt from federal income taxes.
1.2 Purpose: The Portfolio was established to fund periodic scholarships for students at the Crummer Graduate School of Business and to provide Crummer students with practical experience in portfolio management. The Portfolio expects to exist in perpetuity and the only required distribution is the funding of scholarships.
1.3 SunTrust Scholars: SunTrust Scholarships are funded by an annual amount established by the Crummer School that generally follows the endowment distribution policy of Rollins College—4½ percent of the three-year moving average of the Portfolio’s market value at calendar year-end. Governance
2.1 Students: The students in Crummer’s portfolio management class (class) act as security analysts and portfolio managers, making recommendations on portfolio strategy and individual asset selection, subject to the guidelines and limitation set forth in this Investment Policy Statement. This statement assumes the class is only offered in the spring term (January to April).
2.2 Oversight: An Oversight Committee (Committee), consisting of industry practitioners, a member of the Rollins
College Board of Trustees, if the Board so chooses, a member selected by the Vice President of Finance at Rollins College and a Crummer faculty member, provides guidance for the Portfolio. The overall philosophy of the Committee is one of oversight and not direct portfolio management. When the class is not in session, however, changes in the portfolio can be made by the Committee but only in light of events with the potential to significantly affect the portfolio’s value.
2.3 Prohibited Transactions: No transactions for the portfolio can be undertaken that are contrary to the
SunTrust gift agreement, if any, or to applicable Rollins College Trustee policies. Long-term and Short-term Investment Approaches
3.1 Long-term Strategy: The Portfolio operates in both long-term and short-term environments. As a perpetual portfolio, its long-term investment strategy is designed for a conservative investor who seeks a real total rate of return that will maintain the purchasing power of the Portfolio after distributions and net of expenses. A long-term portfolio will inevitably encounter many market cycles so the asset allocation is expected to be relatively constant. Table A contains the current long-term real growth and inflation expectations. These expectations are subject to an annual review by the class.
3.2 Short-term Tactics: On an annual basis, the Portfolio will adopt a tactical (short-term) sector tilt relative to the
sector market weights of the S&P 500 Index. This investment tactic is designed to take advantage of short-term (one year or less) market movements by establishing the managers’ economic outlook and then underweighting sectors that are expected to do poorly and overweighting sectors that are expected to do well. The S&P 500 sectors are shown in Table B. Tactical sector targets may deviate as much as +/- 20% from each sector’s S&P 500 market weight.
3.3 Objective: These short-term and long-term approaches are consistent with the intent to maintain the Portfolio’s value in down market environments and increase its value in up market environments while funding scholarships—all without diminishing principal.

Crummer Investment Management
Long-Term Perspective and Asset Allocation
4.1 Risk in the Portfolio is managed by allocating among asset classes and investment styles within asset classes as a long-term strategic policy. The Portfolio’s asset classes, strategic targets, and designated benchmarks are discussed in Section 10.2 and listed in Table C. Monitoring asset allocation, combined with a sector focus, is designed to keep the Portfolio consistent with both its short and long-term goals.
Rate of Return
5.1 Target: The Portfolio’s target rate of return incorporates the investment goals and spending policy. The target rate of return, investment goals, and expected volatility are interrelated and must be viewed as such. The long-term target rate of return goal that accommodates the Portfolio’s expenses and distributions is attached as Table A.
5.2 Horizon: The investment horizon of the Portfolio is perpetual and preservation of the real value of principal is necessary with such a long-term perspective.
5.3 Investment Decisions: Long-term objectives guide asset allocation decisions. Short-term opportunities guide sector weight decisions.
5.4 Growth: The primary source of Portfolio growth is expected to be judicious and timely security selection.
While the Portfolio might fund additional scholarships with a more aggressive asset allocation (e.g., all equity)—prudence, and the perpetual life of the Portfolio, suggest a less risky approach that will allow the value of the Portfolio to rise with the US economy. This organic economic growth is expected to be in line with historical experience—in the range of 2 to 2½%. Portfolio Transactions
6.1 The class recommends one portfolio composition per year to the Committee. The Committee has the authority to make changes in these recommendations.
6.2 Trades in the Portfolio are made in only one batch each year, typically in mid-April, following the class
presentation to the Committee. See Section 2.2 for exceptions.
Cash Requirements 7.1 Scholarship Funding: Because the date of the scholarship draw varies around the end of the College’s fiscal
year (May 31), as of May 1 the Portfolio will hold a cash reserve large enough to cover the annual scholarship funding rather than requiring security liquidation.
7.2 Transactions Costs and Fees: Trading costs and fees will be funded in cash and incorporated into the annual transactions to avoid forced security liquidation and will usually be covered by normal sell recommendations. Volatility
8.1 The target rate of return will ultimately dictate the level of risk in the Portfolio. If the expected volatility of the Portfolio is deemed inappropriate, the class will recommend a change in the target rate of return to the Committee. Income, Appreciation and Taxes
9.1 The Portfolio pays no taxes on investment income and, therefore, the investments are not tax sensitive. Portfolio distributions are not limited to realize income and, therefore, the Portfolio need not generate income to fund its spending policy. The cash requirements can be met by liquidating securities before May 1 (see Section 7) and will usually be covered by normal sell recommendations.

Crummer Investment Management
Sector & Asset Allocation
10.1 Short-term Sector Allocation: To achieve its short-term tactical investment objective the Crummer/SunTrust Portfolio's assets shall be managed by under- and overweighting S&P’s ten market sectors. These sectors are listed in Table B. The tactical target deviations are +/- 20% of their S&P 500 market weights. Cash is a separate asset class and governed by the asset allocation policy.
10.2 Long-term Asset Allocation: Asset classes are outlined in Table C. Each asset class will have a minimum of
5% of the portfolio value. In the short-term, security selections are driven by sector weights and, although stable asset class allocations are essential for risk control, they are flexible enough to allow tactical sector allocations in the short run.
10.2.1 Equity Styles: Asset allocation recognizes equity investment styles to help manage the risk of the portfolio. Investment styles within the equity asset class are defined as follows:
10.2.1.1 Value–companies believed to be undervalued with potential for capital appreciation.
10.2.1.2 Growth–companies that are expected to have above average long-term growth in earnings and profitability.
10.2.1.3 Small Cap–companies with total market capitalization less than one billion dollars.
10.2.1.4 Mid Cap–companies with total market capitalization between one and five billion dollars.
10.2.1.5 Large Cap–companies with total market capitalization greater than five billion dollars.
10.2.1.6 International–equity investments in companies domiciled outside the U.S. are limited to American Depository Receipts (ADRs) listed on major U.S. exchanges or to mutual funds or exchange traded funds.
10.2.2 Each of the three size styles is combined with value and growth to produce seven equity styles: large growth, large value, mid growth, mid value, small growth, small value, and international. 10.2.3 While equity styles go in and out of favor over time, the portfolio’s strategic risk control relies on a stable asset allocation near the target. Chasing the best performing equity style is inconsistent with maintaining value in the long term.
10.3 Bonds:Bonds function as both an asset class and a sector.
10.3.3 Allocation Range: The portfolio relies on the bond asset class to moderate risk over the long term through diversification. Therefore, the bond allocation range is limited.
10.3.4 Bonds as a Sector: Bonds are similar to a sector with an economic outlook that the managers should have the flexibility to incorporate into the portfolio.
10.3.5 Risk Control: The bond allocation’s ability to temper the portfolio’s risk is dependent on reasonable controls over the risk of the bond portfolio.
10.3.6 Effective Duration: To establish risk control, the bond portfolio’s effective duration is bounded between 3.5 and 5.5 years.
10.3.7 Flexibility and Risk Control: By varying both the bond allocation and the effective duration, the managers have enough flexibility to take a view of the bond sector’s prospects without distorting the risk profile of the portfolio.

Crummer Investment Management
10.3.8 Strategic and Tactical Balance: The managers must balance short and long run objectives and, therefore, navigate between sector and asset allocations. There is no set formula and the best judgment of the class and the Committee must be used to accommodate both tactical sector weights and strategic asset class allocation.
10.3.9 Diversification Limit: No individual asset in the portfolio may represent more than 5% of the total market value of the portfolio. This rule does not apply to mutual funds or exchange traded funds.
10.3.10 Derivatives: The Crummer/SunTrust Portfolio may contain derivative securities. Typically, the Portfolio will only use derivatives as a hedge in association with the derivatives class. In this case, a separate written proposal must be approved by the instructors involved. The cash required by these hedges will constitute no more than 10% of the Portfolio’s market value.
Rebalancing Procedure
11.1 Should the asset allocation range for a particular asset class or sector be breached by reason of gains, losses, or any other reason, the class will recommend whether to rebalance the assets to the target asset class allocation, taking into account the transaction cost. In addition, the Committee shall have the authority to review the actual allocations at any time to insure conformity with the adopted tactical and strategic allocations. See Section 2.2. The assets will not be automatically rebalanced on any set schedule. Custodian
12.1 SunTrust Bank is the custodian for the assets of the Crummer/SunTrust Portfolio.
Table A:
Target Rates of Return, Components, and Spending Policy
Long Term Short Term
Administrative and Trading Expenses ½ ‐ 1% ½ ‐ 1%
Allowance for Inflation 2 ‐ 3% Consumer Price Index
Distribution from Portfolio 3½ ‐ 5½% Approximately $25,000
Portfolio Real Growth 2 ‐ 2½% > 0%
Target Total Return 8 ‐11½% Dependant On Above

Crummer Investment Management
Table B Crummer/SunTrust Portfolio Equity Portfolio Sectors
S&P 500 Sector Benchmark
Consumer Discretionary S&P Consumer Discretionary Index
Consumer Staples S&P Consumer Staples Index
Energy S&P Energy Index
Financials S&P Financials Index
Healthcare S&P Healthcare Index
Industrials S&P Industrials Index
Information Technology S&P Information Technology Index
Materials S&P Materials Index
Telecom S&P Telecom Index
Utilities S&P Utilities Index
Target Deviation for any sector is +/‐ 20% of its S&P 500 market weight
Table C
Crummer/SunTrust Portfolio Asset Allocation Guidelines
Target Range
Asset Class Low Mid High Benchmark
Large Cap ‐ Growth 10% 20% 30% Russell 1000 Growth
Large Cap – Value 10% 20% 30% Russell 1000 Value
Mid Cap – Growth 5% 7.5% 10% Russell MidCap Growth
Mid Cap – Value 5% 7.5% 10% Russell MidCap Value
Small Cap ‐ Growth 5% 10% 15% Russell 2000 Growth
Small Cap – Value 5% 10% 15% Russell 2000 Value
International Equity 5% 10% 15% MSCI – EAFE
Fixed Income 12% 15% 18% Vanguard Total Bond Market Bond Index Fund
Derivatives 10% Max
Cash as needed
Minimum weight for any asset class is 5%

Crummer Investment Management
Mean‐VarianceEfficiencyAnalysisMean‐variance efficiency analysis is part of modern portfolio theory. Although not a widely used guide to
constructing portfolios, this analysis can identify where the proposed portfolio might be improved. To conduct
this analysis we assembled historical data for the ten equity sectors and constructed the efficient frontier
shown in the chart below. Along with the efficient frontier of the highest return portfolios of the ten sectors
with the lowest amount of risk (standard deviation), the chart plots the individual sectors and the proposed
portfolio.
Of most interest in this analysis are the two portfolios: proposed (in green) and efficient (in red on the efficient
frontier). The proposed portfolio offers an expected return of 10.9% with a standard deviation of 16.5%. The
efficient portfolio has the same risk but a higher expected return, 12.9%. Unfortunately, this increase in return
requires a sector allocation that places 56% in the energy sector, 25% in consumer staples, 15% in IT and 4% in
health care (shown in the chart below).

Crummer Investment Management
This portfolio, while more efficient, is inconsistent with our short‐term economic expectations strategy and
undesirable from a diversification perspective.

Crummer Investment Management
TechnicalAnalysisToolsAlthough fundamental value‐based analysis was the primary method for stock recommendations, we also used
some technical analysis tools to determine whether the timing of the trade is right. Within the portfolio
management group, we hold the belief that fundamental analysis answers the question of, “What securities do
we buy and sell?” while technical analysis provides the answer to, “When shall we buy or sell the securities
identified?” The three tools that each analyst used after conducting fundamental research were Bollinger
Bands, Money Flow Index and RSI.
Bollinger Bands
Bollinger Bands were created by John Bollinger in the 1980s to measure the peaks and troughs of the price
relative to previous trades. The bands are as follows:
Middle band – a simple moving average (SMA)
Upper band – shows a standard deviation above the middle band
Lower band – shows a standard deviation below the middle band
When the price is at the lower band, it is expected to revert upward toward the middle band. When the price
is at the upper band, it is indicating a reversion downward to the middle band. However, the Bollinger Bands
can also indicate price breaks to the upside and downside if the price goes outside of either band with strong
volume.
RSI
The RSI, developed by J. Welles Wilder, is the Relative Strength Index. The RSI is a momentum oscillator that
monitors both the speed and change of price movements. The indicator ranges from 0 to 100 and shows
overbought (above 70) and oversold (below 30) conditions.
Money Flow Index
The Money Flow Index is an oscillator that uses both price and volume to determine if money is flowing in or
out of a security. Money flow is positive when there is buying pressure and negative when there is selling
pressure. This number is multiplied with the RSI and gives a range from 0 to 100. This indicator tells whether a
stock is overbought (80 or above) or oversold (20 or below).
Value at Risk
Value at Risk (VaR) is a widely used risk measure of the risk of loss on a specific portfolio of financial assets. VAR calculates the maximum loss expected (or worst case scenario) on an investment, over a given time period and given a specified degree of confidence.
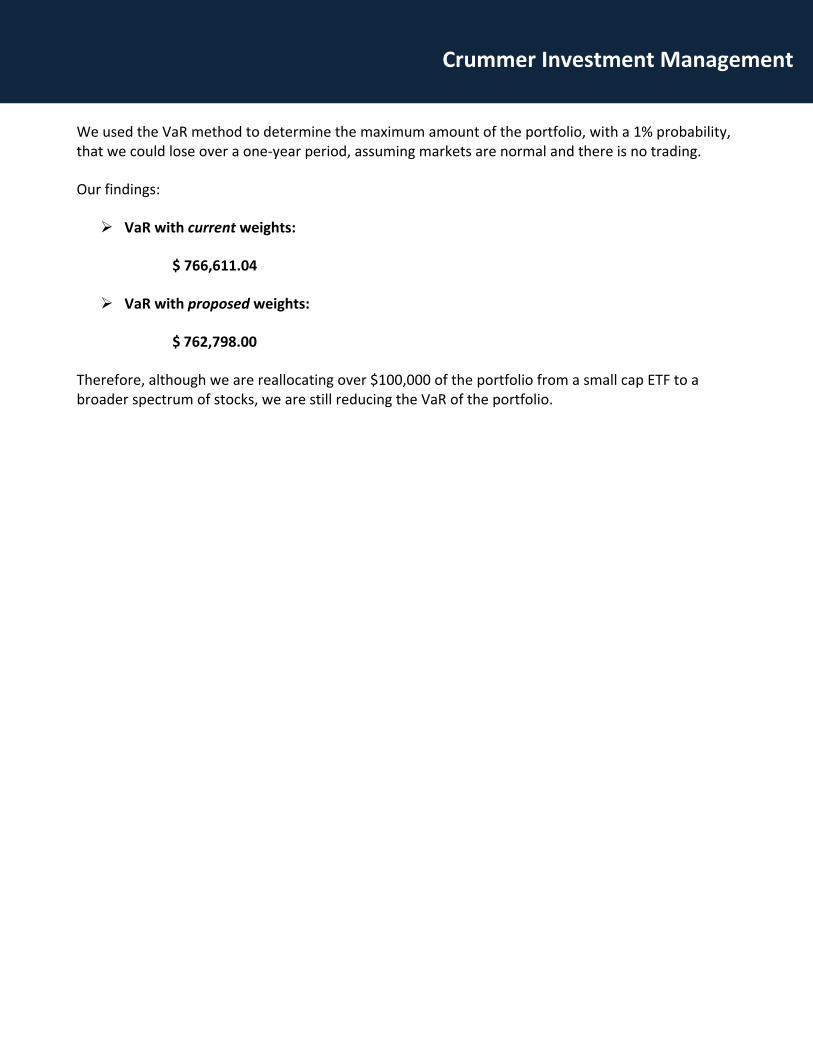
Crummer Investment Management
We used the VaR method to determine the maximum amount of the portfolio, with a 1% probability, that we could lose over a one‐year period, assuming markets are normal and there is no trading.
Our findings:
VaR with current weights:
$ 766,611.04
VaR with proposed weights:
$ 762,798.00
Therefore, although we are reallocating over $100,000 of the portfolio from a small cap ETF to a broader spectrum of stocks, we are still reducing the VaR of the portfolio.
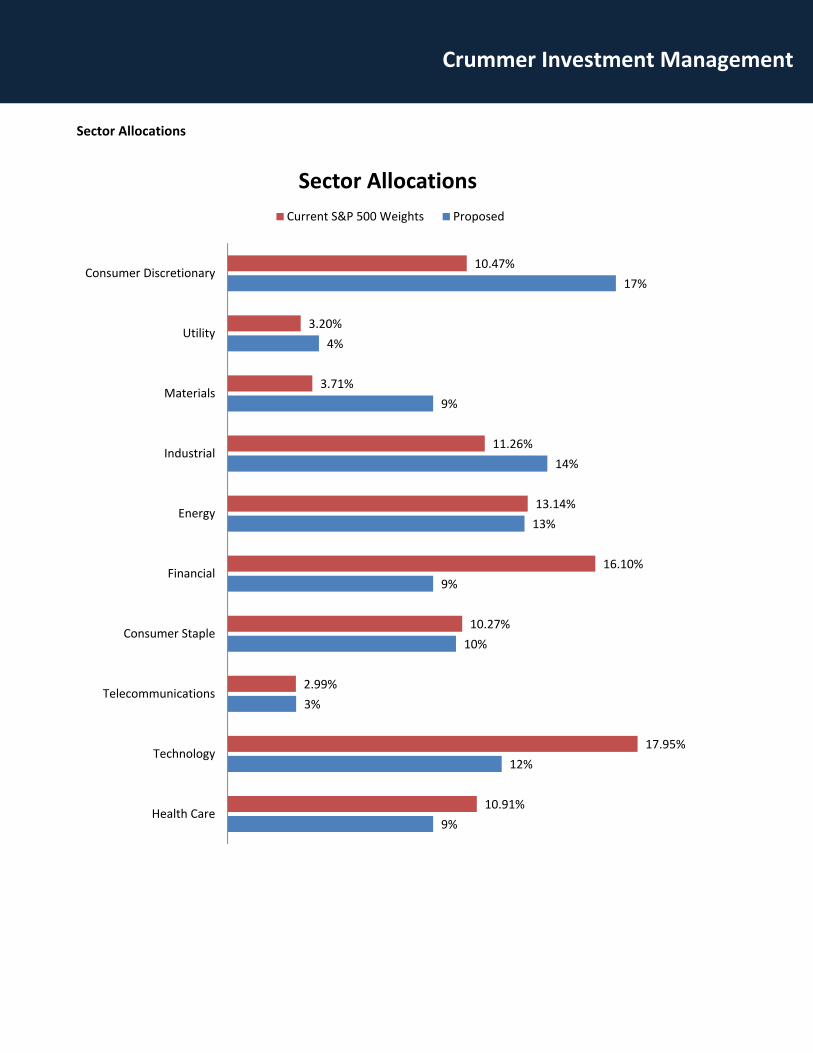
Crummer Investment Management
Sector Allocations
9%
12%
3%
10%
9%
13%
14%
9%
4%
17%
10.91%
17.95%
2.99%
10.27%
16.10%
13.14%
11.26%
3.71%
3.20%
10.47%
Health Care
Technology
Telecommunications
Consumer Staple
Financial
Energy
Industrial
Materials
Utility
Consumer Discretionary
Sector Allocations
Current S&P 500 Weights Proposed

Crummer Investment Management
PortfolioClassAllocations:CurrentandProposedThe tables and charts included in this section show the proposed portfolio allocation compared to the portfolio
designed last year.
This year’s proposal continues the value tilt of the asset allocation, consistent with our optimistic view.
Cash4%
Fixed Income12%
Large Growth21%
Large Value31%
Mid Growth10%
Mid Value9%
Small Cap Value
5%
Small Growth8%
Allocation 2011
international6.0%
large growth25.7%
large value31.8%
mid-cap growth
5.4%
mid-cap
value9.5%
small growth8.4%
small value13.2%
Proposed Allocation 2012

Crummer Investment Management
While our intention was to design an aggressive portfolio, the sector allocations we inherited constrained us to
some extent. For example, the market weight in technology was 20.04% while our allocation is only 15.7%.
These discrepancies are due primarily to the substantial under weighting in the portfolio. Even so, this
portfolio is well positioned to take advantage of the economic recovery.
Consumer Staples10.70% Energy
11.70%
Financial,4.70%
Health Care11.30%
Industrial10.70%
Materials3.50%
Telecommunications, 2.80%
Utilities3.40%
Consumer Discretionary,
10.90%
Technology20.40%
Market Sector WeightsFebruary 2012