
Rolf Pendall © 2001 - Rowan University
66
Exploring Connections Between Density, Sprawl, and Segregation by Race and Income in U.S. Metropolitan Areas, 1980-1990 Rolf Pendall © 2001 Lincoln Institute of Land Policy Conference Paper The findings and conclusions of this paper are not subject to detailed review and do not necessarily reflect the official views and policies of the Lincoln Institute of Land Policy. This paper was written for and presented at a Lincoln Institute course titled, “International Seminar on Segregation in the City,” held from July 26-28, 2001. Please do not photocopy without permission of the author. Contact the author directly with all questions or requests for permission. Lincoln Institute Product Code: CP01A20
Transcript of Rolf Pendall © 2001 - Rowan University

Exploring Connections Between Density, Sprawl, and Segregation by Race and Income in U.S. Metropolitan Areas, 1980-1990
Rolf Pendall
© 2001
Lincoln Institute of Land Policy Conference Paper
The findings and conclusions of this paper are not subject to detailed review and do not necessarily reflect the official views and policies of the Lincoln Institute of Land Policy.
This paper was written for and presented at a Lincoln Institute course titled, “International Seminar on Segregation in the City,” held from July 26-28, 2001.
Please do not photocopy without permission of the author. Contact the author directly with all questions or requests for permission.
Lincoln Institute Product Code: CP01A20

Exploring connections between density, sprawl, and segregation by race and income in U.S. metropolitan areas, 1980-1990 Paper to be presented at Segregation in the City: Forces, Consequences, Policy Responses Lincoln Institute of Land Policy Cambridge, Massachusetts July 28, 2001 Paper draft: 10/07/2002 Rolf Pendall Assistant Professor, City and Regional Planning Cornell University 105 W. Sibley Hall Ithaca, NY 14853 [email protected] 607-255-5561

Exploring connections between density, sprawl, and segregation by race and income in U.S. metropolitan areas, 1980-1990 Rolf Pendall Assistant Professor, City and Regional Planning, Cornell University [email protected]
Summary/Abstract In this paper, I test the proposition that efforts to curb sprawl can also promote more mixing of
incomes within neighborhoods and reduce racial residential segregation. Racial residential segregation is
declining broadly, though gradually, in the United States; economic segregation, by contrast, is on the
rise. Some interest groups have suggested that land-use policy reform would help solve many
metropolitan problems, including loss of open space and agricultural lands; increased traffic congestion;
excessive energy use; water and air pollution; and local budget stresses. They tend to assume, without
testing, that such reforms will not exacerbate and may even ameliorate segregation by race and class.
Sprawl has many definitions. Some are aesthetic; some relate to automobile dependency; others relate
to land use patterns. Definitions of sprawl that measure land use patterns are divisible into several
categories:
�� Density-related definitions of sprawl measure either the gross number of persons or housing units per
acre of land, or the gradient of density as it declines from a central point. Analyses of density differ
with regard to their use of both the numerator (x per) and the denominator (land); national analyses
have tended in the past to rely on Census Bureau-defined Urbanized Areas (UAs), which identify
areas over a given population density but leave out other urban and built-up areas.
�� Scatter-related definitions of sprawl measure the “patchiness” of development and the extent to which
land is skipped over in the development process. Such patchiness may be inefficient, but it may also
be highly efficient and provide a closer connection between people and open space.
�� Strip or ribbon development is linear growth, usually along major transportation corridors, that
increases the edge between urbanization and open lands.
�� Centralization measures the degree to which urbanized land is close to a central point.
�� Compactness refers to the degree to which development of each neighborhood is dense.
In this research, I test only one definition of sprawl. Using the U.S. Department of Agriculture’s
National Resources Inventory (NRI), a land use inventory, and Census-based estimates of county
population, I develop gross density calculations for 320 metropolitan areas in the United States as of 1982
and 1992. I then test whether density, change in density, and household growth—which is a component of

Density, Sprawl, Segregation / Pendall Page 2
density change in my formulations—have an influence on changes in segregation between 1980 and
1990, holding constant a series of other variables that have been shown or theorized to influence
segregation.
The analysis is novel because it analyzes changes in the index of dissimilarity (D) as computed for
households at regionally specific income levels; it measures the degree to which households and families
who earn less than 50% of their metropolitan area’s median income (very low income households or
families) are segregated from other households and families of the same race; I refer to this as “economic
segregation.” I also analyze separately the racial segregation of very low income and non-very low
income black and Hispanic households from white households (blacks) and Anglo persons (Hispanics).
My analysis implies that, far from alleviating segregation, increasing density exacerbates economic
segregation among all households and between very low income and non-very low income white
households. Density change does not have a significant direct effect on economic segregation of
Hispanics or blacks; economic segregation among all households, however, exacerbates economic
segregation among Hispanics and blacks. And economic segregation of Hispanics and blacks, in turn,
exacerbates racial segregation between very low income blacks and all whites and between very low
income Hispanics and all Anglos (see Figure 2 for an illustration).
Why might density exacerbate segregation? High-density neighborhoods, especially in newly
developing parts of metropolitan America, are often highly segregated by housing type and thus by class.
Zoning laws, the building industry, lenders, and infrastructure policy all favor large uniform tracts of
apartments or single family houses. Census tract definitions—which I use to measure segregation levels—
may reinforce the impression that high-density areas are more segregated because high-density
development allows local census area definition committees to identify homogeneous areas of 3000 or so
persons, which the Census uses as a target for tract populations. Finally, gentrification may occur more
systematically in high-density regions, displacing low-income residents from some neighborhoods and
sorting the city by income more rapidly than occurs in lower-density regions.
By other definitions, sprawl might exacerbate segregation. Measures that identify the extent to which
uses and housing types are mixed within neighborhoods would likely reveal that mixing promotes
integration; measures that use more uniform area sizes would also be likely to find more economic and
racial mixing in space in high-density areas. Research in such directions would likely yield interesting
results.
In the meantime, however, policy-makers should not assume that high-density development will
necessarily produce metropolitan areas in which households are less segregated by income or race.
Neither should they abandon the quest for an urban form that is more environmentally and economically

Density, Sprawl, Segregation / Pendall Page 3
sustainable. Instead, they should—as they make efforts to increase metropolitan density—design policies
that directly attempt to mix incomes and housing types within neighborhoods.

Exploring connections between density, sprawl, and segregation by race and income in U.S. metropolitan areas, 1980-1990
Paper draft: 10/07/2002
Rolf Pendall
Assistant Professor, City and Regional Planning, Cornell University
Introduction In recent years, urban sprawl has captured increased attention. Journalists write about it (El Nasser
and Overburg 2001). Candidates for the Presidency in 2000 released statements about it (Planning
Commissioners Journal 2000). Voters pass bond measures to slow it and save open space (Myers and
Puentes 2001). Researchers define it (Galster et al. 2000; Torrens and Alberti 2000; Ewing 1997) and
debate its impacts (Gordon and Richardson 1997; Burchell et al. 2001). By many definitions, sprawl has
been shown fairly consistently to degrade wildlife habitat, threaten agricultural productivity, and raise the
cost of public services at all levels of government (Ewing 1997; Alberti 1999). The magnitude of these
costs, and whether they outweigh the benefits that sprawl provides, remains an issue of intense debate
(Gordon and Richardson 1997; Ewing 1997).
Many observers also assume that urban sprawl also promotes inner-city distress, since sprawl and
urban decline have happened simultaneously, but systematic research on this question is both sparse and
inconclusive (Downs 1999; Burchell et al. 2001). One key measure that associates with distress is
segregation by race and income. Racial segregation associates with, and contributes to, concentrated
poverty (Jargowsky 1997; Massey and Fischer 2000). Concentrated poverty, in turn, hinders the life
chances of the people who live in poor neighborhoods, especially the children (Ellen and Turner 1997).
When African-Americans and Hispanics are segregated by race, they tend to live in lower-quality
neighborhoods than in more integrated settings (South and Crowder 1998b); surveys indicate that
African-Americans and Hispanics both prefer to live in neighborhoods mixed with Anglos (Farley et al.
1978; Farley 1993; Farley, Fielding, and Krysan 1997; Charles 2000), but intense racial segregation
deprives them of that choice. Metropolitan areas that are more segregated by income, too, embody
conditions of concentrated affluence and poverty that may have negative effects for all residents (Massey
1996; Galster 1992).

Density, Sprawl, Segregation / Pendall Page 2
Many indices of black-white segregation declined slightly in the 1980s, but blacks and Hispanics
remained intensely segregated from Anglos (non-Hispanic whites) by many of these measures in 1990
(Massey, White, and Phua 1996); segregation of Hispanics from whites increased slightly in the 1980s.
Preliminary indications suggest that the decades-long decline in segregation may have stalled in the 1990s
(Belsie 2001). Yet integration has slipped as a public policy priority as school busing has been rolled back
(Orfield, Eaton, and The Harvard Project on School Desegregation 1996) and affirmative action
challenged (Thernstrom and Thernstrom 1997).
Many forces contribute to continued and intensified racial segregation, including individual
residential choices by prejudiced whites (Farley 1993; Clark 1986); discriminatory lending, insurance,
and real estate practices (Galster 1988; Cloud and Galster 1993; Yinger 1986); and exclusionary zoning
(Pendall 2000a). Segregation may also be perpetuated by “white flight,” the tendency of whites to seek
residences at increasingly greater distances from central cities and now even from older suburbs (Crowder
2000; Harris 1999). Although white flight, sprawl, and racial segregation seem intuitively to have
connections, this connection has not been tested systematically for many metropolitan areas or for several
different racial and ethnic groups.
In this article, I conduct such a systematic test by examining the relationship between sprawl and
racial and ethnic segregation/location between 1980 and 1990. It lays the groundwork for an extension to
2000 once complete 2000 census results become available in 2002. I rely on a land-use database from the
U.S. Department of Agriculture and population and household estimates from the U.S. Census Bureau to
develop indices of sprawl and segregation. The segregation indices account for both income and race,
while the sprawl indices allow more accurate definitions of household density than those based on Census
definitions of urbanization or urbanized areas.
I begin the article with a review of current knowledge on racial and economic segregation in U.S.
metropolitan areas; I then proceed to a review of the literature on measuring sprawl and its effects. Next, I
discuss my data sources and methods and present my results. At least by my measure of sprawl, an
indicator of density, I have not found evidence that sprawl (either overall density at one point in time or
decline in density over time) was responsible for increasing segregation by either race or income in the
1980s. On the contrary, it is rapidly increasing density that appears to associate most strongly with any
aspect of segregation; regions that grew fast and gained density became more economically segregated for
all households. In such regions, lower- and upper-income blacks became more segregated from one
another, as did lower- and upper-income Hispanics. And in regions where such intra-race economic
segregation became more pronounced, lower-income blacks and Hispanics both became more segregated
from all whites or Anglos. Hence there are indirect connections between rapid density increase and

Density, Sprawl, Segregation / Pendall Page 3
increased racial segregation, but my results show no support for the idea that rapid sprawl associates with
either higher or lower average segregation levels.
The Persistence of Segregation in the United States Decades of research have shown that blacks1 and whites, and to a lesser extent Hispanics and whites,
are highly segregated from one another in the United States (Massey and Denton 1993; Schnore 1972).
Black-white residential segregation began to intensify in the late 1800s, when pedestrian travel began to
give way to various forms of rapid transit. African-American migration to the north began in earnest in
the 1910s, as crop failures in the south coincided with growing demand for laborers in northern factories
gearing up for World War I (Massey and Denton 1993). Because northern housing markets were already
crowded from decades of record-level foreign immigration, real estate agents and speculators could make
huge profits by blockbusting, and steering was conventional practice. At the same time, factory owners
used African Americans as strike breakers, fomenting racial animosity in the workplace. These private-
market events of the early 1900s thus set the stage for the public sector to intervene, most infamously by
limiting the ability of residents in mixed-race or minority neighborhoods to obtain FHA mortgage
insurance (Jackson 1985). The combination of private households’ decisions, business actions, and public
sector actions led by the 1950s to extreme segregation in many cities, especially in the fast-growing
industrial centers of the North.
Several recent studies have documented that racial segregation was actively constructed, rather than a
natural outcome of households exercising their preferences (Hanchett 1998; Gotham 2000). In Charlotte,
North Carolina, for example, whites and African Americans of all classes shared neighborhoods and even
blocks until about 1895. But with the end of Reconstruction and the beginning of Charlotte’s expansion,
real estate leaders systematically “sorted out” this “New South city” (Hanchett 1998). Kansas City was
subject to some of these same forces; civic leaders in the real estate industry also played an important role
by promoting the use of racially restrictive covenants (Gotham 2000). Gotham (2000) documents that
despite the Supreme Court’s landmark Shelley v. Kraemer decision (334 U.S. 1, 1948), developers
continued writing racial restrictions into their subdivisions until the early 1960s.
Segregation between Hispanics and Anglos has never been as severe as that between blacks and
whites, except for Hispanics of African descent. Even so, identifiable barrios have persisted for decades in
Los Angeles, San Antonio, El Paso, Albuquerque, Phoenix, San Diego, Chicago, and other cities with
large Chicano and Mexican-American populations (Marquez 1985; Romo 1983; Monroy 1999; Camarillo
1984; Betancur 1996).
Among the many causes of racial separation, white suburbanization—sometimes known as white
flight—has often been cited at least in popular accounts. Ample subsidies to highway construction, low-
cost long-term FHA and VA mortgages, and income tax deductions for mortgages and local property

Density, Sprawl, Segregation / Pendall Page 4
taxes all helped fuel suburbanization once World War 2 was over (Jackson 1985), but African Americans
and Hispanics were often unable to take advantage of these programs. They had lower incomes than
whites (and thus were less likely to itemize their tax returns), suffered from job discrimination, were
much more likely to rent their housing (and thus lacked the equity required to begin as home owners), and
were barred from many housing developments by racially restrictive covenants.
In the South, the restrictive application of these postwar policies meant that African Americans in
rural and urban areas alike could not obtain access to better housing, but since many African Americans
already lived outside southern cities, suburbanization did not result in the same patterns of segregation
observed in the North. Chicanos (Mexican Americans), too, have lived in employment-related suburban
enclaves and rural areas for generations in the United States (Camarillo 1984, 37; Betancur 1996). As
metropolitan areas have grown out to surround and incorporate these historic settlements, they often
remain centers of diversity or ethnic neighborhoods long after the economic base has changed.
Many social, legal, and economic developments after World War 2 began to erode, though gradually,
the foundations of racial residential segregation. Shelley v. Kraemer (334 U.S. 1, 1948) barred the
enforcement of racially restrictive covenants in 1948 and filtered gradually into real estate practices by
the 1960s. The FHA modified its insurance redlining procedures in the early 1950s. The Fair Housing Act
of 1968 prohibited (though it has not stopped) many of the real estate, insurance, and exclusionary zoning
practices that had helped build American apartheid. More recently, fair-housing audits and increased
penalties in the 1980s and 1990s enhanced the disincentives against discrimination. Federal housing
policy shifted toward tenant-based assistance, which allows subsidized minority households to live in less
racially segregated neighborhoods than those surrounding traditional public housing (Turner 1998;
Pendall 2000b). In responding to surveys, meanwhile, whites reported increased tolerance for integrated
neighborhoods, partly because of the ideological effects of the civil rights movement and partly as a
consequence of rising education levels and incomes among people of all races and ethnicities (Farley,
Fielding, and Krysan 1997; Farley et al. 1978; Farley et al. 1993).
As legal structures, culture, and real estate practices have slowly shifted, African Americans have had
increasing success at finding housing in the suburbs. African-Americans in the North gained access to
suburban areas starting at least as early as the 1920s (Schnore, André, and Sharp 1976). After World War
II, some real estate developers subdivided suburban land to accommodate African Americans in search of
more elbow room (Wiese 1993), though these subdivisions usually remained segregated. Black
suburbanization picked up pace with each passing decade (Frey 1985; Schneider and Phelan 1993). But
substantial evidence suggests that black suburbanization has not reduced segregation levels (Galster 1991;
Schneider and Phelan 1993); “the communities to which blacks gained access during the 1980s were
significantly closer to the central city and they had significantly lower median income” (Schneider and

Density, Sprawl, Segregation / Pendall Page 5
Phelan 1993, 276). In 1990, blacks represented 12 percent of the national population, but only 8 percent
of the suburban population. Hispanics, by comparison, constituted 9 percent of the national population
and 7.5% of the suburban population (Phelan and Schneider 1996).
Black suburbanization has paralleled the growth of the black middle class (Wilson 1996, 1978, 1987;
Pattillo-McCoy 2000). Blacks began moving into middle class operations immediately after World War
II, but the pace of change increased most dramatically after 1960. Between 1980 and 1995 the share of
blacks in middle class occupations grew from just under 40% to just under 50%. Nearly 60% of whites
filled middle class occupations in 1995, and whites tend to fill upper middle class occupations (business
and professions) whereas blacks work predominantly in lower middle class jobs (sales and clerical)
(Pattillo-McCoy 2000, 227-228).
Whether because of growth in the black middle class, modest gains from suburbanization, increases
in white tolerance for blacks generally, or other causes, black-white segregation fell, though slightly,
between 1960 and 1990 (Farley and Frey 1994; Massey and Denton 1993). Massey and Denton (1989)
define over 20 measures of segregation, but three are most common. The dissimilarity (D) index, a
measure of evenness, represents the percent of blacks or whites who would have to move from
neighborhoods in which they are overconcentrated to neighborhoods where they are underrepresented to
achieve an even distribution of blacks and whites across a metropolitan area. Values of D close to 0
represent no segregation (and are statistically highly unlikely to occur randomly); those close to 100
represent complete segregation.
Analyzing 232 metropolitan areas with substantial black populations, Farley and Frey (1994) found
that the average D index fell from 69 to 65 between 1980 and 1990. According to my own analysis of
segregation indices for 1990 and 2000 computed for 330 metropolitan areas by researchers at the State
University of New York at Albany (Stults 2001), the average black-white D index in 2000 was 51.5,
down from 58.8 in 1990 (Table 1). Of the 330 metropolitan areas analyzed, 310 had reductions in
segregation by this measure, and the remaining 20 areas accounted for only 4.9% of the national black
population. Segregation is less extreme for Hispanics; the Hispanic-Anglo D index across metropolitan
areas dropped from 42.9 to 38.6 in the 1990s. But in 125 metropolitan areas, the Hispanic-Anglo D index
increased; these 125 metropolitan areas account for 70% of the national Hispanic population. Hence the
picture of reduction in Hispanic segregation must be qualified.
(TABLE 1 ABOUT HERE)
The isolation index (xP*x) represents the percent of residents who are black (white) in the average
black (white) person’s neighborhood. The exposure index (xP*y), a measure related to isolation, denotes
the percent of residents who are white (black) in the average black (white) person’s neighborhood.
Isolation and exposure are known as “asymmetric measures” because even though both information on

Density, Sprawl, Segregation / Pendall Page 6
races factors into the indices, black isolation will differ from white isolation, as will black exposure to
whites from white exposure to blacks. The D index, by contrast, is a symmetrical measure. White
isolation fell in the 1990s, but the average white in the average U.S. metropolitan area still lives in a
neighborhood that is over 80% white, even though the national metropolitan population is only 66% non-
Hispanic white. Black isolation also declined in the 1990s, from an average of 30.6 to an average of 27.7,
but Hispanic isolation crept up from 13.1 to 16.7, partly as a consequence of the growing share of
Hispanics in the national population.
Numerous analyses by Massey and Denton (Denton 1994; Massey and Denton 1989; Massey and
Fischer 1999), Farley and Frey (Farley and Frey 1994), and others have documented some of the reasons
why metropolitan areas’ racial segregation levels differ. Large metropolitan areas had higher segregation
indices, but regions that grew rapidly in the 1980s had lower black-white segregation in 1990 (Farley and
Frey 1994). Regions with higher socio-economic status (represented by percent of workers in white-collar
occupations, median income, and percent of adults with college education or high school degree) explains
much of the variation for Hispanics and contributes significantly to variation across regions for blacks,
but fails to explain why blacks’ segregation levels are so much higher than Hispanics’ (Massey and
Denton 1989; Massey and Fischer 1999).
Blacks (Hispanics) are more segregated from Anglos in regions with high proportions of black
(Hispanic) residents, but regions in which minority population growth outpaced that of Anglos have lower
segregation, at least by the isolation index (Massey and Denton 1989). Metropolitan areas in the South
had less black-white segregation than those in the Northeast and Midwest, but did not differ significantly
from those in the West, in 1990 (Farley and Frey 1994). Metropolitan areas with higher share of non-
black minority residents had lower black-white dissimilarity in 1990 (Farley and Frey 1994), but regions
in which greater shares of Hispanic residents were black (e.g., Dominicans and Puerto Ricans) had higher
levels of segregation for Hispanics (Massey and Denton 1988). Several other analyses have confirmed
that Puerto Ricans and Dominicans fall somewhere between other Hispanics and blacks in their level of
segregation from whites (Denton and Massey 1989; Santiago and Galster 1995; Freeman 1999).
Housing costs and programs also contribute to continued segregation. In many metropolitan areas, the
most affordable housing stock in a region is that within a central city, where rental housing is also often
highly concentrated (Turner and Wienk 1993; Pendall 2000b). The segregation of public housing projects
for families—where disproportionate numbers of black and Hispanic families live—is legendary
(Bickford and Massey 1991). Section 8 housing vouchers, a majority of which are held by black or
Hispanic households, provide theoretical opportunities for their bearers to live in integrated
neighborhoods, but they do not always live up to that promise because low-cost rental housing whose
landlords accept certificates is often concentrated in minority neighborhoods (Pendall 2000b).

Density, Sprawl, Segregation / Pendall Page 7
Research using individual-level data confirms that differences between mobility patterns of African
Americans and those of Anglos are likely to fuel segregation, but highlight the importance of income to
differences in rates of integration and incorporation of blacks into white neighborhoods. Blacks are more
likely to move into white areas when they earn higher incomes and have higher levels of education
(Logan, Alba, and Leung 1996). This result does not contradict the findings of Massey and Denton (1987)
that regions in which blacks had higher income levels did not have lower levels of segregation; rather, it
shows that aggregate and individual processes may have different net effects. Logan et al. (1996) also
show that black home owners are less likely to move into white areas even holding other elements of their
socioeconomic status constant. African Americans have lower rates of intraurban residential mobility than
whites and improve their residential environments less when they move (St. John, Edwards, and Wenk
1995). Blacks are also more likely to move from suburbs to cities than whites (South and Crowder 1997).
A greater supply of new housing in the metro area increases blacks’ mobility into whiter tracts; this
tendency decreases, however, in regions with high black populations and higher proportions of suburban
residents. Blacks and whites rarely move into tracts characterized by those of the other race, generally,
and have high rates of out-mobility from tracts in which high shares of residents are from the other race
(South and Crowder 1998b).
Many studies have shown the continuing presence of illegal racial discrimination in the form of racial
steering, unfair mortgage lending practices, landlords’ decisions not to rent housing to blacks and
Hispanics, and insurance companies refusal to write homeowner policies in predominantly black
neighborhoods (Yinger 1998; Yelnosky 1999). Analyses that test the effect of metropolitan levels of
discrimination on metropolitan segregation indices provide mixed results, depending in part on the scale
of analysis. Galster, in a cross-metropolitan comparison using data from a national survey of
discrimination in the 1980s, reported that reducing housing market discrimination from its mean to its
sample minimum would yield a 31% reduction in segregation, whereas an increase in the black-white
income ratio from its mean to its maximum value would reduce segregation by 18% (Galster 1989, 190).
Combining individual-level data from the 1980s with similar metropolitan measures of
discrimination, South and Crowder (1998a) found no significant effect metropolitan levels of
discrimination upon blacks’ decisions to move. They also found that the destination tracts of both black
and white movers had larger percentages of white residents in regions that had higher rates of
discrimination. They suggest that racial discrimination may be a response to high black mobility into
white neighborhoods, rather than the opposite. Like the seeming contradiction between findings by
Massey and Denton and findings by Logan et al., Galster’s and South and Crowder’s results suggest that a
pattern clearly visible at one scale may be obscured at other scales. Further research on how
discrimination manifests itself in segregation is clearly very important, since, as Galster notes,

Density, Sprawl, Segregation / Pendall Page 8
“Discrimination is certainly not the only cause of segregation. But it is a major one, and the only illegal
one. It thus warrants careful attention if public policy makers are to act wisely” (Galster 1989, 190).
Intensifying Economic Segregation Although some of the indices of racial segregation declined between 1970 and 1990, many measures
of economic segregation were on the increase over that period. Simultaneously, and probably as a driving
force, income divisions grew. The Gini index of income distribution—which varies from 0 to 100, with
100 indicating complete inequality—rose from a record low 38.8 in 1968 to a high of 45.9 by 1997 (U.S.
Census Bureau 2001). (The Gini index dropped to 45.7 in 1999.) Two trends appear to have been at work
in the bifurcation of incomes: first, new high-wage jobs were created but not enough workers had the
skills to fill them, forcing wages upward for women and black men. Second, starting in the early 1980s,
income began to polarize and the number of low-wage jobs increased dramatically, affecting white
women and black men as well as white men (Morris, Bernhardt, and Handcock 1994). In a parallel trend,
poverty became more concentrated, and the number of high-poverty tracts grew dramatically between
1970 and 1990 (Jargowsky 1997; Kasarda 1993).
As earnings bifurcated across workers, income segregation increased within regions (Massey and
Eggers 1990; Jargowsky 1996). Researchers have offered a legion of explanations for growing income
segregation in the United States and its most visible manifestation, the growth in concentrated central-city
poverty (Wilson 1987, 1996; Massey and Fischer 2000; Jargowsky 1997; Abramson, Tobin, and
VanderGoot 1995).2 Structural economic transformations undoubtedly play a major role. The nation has
shifted away from manufacturing and toward service sector jobs over the past 30 years.
Deindustrialization has had important effects on working-class neighborhoods in established central
cities; manufacturing jobs have disappeared from these areas, but no new activity has yet appeared to
replace them (Wilson 1996).
Even in regions that have never had large manufacturing bases, employment has deconcentrated in
the past 30 years, itself both a cause and consequence of residential sprawl (whose role in economic
segregation I explore below). As women entered the labor force in huge numbers in the 1980s, developers
built office parks in suburbs whose female residents provided a previously untapped, well educated, and
tractable labor pool (Garreau 1991; Nelson 1984). Occupational bifurcation—the loss of mid-level jobs—
has also been cited (Noyelle and Stanback 1984) as a cause of income bifurcation such as I observed
earlier, and income bifurcation itself probably contributes to spatial segregation by income.
Income segregation is in part a function of racial segregation. Since Blacks and Hispanics earn lower
incomes than Anglos in the U.S., any segregation based on race will inevitably influence rates of
segregation by income. Massey and Denton (1993) suggest that segregation between Anglos and
Hispanics is entirely “explained away” by income, but that substantial segregation remains between

Density, Sprawl, Segregation / Pendall Page 9
Blacks and Anglos even after controlling for income differences. If Blacks and Hispanics constitute a
growing share of low-income Americans and a falling share of the wealthy, then observed growth in
residential segregation by income may be a consequence of shifting racial composition. Income
segregation may also be a consequence of black suburbanization. This move to the suburbs, as discussed
above, is most likely to allow middle- and upper-class blacks to move out of inner-city neighborhoods,
leaving poorer blacks in increasingly isolated and impoverished ghettos.
Rising Sprawl and its Links to Segregation The rise of concern about segregation has been paralleled since World War 2 by efforts to stop,
manage, or contain urban sprawl. Even measuring sprawl has been a contentious matter, and connecting it
to its many purported outcomes has been more so. But the last decade has witnessed some progress in the
development and implementation of various metrics of sprawl. Many dimensions of sprawl have been
identified and are being quantified thanks to improvements in computing speed, new databases of land
use and land cover, and advances in geographic information systems and other software.
Among the dimensions of urban sprawl, urban density and density gradients are probably the best
studied and best established measure of sprawl. Low density is usually associated with sprawl, but
measuring density has been inconsistent and sometimes difficult. Density is intrinsically a measure
involving a numerator—units of something that fill a space—and a denominator—a measurement of
space—but disagreements have arisen over both the numerator and the denominator. Should the
numerator be represented by housing units, households, persons, business establishments? Should the
denominator be represented by all the territory within a boundary, all land that may be urbanizable, all
land considered “urbanized” by some definition? If the denominator should be all urbanized land—which
most sources agree that it should—then what kinds of land precisely should be counted as urbanized? Is
Central Park “urbanized”? What about the unmowed portion of a five-acre residential lot? Until recently
it was unnecessary to agree on a definition of urbanized land because the United States lacked high-
resolution national data source showing land use or land cover. In the absence of such data, many
analyses have used ad hoc cutoff points to classify small areas (census tracts, block groups, or blocks) as
“urban” and have computed gross metropolitan density or density gradients on that basis, excluding the
non-urban portions from analysis. (Examples of this approach include El Nasser and Overburg 2001;
Galster et al. 2000.)
Despite these difficulties and inconsistencies in measurement, most observers agree that if a flattening
density gradient and decreasing density are signs of sprawl, then sprawl is on the rise. In a study using the
U.S. Department of Agriculture’s National Resources Inventory—a land use and land cover based survey
of sample points in all U.S. counties outside Alaska—Pendall et al. (2001) found that between 1982 and
1997, the amount of urbanized land in the United States increased by 47%, from approximately 51 million

Density, Sprawl, Segregation / Pendall Page 10
acres in 1982 to approximately 76 million acres in 1997. During this same period, the nation’s population
grew by only 17%. Even so, there was wide variation among metropolitan areas in the extent to which
density decreased. In the 281 metropolitan areas they studied, 17 became more dense. Some fast-growing
regions (Las Vegas, Phoenix) gaining density while slow-growing or declining ones (Cleveland,
Pittsburgh) continued urbanizing land and thereby lost substantial density. These findings broadly
confirm those published in journalistic accounts (El Nasser and Overburg 2001) and academic articles
(Gordon and Richardson 1997; Pendall 1999).
Density gradients—the decline in density usually observed as distance increases from a central point
(usually one or more central business districts)—have also been dropping in the United States. Between
1920 and 1963, for instance, one source indicates that density gradients grew shallower by an average of
0.012 points per year from 1920 to 1963 (Torrens and Alberti 2000, 10; citing Mills 1972). More recent
observations confirm the continued decline in the density gradient (Anas, Arnott, and Small 1998). Most
observers attribute the flattening of density gradients to improvements in transportation technology and
subsidies to car use that have reduced the cost of long-distance travel; increases in income, which has
resulted in more consumption per capita of residential land (lot size is apparently very elastic with respect
to income); and the suburbanization of employment, which is itself partly a consequence of outlying
residential growth that promotes the flattening density gradient.
Neither of these two dimensions of density alone is as useful as they are combined. Regions with
urban growth boundaries, including both Seoul, Korea, and Portland, Oregon (Bae 1998; Dunphy 1998),
have experienced flattening density gradients not because of declines in central-city density but because
of gains in suburban-edge density. Immediately beyond that edge, however, density falls dramatically in
the greenbelt or rural area beyond the urban growth boundary. Metropolitan New York and Los Angeles
are both high-density regions by several measures (Fulton et al. 2001; Galster et al. 2000), but New York
has a much denser CBD than downtown Los Angeles, while its newly developing fringes have much
lower residential density than do outlying areas of Los Angeles (Fulton et al. 2001).
Neither gross density nor the density gradient captures the full range of meanings attributed to sprawl.
Intrametropolitan patterns of development are also important. Scattering has “a variety of guises:
fragmentation, leapfrogging, discontinuous development, dispersal, and piecemeal development.
Essentially, these amount to the same thing—tracts of developed land that sit in isolation from other
undeveloped tracts” (Torrens and Alberti 2000, 9). Scattering and fragmentation can be measured with
metrics from landscape ecology, which establishes a framework for describing land use patterns as
patches and corridors (Forman 1995); the average number of persons or households per patch, the average
patch size, and the total number of patches all present part of a picture that characterizes regions as more
or less fragmented. Galster et al. (2000) operationalize scattering in two separate dimensions: continuity,

Density, Sprawl, Segregation / Pendall Page 11
“the degree to which developable land has been built at urban densities in an unbroken fashion,” and
compactness, “the degree to which development has been clustered to minimize the amount of land in
each square mile of developable land occupied by residential or nonresidential use.” Whereas continuity
refers to development at the scale of an entire metropolitan area, compactness refers to development at the
neighborhood scale.
The relationship of all development to activity centers is another important dimension of sprawl.
Residential development can be more or less centralized with respect to a central business district, and
can even be repelled from a central location under some circumstances. Galster et al. call this dimension
“centrality,” and add to it a measure of “nuclearity,” the extent to which an urbanized area is
characterized by a mono- or polynuclear pattern of development. Strip or ribbon development (Ewing
1997) is yet another dimension of sprawl that overlaps to an extent with aesthetic dimensions of sprawl
(Torrens and Alberti 2000).
A final set of sprawl dimensions concerns the mix of uses within a neighborhood. Many observers
(Burchell et al. 2001; Ewing 1997; Galster et al. 2000; Torrens and Alberti 2000) stress that exclusively
single-use neighborhoods are one of the most potentially damaging manifestations of sprawl. Such
development hinders pedestrian access to jobs, school, and shopping. If measured at a disaggregated
level—at the level of housing type and tenure, that is, and not simply residential vs. commercial
development—mixed uses should also influence the extent to which households are segregated by income
and race. Parallel to their treatment of residential scattering, Galster et al. (2000) propose measuring the
mixing of uses both at the regional scale (the average distance between all residential and all non-
residential uses) and the neighborhood scale (the mix of housing and employment in the average
neighborhood), but they do not measure these two dimensions as they do the other six they propose.
Beyond the characterization of urban areas as more or less sprawling at one point in time, which
Galster et al. (2000) call the “noun” version of sprawl, many observers are interested in the process of
sprawl, i.e., sprawl “as a verb.” Adding the time dimension to the many spatial dimensions already
discussed provides more richness but adds degrees of complexity and uncertainty to characterization of
urban areas. Peiser (1989) and Breslaw (1990) show the implications of this uncertainty with respect to
fragmentation, which is often characterized as inefficient when considered as a static point. But
fragmentation may also be a reflection of landbanking of intervening areas. The value of these
undeveloped areas should increase in response to its proximity to established development, thereby
encouraging higher-value (and presumably higher-density) development in intervening areas (Peiser
1989).
Initial studies that employ these measures have arrived at some unexpected results. For example, Los
Angeles is almost the archetype for sprawl in many people’s minds; yet by many measures, either of the
Density, Sprawl, Segregation / Pendall Page 12
verb or the noun sort, development in Los Angeles has not sprawled very much at all (Galster et al. 2000;
Pendall 1999). Such northeastern regions as Boston, New York, and Philadelphia, by contrast, conjure up
images of high-density central business districts and miles of tenements, and yet recent urbanization in
these areas has occurred at very low densities (Pendall 1999). New urbanization occurs at higher
population densities where agricultural land productivity is higher, where local governments rely less
heavily on property taxes to fund public services, and where large-lot zoning does not dominate (Pendall
1999).
Although these systematic attempts to quantify sprawl by various metrics are still in their infancy, the
literature testing relationships between sprawl and its unwanted outcomes go back many years; indeed,
the confused and incomplete results of these tests is partly responsible for current efforts to arrive at more
systematic and consistent measures sprawl.
Among the earliest applications of “cost of sprawl” research concerned, more broadly, the impacts of
varying types of development on local budgets. Focus shifted from development type to development
patterns in the 1960s and 1970s, resulting most famously in a landmark report in 1974 (Real Estate
Research Corporation (RERC) 1974). This early study showed that low-density development was much
more costly to local governments than scattered development, but its measurement of sprawl and its
impacts had methodological flaws that limited its utility for metropolitan-level analysis (Windsor 1979).
More recent studies have been more careful, and many report that modest to large savings could result
from a more compact, less scattered, and denser development pattern (Frank 1989; Burchell et al. 2001).
There are some exceptions to this rule. Ladd (1992), for example, reports that metropolitan areas with
higher levels of density have higher per capita expenditures on public services than low-density regions.
Her measure of density, however, is very gross (it measures the number of persons per acre of land across
an entire county).
Another active area of research has shown modest but consistent connections between higher density
and reductions in vehicle miles traveled (VMT); most observers agree that VMT reductions are an
important precondition to reductions in air pollution in most metropolitan areas. Holtzclaw (1994), for
example, found that VMT decreases with density. Handy (1996) also reports on several other studies
showing that people drive less in denser urban areas. These studies do not dispel uncertainty, however,
about the precise causal relationship between lower VMT and higher density; people who prefer not to
make more trips or travel as far may choose denser neighborhoods, or dense neighborhoods may induce
such behavior, or both. There is even less solid evidence that neighborhood design, including the mixing
of uses and rearrangement of street patterns, reduces either the number of trips or VMT (Crane and
Crepeau 1998). Such design responses are commonly proposed in neotraditional or “new urbanist”
planning as alternatives to sprawl (Calthorpe and Fulton 2001; Congress for the New Urbanism 2000).

Density, Sprawl, Segregation / Pendall Page 13
Confusion over causal connections should not, of course, discourage the reduction of regulatory and other
barriers that preclude or discourage the development of neighborhoods with mixes of uses and housing
types, since there is clearly an unmet demand for such neighborhoods.
The academic jury also remains out on the question of how urban form affects the environment on
other dimensions. Extensive reviews suggest that land-use patterns that are less sprawling on a number of
dimensions tend to have lower energy use than more sprawling regions (Anderson, Kanaroglou, and
Miller 1996). Alberti (1999), in a balanced review of how density, mix of uses, connectivity of land uses,
and centralization affect sources, sinks, support systems, and human well-being, finds ample evidence
that high density has many negative effects (e.g., urban heat island, increased flooding) that
counterbalance its acknowledged positive effects on sources (VMT chief among them).
Popular images of urban spread, white flight, and isolated central city ghettoes and barrios naturally
promote the conclusion that sprawl goes hand in hand with increased racial segregation, and thence to the
policy response that cities that sprawl less will have less segregation. In light of the remaining grave
uncertainties in such areas as fiscal impacts, environmental quality, and transportation, it would not be
surprising to find uncertain results from systematic tests of the relationship between sprawl and
segregation. Here there are two analytically distinct questions: first, do minority presence and segregation
trigger sprawl? Second, does sprawl lead to segregation?
There is a very rich literature documenting that whites move away from areas where blacks are
concentrated, whether from cities to suburbs (Marshall 1979; Frey 1979; Thompson 1999; Crowder
2000), between school districts (Jonas 1998; Clotfelter 2001), or out of integrated neighborhoods (Galster
1990). Such white flight often entails moves to suburbs, school districts, or neighborhoods that sprawl on
one or another dimension, but only in that indirect sense do these studies link white flight and sprawl.
Since many dense regions offer a wide array of municipalities, neighborhoods, and school districts, white
residents can theoretically find areas that meet their preferences without contributing to sprawl by moving
to low-density, scattered, or even decentralized development.
Recent attempts to make a direct connection do suggest that regions with higher minority
concentrations lose density faster. Fulton et al. (2001) found that among all U.S. metropolitan areas, those
with higher concentrations of minorities lost density faster between 1982 and 1997 than metropolitan
areas whose residents were mostly white non-Hispanic. Density grew, however, in regions with higher
shares of foreign-born residents (Fulton et al. 2001); this is consistent with Frey and Liaw’s finding
(1998) that disproportionate numbers of whites moved in the early 1990s to non-metropolitan counties
adjacent to metropolitan areas with large immigrant populations.) An earlier analysis (Pendall 1999)
found no significant relationship between percent minority and density change in 159 metropolitan
counties between 1982 and 1992, probably because of the more limited dataset.

Density, Sprawl, Segregation / Pendall Page 14
Segregation (as opposed to high shares of minority residents) might also lead to sprawl rather than, or
in addition to, resulting from sprawl. In slow-growing or declining metropolitan areas with high
segregation, for instance, blacks or Hispanics who want to live in integrated neighborhoods would move
into mostly white or integrated neighborhoods. Some white residents of these neighborhoods would move
to other mostly white neighborhoods or entirely new subdivisions at the urban fringe. This dynamic may
explain Galster’s finding (1991) that black suburbanization has not changed the relative location of the
races. Fulton et al. (2001), however, found no significant relationship between segregation (black-white,
Hispanic-Anglo) in 1990 and density change between 1982 and 1997.
Studies that test whether sprawl leads to segregation are more poorly developed than tests of white
flight. Downs (1999) reported finding no significant relationship between any of a number of measures of
sprawl and social distress; this report of a failure to reject the null hypothesis was immediately greeted as
an exoneration of sprawl by the national news media. More recently, in the reprise of the RERC’s 1974
work, Downs collaborated with a team of researchers on Costs of Sprawl—2000 (Burchell et al. 2001). In
this work, Downs details the many measures of sprawl and central city decline that he used to make the
link he reported two years earlier. Downs found few links between any of his nine sprawl indicators3 and
his measures of central city decline (population change) or distress (a battery of indicators of population
change, crime, poverty and income, education levels, unemployment, and old housing stock) (Burchell et
al. 2001, 397). In the end, Downs does not dismiss the possibility of a link between sprawl and either
decline or distress, but he contends that sprawl is weaker than other forces that lead to both decline and
distress.
Even though Downs conducted hundreds of regression analyses (Downs 1999) and constructed many
indicators of decline and sprawl, his choices of unit of analysis and indicators are still subject to criticism.
His sprawl definitions depend heavily on census-defined urbanized areas (UAs), which do not measure
land use or the conversion of land. Rather, the UA identifies land areas that exceed a population density
of 1,000 persons per square mile. This definition overlooks low-density suburbs, as well as outlying areas
such as airports that may be intensely urbanized but not residential.
Central cities, another unit of analysis that is key to Downs’s measurement (and that in fact is
definitionally necessary for his analysis of “central city decline and distress), vary dramatically across the
U.S. because municipal structure varies so dramatically across the U.S., with sunbelt and western states
typically having more expansive central cities and less fragmented metropolitan areas and Northeast and
Midwest states having very fragmented metropolitan areas in which most cities with all the characteristics
necessary to meet the Census definition of central city are landlocked. Hill et al. (1998) identify at least
two distinct subsets of central cities, one of them healthy and one distressed; they further break these
clusters into five-cluster and 13-cluster descriptions, and find very strong correlations between regional
Density, Sprawl, Segregation / Pendall Page 15
location and central city type. An analysis that uses the central city as a unit of analysis for concentrated
distress will “hide” distressed areas within expansive central cities, while revealing intense distress in
metropolitan areas with fragmented governments. If sprawl (either as a noun or as a verb) correlates in
some way with fragmentation, then any ostensible connection one might find between sprawl and distress
might in fact be simply an artifact of the choice of central city as unit of analysis.
Downs’s indicators of sprawl also raise concerns. Seeking comprehensiveness in his treatment of
sprawl to account for the breadth of definitions of sprawl, he mixes imperfect indicators of land use (those
that rely on the distinction between census-defined urbanized and non-urbanized areas) with indicators
that others would define as either causes (political fragmentation) or outcomes (auto dependence) of
sprawl (Galster et al. 2000). Downs also does not spell out a clear conceptual model that specifies
relationships among variables. In slightly different specifications, for example, he treats concentrated
poverty as a characteristic of sprawl, an outcome of sprawl (as a measure of central city distress), and an
independent force working on central city population decline.
The limitations of Downs’s analysis, and the scarcity of other work that tests relationships between
sprawl and segregation or other aspects of social distress, suggest that many important questions still
remain. Those that motivate the remainder of my analysis are the following. First, do any land use
patterns aggravate the economic segregation many researchers have observed in metropolitan America?
Do any land use patterns associate independently with more intense economic segregation among blacks
or Hispanics? Finally, do land use patterns associate with differences in segregation of blacks or
Hispanics from whites or Anglos?
Data and their limitations Unit of analysis and period of measurement
This analysis uses the Census bureau’s smallest metropolitan-area definition, the metropolitan
statistical area (MSA) or primary metropolitan statistical area (PMSA), as its unit of analysis, and tests
whether aggregate metropolitan indicators of sprawl influence aggregate metropolitan indicators of
segregation, holding other factors constant. The MSA or PMSA is an appropriate unit of analysis for the
study of both sprawl and segregation; it is an area that encompasses both commuting patterns and housing
markets. The county is too small to accommodate most economic activity and housing markets; the
consolidated metropolitan statistical area (CMSA) tends to include numerous economic subregions and
housing markets. Since consistent national land use data are not available below the county level, I use
New England County Metropolitan Areas (NECMAs) instead of the town-based MSAs and PMSAs in the
six New England states. Metropolitan areas change through time. This analysis uses data from 1980,
1982, 1990, and 1992, as discussed in the next two sections. I therefore use 1990 PMSA definitions to
compute all variables.
Density, Sprawl, Segregation / Pendall Page 16
Measuring sprawl/density I use two sources to compute urban density. The first is a national survey that measures the actual use
of land, rather than population density. That survey, the National Resources Inventory, is conducted every
five years by the U.S. Department of Agriculture. The most recent NRI was conducted in 1997 and
released at the county level in spring 2001. This survey estimates the amount of built up and urban land in
every county in the United States in 1982, 1987, 1992, and 1997. The definition of this land is: A Land cover/use category consisting of residential, industrial, commercial, and institutional land; construction sites; public administrative sites; railroad yards; cemeteries; airports; golf courses; sanitary landfills; sewage treatment plants; water control structures and spillways; other land used for such purposes; small parks (less than 10 acres) within urban and built-up areas; and highways, railroads, and other transportation facilities if they are surrounded by urban areas. Also included are tracts of less than 10 acres that do not meet the above definition but are completely surrounded by Urban and built-up land. Two size categories are recognized in the NRI: areas of 0.25 acre to 10 acres, and areas of at least 10 acres (U.S. Department of Agriculture 2000).
The second data source needed to compute urban density is an estimate of the number of households
for each county in the United States. In intercensal years the Census Bureau estimates population at the
county level, but not the number households. I estimated the number of households for 1982 and 1987 by
converting the Bureau’s county-level population estimates to households based on the observed persons
per household and household population in 1980 and 1990. For 1992 and 1997, I interpolated county-
level population from 1990 and 2000 Census results using a geometric function, group-quarters residents
based on the percent of persons in group quarters in 1990, and divided the remnant (household
population) by an estimate of persons per household based on the county’s 1990 rate, its relationship to
the state’s 1990 rate, and the Census Bureau’s estimate of the state’s 1992 and 1997 rate. Having
estimated the number of households in each year, I next computed the estimated density of households
per urbanized acre in 1982 and 1997; second, the percent change in household density between 1982 and
1997.
Measuring segregation by income and race Thus far, most analyses of income segregation have used the national poverty line as a standard, and
have computed segregation indices based on the concentration of families or persons living below the
poverty line. Many analyses have suggested that the national poverty line is too low; a national poverty
line also obscures important regional differences in cost of living, especially in housing costs. No
analyses thus far have used a relative regional standard to estimate the segregation of very low income
households or families: those earning less than 50% of their region’s median income.
Jargowsky (1996; 1997) is an exception to this rule; he computed a neighborhood sorting index (NSI)
as the ratio between the standard deviation of the neighborhood income distribution and the standard
deviation of the regional income distribution. This measure has several advantages over such category-
based measures as dissimilarity or exposure: it does not impose arbitrary cutoff points; it does not discard
Density, Sprawl, Segregation / Pendall Page 17
important data by collapsing continuous data into categories; and it clearly applies only to the income
distribution and not to changes in spatial organization. It also relates all incomes in a region to the
regional mean and standard deviation, rather than to a national standard such as the poverty line. Its main
disadvantage is that it is difficult to compute based on commonly available data (Jargowsky 1996, 989).
There remain some arguments in favor of using categorical data, however. First, for better or worse,
social and housing policy in the United States relies heavily on categories that qualify people for
programs. Identifying where people live who fall into these categories, and the extent to which they are
concentrated, is important. Second, incomes have been becoming more bifurcated nationally: that is, their
distribution is becoming less “normal” and probably more skewed, such that a measure based on standard
deviations may be somewhat less meaningful now than it would have been 25 years ago. Third, and
related, categorical data permit us to identify not only where low-income households live but also where
upper-income households live, and the extent to which they are forming enclaves (which I do not discuss
in this paper).
I used the following process for computing the share of each MSA’s or PMSA’s households or
families earning less than 50% (very low income, or VLI), 50-80% (low income), 80-120% (moderate
income), and more than 120% (above moderate income) of the area’s median income; I used these levels
to maintain rough consistency with many state and federal housing and social programs. First, I
aggregated county-level data on the distribution of family or household income for both 1980 and 1990 to
match 1990 MSA or PMSA boundaries. I used this distribution to compute estimated median family and
household incomes for each MSA or PMSA. Next, I estimated the number of households or families
falling between the respective cutpoints for very low, low, moderate, and above moderate income levels.
When computing the number of black, Hispanic, or white households (families) falling into a particular
income range, I used the metropolitan-level median household (family) income for all races as the point
of reference, meaning that the income range for very low income black households in a region would
equal that for very low income Hispanic and white households. To permit computation of segregation
indices, I used the same metropolitan medians to compute the number of households or families falling
into each income range in each tract.
The 1980 Census has two main data limitations for analysis of metropolitan-level segregation by
income: data suppression and untracted outlying counties. The 1980 Census suppressed data at the census
tract level for families under two circumstances. First, it practiced primary suppression when a tract had
fewer than 10 families of a given race or ethnicity. To preclude the use of totals to compute the primary-
suppressed data, the Bureau also practiced secondary suppression: in any tract where primary suppression
occurred, the Bureau suppressed data for the second-smallest racial or ethnic group. Rather than
excluding entirely all the tracts for which there was data suppression, I treated them as zero values. This

Density, Sprawl, Segregation / Pendall Page 18
would tend to overstate segregation somewhat, since such tracts would be treated as being less diverse
than they were in reality. For this analysis, I excluded all metropolitan areas in which data for more than
one-third of families or households were suppressed.4
Thirty-five counties that achieved metropolitan status during the 1990s were not tracted in 1980.
Sixteen PMSAs or MSAs were affected. If segregation between particular subgroups was more severe in
untracted counties than in tracted counties, then the metropolitan area indices I report would understate
segregation; if segregation between particular subgroups was less severe in untracted counties than in
tracted counties, then the metropolitan area indices I report would overstate segregation. These counties
constitute a small enough population, however, not to affect the overall totals substantially.
A final limitation is that the most readily available source of data for a national study on segregation
by income, Summary Tape File 3 (STF3), does not provide consistent units of analysis by race in 1980
and 1990. In both 1980 and 1990, STF3 provides data for all families and households, facilitating
comparisons of the two years. STF3 for 1980 reports income for families, but not households, by race;
STF3 for 1990, by contrast, reports income for households, not families, by race. Most analysts turn to
Summary Tape File 4 (STF4) to resolve this problem. I was unable to obtain STF4 for this research,
however.5 The results reported here must therefore be treated as preliminary and suggestive, especially
where I compare 1980 and 1990 results by race.
Because of both the remaining advantages of categorical data and the limitations of data, I proceeded
by computing indices of dissimilarity at the census tract level for 1980 and 1990 for very low income
(VLI) vs. non-VLI families and households; for white, black, and Hispanic VLI vs. non-VLI families
(1980) and households (1990); and for VLI and non-VLI black and Hispanic households vs. all White
households (Table 2). I also computed isolation indices for each group (e.g., the percent of households
who earn less than 50% of the area median income in the average very low income household’s
neighborhood) in 1980 and 1990, but do not report these indices extensively here.
(TABLE 2 ABOUT HERE)
Sprawl The U.S. is definitely sprawling, at least by measures of land consumption and density, according to
the USDA’s National Resources Inventory. In 1982, there were 51.7 million acres of urbanized land in
the United States outside Alaska. Between 1982 and 1992, 13.4 million new acres of land were urbanized,
a 26% increase in just 10 years. Meanwhile, the national population grew by only 10%. As a
consequence, the population density of urbanized land dropped from 4.46 to 3.89 persons per urbanized
acre, a 12.7% decline in density. In metropolitan areas between 1982 and 1992, the population grew about
12% and the number of households by 16%, while the amount of urbanized land grew 24%. Population

Density, Sprawl, Segregation / Pendall Page 19
density fell 9.5%, from 5.0 to 4.5 persons per urbanized acre, while household density declined by a more
modest 6.3%, from 1.8 to 1.7 households per urbanized acre.
Sprawl has several different facets and many effects that relate to both household growth rates and
land consumption. A region that is consuming substantial new land but adding few new households
differs from one consuming the same amount of new land but adding huge numbers of new households.
For that reason, I constructed two additional variables, “sprawly growth” and “dense growth.” Sprawly
growth is the average of the standardized household growth rate between 1980 and 1990 (i.e., the rate
converted to a z-score), and the standardized rate of density decline between 1982 and 1992. Dense
growth, by contrast, uses the same standardized household growth rate but averages it with the
standardized rate of density increase—i.e., density decline times –1—between 1982 and 1992. Because
these measures both rely on z-scores, their range runs from approximately –3 to +3. The measures differ
entirely from one another; their bivariate Pearson’s R coefficient is 0.000.
Economic segregation My calculations confirm the growing disparity between the rich and poor found by other researchers
(Morris, Bernhardt, and Handcock 1994), though the trend is more marked for families than for
households. In the average metropolitan area in 1980, 37.8% of families earned more than 120% of their
area’s median family income; by 1990, this had grown to 38.7% of families. The share of very low
income families—those earning less than half their area’s median family income—also grew, from 18.9%
to 19.6% of families on average. This average increase in the shares of both rich and poor families also
held true at the 25th, 50th, and 75th percentile metropolitan areas. The average share of moderate income
families and households (those earning between 80% and 120% of their area’s median income) fell by 1.6
and 0.6 percentage points, respectively. (These results are statistically significant at p<0.001 except for
families and households earning between 50% and 80% of area median.) Hence most metropolitan areas
had greater shares of very low income households and families in 1990 than in 1980.
The rise in inequality in the 1980s may be partly a product of shifting racial composition, though the
lack of race-specific household income data for 1980 hinders direct comparison with 1990. In 1980,
18.3% of the white families in metropolitan areas earned less than 50% of their area’s median income for
families of all races; in 1990, 21.3% of white households in metropolitan areas earned less than 50% of
their area’s median household income (Figure 1). The share of Blacks and Hispanics earning very low
incomes fell in the 1980s, more so for Hispanics than for Blacks, over 40% of whom still earned less than
half their area’s median income in 1990. (The change in the share of blacks earning less than half their
region’s median income may have been statistically insignificant, since income data are based on a
sample of households.) Meanwhile, the share of all three groups earning more than 120% of the AMI

Density, Sprawl, Segregation / Pendall Page 20
grew, and the share earning incomes between 50% and 120% of the AMI fell for all three groups—by
over 7 percentage points for whites and about 4 points each for Blacks and Hispanics.
(FIGURE 1 ABOUT HERE)
The poorest households and families in U.S. metropolitan areas also grew more segregated from
wealthier households and families in the 1980s (Table 3). The unweighted mean dissimilarity index for
households rose from 25.3 to 26.7. On average across U.S. metropolitan areas in 1980, the average very
low income household lived in a neighborhood in which 29.2% of residents also earned very low incomes
in 1980, although VLI households constituted 23.2% of all households on average. By 1990, this gap had
widened as the average isolation index grew to 30.2 while the mean percent very low income remained at
23.4%. Segregation of very low income families from other families grew more rapidly than did
segregation of very low income households. Across the distribution from minimum, through the 25th
percentile, median, 75th percentile, and maximum, both of these indices also rose uniformly for
households and families, except the minimum isolation of very low income households. (The minimum
percent very low income households also dropped.) This finding is consistent with Jargowsky’s (1996)
findings, using a different index, that poor and rich households became more segregated in the 1980s.
(TABLE 3 ABOUT HERE)
Did sprawl influence economic segregation in the 1980s? I have found no studies that have directly tested links between any manifestation of sprawl and
income segregation, and therefore am developing hypotheses in relatively uncharted waters. In regions
that are losing density rapidly, wealthy households may have more opportunities to find housing in
remote locations, causing income segregation to increase. But regions that are gaining density may also
exhibit increased segregation; density-driven competition over land could result in higher land and
housing prices in select neighborhoods and displacement of low-income households to a more limited
geographic area. If these two tendencies both exist, they may cancel one another’s effects, such that we
observe no average effect on the segregation index.
Household growth may also influence income segregation, but the precise relationship is again
difficult to predict in advance. Regions that grow fast exhibit all kinds of rapid change; since national
change has been in the direction of more polarized relations between rich and poor, income segregation
may become more pronounced in fast-growth regions. On the other hand, fast-growth regions may also
have more housing opportunities for people of all income groups. These opportunities will depend
crucially, however, on the spatial manifestation of growth—its density, among other characteristics.
Density change can be a function of changes in either of two variables: population change and
urbanized land change. Urbanized land change is partly, though not entirely, a function of population
change (Fulton et al. 2001). To guard against collinearity, I test two different models here and in

Density, Sprawl, Segregation / Pendall Page 21
subsequent regressions. The first model includes percent change in households (1980-90) and percent
change in density (1982-92); these two variables are mildly and positively correlated (Pearson’s
R=0.303). The second model includes the two composite variables I described above, sprawly growth and
dense growth. Both of these are highly correlated with both household growth and percent change in
density, but they are not correlated with one another. I have no a priori hypotheses about the direction of
relationship between any of these variables and income segregation, because of the countervailing
tendencies I have already described.
The additional variables whose relationship with income segregation I test (Table 4) include measures
of metropolitan income structure; demographics; income composition by race; and manufacturing shifts.
Segregation of very low income families and households in U.S. metropolitan areas is a long-standing
pattern that has developed over many generations. I acknowledge this by holding the 1980 index constant
before testing the variation across metropolitan areas in 1990. Consistent with common practice in studies
using indices of segregation with limited ranges (Jargowsky 1996; Massey and Denton 1988), I use the
logit transformation to convert the D indices to continuous variables with theoretically infinite range.6
This transformation makes the dependent variable more appropriate for OLS regression, but hinders
interpretation somewhat.
(TABLE 4 ABOUT HERE)
Results Table 5 reports the means and standard deviations for all the variables in the analysis of household
and family income segregation. Simple correlations between the two sprawl/density measures and
economic segregation (Table 6) reveal that dense metropolitan areas had significantly more economic
segregation for both households and families in 1990, with simple correlations of 0.23 and 0.14 for
families and households respectively (p=0.000, p=0.013). This is our first sign, then, that low density may
associate with more neighborhood-level integration. Change in density did not correlate significantly with
either family or household income segregation.
(TABLE 5 ABOUT HERE)
(TABLE 6 ABOUT HERE)
In multivariate context, all four income regressions identified correlations between higher density and
higher economic segregation (Table 7). The first household model, which included separate variables for
sprawly growth and dense growth, indicates that rapid dense growth associates with growing household
income segregation. The second model also finds significant associations between density increase and
increase in income-based segregation, but no significant association between household growth and
changes in income-based segregation. The family income regressions found significantly higher income
segregation in regions with higher density in 1982; density increase between 1982 and 1992 also

Density, Sprawl, Segregation / Pendall Page 22
associated with significantly more income segregation among families. In this case, therefore, I find some
support for the contention that the kind of growth that has typified Las Vegas and Phoenix in recent years
has led to more intense competition for urban space and the consignment of low-income households to
more limited numbers of neighborhoods.
(TABLE 7 ABOUT HERE)
Rapid sprawl does not appear to exacerbate income segregation, but neither does it consistently
reduce segregation. The policy implications of these joint findings are important. Although rapid dense
development may have negative effects on income segregation, it can have positive effects on fiscal
balance and environmental quality. Rapid sprawling development, by contrast, has no positive effects on
income segregation, but it has serious negative effects on many other important regional systems. Rather
than avoid compact growth, therefore, these findings suggest that regions will need to work harder at
mitigating its tendency to isolate and possibly displace low-income households.
Among the other variables, those concerning income structure and demographic composition were
consistently associated with variation in segregation levels across metropolitan areas. Families became
more economically segregated in regions whose share of very low income families grew rapidly in the
1980s. Very low income families were also more segregated in regions with high median family incomes
in 1989. Regions with higher shares of elderly residents in 1990 had lower economic segregation, all else
being equal. At marginal significance levels, regions in which higher shares of very low income
households were headed by a black person had significantly higher household and family income
segregation than regions where more VLI households were headed by non-blacks. But regions in which
Hispanic households accounted for high shares of all VLI households had less household income
segregation in 1990 than those with low Hispanic shares. I find support for the contention that
deindustrialization associates with income segregation, at least for households; regions whose share of
manufacturing jobs slipped more rapidly between 1982 and 1992 had higher household income
segregation in 1990.
Sprawl and the Economic and Racial Segregation of Blacks7 I have already shown that the black population became more divided by income in the 1980s, with
practically no change in the share of black households earning less than half their region’s median income
but some growth in the share earning over 120% of the area median income (Figure 1). Very low income
blacks also became more spatially segregated from non-VLI blacks in the 1980s, following the more
general trend among households and families of all races. The mean dissimilarity between very low
income and other blacks grew from 29.4 (families) to 32.9 (households) between 1980 and 1990; because
families are more segregated by income than other households, we can infer that the growth in
segregation for families exceeded this comparison between families and households.

Density, Sprawl, Segregation / Pendall Page 23
Segregation between blacks and whites, by comparison, declined dramatically over the 1980s. The
mean dissimilarity between VLI blacks and all whites fell from 75.3 (families) to 67.1 (households), and
that between blacks earning more than 50% of the area median income and all whites fell from 67.4
(families) to 55.0 (households). Even with this decline in segregation, however, the mean segregation
levels remain extremely high; mean dissimilarity between non-poor black households and all white
households in 1990 was twice that between poor and non-poor white households. Hence race may have
declining significance, as Wilson (1978) contends, but race is still at least as powerful as class for
predicting the level of segregation a household will experience (Massey and Fischer 1999).
In explaining the levels of segregation among black households and between blacks and whites, I
tested a similar set of independent variables against the logit transformed dissimilarity indices in 1990,
once again including the lagged D index from 1980 to control for the complex conditions that led to
varying levels of segregation up to 1980 (Tables 8a and 8b; see Table 9 for means and standard deviations
of all these variables). I constructed models for three dependent variables: dissimilarity between VLI and
non-VLI blacks; dissimilarity between VLI blacks and all whites; and dissimilarity between non-VLI
blacks and all whites.
(TABLE 8A ABOUT HERE)
(TABLE 8B ABOUT HERE)
(TABLE 9 ABOUT HERE)
Economic segregation of black households, 1990 Table 6 (above) showed that, in bivariate context, there was no significant correlation in 1990
between density or density change and the economic dissimilarity of very low income from non-VLI
black households. The multivariate analysis, conducted for 271 metropolitan areas in which adequate
tract-level data on blacks’ income levels were available for 1980, confirms this lack of significance (Table
10). But regions with high levels of economic segregation among all households also had high levels of
segregation among black households, permitting the conclusion that there is an indirect relationship
between increased density and higher economic segregation of blacks.
(TABLE 10 ABOUT HERE)
After controlling for economic segregation among blacks in 1980, which was of course highly
significant, several demographic variables helped explain regional differences in segregation between rich
and poor blacks; the adjusted r-square for this equation was about 0.59. As expected, regions with higher
proportions of black residents had less economic segregation among blacks. Very low income blacks
were also less segregated from other blacks in metropolitan areas in which blacks were relatively highly

Density, Sprawl, Segregation / Pendall Page 24
concentrated in the VLI bracket, but where blacks’ share of VLI households grew in the 1980s, they were
more economically segregated from one another in 1990.
Perhaps surprisingly, manufacturing change did not have a statistically significant relationship with
economic segregation among blacks. But like sprawl, manufacturing decline indirectly promotes
economic segregation among blacks by intensifying overall economic segregation.
Black-white segregation by income Segregation between blacks and whites, regardless of blacks’ income, was higher in 1990 in denser
regions, and segregation of very low income blacks from whites was higher in regions where density
grew between 1982 and 1992 (Table 6). But in multivariate context, this relationship disappeared (Table
11). Growth in households between 1980 and 1990—one component of density change—associated with
reduced segregation of very low income blacks from whites, but none of the measures gauging the pattern
of growth had a significant relationship with segregation.
Segregation of blacks from whites correlates more consistently with economic segregation among
black households, but economic segregation has diametrically opposite effects for poor and non-poor
blacks. Regions with high residential dissimilarity in 1990 between very low income and other blacks
also had high dissimilarity between VLI blacks and all whites. In this third step from regional density, we
can make another tentative connection from increasing density, to more economic segregation overall, to
more economic segregation among black households, to more segregation of poor blacks from all whites.
But non-very low income blacks were more integrated with whites in regions in which blacks were more
economically segregated from one another, perhaps as a result of the process of middle-class black flight
to mixed-race suburbs (Wilson 1987).
Many of the other demographic and income factors influenced segregation of both VLI and non-VLI
blacks from whites, after holding constant 1980 dissimilarity indices. Black-white segregation was higher
in 1990 in regions with higher median income; where blacks constituted higher shares of black residents;
and where blacks constituted disproportionate shares of very low income households. Regions with strong
population growth among blacks in the 1980s had lower black-white segregation in 1990. Segregation of
non-VLI blacks from whites was lower in regions in which larger proportions of the black population was
over age 65. Regions in which a high proportion of whites were elderly, however, were more segregated
for blacks in 1990; this effect was stronger for very low income blacks but still present for non-VLI
blacks (assuming a one-tailed t-test at p<0.10). Non-VLI blacks were also more segregated from whites in
regions with high proportions of Hispanic residents in 1990, and at marginal significance level in regions
in which Hispanics constituted high proportions of very low income households. Black-white segregation

Density, Sprawl, Segregation / Pendall Page 25
intensified in regions that shifted more rapidly away from manufacturing in the 1980s (at low levels of
significance for non-very low income blacks).
The models of poor black-all white dissimilarity provided good explanatory power, with adjusted r-
squares of 0.79 and 0.78 for VLI and non-VLI households, respectively. This explanatory power is
largely a consequence of having held dissimilarity constant in 1980.
Sprawl and the Economic and Racial Segregation of Hispanics8 Across the 254 metropolitan areas included in this part of the analysis, the mean level of segregation
between non-poor and poor Hispanic households in 1990 was slightly lower than the segregation of non-
poor and poor Hispanic families in 1980. At first glance, this result may appear at odds with findings by
Jargowsky (1996). But economic segregation among households is lower generally than among families;
it is likely that household segregation between non-poor and poor Hispanic households rose in the 1980s.
The analysis of Hispanic to white non-Hispanic dissimilarity I report here differs from the other analyses;
it compares the distribution of Hispanic-headed households with the distribution of the entire non-
Hispanic white population, which I refer to as the Anglo population here.9 Like black-white segregation,
Hispanic-Anglo segregation dropped for both poor and non-poor Hispanics, very substantially for non-
poor Hispanics.
To explain the variation of segregation across regions, I use the same independent variables as in the
models testing Black segregation (substituting Hispanic for Black where appropriate, e.g., in the percent
of persons over age 65). I add two variables on immigration to the mix in this analysis, however: the
percent of persons in 1990 who were born outside the U.S., and the percent of these foreign-born persons
who had arrived in the previous 10 years. Regions with high percentages of foreign-born residents may
have higher levels of enclave settlements than those where more residents are native-born; I expect this
effect to be even stronger where foreign-born residents arrived recently.
Economic Segregation of Hispanics After holding constant the dissimilarity of poor from non-poor Hispanic families in 1980, none of the
density/sprawl indicators had a significant relationship with segregation at better than a 90 percent
confidence level. As in the case of economic segregation of Blacks, economic segregation of Hispanics
was more pronounced in regions where economic segregation of all households was higher (at p=0.09).
Density therefore contributed indirectly to heightened economic segregation among Hispanics households
in the 1980s, though these effects are small and marginally significant.
Other aspects of population growth and demography contributed more strongly to variation in
economic segregation among Hispanics in 1990. Regions in which the Hispanic population grew fast in

Density, Sprawl, Segregation / Pendall Page 26
the 1980s were markedly less segregated by income for Hispanic households by 1990. Regions where
Hispanics accounted for disproportionately high shares of the very low income population also had lower
levels of economic segregation among Hispanic households. But economic segregation was higher in
regions where Hispanics’ share of VLI households grew rapidly between 1980 and 1990 than in regions
where the Hispanic share of VLI households held constant or declined.
Regions where the share of jobs in manufacturing slipped less rapidly in the 1980s had less economic
segregation in 1990. This finding again lends support to the contention that deindustrialization
exacerbates segregation. Regions with high shares of foreign-born residents had less economic
segregation among Hispanics in 1990 than regions with few foreign-born residents; this pattern may
indicate the presence of mixed-income Hispanic enclaves in regions with strong immigrant presence. The
percent of the foreign born who entered recently had no significant effect on economic segregation,
however.
Segregation of Hispanics from Anglos Density and sprawl had no significant direct effect on the segregation of either very low income or
non-VLI Hispanics from Anglos in 1990, regardless of the measure used. But density may, again, have
indirectly increased segregation of very low income Hispanics, who were more segregated from Anglos
in regions with higher economic segregation among either Hispanic households or all households. Intra-
race economic segregation did not, however, associate with significantly lower racial segregation between
non-VLI Hispanics and Anglos, as it did between blacks and whites; in fact, the signs on the coefficients
are positive, but significant at only about p=0.18 in a two-tailed test. Segregation of VLI Hispanics from
Anglos was also higher in regions with higher median family income.
The growth of the Hispanic population in the 1980s and the ultimate percent of the population who
were Hispanic in 1990 had strong, but opposite, effects on segregation. Hispanics were less segregated
from Anglos in regions where the Hispanic population grew rapidly, but more so in regions where
Hispanics constituted large shares of the population. These effects were most significant for very low
income Hispanics and marginally so for non-VLI Hispanics. Segregation of Hispanics of all income
levels from Anglos was also higher in regions in which Hispanics were highly concentrated among VLI
households. In fact, excessive concentration of VLI Hispanics had a more serious segregative effect for
non-VLI Hispanics than for VLI Hispanics.
Segregation of Hispanic households from Anglos was also lower in regions with rapidly growing
Black population was growing more rapidly, all else being equal. Non-VLI Hispanics were more
segregated from Anglos in 1990 in regions with higher concentrations of Black residents. This may be
because Hispanics in regions with high concentrations of Black residents commonly include many dark-

Density, Sprawl, Segregation / Pendall Page 27
skinned Puerto Ricans and Dominicans (Denton and Massey 1989; Santiago and Galster 1995; Freeman
1999).
Elderly residents had similar effects on Hispanic segregation from Anglos as they did on Black
segregation from Whites. Segregation between Hispanics and Anglos was lower in regions in which
seniors composed relatively high shares of the Hispanic population. But where seniors composed
relatively high shares of the White population, segregation between Hispanics and Anglos was higher in
1990. These effects were all more pronounced for very low income Hispanics than for other Hispanics.
Non-VLI Hispanics were more segregated from Anglos in regions with larger immigrant populations
than in mostly non-immigrant metropolitan areas (percent foreign-born had no effect for segregation of
VLI Hispanics from Anglos). This finding is consistent with the finding of lower economic segregation
among Hispanics in regions with high concentrations of foreign-born residents, and with the inference
that Hispanics form mixed-income enclaves in regions with more immigrants.
Economic segregation of Whites
The final set of regressions concerns the segregation of very low income whites from non-VLI
whites. Poor whites are much less segregated in from other whites than are poor blacks or Hispanics from
other households of their race or ethnicity and much more so than are blacks or Hispanics from whites or
Anglos. For white households, economic segregation as measured by the D index was 24.3 at the median
and 36.5 at the maximum, compared with 32.3 and 100.0 for black economic segregation and 41.5 and
95.7 for Hispanic economic segregation. Household-level economic segregation of whites in 1990 was
higher throughout the distribution than was family-level segregation in 1980; since family segregation
levels exceed those of households, we can infer that the segregation of very low income from non-VLI
white families levels also increased in the 1980s.
Analysis of the variation in white economic segregation was less revealing than most other analyses.
In this case, I excluded the overall level of economic segregation in the white economic segregation
model because whites were in the majority in most metropolitan areas in 1990. To explain white
segregation in 1990 as a function of all economic segregation would be tautological. The other variables
are consistent with those used in the analysis of economic segregation among black households; means
and standard deviations are reported in Table 15.

Density, Sprawl, Segregation / Pendall Page 28
(TABLE 15 ABOUT HERE)
Very low income whites became significantly more segregated from non-VLI whites in metropolitan
areas that grew densely in the 1980s (model 1, Table 16). When combined as the “dense growth” variable,
density and growth had a strongly significant direct relationship with economic segregation among whites
in 1990. In the second model, increased density had a significant effect on economic segregation, while
household growth was not significant. Sprawly growth had no significant effect on economic segregation
when compared to dense decline, however. These results are thus broadly consistent with those reported
for all households (Table 7).
(TABLE 16 ABOUT HERE)
Only one other variable other than the economic segregation of whites in 1980 had a significant
relationship with economic segregation in 1990. Regions in which the elderly constituted higher shares of
white residents in 1990 were significantly less economically segregated than those with low shares of
elderly.
Summing up: Density and segregation Some advocates of compact development have tended to presume that high-density development will
inevitably lead to more mixed-income neighborhoods, with more housing types of all kinds interspersed,
thereby accommodating people of all races and ethnicities. But they also acknowledge that high-density
development can also lead to gentrification. The reality of development in U.S. metropolitan areas is such
that, at least based on these findings, dense growth is more likely to produce gentrification than mixing of
households by income and race.
Figure 2 summarizes my findings in one illustration, and illustrates the hypothesis that there a chain
reaction leading from dense growth, to economic segregation of all households, to economic segregation
of Black and Hispanic households, to racial segregation of very low income Black and Hispanic
households from whites or Anglos. In addition, dense growth has a direct and highly significant
relationship with the economic segregation of white households. Economic segregation also has a direct
relationship with segregation of very low income Hispanics from Anglos, even after economic
segregation among Hispanic households is held constant. The sole effect in the chain that can be thought
of as remotely positive is that as Black households become more segregated, non-poor Black households
become more integrated with Whites; I did not find an equivalent effect for Hispanic households.

Density, Sprawl, Segregation / Pendall Page 29
(FIGURE 2 ABOUT HERE)
High density is both a cause and a consequence of high land values. Poor people and people of color
tend to lose bidding wars over urban space; such bidding wars intensify in regions where density is
increasing. As a consequence, poor people and people of color are often relegated to a limited number of
low-quality neighborhoods that combine very high population density with low quality of life. Falling
density, on the other hand, means that fewer people are bidding for every urban acre. Less competition
may make it easier for low-income households and people of color to maintain a place in mixed
neighborhoods, and even more so poor people of color.
In addition, regions that have been growing densely have not always had—perhaps do not usually
have—mixed-income neighborhoods. New developments typically do not mix incomes without mixing
housing types, and few developments mix housing types, regardless of the density of the region where
they are built. New neighborhoods in Los Angeles, Phoenix, and Las Vegas do not usually have a mix of
housing types; rather, they comprise either a sea of large single family homes on small lots or massive
two- to three-story apartment complexes surrounded by seas of parking.
A combination of local zoning laws, banking practices, and builder characteristics contribute to this
spatial fragmentation of dwelling types. Local governments designate most residential areas exclusively
for single family housing, and even high-density regions have vast areas zoned exclusively for single-
family dwellings at densities not to exceed eight units per acre (Pendall 1995). Although mixed housing
types are often permitted in multi-family zones, in most markets one housing type is usually clearly more
profitable than another, especially over a short period of time; furthermore, most builders do not have
expertise in both single and multi-family development. Developments with more than one unit type tend
therefore to be larger, and built over longer periods of time, than the average housing development. Since
so few new developments consist of mixed unit types, bankers are also wary of lending on them even
when builders do propose them.
Where mixed-use neighborhoods with many housing types do arise, they have in recent years become
more fashionable. Such neighborhoods can command a high premium, in part because they are so rare in
the United States; those that are affordable for many residents can be threatened with gentrification,
especially in regions where housing prices are generally high. The combination of land scarcity and the
high amenity in some denser neighborhoods density lead to higher rents and property taxes, and to
substantial displacement over the course of a decade (the time period evaluated in this study). Many
advocates for smart growth already acknowledge that compact growth can lead to gentrification;
PolicyLink, an organization based in the San Francisco Bay Area, has even developed an anti-
gentrification toolkit to help avoid this unwanted side effect of compact growth (PolicyLink 2001). Local
governments can adopt programs ranging from inclusionary zoning, to redevelopment set-asides for

Density, Sprawl, Segregation / Pendall Page 30
affordable housing, to community land trusts, to real estate transfer taxes that plow some of the windfall
profits of speculation back into the community. But implementation of these measures to guarantee stable
racial and economic integration have lagged far behind recognition of the problem.
Portland, Oregon, offers a telling example of the conflicts between density and affordability.
Metropolitan Portland is renowned for its urban growth boundary; the region also has been subject for
over 20 years to the Metropolitan Housing Rule, which requires that at least half of each jurisdiction’s
zoned residential development capacity must be multi-family and that all its jurisdictions’ zoning
ordinance meet minimum density targets of 6, 8, or 10 dwellings per acre (Abbott 1997). For at least a
decade, these rules helped boost the density of both single family and apartment developments, improving
housing supply and reducing upward pressure on prices. Housing affordability has deteriorated in the
1990s, however, as the regional economy has improved and land has become scarce. Now the regional
government is struggling to identify politically feasible measures to promote long-term housing
affordability, but real estate interests have foreclosed several important options by working with
conservative state legislators to pass legislation prohibiting inclusionary zoning and real estate transfer
taxes (Martin 2001).
Low-density growth is also partially a consequence of subsidies to development. Such subsidies from
local, state, and federal government may be especially helpful to low-income households and people of
color because they reduce the cost of housing in newly developing areas. But when the main source of
development subsidy is the local property tax, the consequences for low-income households in sprawling
areas may be dire over the medium to long term. Newcomers to moderately priced suburban areas,
subsidized by those who came before, will place new demands on local services, especially schools. To
accommodate those new demands, taxes will have to rise, threatening property values (because areas with
higher taxes face lower rates of price escalation) and financial stability (because of rising property taxes)
for newcomers and established residents alike.
As the literature review makes very clear, density is only one aspect of sprawl. Another dimension of
sprawl, lack of land-use mix, may have a much stronger direct relationship with levels of segregation than
does density. Future research is needed to test whether regions with mixed land uses and neighborhoods
with varying housing types have less economic segregation than those with less mixing of use and
housing type. Scatteration of development may also influence economic segregation; two metropolitan
areas with equal density but different degrees of residential clustering may differ in their economic
segregation.
Another reason for the connection between economic segregation and density may have to do with
the unit of analysis I use here. Local census area coordinating committees logically place vast uniform
developments into individual census tracts, because they are usually separated by fast-moving roads and

Density, Sprawl, Segregation / Pendall Page 31
have very different populations in them. Their size and density, furthermore, make such developments
populous enough to constitute entire census tracts; the Census Bureau aims for populations of about 3000
when tracts are first defined. Low density may allow whites and minorities, or low and upper income
households, to share tracts more comfortably. A high-density region will have small census tracts, given
that tract boundaries are drawn partly on the basis of population. Arguably, people are more likely to
encounter one another on the street and on their “daily rounds” in small, dense neighborhoods than in
large, sprawling ones. When people have preferences for living near others of their class or race, they may
avoid mixed neighborhoods—not to mention neighborhoods composed mostly of people unlike
themselves—when they notice differences so immediately. If economic and racial segregation were
measured not on the basis of census tracts but rather on the basis of uniform grid cells, densely populated
cells would likely look more integrated than thinly populated cells. Such units might, of course, depart
even more from the idea of “neighborhood” than census tracts already do.
It seems plausible that the connection between dense growth and economic segregation is more than a
statistical artifact, however, and policy reform should take this research as a caution. Many worthy urban
development goals—saving open space, promoting mass transit use, and economizing on infrastructure—
require higher densities. Land-use and infrastructure policy reforms will consequently focus on ways to
intensify land use in established areas and newly developing sites alike. My findings suggest that as
policy makers pursue these important goals, they should build housing affordability and mixed housing
types into their plans from the outset, rather than assume that income mixing will be a logical result of
higher densities.
Notes
1 In this context, I use the term black instead of African-American because blacks of many different ethnicities are
segregated from whites.
2 The proliferation of articles on concentrated poverty has become something of a debate between two camps: the
Massey camp and the Wilson camp. The Massey camp tends to stress racial segregation as a primary cause of
concentrated poverty (i.e., poor people are concentrated because they are black and because black people in the
United States are intensely segregated). Wilson (and Jargowsky to an extent) tend to emphasize shifting intra-race
class structure has allowed upper-income blacks to move out of ghettoes, and that concentrated poverty is largely a
consequence of this shift. Krivo et al. (1998) and (Cooke 1999) stress that these explanations are not mutually
exclusive; Cooke shows that concentrated poverty has different compositional aspects in different parts of the

Density, Sprawl, Segregation / Pendall Page 32
United States.
3 The nine indicators are the urbanized area’s total land area; the population density of the urbanized area outside its
central city or cities; the ratio of the central city’s population density to the density of the urbanized fringe; the
percentage of the metropolitan area’s total population living outside the boundaries of the urbanized areas around
the metropolitan area’s center; the percentage of the metropolitan area’s population living within its central city or
cities; the percentage of commuters within the urbanized area who commute by driving alone; the percent who
commute in car pools; the number of separate local jurisdictions controlling land use per 100,000 metropolitan-area
residents; and the ratio of the percentage of central-city residents who are poor to the percentage of suburban
residents who are poor.
4 For an alternative approach, see Jargowsky 1997, Appendix A. Contact the author for a listing of the percentage of
each metropolitan area’s families (by race) and households that were suppressed at the county level in 1980.
5 The cost of obtaining STF4 for all states is approximately $18,000.
6 The log-odds transformation for the D index, for example, is computed as ln(D/(1-D)).
7 Family income data were available for at least one-third of black families in 1980 in 272 of the 320 metropolitan
areas in this analysis. The statistics reported here refer only to these 272 metropolitan areas.
8 Family income data were available for at least one-third of black families in 1980 in 254 of the 320 metropolitan
areas in this analysis. The statistics reported here refer only to these 254 metropolitan areas.
9 Although unorthodox, there is no good mathematical reason to reject this approach, which I took owing to the
absence of data in STF3A, either in 1980 or in 1990, indicating household income levels by Hispanic origin by race.
An index comparing white to Hispanic households in either year would inevitably have been comparing Hispanic
residential distribution to a white distribution that included some Hispanics.
References Abbott, Carl. 1997. The Portland region: Where city and suburbs talk to each other—and often
agree. Housing Policy Debate 8 (1):11-52.a
Abramson, Alan J., Mitchell S. Tobin, and Matthew R. VanderGoot. 1995. The changing
geography of metropolitan opportunity: The segregation of the poor in U.S. metropolitan
areas, 1970-1990. Housing Policy Debate 6 (1):45-72.

Density, Sprawl, Segregation / Pendall Page 33
Alberti, Marina. 1999. Urban patterns and environmental performance: What do we know?
Journal of Planning Education and Research 19 (2):151-163.
Anas, Alex, Richard Arnott, and Kenneth Small. 1998. Urban spatial structure. Journal of
Economic Literature 36:1426-1464.
Anderson, William P., Pavlos S. Kanaroglou, and Eric J. Miller. 1996. Urban form, energy, and
the environment: A review of issues, evidence, and policy. Urban Studies 33 (1):7-35.
Bae, Chang-Hee Christine. 1998. Korea’s greenbelts: Impacts and options for change. Pacific
Rim Law & Policy Journal 7:479-502.
Belsie, Laurent. 2001. Ethnic diversity grows, but not integration. Christian Science Monitor, 3-
14-2001.
Betancur, John J. 1996. The settlement experience of Latinos in Chicago: Segregation,
speculation, and the ecology model. Social Forces 74 (4):1299-1324.
Bickford, Adam, and Douglas S. Massey. 1991. Segregation and the second ghetto: Racial and
ethnic segregation in American public housing, 1977. Social Forces 69 (4):1011-1036.
Breslaw, Jon A. 1990. Density and Urban Sprawl: Comment. Land Economics 66:464-468.
Burchell, Robert W., George Lowenstein, William R. Dolphin, Catherine C. Galley, Anthony
Downs, Samuel Seskin, and Terry Moore. 2001. Costs of Sprawl—2000. Washington,
DC: National Academy Press.
Calthorpe, Peter, and William Fulton. 2001. The Regional City: Planning for the End of Sprawl.
Washington, DC: Island Press.
Camarillo, Albert. 1984. Chicanos in California: A History of Mexican Americans in California.
San Francisco: Boyd and Fraser Publishing Company.
Charles, Camille Zubrinsky. 2000. Neighborhood racial-composition preferences: Evidence from
a multiethnic metropolis. Social Problems 47 (3):379-407.
Clark, William A.V. 1986. Residential segregation in American cities: A review and
interpretation. Population Research and Policy Review 5:95-127.
Clotfelter, Charles T. 2001. Are whites still fleeing? Racial patterns and enrollment shifts in
urban public schools, 1987-1996. Journal of Policy Analysis and Management 20
(2):199-221.
Cloud, Cathy, and George Galster. 1993. What do we know about racial discrimination in
mortgage markets? Review of Black Political Economy 22 (1):101-120.

Density, Sprawl, Segregation / Pendall Page 34
Congress for the New Urbanism. 2000. Charter of the New Urbanism. New York: McGraw-Hill.
Cooke, Thomas J. 1999. Geographic context and concentrated urban poverty within the United
States. Urban Geography 20 (6):552-566.
Crane, Randall, and Richard Crepeau. 1998. Does neighborhood design influence travel?: A
behavioral analysis of travel diary and GIS data. Transportation Research Part D:
Transport and Environment 3 (4):225-238.
Crowder, Kyle D. 2000. The racial context of White mobility: An individual-level assessment of
the White flight hypothesis. Social Science Research 29 (2):223-257.
Denton, Nancy A. 1994. Are African Americans still hypersegregated? In Residential Apartheid:
The American Legacy, edited by R. D. Bullard, Jr., J. E. Grigsby, III and C. Lee. Los
Angeles, CA: CAAS Publications, UCLA.
Denton, Nancy A., and Douglas S. Massey. 1989. Racial identity among Caribbean Hispanics:
The effect of double minority status on residential segregation. American Sociological
Review 54:790-808.
Downs, Anthony. 1999. Some realities about sprawl and urban decline. Housing Policy Debate
10 (4):955-974.
Dunphy, Robert. 1998. The Cost of Being Close: Land Values and Housing Costs in Suburban
Portland, Oregon. ULI Working Paper Series 660 (June).
El Nasser, Haya, and Paul Overburg. 2001. What you don’t know about sprawl. USA Today, 2-
22-01, 1A.
Ellen, Ingrid G., and Margery Austin Turner. 1997. Does neighborhood matter? Assessing recent
evidence. Housing Policy Debate 8 (4):833-866.
Ewing, Reid. 1997. Is Los Angeles-style sprawl desirable? Journal of the American Planning
Association 63 (1):107-126.
Farley, Reynolds. 1993. Neighborhood preferences and aspirations among blacks and whites. In
Housing Markets and Residential Mobility, edited by G. T. Kingsley and M. A. Turner.
Washington, DC: Urban Institute Press.
Farley, Reynolds, Elaine L. Fielding, and Maria Krysan. 1997. The residential preferences of
blacks and whites: A four-metropolis analysis. Housing Policy Debate 8 (4):763-800.

Density, Sprawl, Segregation / Pendall Page 35
Farley, Reynolds, and William H. Frey. 1994. Changes in the segregation of whites from blacks
during the 1980s: Small steps toward a more integrated society. American Sociological
Review 59 (1):23-45.
Farley, Reynolds, Howard Schuman, Suzanne Bianchi, Diane Colasanto, and Shirley Hatchett.
1978. ‘Chocolate city, vanilla suburbs’: Will the trend toward racially separate
communities continue? Social Science Research 7:319-344.
Farley, Reynolds, Charlotte Steeh, Tara Jackson, Maria Krysan, and Keith Reeves. 1993.
Continued racial residential segregation in Detroit: ‘Chocolate city, vanilla suburbs’
revisited. Journal of Housing Research 4 (1):1-38.
Forman, Richard T.T. 1995. Land Mosaics: The Ecology of Landscapes and Regions.
Cambridge: Cambridge University Press.
Frank, James E. 1989. The Costs of Alternative Development Patterns: A Review of the
Literature. Washington, DC: Urban Land Institute.
Freeman, Lance. 1999. A note on the influence of African heritage on segregation: The case of
Dominicans. Urban Affairs Review 35 (1):137-146.
Frey, William H. 1979. Central city white flight: Racial and nonracial causes. American
Sociological Review 44:425-448.
———. 1985. Mover destination selectivity and the changing suburbanization of metropolitan
whites and blacks. Demography 22 (2):223-243.
Frey, William H., and Kao-Lee Liaw. 1998. Immigrant concentration and domestic migrant
dispersal: Is movement to nonmetropolitan areas “White flight”? Professional
Geographer 50 (2):215-232.
Fulton, William B., Rolf Pendall, Mai T. Nguyen, and Alicia Harrison. 2001. Sprawl accelerates:
Exploring and explaining urban density changes in the US, 1982-1997. Washington, DC:
Brookings Institution.
Galster, George. 1988. Residential segregation in American cities: A contrary review.
Population Research and Policy Review 7:93-112.
———. 1989. Residential segregation in American cities: A further response to Clark.
Population Research and Policy Review 8:181-192.
———. 1990. White flight from racially integrated neighborhoods in the 1970s: The Cleveland
experience. Urban Studies 27 (3):385-399.

Density, Sprawl, Segregation / Pendall Page 36
———. 1991. Black suburbanization: Has it changed the relative location of the races? Urban
Affairs Quarterly 26 (4):621-628.
———. 1992. A cumulative causation model of the underclass: Implications for urban economic
development policy. In The Metropolis in Black and White, edited by G. Galster and N.
Hill. New Brunswick, N.J.: Center for Urban Policy Research.
Galster, George, Royce Hanson, Hal Wolman, Stephen Coleman, and Jason Freihage. 2000.
Wrestling sprawl to the ground: Defining and measuring an elusive concept. Paper read at
Fair Growth: Connecting Sprawl, Smart Growth, and Social Equity, November 1, 2000,
at Atlanta, Georgia.
Garreau, Joel. 1991. Edge City: Life on the New Frontier. New York: Doubleday.
Gordon, Peter, and Harry W. Richardson. 1997. Are compact cities a desirable planning goal?
Journal of the American Planning Association 63 (1):95-106.
Gotham, Kevin Fox. 2000. Urban space, restrictive covenants and the origins of racial residential
segregation in a US city, 1900-50. International Journal of Urban and Regional
Research 24 (3):616-633.
Hanchett, Thomas W. 1998. Sorting out the New South City: Race, Class, and Urban
Development in Charlotte, 1875-1975. Chapel Hill, N.C.: University of North Carolina
Press.
Handy, Susan. 1996. Methodologies for exploring the link between urban form and travel
behavior. Transportation Research Part D: Transport and Environment 1 (2):151-165.
Harris, David R. 1999. ‘Property values drop when blacks move in, because...’: Racial and
socioeconomic determinants of neighborhood desirability. American Sociological Review
64 (1999):461-479.
Hill, Edward W., John F. Brennan, and Harold L. Wolman. 1998. What is a central city in the
United States? Applying a statistical technique for developing taxonomies. Urban Studies
35 (11):1935-1969.
Holtzclaw, John. 1994. Using Residential Patterns and Transit to Decrease Auto Dependence on
Cost. Washington, DC: Natural Resources Defense Council for California Energy
Resources Conservation and Development Commission.
Jackson, Kenneth. 1985. Crabgrass Frontier: The Suburbanization of the United States. New
York: Oxford University Press.
Density, Sprawl, Segregation / Pendall Page 37
Jargowsky, Paul A. 1996. Take the money and run: Economic segregation in U.S. metropolitan
areas. American Sociological Review 61:984-998.
———. 1997. Poverty and Place: Ghettos, Barrios, and the American City. New York: Russell
Sage Foundation.
Jonas, Andrew E.G. 1998. Busing, “white flight,” and the role of developers in the continuous
suburbanization of Franklin County, Ohio. Urban Affairs Review 34 (2):340-358.
Kasarda, John D. 1993. Inner-city concentrated poverty and neighborhood distress: 1970-1990.
Housing Policy Debate 4 (3):253-302.
Krivo, Lauren J., Ruth D. Peterson, Helen Rizzo, and John R. Reynolds. 1998. Race,
segregation, and the concentration of disadvantage: 1980-1990. Social Problems 45
(1):61-80.
Ladd, Helen F. 1992. Population growth, density and the costs of providing public services.
Urban Studies 29 (2):273-295.
Logan, John R., Richard D. Alba, and Shu-Yin Leung. 1996. Minority access to white suburbs:
A multiregional comparison. Social Forces 74 (3):851-881.
Marquez, Benjamin. 1985. Power and Politics in a Chicano Barrio: A Study of Mobilization
Efforts and Community Power in El Paso. Lanham, MD: University Press of America.
Marshall, Harvey. 1979. White movement to the suburbs: A comparison of explanations.
American Sociological Review 44:975-944.
Martin, Jonathan D. 2001. Stein’s Legacy: A Just City—Making The Affordable
Housing/Diversity Connection in New Urbanism in Portland, Oregon. MRP Thesis, City
& Regional Planning, Cornell University, Ithaca, NY.
Massey, Douglas S. 1996. The age of extremes: Concentrated affluence and poverty in the
twenty-first century. Demography 33 (4):395-412.
Massey, Douglas S., and Nancy Denton. 1987. Trends in the residential segregation of blacks,
Hispanics, and Asians: 1970-1980. American Sociological Review 50:94-106.
Massey, Douglas S., and Nancy A. Denton. 1988. Suburbanization and segregation in U.S.
metropolitan areas. American Journal of Sociology 94 (3):592-626.
———. 1989. Hypersegregation in U.S. metropolitan areas: Black and Hispanic segregation
along five dimensions. Demography 26 (3):373-391.

Density, Sprawl, Segregation / Pendall Page 38
———. 1993. American Apartheid: Segregation and the Making of the Underclass. Cambridge,
Mass.: Harvard University Press.
Massey, Douglas S., and Mitchell L. Eggers. 1990. The ecology of inequality: Minorities and the
concentration of poverty, 1970-1980. American Journal of Sociology 95:1153-1188.
Massey, Douglas S., and Mary J. Fischer. 1999. Does rising income bring integration? New
results for blacks, Hispanics, and Asians in 1990. Social Science Research 28 (3):316-
326.
———. 2000. How segregation concentrates poverty. Ethnic and Racial Studies 23 (4):670-691.
Massey, Douglas S., Michael J. White, and Voon-Chin Phua. 1996. The dimensions of
segregation revisited. Sociological Methods & Research 25 (2):172-206.
Mills, Edwin S. 1972. Studies in the Structure of the Urban Economy. Baltimore: Johns Hopkins
Press.
Monroy, Douglas. 1999. Rebirth: Mexican Los Angeles from the Great Migration to the Great
Depression. Berkeley: University of California Press.
Morris, Martina, Annette D. Bernhardt, and Mark S. Handcock. 1994. Economic inequality: New
methods for new trends. American Sociological Review 59 (2):205-219.
Myers, Phyllis, and Robert Puentes. 2001. Growth at the Ballot Box: Electing the Shape of
Communities in November 2000. Washington, DC: Brookings Institution Center on
Urban and Metropolitan Policy.
Nelson, Kristin Louise. 1984. Back offices and female labor markets: Office suburbanization in
the San Francisco Bay area. Dissertation, City and Regional Planning, University of
California at Berkeley, Berkeley, California.
Noyelle, Thierry J., and Thomas M. Stanback, Jr. 1984. The Economic Transformation of
American Cities. Totowa, N.J.: Rowman & Allanheld.
Orfield, Gary, Susan Eaton, and The Harvard Project on School Desegregation. 1996.
Dismantling Desegregation: The Quiet Reversal of Brown v. Board of Education. New
York: The New Press.
Pattillo-McCoy, M. 2000. The limits of out-migration for the black middle class. Journal of
Urban Affairs 22 (3):225-241.
Peiser, Richard B. 1989. Density and Urban Sprawl. Land Economics 65:193-204.

Density, Sprawl, Segregation / Pendall Page 39
Pendall, Rolf. 1999. Do Land-Use Controls Cause Sprawl? Environment and Planning B:
Planning and Design 26 (4):555-571.
———. 2000a. Local Land-Use Regulation and the Chain of Exclusion. Journal of the American
Planning Association 66 (2):125-142.
———. 2000b. Why voucher and certificate users live in distressed neighborhoods. Housing
Policy Debate 11 (4):881-910.
Phelan, Thomas J., and Mark Schneider. 1996. Race, ethnicity, and class in American suburbs.
Urban Affairs Review 31 (5):659-680.
Planning Commissioners Journal. 2000. Position Statements of the Presidential Candidates on
Federal Role in Dealing with Sprawl., 9-7 [cited 6-10-2001.
PolicyLink. 2001. Beyond Gentrification Toolkit [Web site] [cited 6-10 2000]. Available from
http://www.policylink.org/gentrification/.
Real Estate Research Corporation (RERC). 1974. The Costs of Sprawl: Environmental and
Economic Costs of Alternative Residential Development Patterns at the Urban Fringe. 2
vols. Washington, DC: U.S. Government Printing Office.
Romo, Ricardo. 1983. East Los Angeles: History of a Barrio. Austin, Texas: University of Texas
Press.
Santiago, Anne M., and George Galster. 1995. Puerto-Rican segregation in the United States:
Cause or consequence of economic status? Social Problems 42 (2):361-389.
Schneider, Mark, and Thomas Phelan. 1993. Black suburbanization in the 1980s. Demography
30 (2):269-279.
Schnore, Leo F. 1972. Class and Race in Cities and Suburbs. Chicago: Markham Publishing
Company.
Schnore, Leo F., Carolyn André, and Henry Sharp. 1976. Black suburbanization, 1930-1970. In
The Changing Face of the Suburbs, edited by B. Schwartz. Chicago: University of
Chicago Press.
South, Scott J., and Kyle D. Crowder. 1997. Residential mobility between cities and suburbs:
Race, suburbanization, and back-to-the-city moves. Demography 34 (4):525-538.
———. 1998a. Housing discrimination and residential mobility: Impacts for blacks and whites.
Population Research and Policy Review 17 (4):369-387.

Density, Sprawl, Segregation / Pendall Page 40
———. 1998b. Leaving the ‘hood: Residential mobility between black, white, and integrated
neighborhoods. American Sociological Review 63 (1):17-26.
St. John, C, M Edwards, and E Wenk. 1995. Racial differences in intraurban residential mobility.
Urban Affairs Review 30 (5):709-729.
Stults, Brian J. 2001. Indices of segregation, 1990 and 2000 [Excel spreadsheet] [cited 6-8
2001]. Available from
http://mumford1.dyndns.org/cen2000/WholePop/segregation2000.xls.
Thernstrom, Stephan, and Abigail Thernstrom. 1997. America in Black and White: One Nation,
Indivisible. New York: Simon and Schuster.
Thompson, Heather Ann. 1999. Rethinking the politics of white flight in the postwar city:
Detroit, 1945-1980. Journal of Urban History 25 (2):163-198.
Torrens, Paul, and Marina Alberti. 2000. Measuring sprawl. In Centre for Advanced Spatial
Analysis Working Paper Series, University College, London.
Turner, Margery Austin. 1998. Moving out of poverty: Expanding mobility and choice through
tenant-based housing assistance. Housing Policy Debate 9 (2):373-394.
Turner, Margery Austin, and Ron Wienk. 1993. The persistence of segregation in urban areas:
Contributing causes. In Housing Markets and Residential Mobility, edited by G. T.
Kingsley and M. A. Turner. Washington, DC: Urban Institute Press.
U.S. Census Bureau. 2001. Table IE-1. Selected Measures of Household Income Dispersion:
1967 to 1999 [Web page], 4-23 [cited 6-10-2001. Available from
http://www.census.gov/hhes/income/histinc/ie1.html.
U.S. Department of Agriculture. 2000. Summary Report, 1997 National Resources Inventory
[Web page], December 2000 [cited 6-10 2001]. Available from
http://www.nhq.nrcs.usda.gov/NRI/1997/summary_report/original/glossary.html.
Wiese, Andrew. 1993. Places of our own: Suburban black towns before 1960. Journal of Urban
Affairs 19 (3):30-54.
Wilson, William Julius. 1978. The Declining Significance of Race: Blacks and Changing
American Institutions. Chicago: University of Chicago Press.
———. 1987. The Truly Disadvantaged: The Inner City, the Underclass, and Public Policy.
Chicago: University of Chicago Press.
———. 1996. When Work Disappears: The World of the New Urban Poor. New York: Knopf.

Density, Sprawl, Segregation / Pendall Page 41
Windsor, D. 1979. Critique of The Costs of Sprawl. Journal of the American Planning
Association 45 (3):279-292.
Yelnosky, Michael J. 1999. What Does “Testing” Tell Us About the Incidence of
Discrimination in Housing Markets? Seton Hall Law Review 29:1488-1497.
Yinger, John. 1986. Measuring racial discrimination with fair housing audits: Caught in the act.
American Economic Review 76 (5):881-893.
———. 1998. Testing for discrimination in housing and related markets. In A National Report
Card on Discrimination in America: The Role of Testing, edited by M. Fix and M. A.
Turner. Washington, DC: Urban Institute Press.
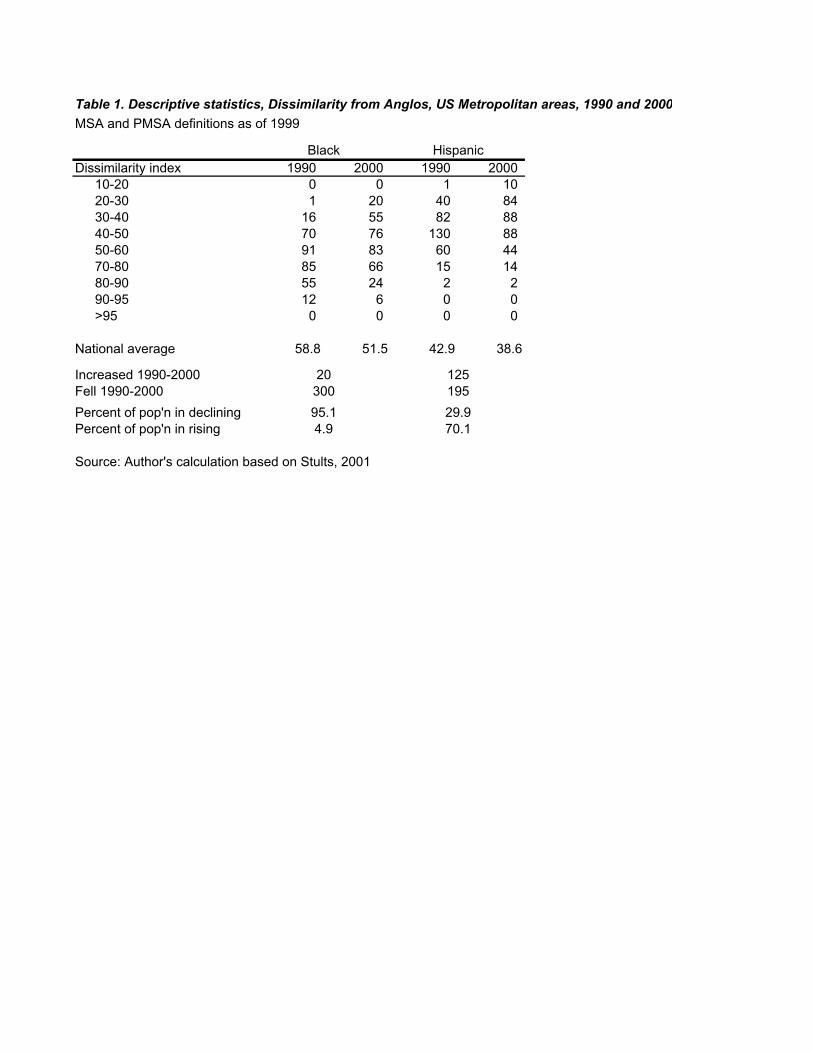
Table 1. Descriptive statistics, Dissimilarity from Anglos, US Metropolitan areas, 1990 and 2000MSA and PMSA definitions as of 1999
Black HispanicDissimilarity index 1990 2000 1990 2000
10-20 0 0 1 1020-30 1 20 40 8430-40 16 55 82 8840-50 70 76 130 8850-60 91 83 60 4470-80 85 66 15 1480-90 55 24 2 290-95 12 6 0 0>95 0 0 0 0
National average 58.8 51.5 42.9 38.6
Increased 1990-2000 20 125Fell 1990-2000 300 195Percent of pop'n in declining 95.1 29.9Percent of pop'n in rising 4.9 70.1
Source: Author's calculation based on Stults, 2001

Table 2. Indices of dissimilarity computed
1980 1990VLI families vs. non-VLI families
VLI households vs. non-VLI householdsVLI White families vs. non-VLI White
familiesVLI White households vs. non-VLI
White householdsVLI Black families vs. non-VLI Black
familiesVLI Black households vs. non-VLI
Black householdsVLI Hispanic families vs. non-VLI
Hispanic familiesVLI Hispanic households vs. non-VLI
Hispanic householdsVLI Black families vs. all White
familiesVLI Black households vs. all White
householdsNon-VLI Black families vs. all White
familiesNon-VLI Black households vs. all
White householdsVLI Hispanic families vs. all non-
Hispanic White personsVLI Hispanic households vs. all non-
Hispanic White personsNon-VLI Hispanic families vs. all non-
Hispanic white personsNon-VLI Hispanic households vs. all
non-Hispanic white persons
Notes:VLI: Very low income"Household race" is the race of the householderWhite and Black families/households include some Hispanic families/householdsHispanic families/households can be of any race

Table 3. Segregation indices for very low income households and families, 1980 and 1990National unweighted statistics, PMSAs and MSAs by 1990 definitions
Dissimilarity Isolation Pct. very low incomeHouseholds 1980 1990 1980 1990 1980 1990
Mean 25.3 26.7 29.2 30.2 23.2 23.4Std. Deviation 5.3 5.3 3.1 3.5 1.5 2.0Minimum 12.3 13.7 21.6 20.1 19.5 17.025th percentile 21.6 23.1 27.2 28.0 22.2 22.0Median 25.4 26.8 29.1 30.2 23.1 23.575th percentile 29.0 30.9 31.0 32.4 24.1 24.8Maximum 39.0 39.4 40.2 40.8 27.7 28.5
FamiliesMean 25.7 28.8 24.9 27.2 18.9 19.6Std. Deviation 6.0 6.2 3.9 4.4 1.9 2.3Minimum 11.6 13.5 15.5 17.9 14.7 14.725th percentile 21.5 23.9 22.0 23.9 17.7 18.0Median 25.7 29.1 24.3 26.9 18.7 19.475th percentile 29.9 32.7 27.4 30.0 20.1 20.9Maximum 40.8 43.5 37.0 40.3 25.0 25.5
Metropolitan areas 320 320 320 320 320 320
Dissimilarity compares location of VLI with non-VLI households or families.Isolation is the percent VLI in the average VLI household or family's neighborhood.

Table 4. Variables to be tested, Income segregation regressions
Variable Rationale EffectSprawl/density variables• Household density 1982 Higher-density regions could have more mixing of rich and poor or
more desire by wealthy to self-segregate(+ / -)
• Sprawly growth Regions where density is growing may see less spatial “secession of the wealthy”, or more gentrification
(+ / -)
• Dense growth Regions where density is falling may see more spatial “secession" of the wealthy, or more housing opportunity generally
(+ / -)
• Pct. chg households 1980-90 Faster growth offers more opportunity for spatial mixing, but may also speed transition toward segregated metropolitan areas
(+ / -)
• Pct. chg household density, 1982-92
Regions where density is growing may see less spatial “secession of the wealthy”, or more gentrification
(+ / -)
1980 lagged variables• Logit D: VLI/NVLI households
(families) 1980Held constant to account for long history of segregation (+)
Income variables• Median household (family)
income 1990 ($10K)Regions with higher median incomes will have more segregation of VLI households (families)
(+)
• Pct. households (families) VLI 1990
Regions with more VLI households (families) will have less segregation of VLI households (families)
( - )
• Shift, share of h'holds (families) in VLI bracket 1980-90
Where shift to VLI more pronounced, more segregation (+)
Demographic variables• Pct. pop 65+ yrs 1990 Segregation of poor may be less severe in regions whose population is
poor because of age( - )
• Pct. households black 1990 Segregation of poor may be more severe in regions whose poor population is dark-skinned
(+)
• Pct. chg black pop 1980-90 Segregation of poor may increase where black population is rising (+)
• Black concentration in VLI bracket, 1990
Segregation of poor may be more severe in regions whose poor population is dark-skinned
(+)
• Pct. households Hispanic 1990 Segregation of poor may be more severe in regions where poor population is Hispanic
(+)
• Pct. chg Hispanic pop 1980-90 Segregation of poor may increase where Hispanic population is rising (+)
• Hispanic concentration in VLI bracket, 1990
Segregation of poor may be more severe in regions where poor population is Hispanic
(+)
Economic structure variables• Shift, pct. of employmt in mfg.,
1982-92Segregation of poor may be less severe with less severe manufacturing loss
( - )

Table 5. Descriptive Statistics: Economic segregation regressions
Dependent variable Mean Std. Dev.Logit D: VLI/NVLI households 1990 -1.029 0.283Logit D: VLI/NVLI families 1990 -0.928 0.313
Sprawl/density variablesHousehold density 1982 1.649 1.003Sprawly growth 0.000 0.574Dense growth 0.000 0.819Pct. chg households 1980-90 0.176 0.146Pct. chg household density 1982-92 -0.060 0.111
1980 lagged variablesLogit D: VLI/NVLI households 1980 -1.103 0.293Logit D: VLI/NVLI families 1990 -1.091 0.325
Income variablesMedian household income 1990 ($10K) 2.918 0.568Median family income 1990 ($10K) 3.467 0.633Pct. households VLI 1990 0.234 0.020Pct. families VLI 1990 0.196 0.023Shift, share of h'holds in VLI bracket 1980-90 0.003 0.011Shift, share of families in VLI bracket 1980-90 0.007 0.013
Demographic variablesPct. pop 65+ yrs 1990 0.124 0.033Pct. households black 1990 0.089 0.086Pct. chg black pop 1980-90 0.293 0.367Black concentration in VLI bracket, 1990 1.710 0.325Pct. households Hispanic 1990 0.056 0.110Pct. chg Hispanic pop 1980-90 0.477 0.465Hispanic concentration in VLI bracket, 1990 1.277 0.338
Economic structure variablesShift, pct. of employmt in mfg., 1982-92 -6.433 4.513
N=319 for all variables.VLI=Very low income
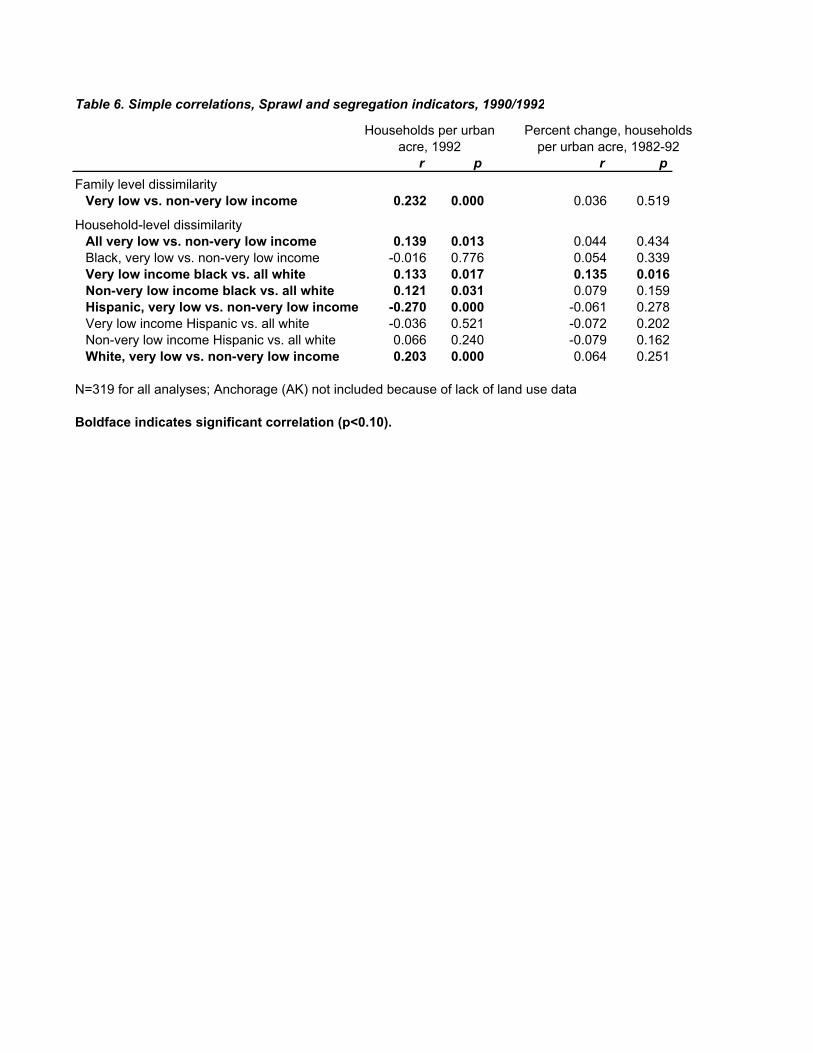
Table 6. Simple correlations, Sprawl and segregation indicators, 1990/1992
Households per urban Percent change, householdsacre, 1992 per urban acre, 1982-92
r p r pFamily level dissimilarity
Very low vs. non-very low income 0.232 0.000 0.036 0.519
Household-level dissimilarityAll very low vs. non-very low income 0.139 0.013 0.044 0.434Black, very low vs. non-very low income -0.016 0.776 0.054 0.339Very low income black vs. all white 0.133 0.017 0.135 0.016Non-very low income black vs. all white 0.121 0.031 0.079 0.159Hispanic, very low vs. non-very low income -0.270 0.000 -0.061 0.278Very low income Hispanic vs. all white -0.036 0.521 -0.072 0.202Non-very low income Hispanic vs. all white 0.066 0.240 -0.079 0.162White, very low vs. non-very low income 0.203 0.000 0.064 0.251
N=319 for all analyses; Anchorage (AK) not included because of lack of land use data
Boldface indicates significant correlation (p<0.10).
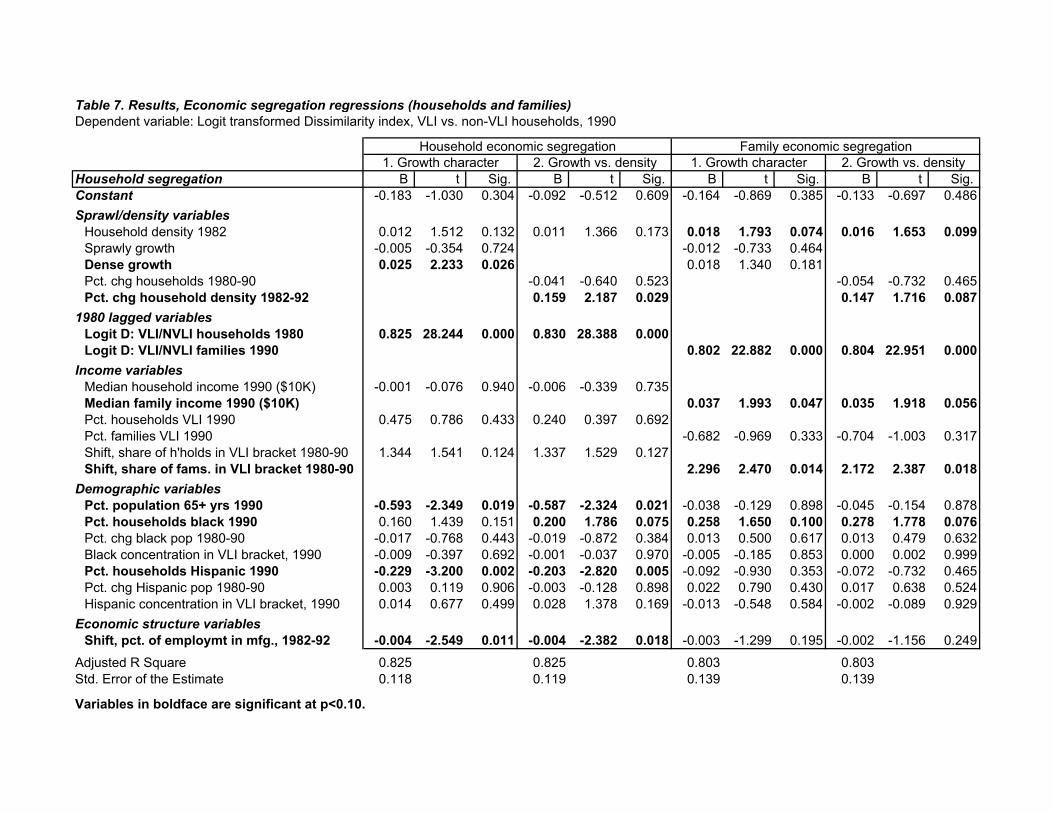
Table 7. Results, Economic segregation regressions (households and families)Dependent variable: Logit transformed Dissimilarity index, VLI vs. non-VLI households, 1990
Household economic segregation Family economic segregation1. Growth character 2. Growth vs. density 1. Growth character 2. Growth vs. density
Household segregation B t Sig. B t Sig. B t Sig. B t Sig. Constant -0.183 -1.030 0.304 -0.092 -0.512 0.609 -0.164 -0.869 0.385 -0.133 -0.697 0.486Sprawl/density variables
Household density 1982 0.012 1.512 0.132 0.011 1.366 0.173 0.018 1.793 0.074 0.016 1.653 0.099Sprawly growth -0.005 -0.354 0.724 -0.012 -0.733 0.464Dense growth 0.025 2.233 0.026 0.018 1.340 0.181Pct. chg households 1980-90 -0.041 -0.640 0.523 -0.054 -0.732 0.465Pct. chg household density 1982-92 0.159 2.187 0.029 0.147 1.716 0.087
1980 lagged variablesLogit D: VLI/NVLI households 1980 0.825 28.244 0.000 0.830 28.388 0.000Logit D: VLI/NVLI families 1990 0.802 22.882 0.000 0.804 22.951 0.000
Income variablesMedian household income 1990 ($10K) -0.001 -0.076 0.940 -0.006 -0.339 0.735Median family income 1990 ($10K) 0.037 1.993 0.047 0.035 1.918 0.056Pct. households VLI 1990 0.475 0.786 0.433 0.240 0.397 0.692Pct. families VLI 1990 -0.682 -0.969 0.333 -0.704 -1.003 0.317Shift, share of h'holds in VLI bracket 1980-90 1.344 1.541 0.124 1.337 1.529 0.127Shift, share of fams. in VLI bracket 1980-90 2.296 2.470 0.014 2.172 2.387 0.018
Demographic variablesPct. population 65+ yrs 1990 -0.593 -2.349 0.019 -0.587 -2.324 0.021 -0.038 -0.129 0.898 -0.045 -0.154 0.878Pct. households black 1990 0.160 1.439 0.151 0.200 1.786 0.075 0.258 1.650 0.100 0.278 1.778 0.076Pct. chg black pop 1980-90 -0.017 -0.768 0.443 -0.019 -0.872 0.384 0.013 0.500 0.617 0.013 0.479 0.632Black concentration in VLI bracket, 1990 -0.009 -0.397 0.692 -0.001 -0.037 0.970 -0.005 -0.185 0.853 0.000 0.002 0.999Pct. households Hispanic 1990 -0.229 -3.200 0.002 -0.203 -2.820 0.005 -0.092 -0.930 0.353 -0.072 -0.732 0.465Pct. chg Hispanic pop 1980-90 0.003 0.119 0.906 -0.003 -0.128 0.898 0.022 0.790 0.430 0.017 0.638 0.524Hispanic concentration in VLI bracket, 1990 0.014 0.677 0.499 0.028 1.378 0.169 -0.013 -0.548 0.584 -0.002 -0.089 0.929
Economic structure variablesShift, pct. of employmt in mfg., 1982-92 -0.004 -2.549 0.011 -0.004 -2.382 0.018 -0.003 -1.299 0.195 -0.002 -1.156 0.249
Adjusted R Square 0.825 0.825 0.803 0.803Std. Error of the Estimate 0.118 0.119 0.139 0.139
Variables in boldface are significant at p<0.10.

Table 8a. Variables to be tested, Race-specific economic segregation regressions
Variable Rationale Effect
Sprawl/density variables• Household density 1982 Higher-density regions could have more mixing of rich and
poor or more desire by wealthy to self-segregate(+ / -)
• Sprawly growth Regions where density is growing may see less spatial “secession of the wealthy”, or more gentrification
(+ / -)
• Dense growth Regions where density is falling may see more spatial “secession" of the wealthy, or more housing opportunity generally
(+ / -)
• Pct. chg households 1980-90 Faster growth offers more opportunity for spatial mixing, but may also speed transition toward segregated metropolitan areas
(+ / -)
•Pct. chg household density, 1982-92
Regions where density is growing may see less spatial “secession of the wealthy”, or more gentrification (+ / -)
1980 lagged variables•
Various D indices Held constant to account for long history of segregation (+)
Income variables• Economic segregation of all
h'holds 1990Black households will be more economically segregated in regions with general income segregation
(+)
• Median family income 1990 ($10K)
Regions with higher median incomes will have more segregation of VLI households (families)
(+)
• Pct. families VLI 1990 Regions with more VLI households (families) will have less segregation of VLI households (families)
( - )
• Shift, share of blacks in VLI bracket 1980-90
Where shift to VLI more pronounced, more segregation (+)
Demographic variables• Pct. black population 65+ yrs
1990Segregation of black poor may be less severe in regions whose black population is poor because of age
( - )
• Pct. white population 65+ yrs 1990
Segregation of black poor may be more severe in regions whose white population is elderly
(+)
• Pct. households black 1990 Segregation of poor may be more severe in regions whose poor population is dark-skinned
(+)
• Pct. chg black pop 1980-90 Segregation of poor may increase where black population is rising (+)
• Black concentration in VLI bracket, 1990
Segregation of poor may be more severe in regions whose poor population is dark-skinned
(+)
• Pct. households Hispanic 1990 Segregation of poor may be more severe in regions where poor population is Hispanic
(+)
• Pct. chg Hispanic pop 1980-90 Segregation of poor may increase where Hispanic population is rising
(+)
• Hispanic concentration in VLI bracket, 1990
Segregation of poor may be more severe in regions where poor population is Hispanic
(+)
Economic structure variables• Shift, pct. of employmt in mfg.,
1982-92Segregation of poor may be less severe with less severe manufacturing loss
( - )

Table 8b. Variables to be tested, Racial segregation regressions
Variable Rationale Effect
Sprawl/density variables• Household density 1982 Higher-density regions could have more mixing of black and
white, or more desire by whites to self-segregate(+ / -)
• Sprawly growth Regions where density is growing may see less spatial “secession" of whites, or more defensive "forting up"
(+ / -)
• Dense growth Regions where density is falling may see more spatial “secession" of whites, or more opportunity for mixed low-density neighborhoods
(+ / -)
• Pct. chg households 1980-90 Faster growth offers more opportunity for spatial mixing ( - )
•Pct. chg household density, 1982-92
Regions where density is growing may see less spatial “secession" of whites, or more defensive "forting up" (+ / -)
1980 lagged variables•
Various D indices Held constant to account for long history of segregation (+)
Income variables• Economic segregation of black
h'holds 1990Poor black households will be more racially segregated from whites, non-poor less so, in regions where blacks are more segregated by income
VLI (+) NVLI (-)
• Median family income 1990 ($10K)
Regions with higher median incomes will have more racial segregation of all blacks because blacks have lower incomes
(+)
• Pct. families VLI 1990 Regions with more VLI households (families) will have less racial segregation of blacks
( - )
• Shift, share of blacks in VLI bracket 1980-90
Where shift to VLI more pronounced, more segregation of all blacks from whites
(+ / -)
Demographic variables• Pct. black population 65+ yrs
1990Segregation of black poor may be less severe in regions whose black population is poor because of age
( - )
• Pct. white population 65+ yrs 1990
Segregation of black poor may be more severe in regions whose white population is elderly
(+)
• Pct. households black 1990 Segregation of blacks more severe in regions with high shares of blacks
(+)
• Pct. chg black pop 1980-90 Segregation of blacks decreases where black population is rising ( - )
• Black concentration in VLI bracket, 1990
Segregation of blacks more severe in regions whose poor population is dark-skinned
( - )
• Pct. households Hispanic 1990 Segregation of blacks less severe in regions with high shares of Hispanics
( - )
• Pct. chg Hispanic pop 1980-90 Segregation of blacks decreases where Hispanic population is rising
( - )
• Hispanic concentration in VLI bracket, 1990
Segregation of blacks less severe in regions where more VLI households are Hispanic
(+)
Economic structure variables• Shift, pct. of employmt in mfg.,
1982-92Segregation of poor may be less severe with less severe manufacturing loss
( - )

Table 9. Means and Standard Deviations, Regressions of Black economic and racial segregation
Dependent variables Mean Std. Dev.• Logit D: VLI/NVLI black h'holds 90 -0.746 0.395• Logit D: VLI black h'holds/all white h'holds 90 0.754 0.516• Logit D: NVLI black h'holds/all white h'holds 90 0.214 0.509Sprawl/density variables• Household density 1982 1.701 1.068• Sprawly growth 0.013 0.582• Dense growth -0.012 0.850• Pct. chg households 1980-90 0.177 0.151• Pct. chg household density, 1982-92 -0.063 0.1141980 lagged variables• Logit D: VLI/NVLI black families 1980 -0.912 0.545• Logit D: VLI black/all white families 1980 1.201 0.603• Logit D: non-VLI black/all white families 1980 0.780 0.575Income variables• Logit D: VLI/NVLI all households 1990 -0.991 0.263• Logit D: VLI/NVLI black households 1990 -0.746 0.395• Median family income 1990 ($10K) 3.492 0.647• Pct. families VLI 1990 0.197 0.022• Shift, share of blacks in VLI bracket 1980-90 0.002 0.028Demographic variables• Pct. black population 65+ yrs 1990 0.074 0.027• Pct. white population 65+ yrs 1990 0.134 0.036• Pct. households black 1990 0.103 0.086• Pct. chg black pop 1980-90 0.226 0.258• Black concentration in VLI bracket, 1990 1.714 0.281• Pct. households Hispanic 1990 0.056 0.095• Pct. chg Hispanic pop 1980-90 0.479 0.478• Hispanic concentration in VLI bracket, 1990 1.265 0.326Economic structure variables• Shift, pct. of employmt in mfg., 1982-92 -6.556 4.476
N=271 for all regressions.
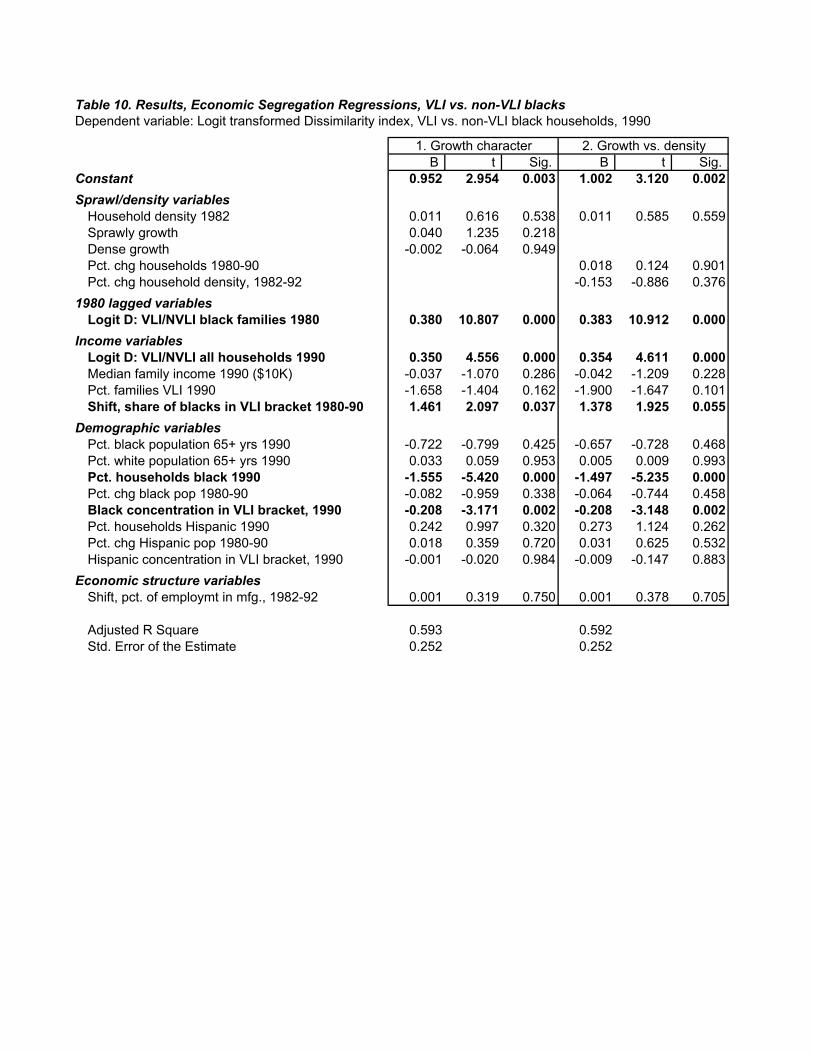
Table 10. Results, Economic Segregation Regressions, VLI vs. non-VLI blacksDependent variable: Logit transformed Dissimilarity index, VLI vs. non-VLI black households, 1990
1. Growth character 2. Growth vs. densityB t Sig. B t Sig.
Constant 0.952 2.954 0.003 1.002 3.120 0.002Sprawl/density variables
Household density 1982 0.011 0.616 0.538 0.011 0.585 0.559Sprawly growth 0.040 1.235 0.218Dense growth -0.002 -0.064 0.949Pct. chg households 1980-90 0.018 0.124 0.901Pct. chg household density, 1982-92 -0.153 -0.886 0.376
1980 lagged variablesLogit D: VLI/NVLI black families 1980 0.380 10.807 0.000 0.383 10.912 0.000
Income variablesLogit D: VLI/NVLI all households 1990 0.350 4.556 0.000 0.354 4.611 0.000Median family income 1990 ($10K) -0.037 -1.070 0.286 -0.042 -1.209 0.228Pct. families VLI 1990 -1.658 -1.404 0.162 -1.900 -1.647 0.101Shift, share of blacks in VLI bracket 1980-90 1.461 2.097 0.037 1.378 1.925 0.055
Demographic variablesPct. black population 65+ yrs 1990 -0.722 -0.799 0.425 -0.657 -0.728 0.468Pct. white population 65+ yrs 1990 0.033 0.059 0.953 0.005 0.009 0.993Pct. households black 1990 -1.555 -5.420 0.000 -1.497 -5.235 0.000Pct. chg black pop 1980-90 -0.082 -0.959 0.338 -0.064 -0.744 0.458Black concentration in VLI bracket, 1990 -0.208 -3.171 0.002 -0.208 -3.148 0.002Pct. households Hispanic 1990 0.242 0.997 0.320 0.273 1.124 0.262Pct. chg Hispanic pop 1980-90 0.018 0.359 0.720 0.031 0.625 0.532Hispanic concentration in VLI bracket, 1990 -0.001 -0.020 0.984 -0.009 -0.147 0.883
Economic structure variablesShift, pct. of employmt in mfg., 1982-92 0.001 0.319 0.750 0.001 0.378 0.705
Adjusted R Square 0.593 0.592Std. Error of the Estimate 0.252 0.252

Table 11. Results, Racial Segregation Regressions, VLI blacks vs. all whitesDependent variable: Logit transformed Dissimilarity index, VLI or non-VLI black households vs. all white households, 1990
Very low income blacks vs. all whites Non-VLI blacks vs. all whites1. Growth character 2. Growth vs. density 1. Growth character 2. Growth vs. density
B t Sig. B t Sig. B t Sig. B t Sig. Constant -0.915 -3.364 0.001 -0.864 -3.186 0.002 -1.104 -4.064 0.000 -1.065 -3.916 0.000Sprawl/density variables
Household density 1982 -0.008 -0.438 0.662 -0.011 -0.629 0.530 0.007 0.421 0.674 0.005 0.294 0.769Sprawly growth -0.038 -1.198 0.232 0.005 0.156 0.876Dense growth -0.023 -0.981 0.327 -0.026 -1.101 0.272Pct. chg households 1980-90 -0.345 -2.437 0.016 -0.211 -1.481 0.140Pct. chg household density, 1982-92 0.085 0.521 0.603 -0.111 -0.681 0.497
1980 lagged variablesLogit D: VLI black/all white families 1980 0.616 20.113 0.000 0.612 20.168 0.000Logit D: non-VLI black/all white families 1980 0.704 23.028 0.000 0.698 23.040 0.000
Income variablesLogit D: VLI/NVLI black households 1990 0.123 2.535 0.012 0.121 2.546 0.011 -0.106 -2.245 0.026 -0.105 -2.250 0.025Median family income 1990 ($10K) 0.118 3.747 0.000 0.114 3.632 0.000 0.126 4.021 0.000 0.122 3.889 0.000Pct. families VLI 1990 -0.177 -0.160 0.873 -0.071 -0.066 0.947 -0.701 -0.636 0.525 -0.728 -0.676 0.499Shift, share of blacks in VLI bracket 1980-90 -0.249 -0.382 0.703 -0.527 -0.794 0.428 -0.386 -0.593 0.554 -0.603 -0.907 0.365
Demographic variablesPct. black population 65+ yrs 1990 -0.660 -0.773 0.440 -0.673 -0.798 0.426 -1.404 -1.649 0.100 -1.382 -1.636 0.103Pct. white population 65+ yrs 1990 1.747 3.233 0.001 1.758 3.278 0.001 0.841 1.556 0.121 0.849 1.576 0.116Pct. households black 1990 0.909 3.458 0.001 0.947 3.692 0.000 0.914 3.475 0.001 0.970 3.771 0.000Pct. chg black pop 1980-90 -0.360 -4.474 0.000 -0.338 -4.245 0.000 -0.252 -3.148 0.002 -0.230 -2.891 0.004Black concentration in VLI bracket, 1990 0.175 2.665 0.008 0.186 2.844 0.005 0.101 1.583 0.115 0.110 1.722 0.086Pct. households Hispanic 1990 0.094 0.421 0.674 0.124 0.559 0.576 0.438 1.955 0.052 0.468 2.097 0.037Pct. chg Hispanic pop 1980-90 0.049 1.057 0.291 0.066 1.408 0.160 -0.050 -1.062 0.289 -0.034 -0.716 0.474Hispanic concentration in VLI bracket, 1990 0.064 1.168 0.244 0.055 0.998 0.319 0.091 1.657 0.099 0.082 1.494 0.136
Economic structure variablesShift, pct. of employmt in mfg., 1982-92 -0.008 -2.042 0.042 -0.007 -1.836 0.068 -0.006 -1.667 0.097 -0.006 -1.499 0.135
Adjusted R Square 0.787 0.790 0.781 0.783Std. Error of the Estimate 0.238 0.237 0.238 0.237
Boldface indicates p<0.10.

Table 12. Means and standard deviations, Regressions of Hispanic economic and racial segregation
Dependent variables Mean Std. Dev.• Logit D: VLI/NVLI Hispanic h'holds 1990 -0.305 0.747• Logit D: VLI Hispanic h'holds/all Anglos 1990 0.410 0.564• Logit D: NVLI Hispanic h'holds/all Anglos 1990 -0.446 0.418Sprawl/density variables• Household density 1982 1.710 1.105• Sprawly growth 0.034 0.611• Dense growth 0.077 0.847• Pct. chg households 1980-90 0.193 0.152• Pct. chg household density, 1982-92 -0.055 0.1161980 lagged variables• Logit D: VLI/NVLI Hispanic families 1980 -0.258 0.679• Logit D: VLI Hispanic families/all Anglos 1980 0.687 0.611• Logit D: NVLI Hispanic families/all Anglos 1980 -0.053 0.564Income variables• Logit D: VLI/NVLI all households 1990 -0.995 0.266• Logit D: VLI/NVLI Hispanic households 1990 -0.305 0.747• Median family income 1990 ($10K) 3.525 0.673• Pct. families VLI 1990 0.197 0.023• Shift, share of Hispanics in VLI bracket 1980-90 -0.002 0.020Demographic variables• Pct. Hispanic population 65+ yrs 1990 0.048 0.019• Pct. white population 65+ yrs 1990 0.131 0.037• Pct. households black 1990 0.094 0.087• Pct. chg black pop 1980-90 0.295 0.345• Black concentration in VLI bracket, 1990 1.702 0.317• Pct. households Hispanic 1990 0.069 0.120• Pct. chg Hispanic pop 1980-90 0.531 0.472• Hispanic concentration in VLI bracket, 1990 1.289 0.329Economic structure variables• Shift, pct. of employmt in mfg., 1982-92 -5.833 4.153Immigration variables
Pct of persons foreign born 1990 0.061 0.064Pct. of foreign born persons entered 1980-90, 1990 0.380 0.116
N=254 for all regressions.

Table 13. Results, Economic Segregation Regressions, VLI vs. non-VLI HispanicsDependent variable: Logit transformed Dissimilarity index, VLI vs. non-VLI Hispanic households, 1990
1. Growth character 2. Growth vs. densityB t Sig. B t Sig.
Constant 0.812 1.652 0.100 0.776 1.584 0.115Sprawl/density variables
Household density 1982 0.006 0.212 0.832 0.010 0.322 0.748Sprawly growth -0.014 -0.273 0.785Dense growth 0.054 1.339 0.182Pct. chg households 1980-90 0.268 1.227 0.221Pct. chg household density, 1982-92 0.296 1.054 0.293
1980 lagged variablesLogit D: VLI/NVLI Hispanic families 1980 0.617 12.993 0.000 0.621 13.071 0.000
Income variablesLogit D: VLI/NVLI all households 1990 0.199 1.703 0.090 0.199 1.701 0.090Median family income 1990 ($10K) -0.033 -0.567 0.571 -0.030 -0.515 0.607Pct. families VLI 1990 -1.594 -0.903 0.367 -1.537 -0.892 0.373Shift, share of Hispanics in VLI bracket 1980-90 3.121 2.119 0.035 3.272 2.216 0.028
Demographic variablesPct. Hispanic population 65+ yrs 1990 2.139 1.248 0.213 1.822 1.055 0.293Pct. white population 65+ yrs 1990 0.915 0.932 0.353 0.972 0.990 0.323Pct. households black 1990 0.273 0.605 0.546 0.230 0.514 0.608Pct. chg black pop 1980-90 0.003 0.039 0.969 -0.007 -0.083 0.934Black concentration in VLI bracket, 1990 -0.031 -0.371 0.711 -0.030 -0.369 0.713Pct. households Hispanic 1990 -0.444 -1.039 0.300 -0.453 -1.083 0.280Pct. chg Hispanic pop 1980-90 -0.467 -5.573 0.000 -0.494 -5.786 0.000Hispanic concentration in VLI bracket, 1990 -0.270 -3.029 0.003 -0.261 -2.945 0.004
Economic structure variablesShift, pct. of employmt in mfg., 1982-92 -0.018 -2.587 0.010 -0.019 -2.666 0.008
Immigration variablesPct of persons foreign born 1990 -1.792 -2.176 0.031 -1.770 -2.171 0.031Pct. of foreign born persons entered 1980-90, 1990 0.251 0.904 0.367 0.228 0.824 0.411
Adjusted R Square 0.756 0.757Std. Error of the Estimate 0.369 0.368
Boldface indicates p<0.10.

Table 14. Results, Racial Segregation Regressions, VLI blacks vs. all whitesDependent variable: Logit transformed Dissimilarity index, VLI or non-VLI Hispanics households vs. all Anglo residents, 1990
Very low income Hispanics vs. all whites Non-VLI Hispanics vs. all whites1. Growth character 2. Growth vs. density 1. Growth character 2. Growth vs. density
B t Sig. B t Sig. B t Sig. B t Sig. Constant -0.613 -1.792 0.074 -0.660 -1.924 0.056 -1.379 -4.535 0.000 -1.413 -4.625 0.000Sprawl/density variables
Household density 1982 0.003 0.118 0.906 0.003 0.126 0.900 -0.012 -0.553 0.580 -0.012 -0.573 0.567Sprawly growth -0.007 -0.182 0.856 0.002 0.014 0.989Dense growth -0.038 -1.187 0.236 -0.177 -0.820 0.413Pct. chg households 1980-90 -0.006 -0.171 0.865 -0.048 -0.309 0.757Pct. chg household density, 1982-92 -0.037 -1.312 0.191 -0.170 -0.882 0.378
1980 lagged variablesLogit D: VLI Hispanic families/all Anglos 1980 0.409 8.157 0.000 0.420 8.176 0.000Logit D: NVLI Hispanic families/all Anglos 1980 0.415 9.926 0.000 0.419 9.921 0.000
Income variablesLogit D: VLI/NVLI Hispanic households 1990 0.376 7.614 0.000 0.369 7.387 0.000 0.060 1.439 0.151 0.057 1.358 0.176Median family income 1990 ($10K) 0.143 3.265 0.001 0.143 3.255 0.001 0.037 0.947 0.345 0.037 0.949 0.343Pct. families VLI 1990 -0.324 -0.235 0.814 -0.018 -0.013 0.990 -0.303 -0.247 0.805 -0.068 -0.056 0.955Shift, share of Hispanics in VLI bracket 1980-90 -0.461 -0.398 0.691 -0.370 -0.316 0.752 -1.605 -1.558 0.121 -1.571 -1.511 0.132
Demographic variablesPct. Hispanic population 65+ yrs 1990 -5.807 -4.228 0.000 -5.980 -4.332 0.000 -2.220 -1.838 0.067 -2.338 -1.921 0.056Pct. white population 65+ yrs 1990 3.645 4.711 0.000 3.653 4.713 0.000 2.614 3.829 0.000 2.625 3.837 0.000Pct. households black 1990 0.387 1.173 0.242 0.305 0.931 0.353 0.873 3.025 0.003 0.825 2.880 0.004Pct. chg black pop 1980-90 -0.182 -2.862 0.005 -0.196 -3.123 0.002 -0.089 -1.549 0.123 -0.099 -1.741 0.083Black concentration in VLI bracket, 1990 -0.044 -0.678 0.498 -0.041 -0.628 0.531 0.015 0.264 0.792 0.019 0.328 0.743Pct. households Hispanic 1990 1.414 4.208 0.000 1.329 4.021 0.000 0.518 1.753 0.081 0.460 1.585 0.114Pct. chg Hispanic pop 1980-90 -0.129 -1.887 0.060 -0.156 -2.209 0.028 -0.083 -1.362 0.174 -0.098 -1.577 0.116Hispanic concentration in VLI bracket, 1990 0.180 2.349 0.020 0.182 2.365 0.019 0.393 6.060 0.000 0.397 6.112 0.000
Economic structure variablesShift, pct. of employmt in mfg., 1982-92 -0.009 -1.577 0.116 -0.009 -1.599 0.111 -0.006 -1.166 0.245 -0.006 -1.170 0.243
Immigration variablesPct of persons foreign born 1990 0.267 0.418 0.676 0.360 0.567 0.571 1.120 1.965 0.051 1.188 2.100 0.037Pct. of foreign born entered 1980-90, 1990 -0.066 -0.304 0.761 -0.091 -0.423 0.673 0.009 0.044 0.965 -0.011 -0.055 0.956
Adjusted R Square 0.740 0.739 0.625 0.624Std. Error of the Estimate 0.287 0.288 0.256 0.257
Boldface indicates p<0.10.

Table 15. Means and Standard Deviations, Regressions of white economic and racial segregationMean Std. Deviation
Dependent variables• Logit D: VLI/NVLI white h'holds 1990 -1.156 0.258Sprawl/density variables• Household density 1982 1.650 1.006• Sprawly growth 0.001 0.575• Dense growth 0.001 0.819• Pct. chg households 1980-90 0.176 0.146• Pct. chg household density, 1982-92 -0.060 0.1111980 lagged variables• Logit D: VLI/NVLI white families 1980 -1.218 0.274Income variables• Median family income 1990 ($10K) 3.469 0.634• Pct. families VLI 1990 0.196 0.023• Shift, share of whites in VLI bracket 1980-90 0.084 0.070Demographic variables• Pct. white population 65+ yrs 1990 0.133 0.035• Pct. households black 1990 0.090 0.086• Pct. chg black pop 1980-90 0.289 0.364• Black concentration in VLI bracket, 1990 1.715 0.320• Pct. households Hispanic 1990 0.056 0.110• Pct. chg Hispanic pop 1980-90 0.477 0.466• Hispanic concentration in VLI bracket, 1990 1.278 0.338Economic structure variables• Shift, pct. of employmt in mfg., 1982-92 -6.393 4.499
N=317 for all variables.

Table 16. Results, Economic Segregation Regressions, VLI vs. non-VLI HispanicsDependent variable: Logit transformed Dissimilarity index, VLI vs. non-VLI Hispanic households, 1990
1. Growth character 2. Growth vs. densityB t Sig. B t Sig.
Constant -0.339 -1.838 0.067 -0.315 -1.703 0.090Sprawl/density variables
Household density 1982 0.011 1.023 0.307 0.012 1.060 0.290Sprawly growth -0.002 -0.137 0.891Dense growth 0.040 2.794 0.006Pct. chg households 1980-90 0.102 1.240 0.216Pct. chg household density, 1982-92 0.206 2.114 0.035
1980 lagged variablesLogit D: VLI/NVLI white families 1980 0.695 17.711 0.000 0.696 17.734 0.000
Income variablesMedian family income 1990 ($10K) 0.032 1.606 0.109 0.031 1.583 0.115Pct. families VLI 1990 0.341 0.525 0.600 0.212 0.330 0.742Shift, share of whites in VLI bracket 1980-90 0.096 0.589 0.556 0.105 0.643 0.521
Demographic variablesPct. white population 65+ yrs 1990 -0.878 -2.832 0.005 -0.892 -2.880 0.004Pct. households black 1990 0.050 0.329 0.742 0.069 0.462 0.645Pct. chg black pop 1980-90 0.025 0.855 0.393 0.028 0.959 0.338Black concentration in VLI bracket, 1990 -0.015 -0.514 0.608 -0.016 -0.549 0.583Pct. households Hispanic 1990 -0.183 -1.598 0.111 -0.170 -1.493 0.136Pct. chg Hispanic pop 1980-90 -0.020 -0.753 0.452 -0.018 -0.652 0.515Hispanic concentration in VLI bracket, 1990 -0.023 -0.764 0.446 -0.026 -0.843 0.400
Economic structure variablesShift, pct. of employmt in mfg., 1982-92 -0.001 -0.499 0.618 -0.001 -0.476 0.635
Adjusted R Square 0.633 0.632Std. Error of the Estimate 0.156 0.157
Boldface indicates p<0.10.
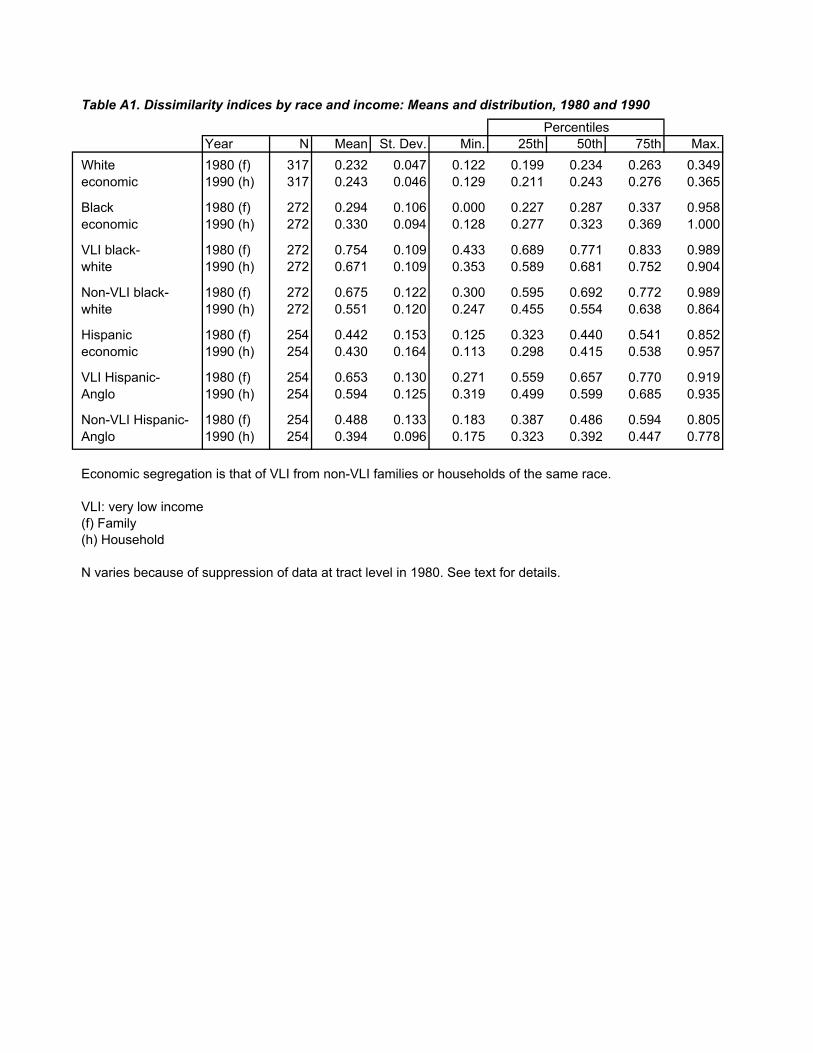
Table A1. Dissimilarity indices by race and income: Means and distribution, 1980 and 1990Percentiles
Year N Mean St. Dev. Min. 25th 50th 75th Max.White 1980 (f) 317 0.232 0.047 0.122 0.199 0.234 0.263 0.349economic 1990 (h) 317 0.243 0.046 0.129 0.211 0.243 0.276 0.365
Black 1980 (f) 272 0.294 0.106 0.000 0.227 0.287 0.337 0.958economic 1990 (h) 272 0.330 0.094 0.128 0.277 0.323 0.369 1.000
VLI black- 1980 (f) 272 0.754 0.109 0.433 0.689 0.771 0.833 0.989white 1990 (h) 272 0.671 0.109 0.353 0.589 0.681 0.752 0.904
Non-VLI black- 1980 (f) 272 0.675 0.122 0.300 0.595 0.692 0.772 0.989white 1990 (h) 272 0.551 0.120 0.247 0.455 0.554 0.638 0.864
Hispanic 1980 (f) 254 0.442 0.153 0.125 0.323 0.440 0.541 0.852economic 1990 (h) 254 0.430 0.164 0.113 0.298 0.415 0.538 0.957
VLI Hispanic- 1980 (f) 254 0.653 0.130 0.271 0.559 0.657 0.770 0.919Anglo 1990 (h) 254 0.594 0.125 0.319 0.499 0.599 0.685 0.935
Non-VLI Hispanic- 1980 (f) 254 0.488 0.133 0.183 0.387 0.486 0.594 0.805Anglo 1990 (h) 254 0.394 0.096 0.175 0.323 0.392 0.447 0.778
Economic segregation is that of VLI from non-VLI families or households of the same race.
VLI: very low income(f) Family(h) Household
N varies because of suppression of data at tract level in 1980. See text for details.

0%
10%
20%
30%
40%
50%
60%
70%
80%
90%
100%
White 1980 White 1990 Black 1980 Black 1990 Hispanic 1980 Hispanic 1990
>120%50-120%<50%
Figure 1. The shrinking middle in racial perspective: Family (1980) and household (1990)income as percent of regional median, 1980 and 1990, US Metro Areas
Perc
ent o
f hou
seho
lds
or fa
mili
es
Percent of area median income
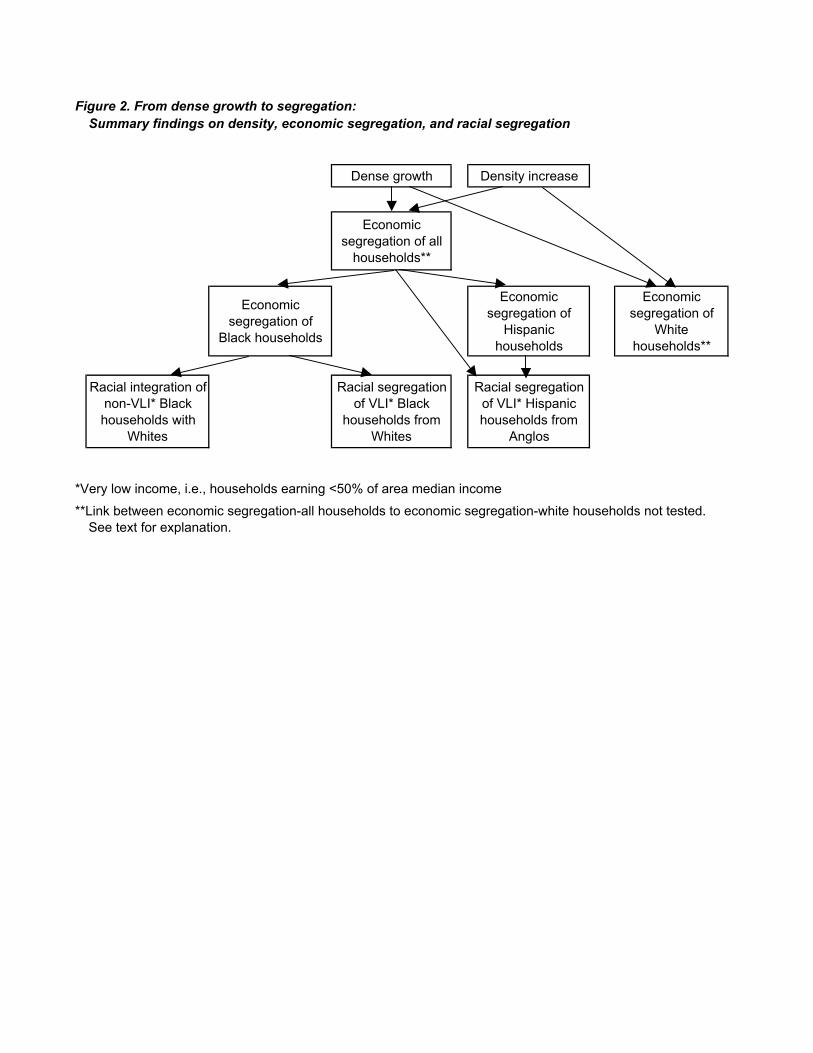
Figure 2. From dense growth to segregation: Summary findings on density, economic segregation, and racial segregation
Dense growth Density increase
Economic segregation of all
households**
Economic segregation of
Black households
Economic segregation of
Hispanic households
Economic segregation of
White households**
Racial integration of non-VLI* Black households with
Whites
Racial segregation of VLI* Black
households from Whites
Racial segregation of VLI* Hispanic households from
Anglos
*Very low income, i.e., households earning <50% of area median income**Link between economic segregation-all households to economic segregation-white households not tested.
See text for explanation.