Role of Triglyceride-enriched Lipoproteins in...
47
Highlights from Lipid Forum 2015: Focus on Hypertriglyceridemia © 2015 Vindico Medical Education Please note: Activity presentations are considered intellectual property. These slides may not be published or posted online without permission from Vindico Medical Education ([email protected]). Please be respectful of this request so we may continue to provide you with presentation materials. Role of Triglyceride-enriched Lipoproteins in Atherogenesis Peter P. Toth, MD, PhD, FAAFP, FICA, FNLA, FCCP, FAHA, FACC Director of Preventative Cardiology CGH Medical Center, Sterling, Illinois Professor of Clinical Family and Community Medicine University of Illinois School of Medicine, Peoria, Illinois Professor of Clinical Medicine Michigan State University College of Osteopathic Medicine East Lansing, Michigan Adjunct Associate Professor Johns Hopkins University School of Medicine, Baltimore, Maryland Triglycerides and Remnant Lipoproteins • Severe hypertriglyceridemia is an established risk factor for pancreatitis. • Elevated triglycerides also correlate with increased risk for acute cardiovascular events. • Triglycerides are hydrophobic and do not circulate freely. They are carried in plasma by lipoproteins. • Hypertriglyceridemia is associated with elevated remnant lipoproteins. • A remnant lipoprotein is a lipoprotein whose triglyceride content is incompletely hydrolyzed, thereby preventing its progressive conversion to smaller lipoproteins (ie, VLDL to IDL to LDL). • Though definitions may vary, in the nonfasting state, remnants include chylomicron remnants, VLDL remnants, and IDL; in the fasting state VLDL remnants (principally small VLDL3 and IDL). • Remnants could be atherogenic because of both cholesterol and triglyceride components are carried into subendothelial space. Triglycerides are a source of diacylglycerol and free fatty acid, both of which can participate in augmenting the inflammatory response.
Transcript of Role of Triglyceride-enriched Lipoproteins in...
Highlights from Lipid Forum 2015: Focus on Hypertriglyceridemia
© 2015 Vindico Medical Education
Please note: Activity presentations are
considered intellectual property. These slides
may not be published or posted online without
permission from Vindico Medical Education
Please be respectful of this request so we may
continue to provide you with presentation
materials.
Role of Triglyceride-enriched
Lipoproteins in Atherogenesis
Peter P. Toth, MD, PhD, FAAFP, FICA, FNLA,
FCCP, FAHA, FACC Director of Preventative Cardiology
CGH Medical Center, Sterling, Illinois
Professor of Clinical Family and Community Medicine
University of Illinois School of Medicine, Peoria, Illinois
Professor of Clinical Medicine
Michigan State University College of Osteopathic Medicine
East Lansing, Michigan
Adjunct Associate Professor
Johns Hopkins University School of Medicine, Baltimore, Maryland
Triglycerides and Remnant
Lipoproteins
• Severe hypertriglyceridemia is an established risk factor for pancreatitis.
• Elevated triglycerides also correlate with increased risk for acute cardiovascular events.
• Triglycerides are hydrophobic and do not circulate freely. They are carried in plasma by lipoproteins.
• Hypertriglyceridemia is associated with elevated remnant lipoproteins.
• A remnant lipoprotein is a lipoprotein whose triglyceride content is incompletely hydrolyzed, thereby preventing its progressive conversion to smaller lipoproteins (ie, VLDL to IDL to LDL).
• Though definitions may vary, in the nonfasting state, remnants include chylomicron remnants, VLDL remnants, and IDL; in the fasting state VLDL remnants (principally small VLDL3 and IDL).
• Remnants could be atherogenic because of both cholesterol and triglyceride components are carried into subendothelial space. Triglycerides are a source of diacylglycerol and free fatty acid, both of which can participate in augmenting the inflammatory response.
Highlights from Lipid Forum 2015: Focus on Hypertriglyceridemia
© 2015 Vindico Medical Education
Remnant Lipoprotein Cholesterol
• Lipoprotein cholesterol as a function of increasing
levels of nonfasting triglycerides
– Increased levels of plasma triglycerides were
associated with increased levels of remnant cholesterol
and with reduced levels of HDL cholesterol, while
association with LDL cholesterol was less pronounced
Varbo A, et al. J Am Coll Cardiol. 2013;61:427–436.
Remnant Lipoproteins (RLPs)
• Serum lipids are measured typically after 8-12 hours of fasting.
• In Western societies, during routine daily living, the majority of people are
persistently post-prandial. In fact, meals tend to be consumed before the
lipids and lipoproteins from the preceding meal are fully metabolized and
cleared from the circulation.
• Consequently, we are exposed to much higher levels of RLPs and in a
more persistent manner than what is suggested by the results of studies
using fasting lipid samples.
• This would be especially true of patients afflicted with genetic variants of
hypertriglyceridemia (familial combined hyperlipidemia, familial
hypertriglyceridemia, a variety of lipoprotein lipase deficiency states),
insulin resistance, or established diabetes mellitus. As found in adults,
RLPs are elevated in obese or diabetic children and adolescents.
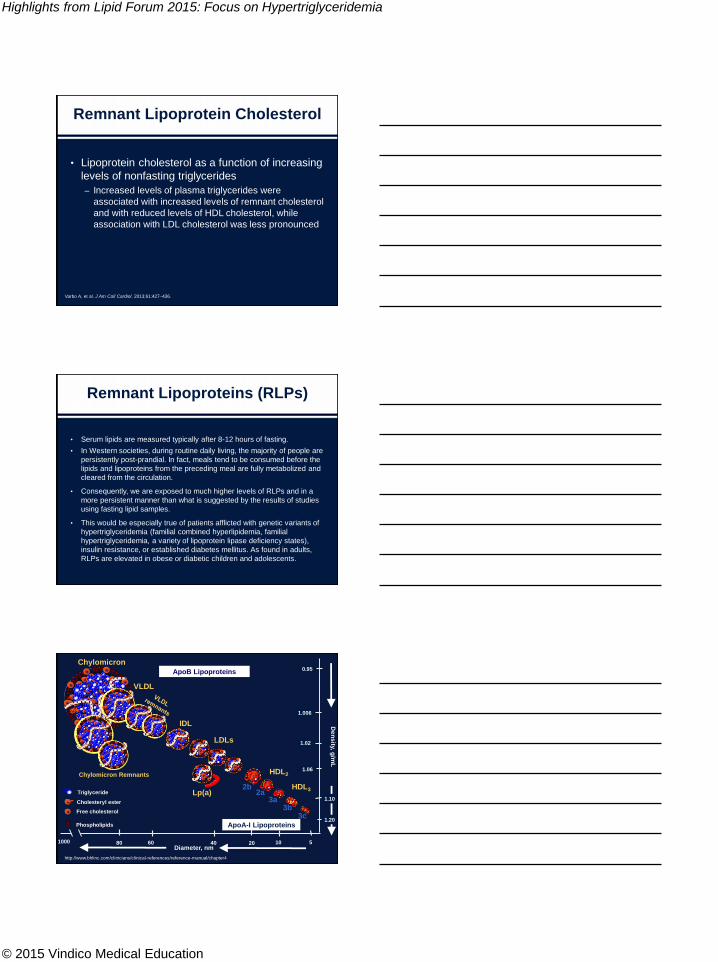
VLDL
IDL
LDLs
ApoB Lipoproteins
Chylomicron
HDL3
HDL2
ApoA-I Lipoproteins
Triglyceride
Free cholesterol
Cholesteryl ester
De
ns
ity, g/m
L
Diameter, nm5
2a2b
3b3a
3c
1020406080
1.02
1.006
0.95
Chylomicron Remnants1.06
Lp(a)1.10
1.20Phospholipids
1000
http://www.bhlinc.com/clinicians/clinical-references/reference-manual/chapter4
Highlights from Lipid Forum 2015: Focus on Hypertriglyceridemia
© 2015 Vindico Medical Education
VLDL
IDL
LDLs
ApoB Lipoproteins
Chylomicron
HDL3
HDL2
ApoA-I Lipoproteins
Triglyceride
Free cholesterol
Cholesteryl ester
De
ns
ity, g/m
L
Diameter, nm5
2a2b
3b3a
3c
1020406080
1.02
1.006
0.95
Chylomicron Remnants1.06
Lp(a)1.10
1.20Phospholipids
1000
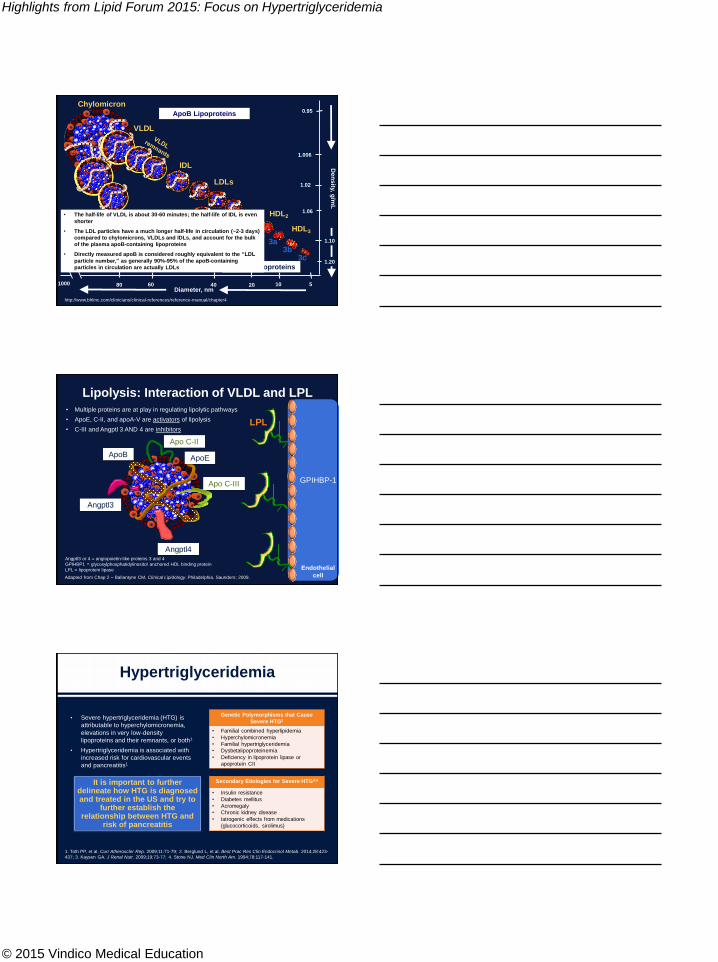
• The half-life of VLDL is about 30-60 minutes; the half-life of IDL is even
shorter
• The LDL particles have a much longer half-life in circulation (~2-3 days)
compared to chylomicrons, VLDLs and IDLs, and account for the bulk
of the plasma apoB-containing lipoproteins
• Directly measured apoB is considered roughly equivalent to the “LDL
particle number,” as generally 90%-95% of the apoB-containing
particles in circulation are actually LDLs
http://www.bhlinc.com/clinicians/clinical-references/reference-manual/chapter4
LPL
Apo C-III
ApoB
Apo C-II
ApoE
Angptl4
Angptl3
GPIHBP-1
Endothelial
cell
Angptl3 or 4 = angiopoietin-like proteins 3 and 4
GPIHBP1 = glycosylphosphatidylinositol anchored HDL binding protein
LPL = lipoprotein lipase
• Multiple proteins are at play in regulating lipolytic pathways
• ApoE, C-II, and apoA-V are activators of lipolysis
• C-III and Angptl 3 AND 4 are inhibitors
Lipolysis: Interaction of VLDL and LPL
Adapted from Chap 2 – Ballantyne CM. Clinical Lipidology. Philadelphia. Saunders; 2009.
Hypertriglyceridemia
• Severe hypertriglyceridemia (HTG) is
attributable to hyperchylomicronemia,
elevations in very low-density
lipoproteins and their remnants, or both1
• Hypertriglyceridemia is associated with
increased risk for cardiovascular events
and pancreatitis1
Genetic Polymorphisms that Cause
Severe HTG2
• Familial combined hyperlipidemia
• Hyperchylomicronemia
• Familial hypertriglyceridemia
• Dysbetalipoproteinemia
• Deficiency in lipoprotein lipase or
apoprotein CII
Secondary Etiologies for Severe HTG3,4
• Insulin resistance
• Diabetes mellitus
• Acromegaly
• Chronic kidney disease
• Iatrogenic effects from medications
(glucocorticoids, sirolimus)
It is important to further delineate how HTG is diagnosed and treated in the US and try to
further establish the relationship between HTG and
risk of pancreatitis
1. Toth PP, et al. Curr Atheroscler Rep. 2009;11:71-79; 2. Berglund L, et al. Best Prac Res Clin Endocrinol Metab. 2014;28:423-
437; 3. Kaysen GA. J Renal Nutr. 2009;19:73-77; 4. Stone NJ. Med Clin North Am. 1994;78:117-141.
Highlights from Lipid Forum 2015: Focus on Hypertriglyceridemia
© 2015 Vindico Medical Education
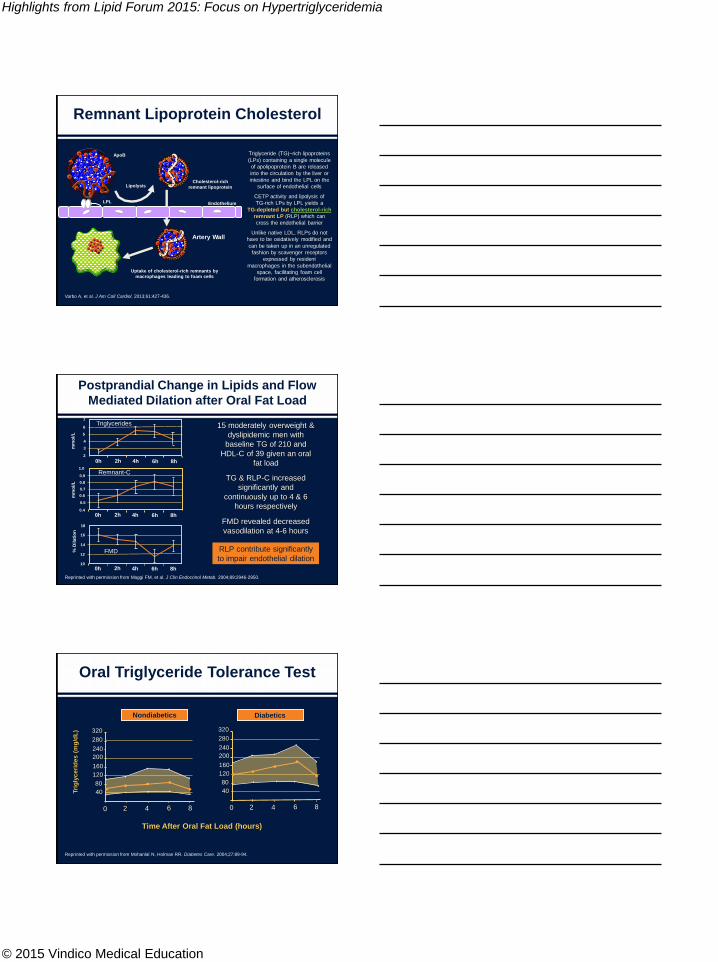
Triglyceride (TG)–rich lipoproteins
(LPs) containing a single molecule
of apolipoprotein B are released
into the circulation by the liver or
intestine and bind the LPL on the
surface of endothelial cells
CETP activity and lipolysis of
TG-rich LPs by LPL yields a
TG-depleted but cholesterol-rich
remnant LP (RLP) which can
cross the endothelial barrier
Unlike native LDL, RLPs do not
have to be oxidatively modified and
can be taken up in an unregulated
fashion by scavenger receptors
expressed by resident
macrophages in the subendothelial
space, facilitating foam cell
formation and atherosclerosis
Remnant Lipoprotein Cholesterol
Varbo A, et al. J Am Coll Cardiol. 2013;61:427-436.
Artery Wall
Endothelium
Lipolysis
LPL
ApoB
Cholesterol-rich
remnant lipoprotein
Uptake of cholesterol-rich remnants by
macrophages leading to foam cells
Postprandial Change in Lipids and Flow
Mediated Dilation after Oral Fat Load
Reprinted with permission from Maggi FM, et al. J Clin Endocrinol Metab. 2004;89:2946-2950.
0h 2h 4h 6h 8h
0h 2h 4h 6h 8h
0h 2h 4h 6h 8h2
3
4
5
6
7
10
12
14
16
18
0.4
0.7
0.8
0.9
1.0
0.6
0.5
mm
ol/L
% D
ilati
on
mm
ol/L
FMD
Remnant-C
Triglycerides 15 moderately overweight &
dyslipidemic men with
baseline TG of 210 and
HDL-C of 39 given an oral
fat load
TG & RLP-C increased
significantly and
continuously up to 4 & 6
hours respectively
FMD revealed decreased
vasodilation at 4-6 hours
RLP contribute significantly
to impair endothelial dilation
Oral Triglyceride Tolerance Test
Reprinted with permission from Mohanlal N, Holman RR. Diabetes Care. 2004;27:89-94.
Time After Oral Fat Load (hours)
Nondiabetics Diabetics
80
40Tri
gly
ce
rid
es
(m
g/d
L)
0 2 4 6 8
320
280
240
200
120
160
80
40
0 2 4 6 8
320
280
240
200
120
160
Highlights from Lipid Forum 2015: Focus on Hypertriglyceridemia
© 2015 Vindico Medical Education
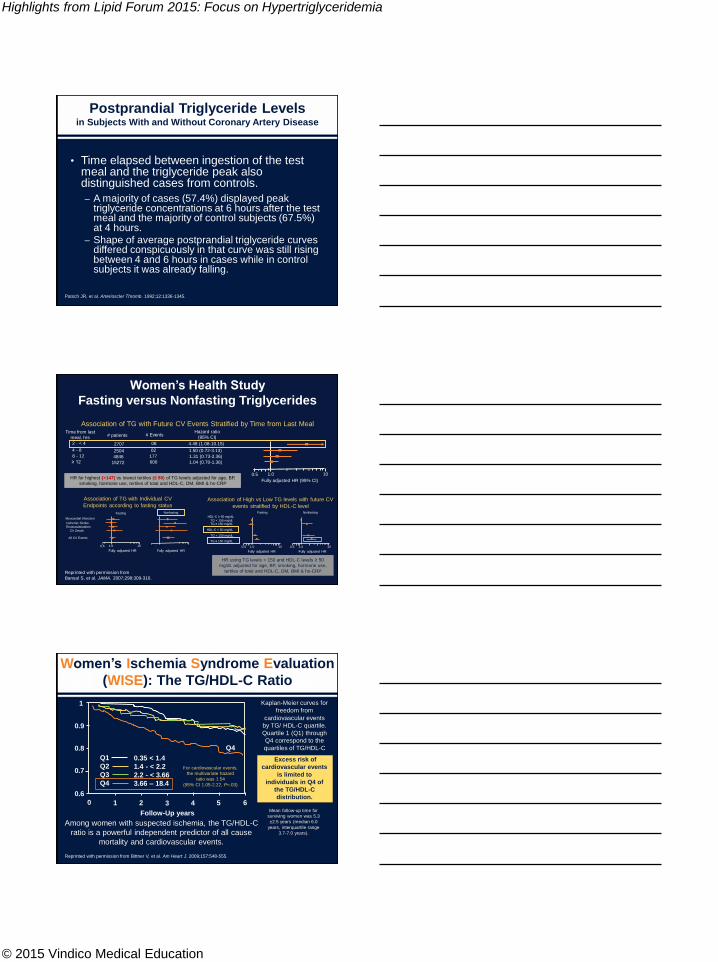
Postprandial Triglyceride Levelsin Subjects With and Without Coronary Artery Disease
• Time elapsed between ingestion of the test meal and the triglyceride peak also distinguished cases from controls.
– A majority of cases (57.4%) displayed peak triglyceride concentrations at 6 hours after the test meal and the majority of control subjects (67.5%) at 4 hours.
– Shape of average postprandial triglyceride curves differed conspicuously in that curve was still rising between 4 and 6 hours in cases while in control subjects it was already falling.
Patsch JR, et al. Arterioscler Thromb. 1992;12:1336-1345.
Women’s Health Study
Fasting versus Nonfasting Triglycerides
Reprinted with permission from
Bansal S, et al. JAMA. 2007;298:309-316.
Association of TG with Future CV Events Stratified by Time from Last MealTime from last
meal, hrs# patients # Events
Hazard ratio
(95% CI)
2 - < 4
4 - 8
8 - 12
≥ 12
2707
2504
4846
15272
08
02
177
600
4.48 (1.08-10.15)
1.50 (0.72-3.13)
1.31 (0.73-2.36)
1.04 (0.70-1.36)
Fully adjusted HR (95% CI)
101.00.5HR for highest (>147) vs lowest tertiles (≤ 90) of TG levels adjusted for age, BP,
smoking, hormone use, tertiles of total and HDL-C, DM, BMI & hs-CRP
0.5 1.0 10
Fully adjusted HR
0.5 1.0 10
Fully adjusted HR0.5 1.0 10
Fully adjusted HR
Myocardial Infarction
Ischemic Stroke
Revascularization
CV Death
All CV Events
Fasting NonfastingFasting
0.5 1.0 10
Fully adjusted HR
HDL-C ≥ 50 mg/dL
TG < 150 mg/dLTG ≥ 150 mg/dL
Association of TG with Individual CV
Endpoints according to fasting statusAssociation of High vs Low TG levels with future CV
events stratified by HDL-C level
HR using TG levels < 150 and HDL-C levels ≥ 50
mg/dL adjusted for age, BP, smoking, hormone use,
tertiles of total and HDL-C, DM, BMI & hs-CRP
TG < 150 mg/dL
HDL-C < 50 mg/dL
Nonfasting
TG ≥ 150 mg/dL
Women’s Ischemia Syndrome Evaluation
(WISE): The TG/HDL-C Ratio
Reprinted with permission from Bittner V, et al. Am Heart J. 2009;157:548-555.
Among women with suspected ischemia, the TG/HDL-C
ratio is a powerful independent predictor of all cause
mortality and cardiovascular events.
Kaplan-Meier curves for
freedom from
cardiovascular events
by TG/ HDL-C quartile.
Quartile 1 (Q1) through
Q4 correspond to the
quartiles of TG/HDL-C
Excess risk of
cardiovascular events
is limited to
individuals in Q4 of
the TG/HDL-C
distribution.
Mean follow-up time for
surviving women was 5.3
±2.5 years (median 6.0
years, interquartile range
3.7-7.0 years).
0 1 2 3 4 5 6
0.9
1
0.8
0.7
0.6
Follow-Up years
Q1
Q2
Q3
Q4
0.35 < 1.4
1.4 - < 2.2
2.2 - < 3.66
3.66 – 18.4
For cardiovascular events,
the multivariate hazard
ratio was 1.54
(95% CI 1.05-2.22, P=.03)
Q4
Highlights from Lipid Forum 2015: Focus on Hypertriglyceridemia
© 2015 Vindico Medical Education
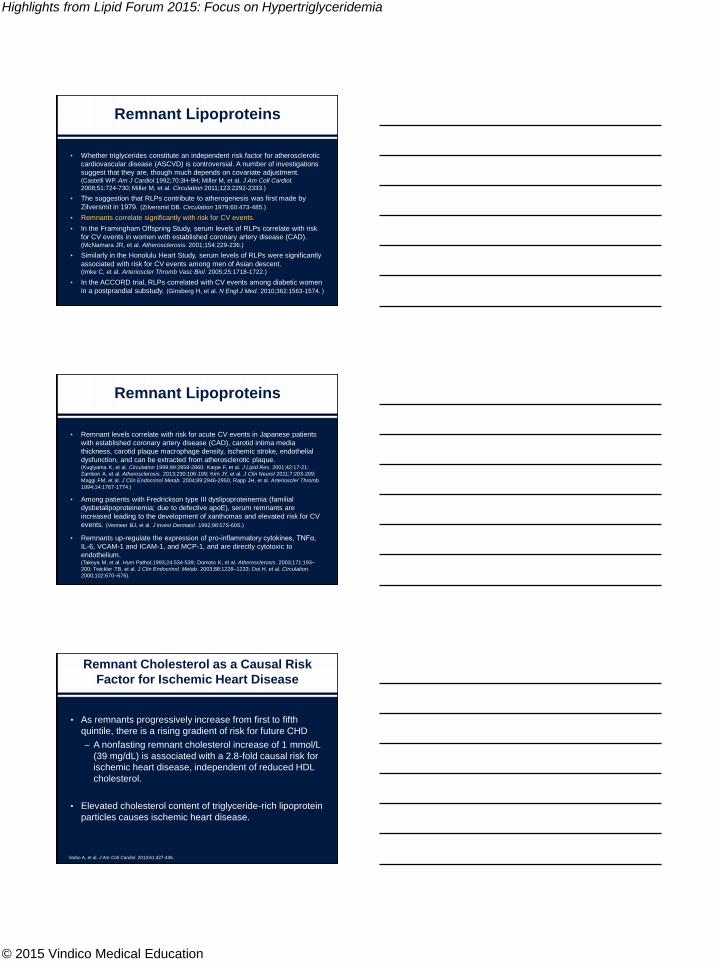
Remnant Lipoproteins
• Whether triglycerides constitute an independent risk factor for atherosclerotic
cardiovascular disease (ASCVD) is controversial. A number of investigations
suggest that they are, though much depends on covariate adjustment. (Castelli WP. Am J Cardiol 1992;70:3H-9H; Miller M, et al. J Am Coll Cardiol.
2008;51:724-730; Miller M, et al. Circulation 2011;123:2292-2333.)
• The suggestion that RLPs contribute to atherogenesis was first made by
Zilversmit in 1979. (Zilversmit DB. Circulation 1979;60:473-485.)
• Remnants correlate significantly with risk for CV events.
• In the Framingham Offspring Study, serum levels of RLPs correlate with risk
for CV events in women with established coronary artery disease (CAD). (McNamara JR, et al. Atherosclerosis. 2001;154:229-236.)
• Similarly in the Honolulu Heart Study, serum levels of RLPs were significantly
associated with risk for CV events among men of Asian descent. (Imke C, et al. Arterioscler Thromb Vasc Biol. 2005;25:1718-1722.)
• In the ACCORD trial, RLPs correlated with CV events among diabetic women
in a postprandial substudy. (Ginsberg H, et al. N Engl J Med. 2010;362:1563-1574. )
Remnant Lipoproteins
• Remnant levels correlate with risk for acute CV events in Japanese patients
with established coronary artery disease (CAD), carotid intima media
thickness, carotid plaque macrophage density, ischemic stroke, endothelial
dysfunction, and can be extracted from atherosclerotic plaque. (Kugiyama K, et al. Circulation 1999;99:2858-2860; Karpe F, et al. J Lipid Res. 2001;42:17-21;
Zambon A, et al. Atherosclerosis. 2013;230:106-109; Kim JY, et al. J Clin Neurol 2011;7:203-209;
Maggi FM, et al. J Clin Endocrinol Metab. 2004;89:2946-2950; Rapp JH, et al. Arterioscler Thromb.
1994;14:1767-1774.)
• Among patients with Fredrickson type III dyslipoproteinemia (familial
dysbetalipoproteinemia; due to defective apoE), serum remnants are
increased leading to the development of xanthomas and elevated risk for CV
events. (Vermeer BJ, et al. J Invest Dermatol. 1992;98:57S-60S.)
• Remnants up-regulate the expression of pro-inflammatory cytokines, TNFα,
IL-6, VCAM-1 and ICAM-1, and MCP-1, and are directly cytotoxic to
endothelium. (Takeya M, et al. Hum Pathol.1993;24:534-539; Domoto K, et al. Atherosclerosis. 2003;171:193–
200; Twickler TB, et al. J Clin Endocrinol. Metab. 2003;88:1228–1233; Doi H, et al. Circulation.
2000;102:670–676).
Remnant Cholesterol as a Causal Risk
Factor for Ischemic Heart Disease
• As remnants progressively increase from first to fifth
quintile, there is a rising gradient of risk for future CHD
– A nonfasting remnant cholesterol increase of 1 mmol/L
(39 mg/dL) is associated with a 2.8-fold causal risk for
ischemic heart disease, independent of reduced HDL
cholesterol.
• Elevated cholesterol content of triglyceride-rich lipoprotein
particles causes ischemic heart disease.
Varbo A, et al. J Am Coll Cardiol. 2013;61:427-436.
Highlights from Lipid Forum 2015: Focus on Hypertriglyceridemia
© 2015 Vindico Medical Education
Association of Nonfasting Remnant Cholesterol
and LDL Cholesterol with C-reactive Protein (CRP)
• 48,250 participants from the Copenhagen general
population study
• Elevated nonfasting remnant cholesterol is causally
associated with low-grade inflammation and with ischemic
heart disease, whereas elevated LDL cholesterol is
associated causally with IHD without inflammation
• As LDL levels progressively there’s a very nonsignificant
relationship between LDL and CRP
– Relationship between remnants and CRP: Significant 37%
increase in CRP as remnant levels rise
Varbo A, et al. Circulation. 2013;128:1298-1309.
Conclusions
• Elevated serum levels of remnant lipoproteins correlate highly with
heightened levels of systemic inflammation and increased risk for acute
cardiovascular events.
• Remnants represent a delivery vehicle for transferring cholesterol and
triglyceride into the subendothelial space where both can potentiate
atherogenesis.
• Clearly based on studies in Copenhagen, nonfasting triglyceride levels
represent a very good surrogate for remnants in serum.
• A host of separation methods can be used to quantify remnants (analytical
ultracentrifugation, ion mobility, electrophoresis, NMR). It will be of interest to
establish how accurately these various technologies estimate and separate
the distinct species of remnant lipoproteins in the serum and correlate each of
these species with cardiovascular outcomes.
• In the meantime, until uniform and widely accepted quantitative approaches
are adopted, the following has simple clinical utility and adds no cost:
– For nonfasting specimens, consider the Copenhagen approach.
– For fasting specimens, consider targeting non-HDL-C.
Secondary Hypertriglyceridemia–
Medications, Dietary and Lifestyle
Indiscretions, and Diseases
Alan S. Brown, MD, FACC, FAHA, FNLADirector, Division of Cardiology
Advocate Lutheran General Hospital
Director, Midwest Heart Disease Prevention Center
Midwest Heart Specialists at Advocate Healthcare
Chicago, IL
Highlights from Lipid Forum 2015: Focus on Hypertriglyceridemia
© 2015 Vindico Medical Education
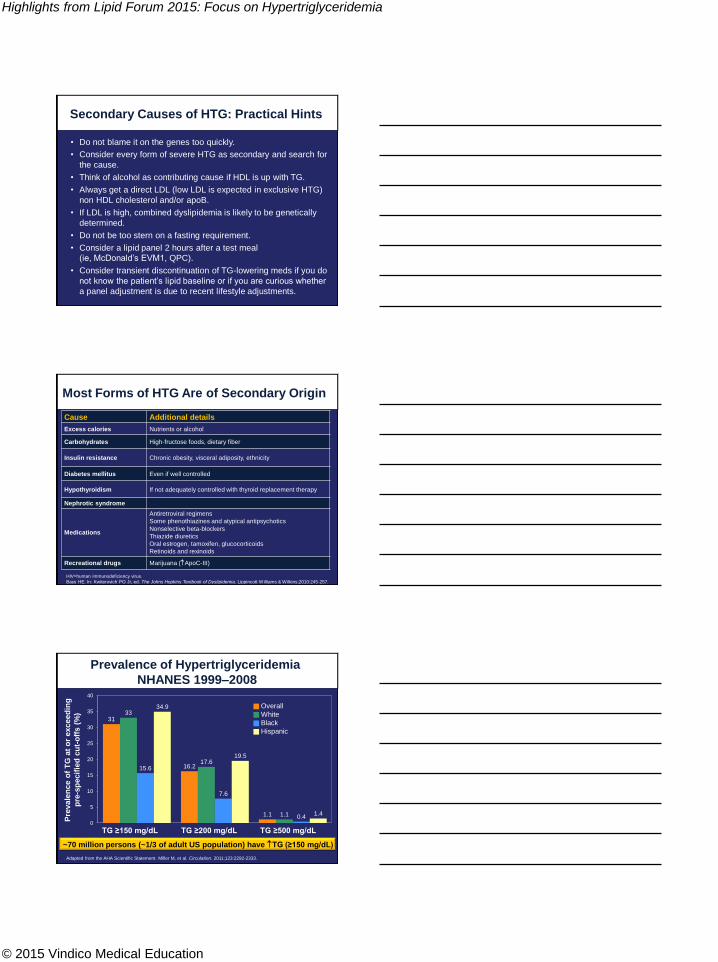
Secondary Causes of HTG: Practical Hints
• Do not blame it on the genes too quickly.
• Consider every form of severe HTG as secondary and search for
the cause.
• Think of alcohol as contributing cause if HDL is up with TG.
• Always get a direct LDL (low LDL is expected in exclusive HTG)
non HDL cholesterol and/or apoB.
• If LDL is high, combined dyslipidemia is likely to be genetically
determined.
• Do not be too stern on a fasting requirement.
• Consider a lipid panel 2 hours after a test meal
(ie, McDonald’s EVM1, QPC).
• Consider transient discontinuation of TG-lowering meds if you do
not know the patient’s lipid baseline or if you are curious whether
a panel adjustment is due to recent lifestyle adjustments.
Most Forms of HTG Are of Secondary Origin
HIV=human immunodeficiency virus.
Bays HE. In: Kwiterovich PO Jr, ed. The Johns Hopkins Textbook of Dyslipidemia. Lippincott Williams & Wilkins;2010:245-257.
Cause Additional details
Excess calories Nutrients or alcohol
Carbohydrates High-fructose foods, dietary fiber
Insulin resistance Chronic obesity, visceral adiposity, ethnicity
Diabetes mellitus Even if well controlled
Hypothyroidism If not adequately controlled with thyroid replacement therapy
Nephrotic syndrome
Medications
Antiretroviral regimens
Some phenothiazines and atypical antipsychotics
Nonselective beta-blockers
Thiazide diuretics
Oral estrogen, tamoxifen, glucocorticoids
Retinoids and rexinoids
Recreational drugs Marijuana (ApoC-III)
Prevalence of Hypertriglyceridemia
NHANES 1999–2008
Adapted from the AHA Scientific Statement. Miller M, et al. Circulation. 2011;123:2292-2333.
31
16.2
1.1
33
17.6
1.1
15.6
7.6
0.4
34.9
19.5
1.4
0
5
10
15
20
25
30
35
40
TG ≥150 mg/dL TG ≥200 mg/dL TG ≥500 mg/dL
~70 million persons (~1/3 of adult US population) have TG (≥150 mg/dL)
Pre
vale
nce o
f T
G a
t o
r exceed
ing
pre
-sp
ecif
ied
cu
t-o
ffs (
%)
Overall
White
Black
Hispanic
Highlights from Lipid Forum 2015: Focus on Hypertriglyceridemia
© 2015 Vindico Medical Education
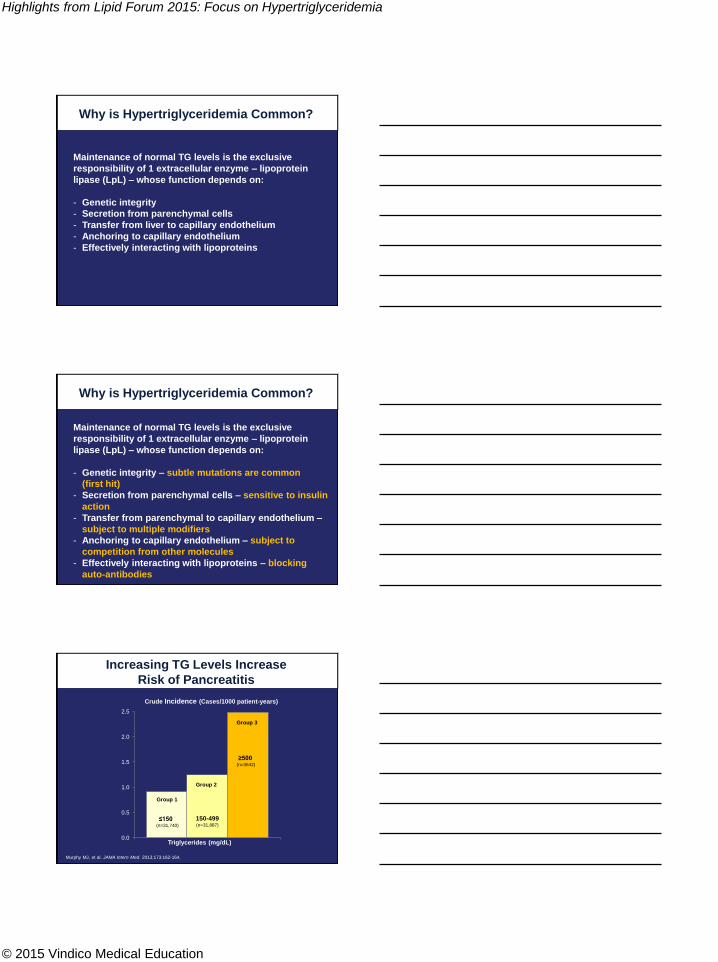
Why is Hypertriglyceridemia Common?
Maintenance of normal TG levels is the exclusive
responsibility of 1 extracellular enzyme – lipoprotein
lipase (LpL) – whose function depends on:
- Genetic integrity
- Secretion from parenchymal cells
- Transfer from liver to capillary endothelium
- Anchoring to capillary endothelium
- Effectively interacting with lipoproteins
Why is Hypertriglyceridemia Common?
Maintenance of normal TG levels is the exclusive
responsibility of 1 extracellular enzyme – lipoprotein
lipase (LpL) – whose function depends on:
- Genetic integrity – subtle mutations are common
(first hit)
- Secretion from parenchymal cells – sensitive to insulin
action
- Transfer from parenchymal to capillary endothelium –
subject to multiple modifiers
- Anchoring to capillary endothelium – subject to
competition from other molecules
- Effectively interacting with lipoproteins – blocking
auto-antibodies
Increasing TG Levels Increase
Risk of Pancreatitis
0.0
0.5
1.0
1.5
2.0
2.5
Crude Incidence (Cases/1000 patient-years)
Triglycerides (mg/dL)
Murphy MJ, et al. JAMA Intern Med. 2013;173:162-164.
≤150 (n=31,740)
150-499(n=31,887)
≥500(n=3642)
Group 1
Group 2
Group 3
Highlights from Lipid Forum 2015: Focus on Hypertriglyceridemia
© 2015 Vindico Medical Education
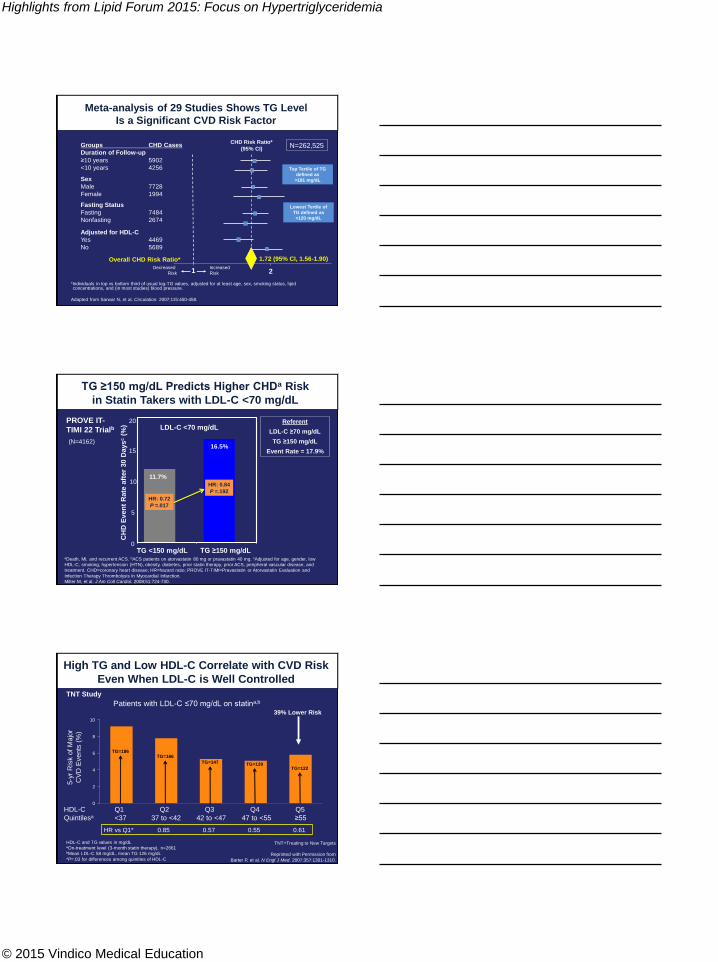
Meta-analysis of 29 Studies Shows TG Level
Is a Significant CVD Risk Factor
*Individuals in top vs bottom third of usual log-TG values, adjusted for at least age, sex, smoking status, lipid concentrations, and (in most studies) blood pressure.
Adapted from Sarwar N, et al. Circulation. 2007;115:450-458.
Groups CHD Cases
Duration of Follow-up
≥10 years 5902
<10 years 4256
Sex
Male 7728
Female 1994
Fasting Status
Fasting 7484
Nonfasting 2674
Adjusted for HDL-C
Yes 4469
No 5689
Overall CHD Risk Ratio*
Decreased
Risk
CHD Risk Ratio*
(95% CI)
1.72 (95% CI, 1.56-1.90)
21Increased
Risk
N=262,525
Top Tertile of TG
defined as
>181 mg/dL
Lowest Tertile of
TG defined as
<120 mg/dL
PROVE IT-
TIMI 22 Trialb
TG ≥150 mg/dL Predicts Higher CHDa Risk
in Statin Takers with LDL-C <70 mg/dL
CH
D E
ven
t R
ate
aft
er
30 D
ays
c(%
)
aDeath, MI, and recurrent ACS. bACS patients on atorvastatin 80 mg or pravastatin 40 mg. cAdjusted for age, gender, low
HDL-C, smoking, hypertension (HTN), obesity, diabetes, prior statin therapy, prior ACS, peripheral vascular disease, and
treatment. CHD=coronary heart disease; HR=hazard ratio; PROVE IT-TIMI=Pravastatin or Atorvastatin Evaluation and
Infection Therapy Thrombolysis In Myocardial Infarction.
Miller M, et al. J Am Coll Cardiol. 2008;51:724-730.
(N=4162)
11.7%
16.5%
TG <150 mg/dL TG ≥150 mg/dL
LDL-C <70 mg/dL
HR: 0.72
P =.017
HR: 0.84
P =.192
Referent
LDL-C ≥70 mg/dL
TG ≥150 mg/dL
Event Rate = 17.9%
0
10
15
20
5
High TG and Low HDL-C Correlate with CVD Risk
Even When LDL-C is Well Controlled
5-y
r R
isk o
f M
ajo
r
CV
D E
vents
(%
)
Patients with LDL-C ≤70 mg/dL on statina,b
HDL-C and TG values in mg/dLaOn-treatment level (3-month statin therapy), n=2661bMean LDL-C 58 mg/dL, mean TG 126 mg/dL
*P=.03 for differences among quintiles of HDL-C
HR vs Q1* 0.85 0.57 0.55 0.61
TNT=Treating to New Targets
Reprinted with Permission from
Barter P, et al. N Engl J Med. 2007;357:1301-1310.
TNT Study
0
2
4
6
8
10
39% Lower Risk
TG=147
TG=186TG=166
TG=122TG=139
Q1 Q2 Q3 Q4 Q5
<37 37 to <42 42 to <47 47 to <55 ≥55
HDL-C
Quintilesa
Highlights from Lipid Forum 2015: Focus on Hypertriglyceridemia
© 2015 Vindico Medical Education
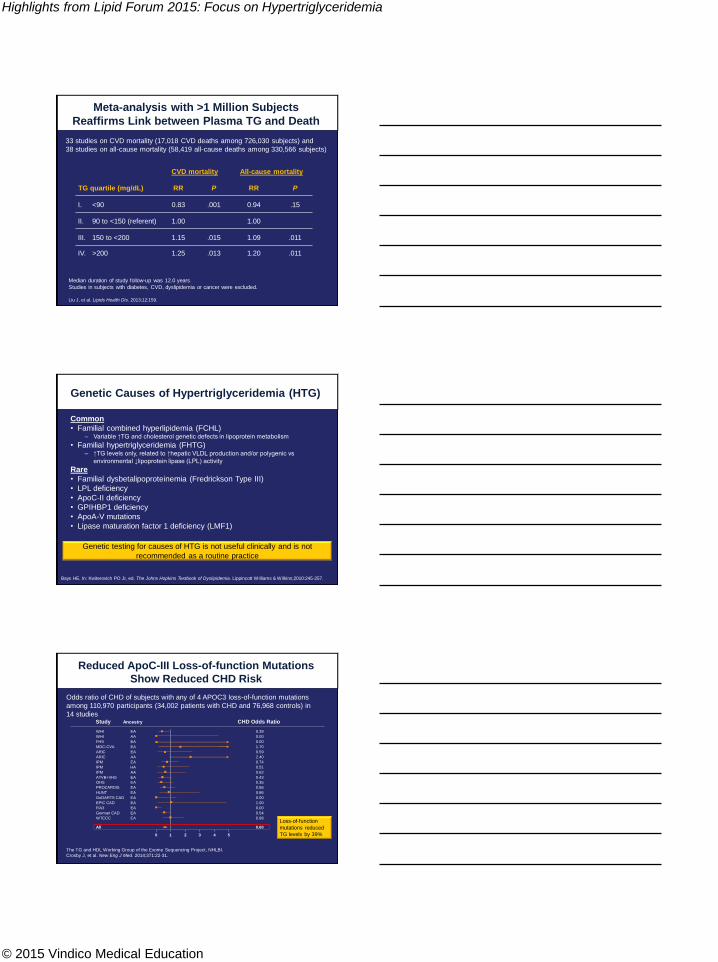
Meta-analysis with >1 Million Subjects
Reaffirms Link between Plasma TG and Death
33 studies on CVD mortality (17,018 CVD deaths among 726,030 subjects) and
38 studies on all-cause mortality (58,419 all-cause deaths among 330,566 subjects)
Median duration of study follow-up was 12.0 years.
Studies in subjects with diabetes, CVD, dyslipidemia or cancer were excluded.
Liu J, et al. Lipids Health Dis. 2013;12:159.
CVD mortality All-cause mortality
TG quartile (mg/dL) RR P RR P
I. <90 0.83 .001 0.94 .15
II. 90 to <150 (referent) 1.00 1.00
III. 150 to <200 1.15 .015 1.09 .011
IV. >200 1.25 .013 1.20 .011
Genetic Causes of Hypertriglyceridemia (HTG)
Common
• Familial combined hyperlipidemia (FCHL)– Variable ↑TG and cholesterol genetic defects in lipoprotein metabolism
• Familial hypertriglyceridemia (FHTG)– ↑TG levels only, related to ↑hepatic VLDL production and/or polygenic vs
environmental ↓lipoprotein lipase (LPL) activity
Rare
• Familial dysbetalipoproteinemia (Fredrickson Type III)
• LPL deficiency
• ApoC-II deficiency
• GPIHBP1 deficiency
• ApoA-V mutations
• Lipase maturation factor 1 deficiency (LMF1)
Bays HE. In: Kwiterovich PO Jr, ed. The Johns Hopkins Textbook of Dyslipidemia. Lippincott Williams & Wilkins;2010:245-257.
Genetic testing for causes of HTG is not useful clinically and is not
recommended as a routine practice
Reduced ApoC-III Loss-of-function Mutations
Show Reduced CHD Risk
The TG and HDL Working Group of the Exome Sequencing Project, NHLBI.
Crosby J, et al. New Eng J Med. 2014;371:22-31.
Loss-of-function
mutations reduced
TG levels by 39%
Odds ratio of CHD of subjects with any of 4 APOC3 loss-of-function mutations
among 110,970 participants (34,002 patients with CHD and 76,968 controls) in
14 studiesStudy Ancestry CHD Odds Ratio
WHI EA 0.39
WHI AA 0.00
FHS EA 0.00
MDC-CVA EA 1.70
ARIC EA 0.59
ARIC AA 2.40
IPM EA 0.74
IPM HA 0.51
IPM AA 0.62
ATVB+VHS EA 0.43
OHS EA 0.35
PROCARDIS EA 0.56
HUNT EA 0.86
GoDARTS CAD EA 0.00
EPIC CAD EA 1.00
FIA3 EA 0.00
German CAD EA 0.54
WTCCC EA 0.98
All 0.60
0 1 2 3 4 5
Highlights from Lipid Forum 2015: Focus on Hypertriglyceridemia
© 2015 Vindico Medical Education
Treating the Underlying Factors
• Dietary intervention (fats, sugars, alcohol, calories)
• Body weight management
• Physical activity to activate beta-oxidation
• Treat underlying co-morbidities
• Evaluate options for changing TG-raising medications
Treating Hypertriglyceridemia
• Omega-3 fatty acids, prescription
• Fish oil, krill oil, flax seed supplementation
• Fibrates
• Niacins
• Statins
• Novel drugs and pathways
Conclusions
• Consider every hypertriglyceridemia as secondary, even the most severe.
• Hypertriglyceridemia is common because LpL is an easy target of genetic and non-genetic modifiers.
• Investigate and go after the primary cause.
• Aggressive lifestyle intervention produces large benefits.
1. TG can only go down if one does not eat.
2. The body burns fat after 40 minutes of aerobic activity.
• Use appropriate therapy of prescription omega 3 at full dose as the first complement to diet and exercise. Use fibrates for more resistant forms, and statins as appropriate for CV risk management.
Highlights from Lipid Forum 2015: Focus on Hypertriglyceridemia
© 2015 Vindico Medical Education
Hypertriglyceridemia and
Pancreatitis
Peter P. Toth, MD, PhD, FAAFP, FICA, FNLA,
FCCP, FAHA, FACC
Director of Preventative Cardiology
CGH Medical Center, Sterling, Illinois
Professor of Clinical Family and Community Medicine
University of Illinois School of Medicine, Peoria, Illinois
Professor of Clinical Medicine
Michigan State University College of Osteopathic Medicine
East Lansing, Michigan
Adjunct Associate Professor
Johns Hopkins University School of Medicine, Baltimore, Maryland
Pancreatitis
• Severe hypertriglyceridemia (HTG) is etiologic for approximately 10%
of cases of acute pancreatitis and 56% of gestational pancreatitis.1
• Hypertriglyceridemia correlates with both:
– Increased availability of pro-inflammatory fatty acids produced by
pancreatic lipase, and
– Increased serum chylomicrons which can slow blood flow through
intra-pancreatic capillaries.2
• Serum triglyceride threshold for precipitating pancreatitis is
inadequately defined.
• The severity of pancreatitis induced by HTG is greater than with
gallstone or alcoholic pancreatitis (higher mortality and long-term
complications). There is no correlation between magnitude of HTG
and severity of pancreatitis.3
1 Anderson F, et al. Pancreatology. 2009;9:252–257.
2 Ewald N, et al. Curr Opin Lipidol. 2009;20:497-504.
3 Lloret Linares C, et al. Pancreas. 2008;37:13–22.
Very High TGs Can Cause
Acute Pancreatitis
Impact of Pancreatitis
• ~100,000 patients hospitalized
for acute pancreatitis in the
United States annually1
• ~2000 patient deaths per year
from complications related to
acute pancreatitis1
• Elevated TG or
chylomicronemia is the
underlying cause in up to 7%
of all acute pancreatitis cases
• Critical to recognize and
appropriately manage these
patients at risk, as most can be
effectively treated with lifestyle
modification and drug therapy2
0
20
40
60
80
100
Perc
en
t o
f P
ati
en
ts
Gallstones Alcohol TotalIdiopathic
Causes of Acute Pancreatitis1
Other (incl. TGs, meds, etc.)
1. Stevens T, Conwell DL. Acute Pancreatitis. Available at http://www.clevelandclinicmeded.com/medicalpubs
/diseasemanagement/gastroenterology/acute-pancreatitis. Accessed December 30, 2013.
2. Gan SI, et al. World J Gastroenterol. 2006;12:7197-7202.
Highlights from Lipid Forum 2015: Focus on Hypertriglyceridemia
© 2015 Vindico Medical Education
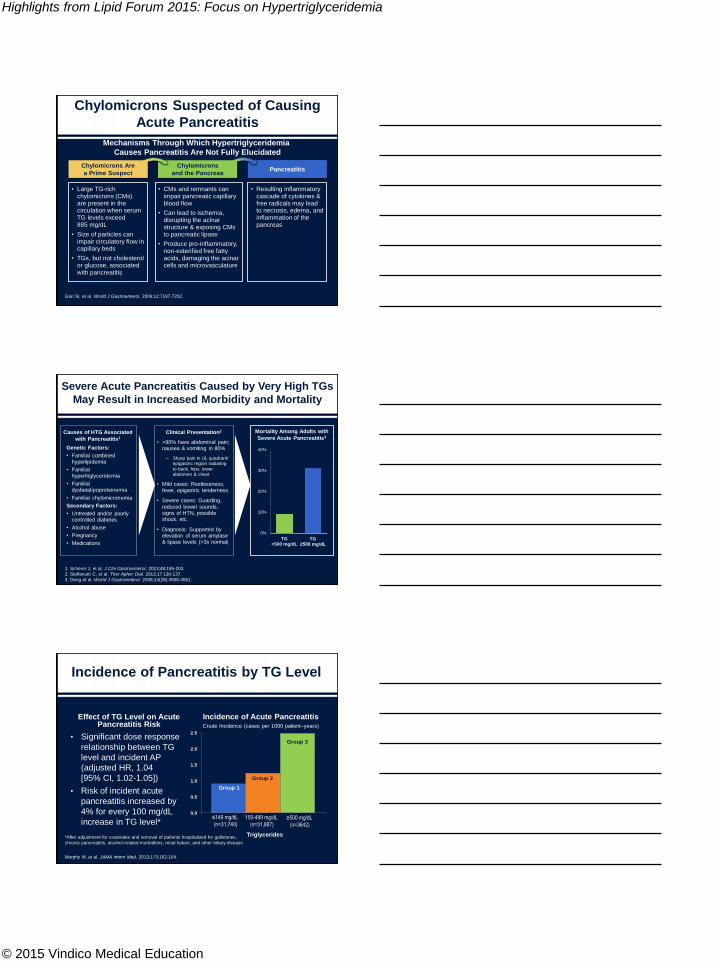
Chylomicrons Suspected of Causing
Acute Pancreatitis
• Large TG-rich chylomicrons (CMs) are present in the circulation when serum TG levels exceed 885 mg/dL
• Size of particles can impair circulatory flow in capillary beds
• TGs, but not cholesterol or glucose, associated with pancreatitis
• CMs and remnants can impair pancreatic capillary blood flow
• Can lead to ischemia, disrupting the acinar structure & exposing CMs to pancreatic lipase
• Produce pro-inflammatory, non-esterified free fatty acids, damaging the acinar cells and microvasculature
• Resulting inflammatory cascade of cytokines & free radicals may lead to necrosis, edema, and inflammation of the pancreas
Pancreatitis
Mechanisms Through Which Hypertriglyceridemia
Causes Pancreatitis Are Not Fully Elucidated
Chylomicrons
and the Pancreas
Chylomicrons Are
a Prime Suspect
Gan SI, et al. World J Gastroenterol. 2006;12:7197-7202.
Severe Acute Pancreatitis Caused by Very High TGs
May Result in Increased Morbidity and Mortality
1. Scherer J, et al. J Clin Gastroenterol. 2013;48:195-203.
2. Steffanutti C, et al. Ther Apher Dial. 2013;17:130-137.
3. Deng et al. World J Gastroenterol. 2008;14(28):4558-4561.
0%
10%
20%
30%
40%
TG<500 mg/dL
TG≥500 mg/dL
• >90% have abdominal pain; nausea & vomiting in 80%
– Sharp pain in UL quadrant/ epigastric region radiating
to back, hips, lower abdomen & chest
• Mild cases: Restlessness,
fever, epigastric tenderness
• Severe cases: Guarding,
reduced bowel sounds, signs of HTN, possible shock, etc.
• Diagnosis: Supported by elevation of serum amylase & lipase levels (>3x normal)
Clinical Presentation2 Mortality Among Adults with
Severe Acute Pancreatitis3
Genetic Factors:
• Familial combined hyperlipidemia
• Familial hypertriglyceridemia
• Familial dysbetalipoproteinemia
• Familial chylomicronemia
Secondary Factors:
• Untreated and/or poorly controlled diabetes
• Alcohol abuse
• Pregnancy
• Medications
Causes of HTG Associated
with Pancreatitis1
Incidence of Pancreatitis by TG Level
Effect of TG Level on Acute Pancreatitis Risk
• Significant dose response
relationship between TG
level and incident AP
(adjusted HR, 1.04
[95% CI, 1.02-1.05])
• Risk of incident acute
pancreatitis increased by
4% for every 100 mg/dL
increase in TG level*
Incidence of Acute Pancreatitis
0.0
0.5
1.0
1.5
2.0
2.5
Crude Incidence (cases per 1000 patient–years)
Triglycerides
≤149 mg/dL
(n=31,740)150-499 mg/dL
(n=31,887)≥500 mg/dL
(n=3642)
Group 1
Group 2
Group 3
*After adjustment for covariates and removal of patients hospitalized for gallstones,
chronic pancreatitis, alcohol-related morbidities, renal failure, and other biliary disease
Murphy M, et al. JAMA Intern Med. 2013;173:162-164.
Highlights from Lipid Forum 2015: Focus on Hypertriglyceridemia
© 2015 Vindico Medical Education
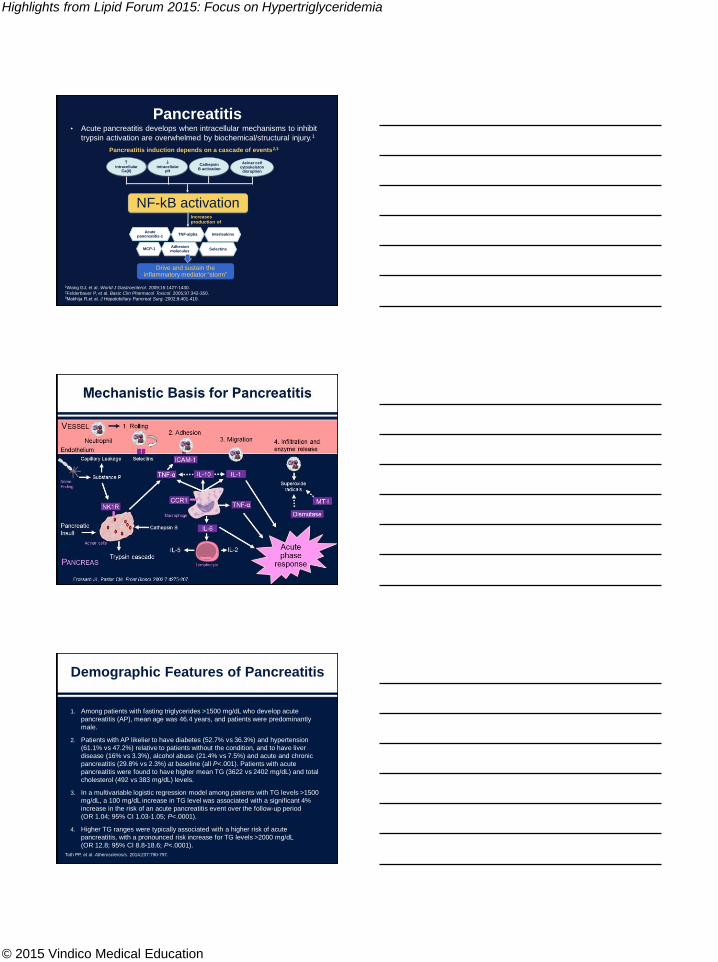
Pancreatitis
1Wang GJ, et al. World J Gastroenterol. 2009;15:1427-1430. 2Felderbauer P, et al. Basic Clin Pharmacol Toxicol. 2005;97:342-350. 3Makhija R,et al. J Hepatobiliary Pancreat Surg. 2002;9:401-410.
• Acute pancreatitis develops when intracellular mechanisms to inhibit
trypsin activation are overwhelmed by biochemical/structural injury.1
NF-kB activation Increases production of
Acute pancreatitis-1 TNF-alpha Interleukins
MCP-1Adhesion molecules
Selectins
Drive and sustain the inflammatory mediator “storm”
Pancreatitis induction depends on a cascade of events2,3
intracellular
Ca(II)
intracellular
pH
Cathepsin B activation
Acinar cell cytoskeleton
disruption
Mechanistic Basis for Pancreatitis
Frossard JL, Pastor CM. Front Biosci. 2002;7:d275-287.
VESSEL
Endothelium
Nerve
Ending
Pancreatic
Insult
PANCREAS
Neutrophil
1. Rolling
3. Migration 4. Infiltration and
enzyme release
Capillary Leakage
2. Adhesion
Selectins
Substance P
Superoxide
radicals
Cathepsin B
IL-5 IL-2
NK1R
Macrophage
Lymphocyte
Acinar cells
ICAM-1
CCR1
IL-6
TNF-α
MT-I
IL-1
Dismutase
Trypsin cascade
Acute phase
response
TNF-α
IL-10
Demographic Features of Pancreatitis
1. Among patients with fasting triglycerides >1500 mg/dL who develop acute
pancreatitis (AP), mean age was 46.4 years, and patients were predominantly
male.
2. Patients with AP likelier to have diabetes (52.7% vs 36.3%) and hypertension
(61.1% vs 47.2%) relative to patients without the condition, and to have liver
disease (16% vs 3.3%), alcohol abuse (21.4% vs 7.5%) and acute and chronic
pancreatitis (29.8% vs 2.3%) at baseline (all P<.001). Patients with acute
pancreatitis were found to have higher mean TG (3622 vs 2402 mg/dL) and total
cholesterol (492 vs 383 mg/dL) levels.
3. In a multivariable logistic regression model among patients with TG levels >1500
mg/dL, a 100 mg/dL increase in TG level was associated with a significant 4%
increase in the risk of an acute pancreatitis event over the follow-up period
(OR 1.04; 95% CI 1.03-1.05; P<.0001).
4. Higher TG ranges were typically associated with a higher risk of acute
pancreatitis, with a pronounced risk increase for TG levels >2000 mg/dL
(OR 12.8; 95% CI 8.8-18.6; P<.0001).
Toth PP, et al. Atherosclerosis. 2014;237:790-797.
Highlights from Lipid Forum 2015: Focus on Hypertriglyceridemia
© 2015 Vindico Medical Education
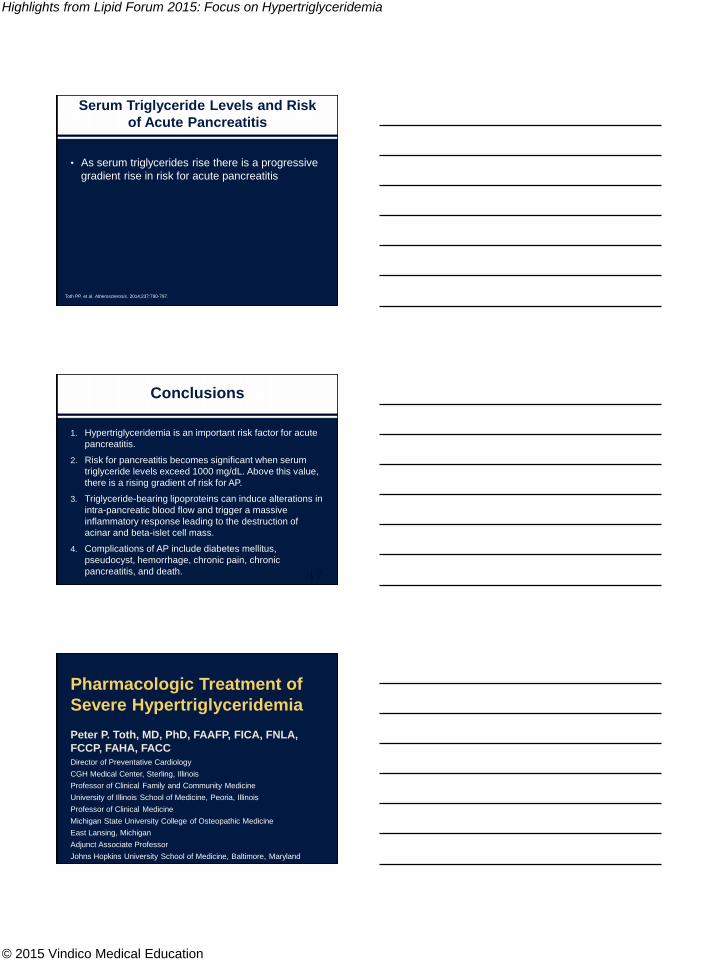
Serum Triglyceride Levels and Risk
of Acute Pancreatitis
• As serum triglycerides rise there is a progressive
gradient rise in risk for acute pancreatitis
Toth PP, et al. Atherosclerosis. 2014;237:790-797.
Conclusions
1. Hypertriglyceridemia is an important risk factor for acute
pancreatitis.
2. Risk for pancreatitis becomes significant when serum
triglyceride levels exceed 1000 mg/dL. Above this value,
there is a rising gradient of risk for AP.
3. Triglyceride-bearing lipoproteins can induce alterations in
intra-pancreatic blood flow and trigger a massive
inflammatory response leading to the destruction of
acinar and beta-islet cell mass.
4. Complications of AP include diabetes mellitus,
pseudocyst, hemorrhage, chronic pain, chronic
pancreatitis, and death. 47
Pharmacologic Treatment of
Severe Hypertriglyceridemia
Peter P. Toth, MD, PhD, FAAFP, FICA, FNLA,
FCCP, FAHA, FACC
Director of Preventative Cardiology
CGH Medical Center, Sterling, Illinois
Professor of Clinical Family and Community Medicine
University of Illinois School of Medicine, Peoria, Illinois
Professor of Clinical Medicine
Michigan State University College of Osteopathic Medicine
East Lansing, Michigan
Adjunct Associate Professor
Johns Hopkins University School of Medicine, Baltimore, Maryland
Highlights from Lipid Forum 2015: Focus on Hypertriglyceridemia
© 2015 Vindico Medical Education
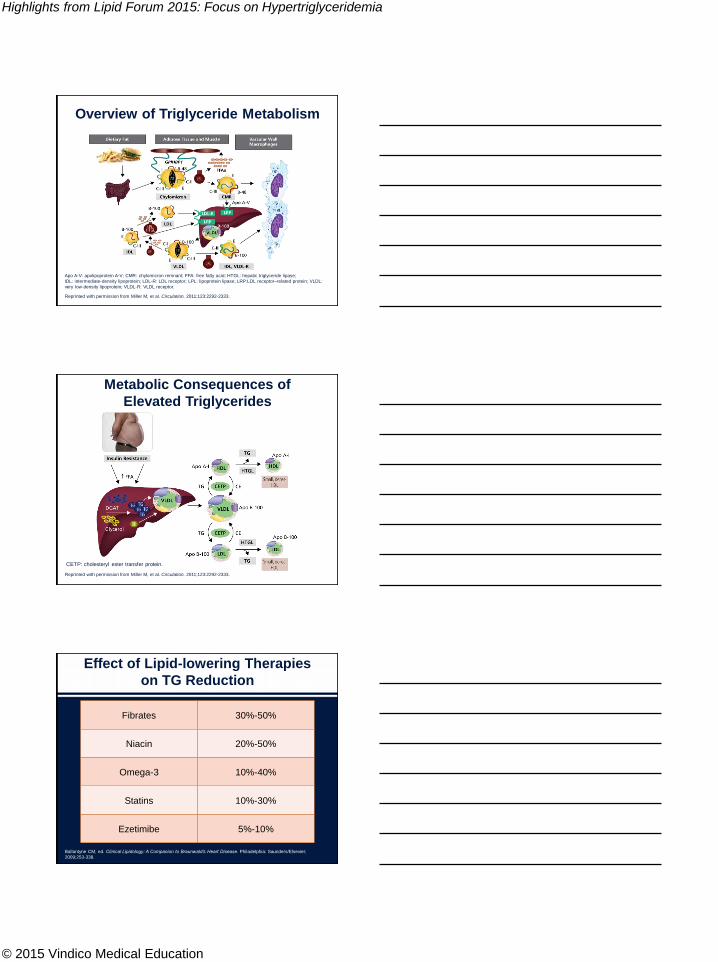
Apo A-V: apolipoprotein A-V; CMR: chylomicron remnant; FFA: free fatty acid; HTGL: hepatic triglyceride lipase;
IDL: intermediate-density lipoprotein; LDL-R: LDL receptor; LPL: lipoprotein lipase; LRP:LDL receptor–related protein; VLDL:
very low-density lipoprotein; VLDL-R: VLDL receptor.
Overview of Triglyceride Metabolism
Reprinted with permission from Miller M, et al. Circulation. 2011;123:2292-2333.
CETP: cholesteryl ester transfer protein.
Metabolic Consequences of
Elevated Triglycerides
Reprinted with permission from Miller M, et al. Circulation. 2011;123:2292-2333.
Fibrates 30%-50%
Niacin 20%-50%
Omega-3 10%-40%
Statins 10%-30%
Ezetimibe 5%-10%
Effect of Lipid-lowering Therapies
on TG Reduction
Ballantyne CM, ed. Clinical Lipidology: A Companion to Braunwald’s Heart Disease. Philadelphia: Saunders/Elsevier;
2009;253-338.
Highlights from Lipid Forum 2015: Focus on Hypertriglyceridemia
© 2015 Vindico Medical Education
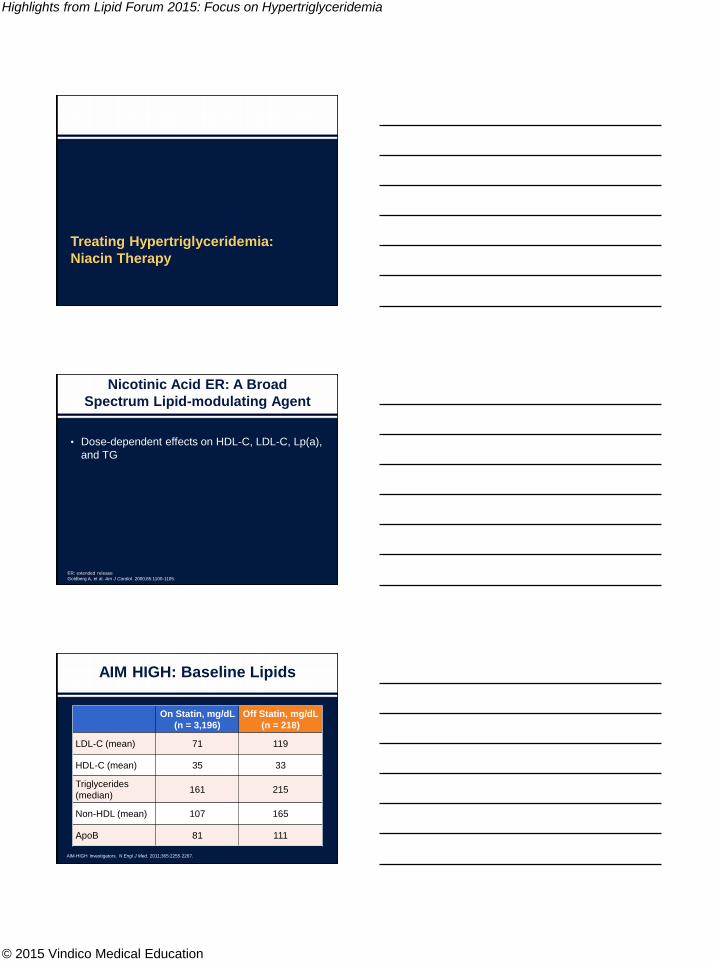
Treating Hypertriglyceridemia:
Niacin Therapy
ER: extended release
Goldberg A, et al. Am J Cardiol. 2000;85:1100-1105.
Nicotinic Acid ER: A Broad
Spectrum Lipid-modulating Agent
• Dose-dependent effects on HDL-C, LDL-C, Lp(a),
and TG
On Statin, mg/dL
(n = 3,196)
Off Statin, mg/dL
(n = 218)
LDL-C (mean) 71 119
HDL-C (mean) 35 33
Triglycerides
(median)161 215
Non-HDL (mean) 107 165
ApoB 81 111
AIM HIGH: Baseline Lipids
AIM-HIGH Investigators. N Engl J Med. 2011;365:2255-2267.
Highlights from Lipid Forum 2015: Focus on Hypertriglyceridemia
© 2015 Vindico Medical Education
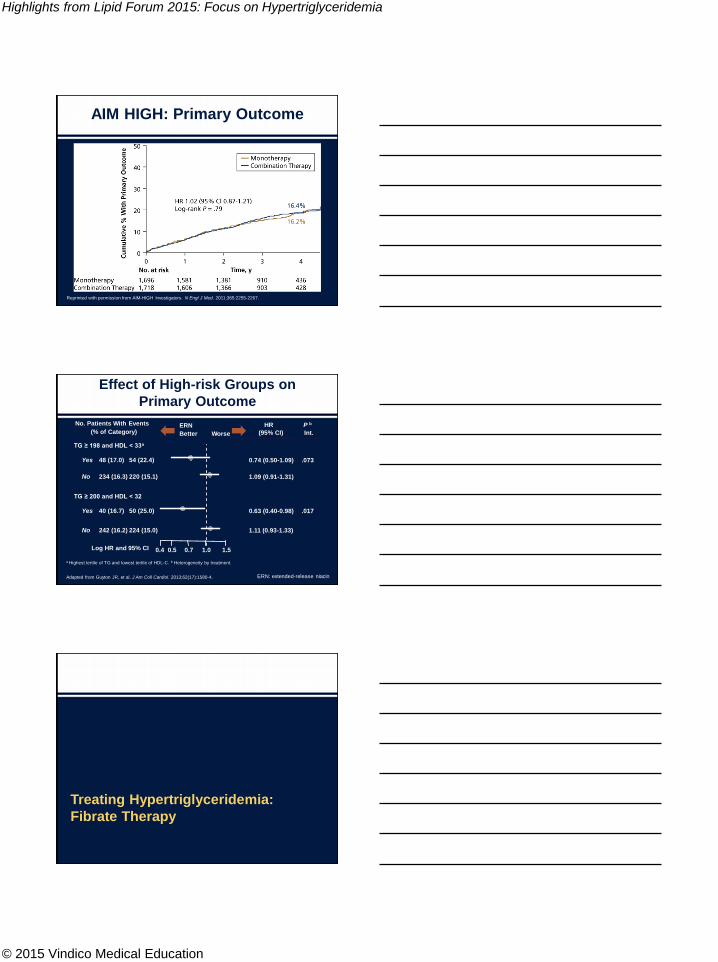
AIM HIGH: Primary Outcome
Reprinted with permission from AIM-HIGH Investigators. N Engl J Med. 2011;365:2255-2267.
0.4 0.5 0.7 1.0 1.5Log HR and 95% CI
No 242 (16.2)
Yes 40 (16.7)
TG ≥ 200 and HDL < 32
No 234 (16.3)
Yes 48 (17.0)
224 (15.0)
50 (25.0)
220 (15.1)
54 (22.4)
TG ≥ 198 and HDL < 33a
No. Patients With Events
(% of Category)ERN
Better Worse
1.11 (0.93-1.33)
0.63 (0.40-0.98)
1.09 (0.91-1.31)
0.74 (0.50-1.09)
HR
(95% CI)
.017
.073
P b
Int.
a Highest tertile of TG and lowest tertile of HDL-C. b Heterogeneity by treatment.
ERN: extended-release niacin
Effect of High-risk Groups on
Primary Outcome
Adapted from Guyton JR, et al. J Am Coll Cardiol. 2013;62(17):1580-4.
Treating Hypertriglyceridemia:
Fibrate Therapy
Highlights from Lipid Forum 2015: Focus on Hypertriglyceridemia
© 2015 Vindico Medical Education
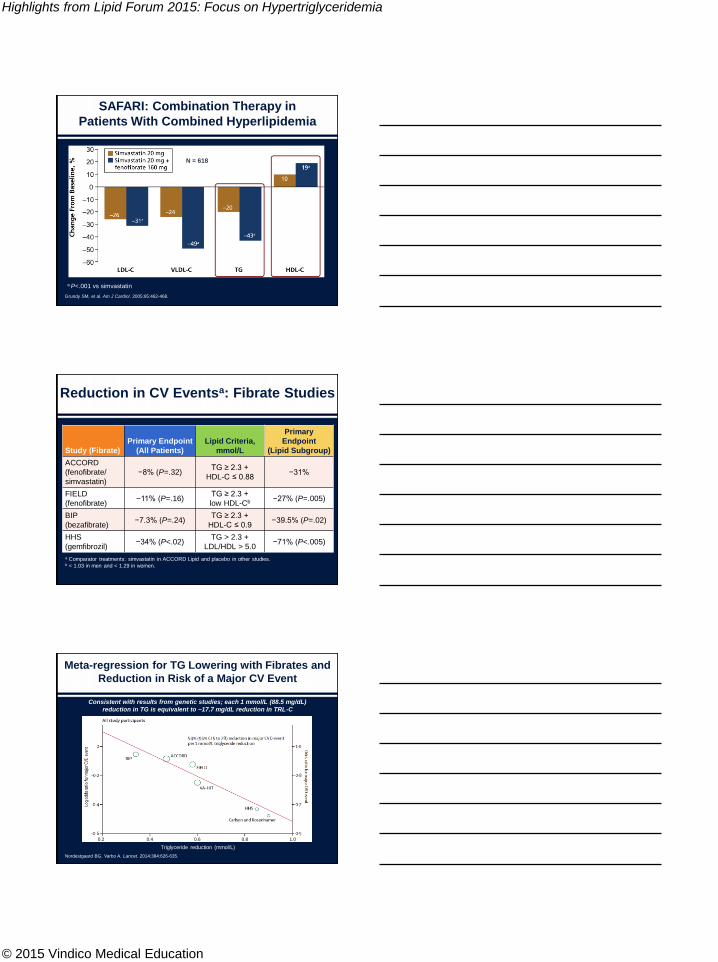
a P<.001 vs simvastatin
SAFARI: Combination Therapy in
Patients With Combined Hyperlipidemia
Grundy SM, et al. Am J Cardiol. 2005;95:462-468.
N = 618
Study (Fibrate)
Primary Endpoint
(All Patients)
Lipid Criteria,
mmol/L
Primary
Endpoint
(Lipid Subgroup)
ACCORD
(fenofibrate/
simvastatin)
−8% (P=.32)TG ≥ 2.3 +
HDL-C ≤ 0.88−31%
FIELD
(fenofibrate)−11% (P=.16)
TG ≥ 2.3 +
low HDL-Cb −27% (P=.005)
BIP
(bezafibrate)−7.3% (P=.24)
TG ≥ 2.3 +
HDL-C ≤ 0.9−39.5% (P=.02)
HHS
(gemfibrozil)−34% (P<.02)
TG > 2.3 +
LDL/HDL > 5.0−71% (P<.005)
a Comparator treatments: simvastatin in ACCORD Lipid and placebo in other studies. b < 1.03 in men and < 1.29 in women.
Reduction in CV Eventsa: Fibrate Studies
Meta-regression for TG Lowering with Fibrates and
Reduction in Risk of a Major CV Event
Nordestgaard BG, Varbo A. Lancet. 2014;384:626-635.
Consistent with results from genetic studies; each 1 mmol/L (88.5 mg/dL)
reduction in TG is equivalent to ~17.7 mg/dL reduction in TRL-C
Triglyceride reduction (mmol/L)
0.2 0.4 0.6 0.8 1.0
Highlights from Lipid Forum 2015: Focus on Hypertriglyceridemia
© 2015 Vindico Medical Education
Treating Hypertriglyceridemia:
Omega-3 Fatty Acid Therapy
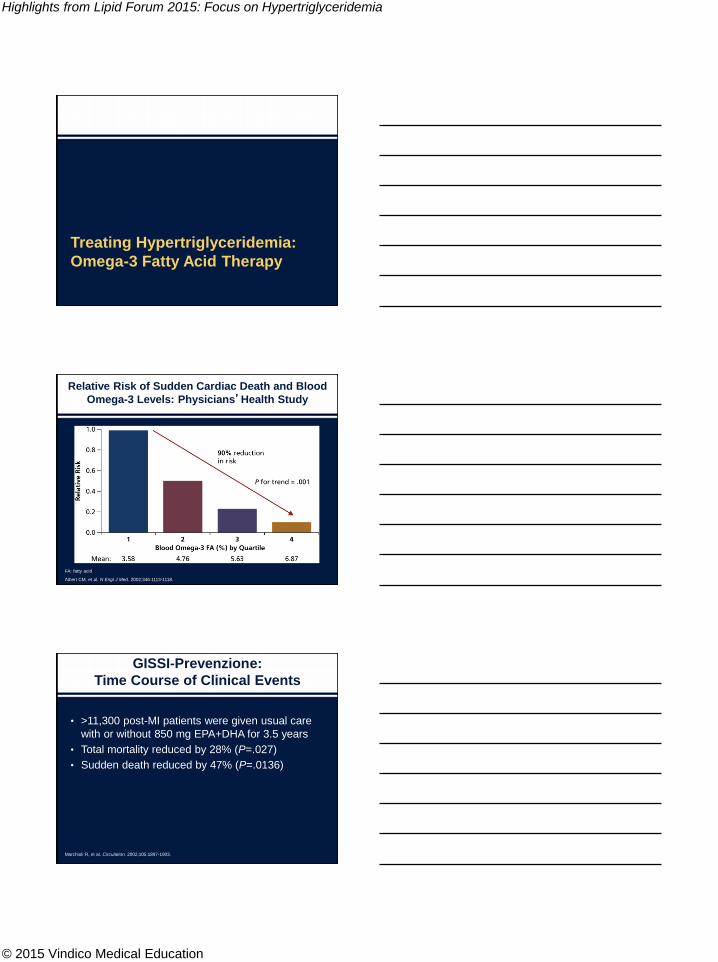
Relative Risk of Sudden Cardiac Death and Blood
Omega-3 Levels: Physicians’Health Study
FA: fatty acid
Albert CM, et al. N Engl J Med. 2002;346:1113-1118.
GISSI-Prevenzione:
Time Course of Clinical Events
• >11,300 post-MI patients were given usual care
with or without 850 mg EPA+DHA for 3.5 years
• Total mortality reduced by 28% (P=.027)
• Sudden death reduced by 47% (P=.0136)
Marchioli R, et al. Circulation. 2002;105:1897-1903.
Highlights from Lipid Forum 2015: Focus on Hypertriglyceridemia
© 2015 Vindico Medical Education
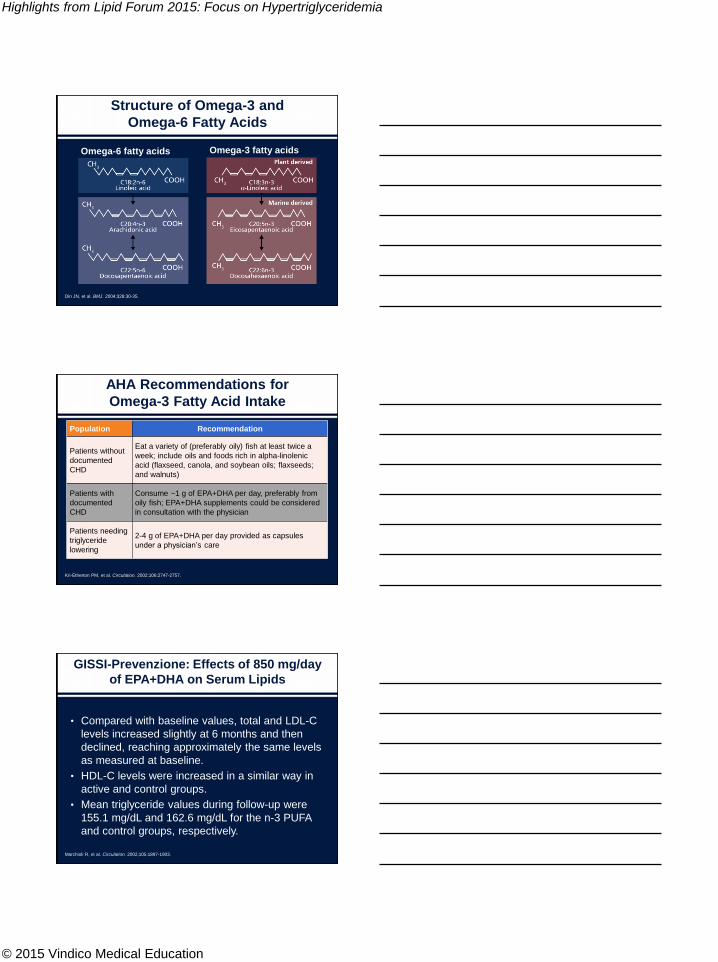
Structure of Omega-3 and
Omega-6 Fatty Acids
Din JN, et al. BMJ. 2004;328:30-35.
Omega-6 fatty acids Omega-3 fatty acids
Population Recommendation
Patients without
documented
CHD
Eat a variety of (preferably oily) fish at least twice a
week; include oils and foods rich in alpha-linolenic
acid (flaxseed, canola, and soybean oils; flaxseeds;
and walnuts)
Patients with
documented
CHD
Consume ~1 g of EPA+DHA per day, preferably from
oily fish; EPA+DHA supplements could be considered
in consultation with the physician
Patients needing
triglyceride
lowering
2-4 g of EPA+DHA per day provided as capsules
under a physician’s care
AHA Recommendations for
Omega-3 Fatty Acid Intake
Kri-Etherton PM, et al. Circulation. 2002;106:2747-2757.
GISSI-Prevenzione: Effects of 850 mg/day
of EPA+DHA on Serum Lipids
• Compared with baseline values, total and LDL-C
levels increased slightly at 6 months and then
declined, reaching approximately the same levels
as measured at baseline.
• HDL-C levels were increased in a similar way in
active and control groups.
• Mean triglyceride values during follow-up were
155.1 mg/dL and 162.6 mg/dL for the n-3 PUFA
and control groups, respectively.
Marchioli R, et al. Circulation. 2002;105:1897-1903.
Highlights from Lipid Forum 2015: Focus on Hypertriglyceridemia
© 2015 Vindico Medical Education
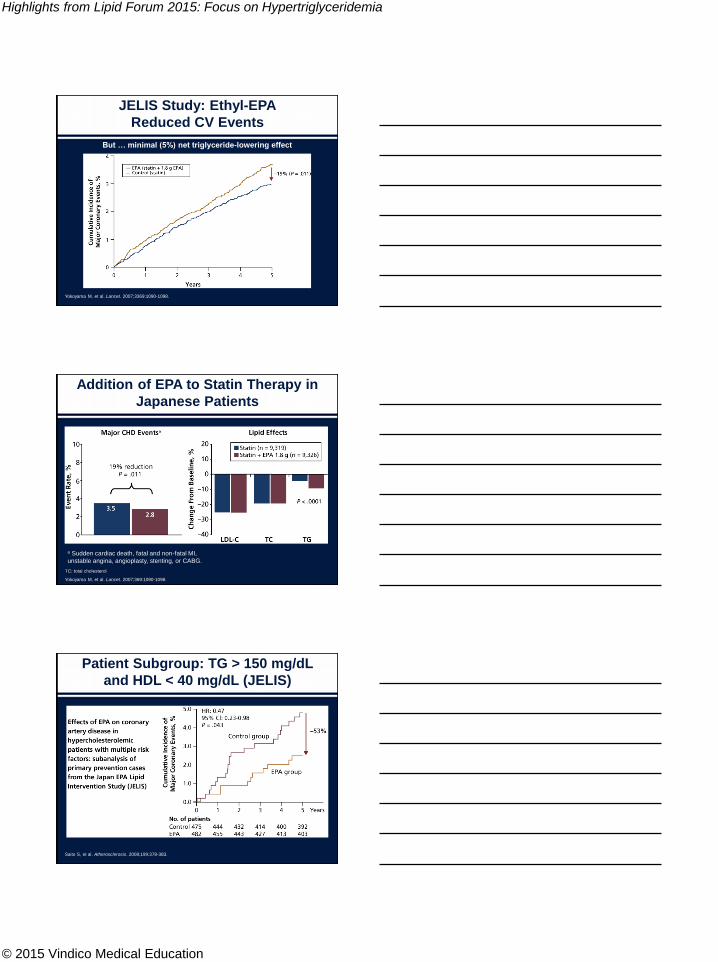
But … minimal (5%) net triglyceride-lowering effect
JELIS Study: Ethyl-EPA
Reduced CV Events
Yokoyama M, et al. Lancet. 2007;3369:1090-1098.
a Sudden cardiac death, fatal and non-fatal MI,
unstable angina, angioplasty, stenting, or CABG.
Addition of EPA to Statin Therapy in
Japanese Patients
TC: total cholesterol
Yokoyama M, et al. Lancet. 2007;369:1090-1098.
Patient Subgroup: TG > 150 mg/dL
and HDL < 40 mg/dL (JELIS)
Saito S, et al. Atherosclerosis. 2008;199:378-383.
Highlights from Lipid Forum 2015: Focus on Hypertriglyceridemia
© 2015 Vindico Medical Education
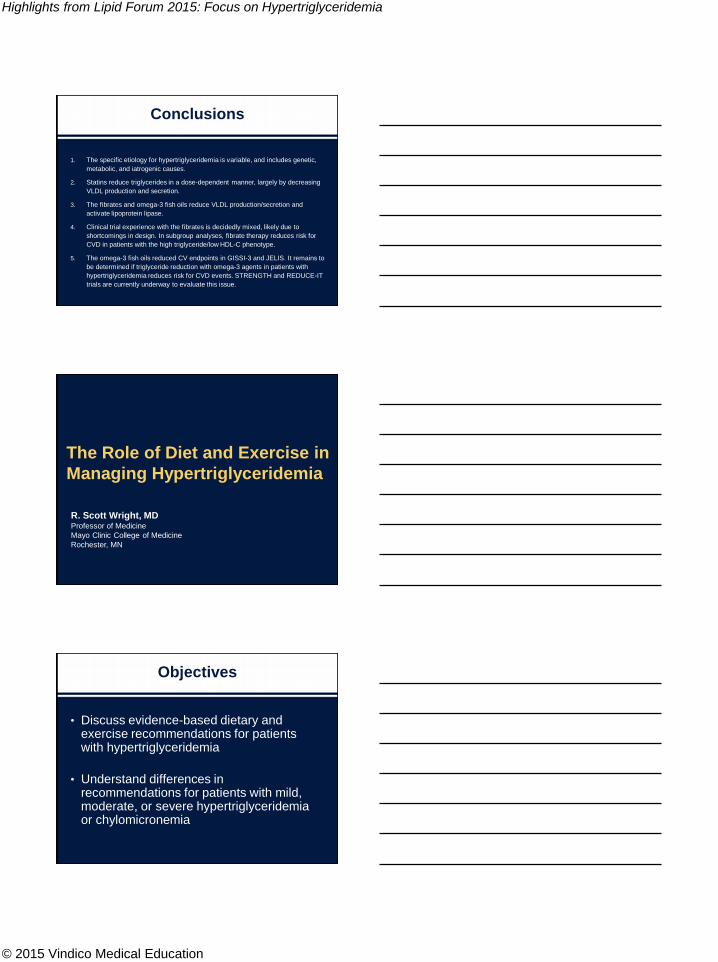
Conclusions
1. The specific etiology for hypertriglyceridemia is variable, and includes genetic,
metabolic, and iatrogenic causes.
2. Statins reduce triglycerides in a dose-dependent manner, largely by decreasing
VLDL production and secretion.
3. The fibrates and omega-3 fish oils reduce VLDL production/secretion and
activate lipoprotein lipase.
4. Clinical trial experience with the fibrates is decidedly mixed, likely due to
shortcomings in design. In subgroup analyses, fibrate therapy reduces risk for
CVD in patients with the high triglyceride/low HDL-C phenotype.
5. The omega-3 fish oils reduced CV endpoints in GISSI-3 and JELIS. It remains to
be determined if triglyceride reduction with omega-3 agents in patients with
hypertriglyceridemia reduces risk for CVD events. STRENGTH and REDUCE-IT
trials are currently underway to evaluate this issue.
The Role of Diet and Exercise in
Managing Hypertriglyceridemia
R. Scott Wright, MDProfessor of Medicine
Mayo Clinic College of Medicine
Rochester, MN
Objectives
• Discuss evidence-based dietary and exercise recommendations for patients with hypertriglyceridemia
• Understand differences in recommendations for patients with mild, moderate, or severe hypertriglyceridemia or chylomicronemia
Highlights from Lipid Forum 2015: Focus on Hypertriglyceridemia
© 2015 Vindico Medical Education
Dietary Management of
Hypertriglyceridemia
• Nutrition measurements that affect
triglyceride levels include:
– Body weight status
– Body fat distribution
– Weight loss
– Macronutrient profile of the diet
Type and amount of dietary carbohydrate and fat
– Alcohol consumption
Miller M, et al. Circulation. 2011;123:2292-2333.
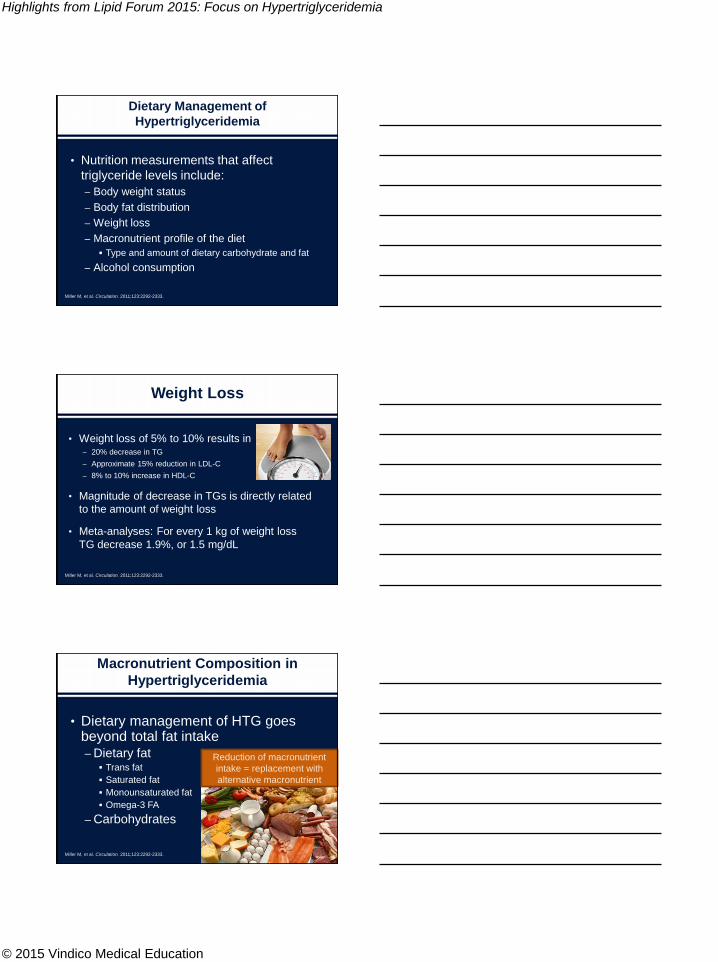
Weight Loss
• Weight loss of 5% to 10% results in– 20% decrease in TG
– Approximate 15% reduction in LDL-C
– 8% to 10% increase in HDL-C
• Magnitude of decrease in TGs is directly related
to the amount of weight loss
• Meta-analyses: For every 1 kg of weight loss
TG decrease 1.9%, or 1.5 mg/dL
Miller M, et al. Circulation. 2011;123:2292-2333.
Macronutrient Composition in
Hypertriglyceridemia
• Dietary management of HTG goes beyond total fat intake– Dietary fat
Trans fat
Saturated fat
Monounsaturated fat
Omega-3 FA
– Carbohydrates
Miller M, et al. Circulation. 2011;123:2292-2333.
Reduction of macronutrient
intake = replacement with
alternative macronutrient
Highlights from Lipid Forum 2015: Focus on Hypertriglyceridemia
© 2015 Vindico Medical Education
Carbohydrates and Lipogenesis
Patel G. Metabolism. faqs.org. http://www.faqs.org/nutrition/Met-Obe/Metabolism.html. Accessed March 20, 2015.
• Important interrelationships among CHO, fats, and proteins
• Carbohydrates - Generally go through glycolysis to produce ATP.
– This can be accomplished in the absence of oxygen but with a relatively low yield in energy or ATP. Pyruvate is also produced and, in the absence or deficiency of oxygen, is converted to lactic acid (lactate).
• Proteins - Deaminated in the liver and they can then enter the Krebs cycle at a couple of different spots and result in energy in this method:
– Because it must be deaminated (remove an ammonia group on a chemistry level) before this can occur, it takes more energy to break it down. ATP is produced as well as some intermediate products (NADH, FADH) that ultimately result in ATP after going through the Electron Transport System (ETS).
• Fats - Stored, and often consumed, in the form of triglycerides
– Fatty acids are removed and enter the mitochondria where they go through a process called 'Beta-Oxidation' where 2 carbon molecules are removed at a time. Fats can store a tremendous amount of energy within them. However, protein & fat catabolism requires oxygen in order to yield the energy needed.
Sugars and Triglycerides
Beil L. ScienceNews. https://www.sciencenews.org/article/sweet-confusion. Accessed March 20, 2015.
• Sucrose is a disaccharide consisting of 1
molecule of glucose and 1 molecule of fructose
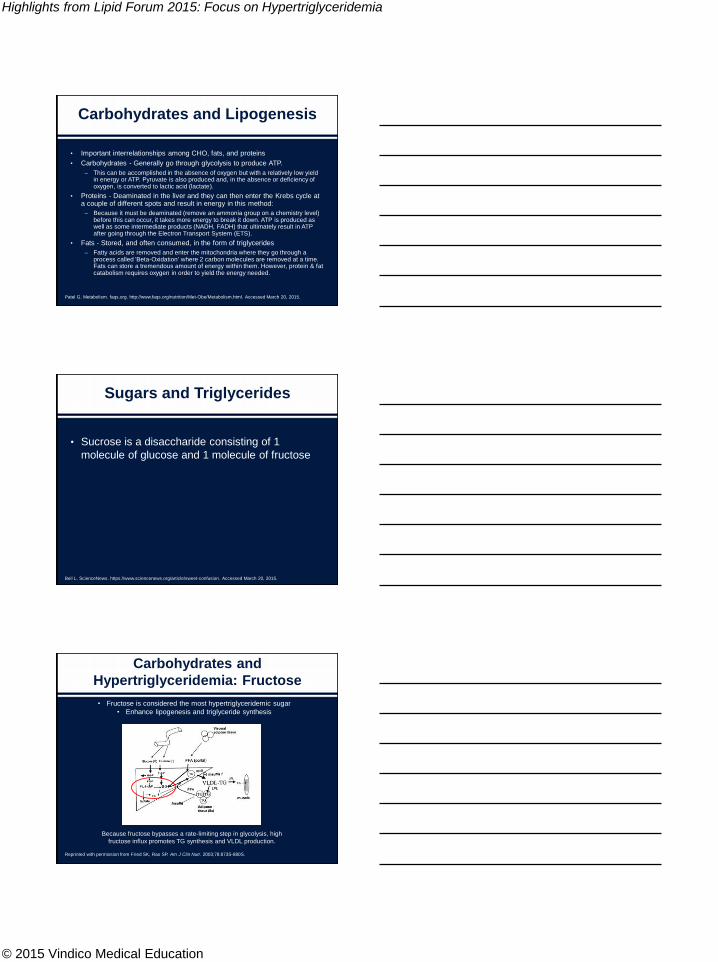
Carbohydrates and
Hypertriglyceridemia: Fructose
Reprinted with permission from Fried SK, Rao SP. Am J Clin Nutr. 2003;78:873S-880S.
Because fructose bypasses a rate-limiting step in glycolysis, high
fructose influx promotes TG synthesis and VLDL production.
• Fructose is considered the most hypertriglyceridemic sugar
• Enhance lipogenesis and triglyceride synthesis
Highlights from Lipid Forum 2015: Focus on Hypertriglyceridemia
© 2015 Vindico Medical Education
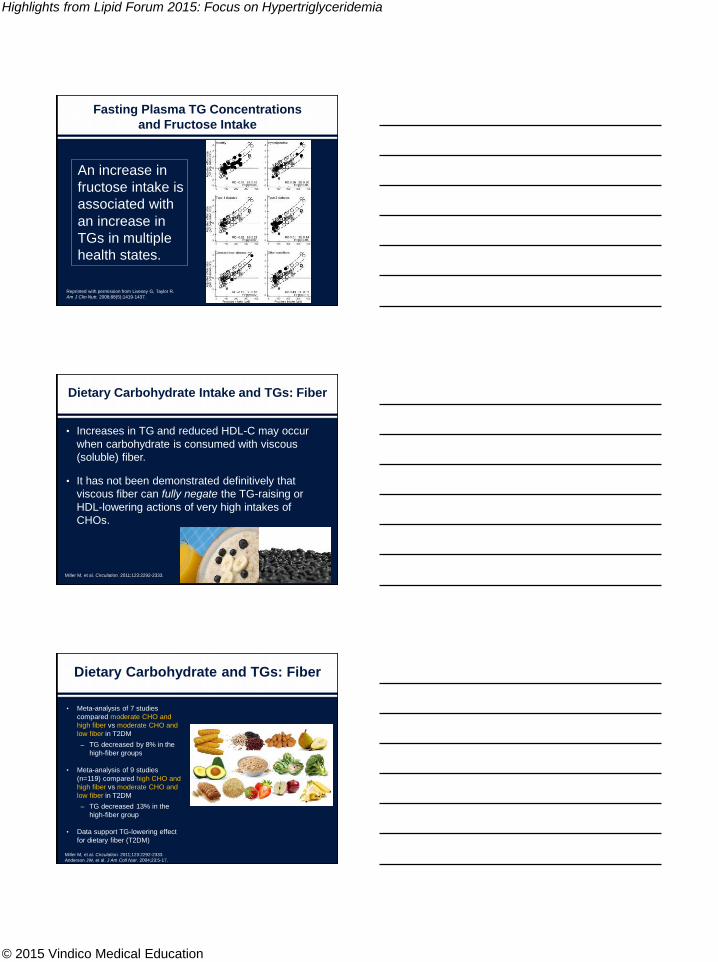
Fasting Plasma TG Concentrations
and Fructose Intake
Reprinted with permission from Livesey G, Taylor R.
Am J Clin Nutr. 2008;88(5):1419-1437.
An increase in
fructose intake is
associated with
an increase in
TGs in multiple
health states.
Dietary Carbohydrate Intake and TGs: Fiber
• Increases in TG and reduced HDL-C may occur
when carbohydrate is consumed with viscous
(soluble) fiber.
• It has not been demonstrated definitively that
viscous fiber can fully negate the TG-raising or
HDL-lowering actions of very high intakes of
CHOs.
Miller M, et al. Circulation. 2011;123:2292-2333.
Dietary Carbohydrate and TGs: Fiber
• Meta-analysis of 7 studies
compared moderate CHO and
high fiber vs moderate CHO and
low fiber in T2DM
– TG decreased by 8% in the
high-fiber groups
• Meta-analysis of 9 studies
(n=119) compared high CHO and
high fiber vs moderate CHO and
low fiber in T2DM
– TG decreased 13% in the
high-fiber group
• Data support TG-lowering effect
for dietary fiber (T2DM)
Miller M, et al. Circulation. 2011;123:2292-2333.
Anderson JW, et al. J Am Coll Nutr. 2004;23:5-17.
Highlights from Lipid Forum 2015: Focus on Hypertriglyceridemia
© 2015 Vindico Medical Education
Dietary Management of
Hypertriglyceridemia
• 1) Implement a Mediterranean style diet
– Mean reduction in triglycerides 10%-15%
• 2) Add long chain omega-3 polyunsaturated fatty acids
– Mean reduction: 5%-10% per gram
• 3) Decrease carbohydrate intake (1% energy replacement
with monounsaturated or polyunsaturated fatty acids)
– Mean TG reduction: 1%-2%
• 4) Eliminate trans fats (1% replacement with
monounsaturated fatty acids or polyunsaturated fatty acids)
– Mean reduction: 1%-2%
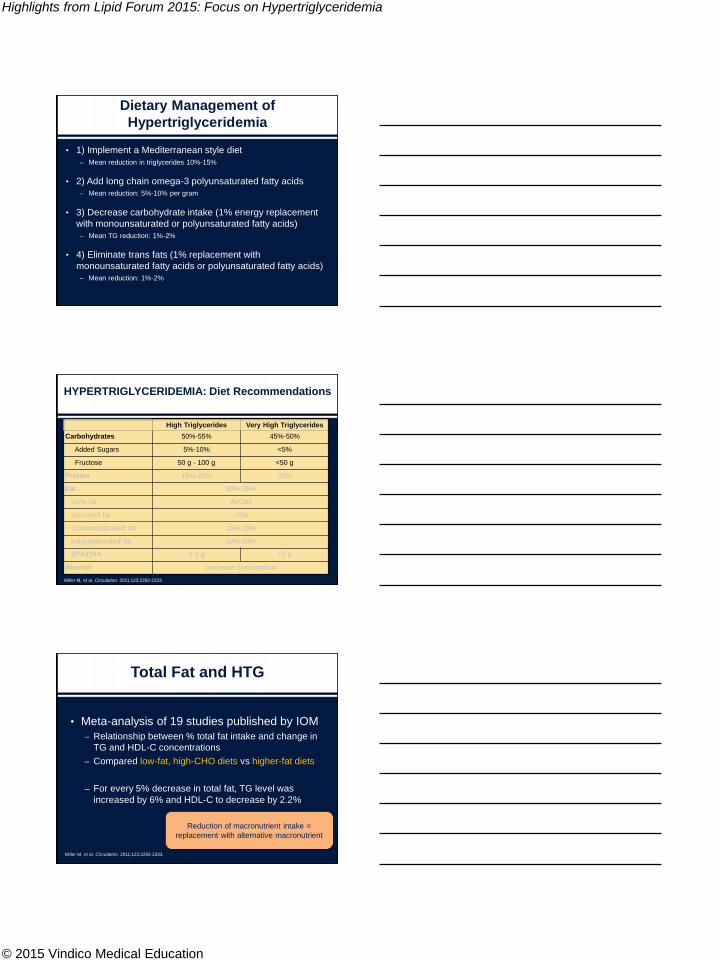
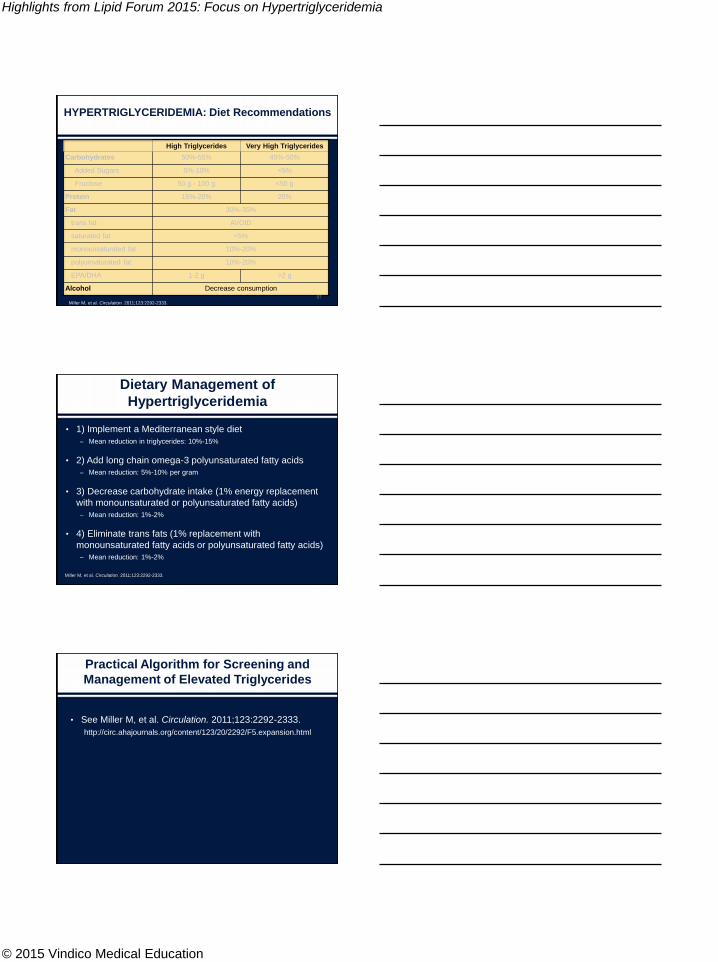
HYPERTRIGLYCERIDEMIA: Diet Recommendations
High Triglycerides Very High Triglycerides
Carbohydrates 50%-55% 45%-50%
Added Sugars 5%-10% <5%
Fructose 50 g - 100 g <50 g
Protein 15%-20% 20%
Fat 30%-35%
trans fat AVOID
saturated fat <5%
monounsaturated fat 10%-20%
polyunsaturated fat 10%-20%
EPA/DHA 1-2 g >2 g
Alcohol Decrease consumption
Miller M, et al. Circulation. 2011;123:2292-2333.
Total Fat and HTG
• Meta-analysis of 19 studies published by IOM
– Relationship between % total fat intake and change in
TG and HDL-C concentrations
– Compared low-fat, high-CHO diets vs higher-fat diets
– For every 5% decrease in total fat, TG level was
increased by 6% and HDL-C to decrease by 2.2%
Miller M, et al. Circulation. 2011;123:2292-2333.
Reduction of macronutrient intake =
replacement with alternative macronutrient
Highlights from Lipid Forum 2015: Focus on Hypertriglyceridemia
© 2015 Vindico Medical Education
Total Fat and HTG
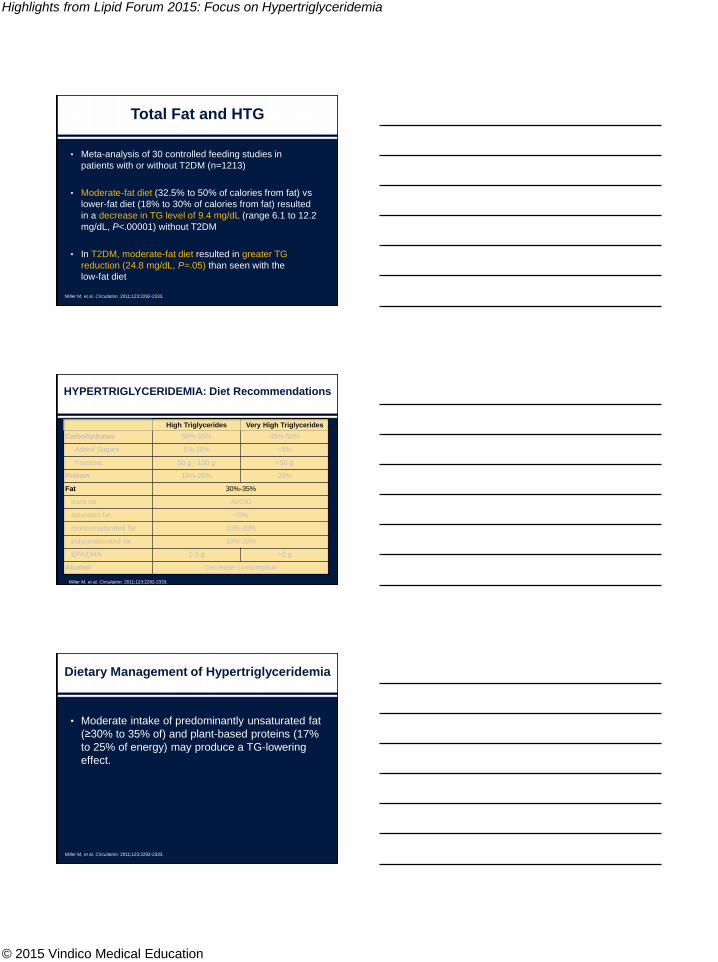
• Meta-analysis of 30 controlled feeding studies in
patients with or without T2DM (n=1213)
• Moderate-fat diet (32.5% to 50% of calories from fat) vs
lower-fat diet (18% to 30% of calories from fat) resulted
in a decrease in TG level of 9.4 mg/dL (range 6.1 to 12.2
mg/dL, P<.00001) without T2DM
• In T2DM, moderate-fat diet resulted in greater TG
reduction (24.8 mg/dL, P=.05) than seen with the
low-fat diet
Miller M, et al. Circulation. 2011;123:2292-2333.
HYPERTRIGLYCERIDEMIA: Diet Recommendations
High Triglycerides Very High Triglycerides
Carbohydrates 50%-55% 45%-50%
Added Sugars 5%-10% <5%
Fructose 50 g - 100 g <50 g
Protein 15%-20% 20%
Fat 30%-35%
trans fat AVOID
saturated fat <5%
monounsaturated fat 10%-20%
polyunsaturated fat 10%-20%
EPA/DHA 1-2 g >2 g
Alcohol Decrease consumption
Miller M, et al. Circulation. 2011;123:2292-2333.
Dietary Management of Hypertriglyceridemia
• Moderate intake of predominantly unsaturated fat
(≥30% to 35% of) and plant-based proteins (17%
to 25% of energy) may produce a TG-lowering
effect.
Miller M, et al. Circulation. 2011;123:2292-2333.
Highlights from Lipid Forum 2015: Focus on Hypertriglyceridemia
© 2015 Vindico Medical Education
Types of Dietary Fat and HTG
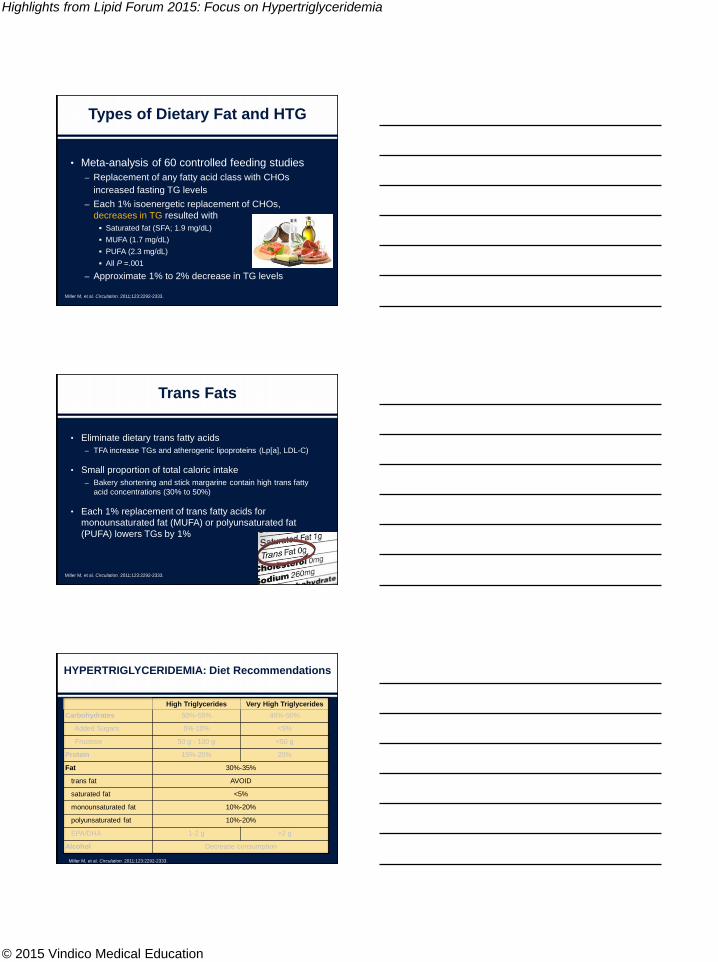
• Meta-analysis of 60 controlled feeding studies
– Replacement of any fatty acid class with CHOs
increased fasting TG levels
– Each 1% isoenergetic replacement of CHOs,
decreases in TG resulted with
Saturated fat (SFA; 1.9 mg/dL)
MUFA (1.7 mg/dL)
PUFA (2.3 mg/dL)
All P =.001
– Approximate 1% to 2% decrease in TG levels
Miller M, et al. Circulation. 2011;123:2292-2333.
Trans Fats
• Eliminate dietary trans fatty acids
– TFA increase TGs and atherogenic lipoproteins (Lp[a], LDL-C)
• Small proportion of total caloric intake
– Bakery shortening and stick margarine contain high trans fatty
acid concentrations (30% to 50%)
• Each 1% replacement of trans fatty acids for
monounsaturated fat (MUFA) or polyunsaturated fat
(PUFA) lowers TGs by 1%
Miller M, et al. Circulation. 2011;123:2292-2333.
HYPERTRIGLYCERIDEMIA: Diet Recommendations
High Triglycerides Very High Triglycerides
Carbohydrates 50%-55% 45%-50%
Added Sugars 5%-10% <5%
Fructose 50 g - 100 g <50 g
Protein 15%-20% 20%
Fat 30%-35%
trans fat AVOID
saturated fat <5%
monounsaturated fat 10%-20%
polyunsaturated fat 10%-20%
EPA/DHA 1-2 g >2 g
Alcohol Decrease consumption
Miller M, et al. Circulation. 2011;123:2292-2333.
Highlights from Lipid Forum 2015: Focus on Hypertriglyceridemia
© 2015 Vindico Medical Education
Mediterranean Dietary Pattern and TGs
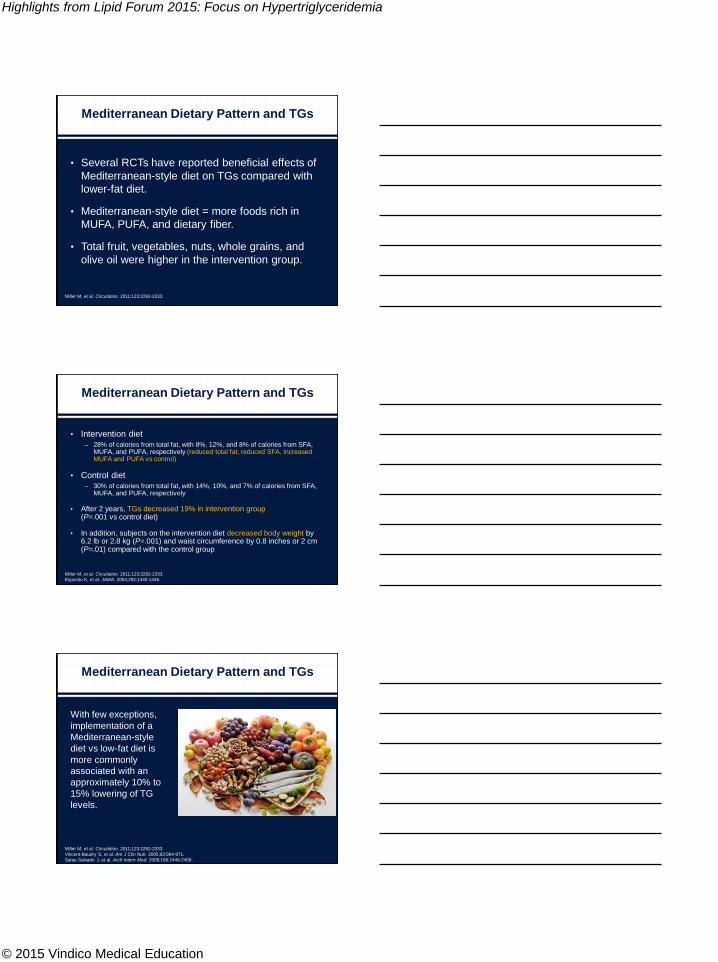
• Several RCTs have reported beneficial effects of
Mediterranean-style diet on TGs compared with
lower-fat diet.
• Mediterranean-style diet = more foods rich in
MUFA, PUFA, and dietary fiber.
• Total fruit, vegetables, nuts, whole grains, and
olive oil were higher in the intervention group.
Miller M, et al. Circulation. 2011;123:2292-2333.
Mediterranean Dietary Pattern and TGs
• Intervention diet – 28% of calories from total fat, with 8%, 12%, and 8% of calories from SFA,
MUFA, and PUFA, respectively (reduced total fat, reduced SFA, increased MUFA and PUFA vs control)
• Control diet – 30% of calories from total fat, with 14%, 10%, and 7% of calories from SFA,
MUFA, and PUFA, respectively
• After 2 years, TGs decreased 19% in intervention group(P=.001 vs control diet)
• In addition, subjects on the intervention diet decreased body weight by 6.2 lb or 2.8 kg (P=.001) and waist circumference by 0.8 inches or 2 cm (P=.01) compared with the control group
Miller M, et al. Circulation. 2011;123:2292-2333.
Esposito K, et al. JAMA. 2004;292:1440-1446.
Mediterranean Dietary Pattern and TGs
With few exceptions,
implementation of a
Mediterranean-style
diet vs low-fat diet is
more commonly
associated with an
approximately 10% to
15% lowering of TG
levels.
Miller M, et al. Circulation. 2011;123:2292-2333.
Vincent-Baudry S, et al. Am J Clin Nutr. 2005;82:964-971.
Salas-Salvado J, et al. Arch Intern Med. 2008;168:2449-2458.
Highlights from Lipid Forum 2015: Focus on Hypertriglyceridemia
© 2015 Vindico Medical Education
Omega-3 Fatty Acids and HTG
Miller M, et al. Circulation. 2011;123:2292-2333.
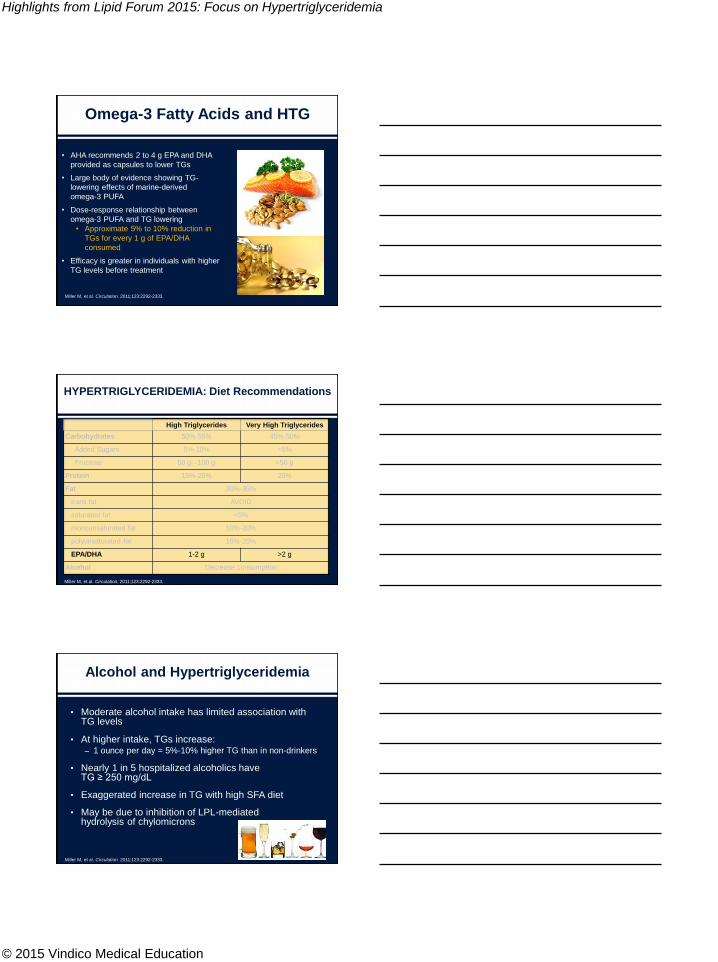
• AHA recommends 2 to 4 g EPA and DHA
provided as capsules to lower TGs
• Large body of evidence showing TG-
lowering effects of marine-derived
omega-3 PUFA
• Dose-response relationship between
omega-3 PUFA and TG lowering
• Approximate 5% to 10% reduction in
TGs for every 1 g of EPA/DHA
consumed
• Efficacy is greater in individuals with higher
TG levels before treatment
HYPERTRIGLYCERIDEMIA: Diet Recommendations
High Triglycerides Very High Triglycerides
Carbohydrates 50%-55% 45%-50%
Added Sugars 5%-10% <5%
Fructose 50 g - 100 g <50 g
Protein 15%-20% 20%
Fat 30%-35%
trans fat AVOID
saturated fat <5%
monounsaturated fat 10%-20%
polyunsaturated fat 10%-20%
EPA/DHA 1-2 g >2 g
Alcohol Decrease consumption
Miller M, et al. Circulation. 2011;123:2292-2333.
Alcohol and Hypertriglyceridemia
• Moderate alcohol intake has limited association with TG levels
• At higher intake, TGs increase:– 1 ounce per day = 5%-10% higher TG than in non-drinkers
• Nearly 1 in 5 hospitalized alcoholics have TG ≥ 250 mg/dL
• Exaggerated increase in TG with high SFA diet
• May be due to inhibition of LPL-mediated hydrolysis of chylomicrons
Miller M, et al. Circulation. 2011;123:2292-2333.
Highlights from Lipid Forum 2015: Focus on Hypertriglyceridemia
© 2015 Vindico Medical Education
HYPERTRIGLYCERIDEMIA: Diet Recommendations
High Triglycerides Very High Triglycerides
Carbohydrates 50%-55% 45%-50%
Added Sugars 5%-10% <5%
Fructose 50 g - 100 g <50 g
Protein 15%-20% 20%
Fat 30%-35%
trans fat AVOID
saturated fat <5%
monounsaturated fat 10%-20%
polyunsaturated fat 10%-20%
EPA/DHA 1-2 g >2 g
Alcohol Decrease consumption
Miller M, et al. Circulation. 2011;123:2292-2333.
97
Dietary Management of
Hypertriglyceridemia
• 1) Implement a Mediterranean style diet
– Mean reduction in triglycerides: 10%-15%
• 2) Add long chain omega-3 polyunsaturated fatty acids
– Mean reduction: 5%-10% per gram
• 3) Decrease carbohydrate intake (1% energy replacement
with monounsaturated or polyunsaturated fatty acids)
– Mean reduction: 1%-2%
• 4) Eliminate trans fats (1% replacement with
monounsaturated fatty acids or polyunsaturated fatty acids)
– Mean reduction: 1%-2%
Miller M, et al. Circulation. 2011;123:2292-2333.
Practical Algorithm for Screening and
Management of Elevated Triglycerides
• See Miller M, et al. Circulation. 2011;123:2292-2333.
http://circ.ahajournals.org/content/123/20/2292/F5.expansion.html
Highlights from Lipid Forum 2015: Focus on Hypertriglyceridemia
© 2015 Vindico Medical Education
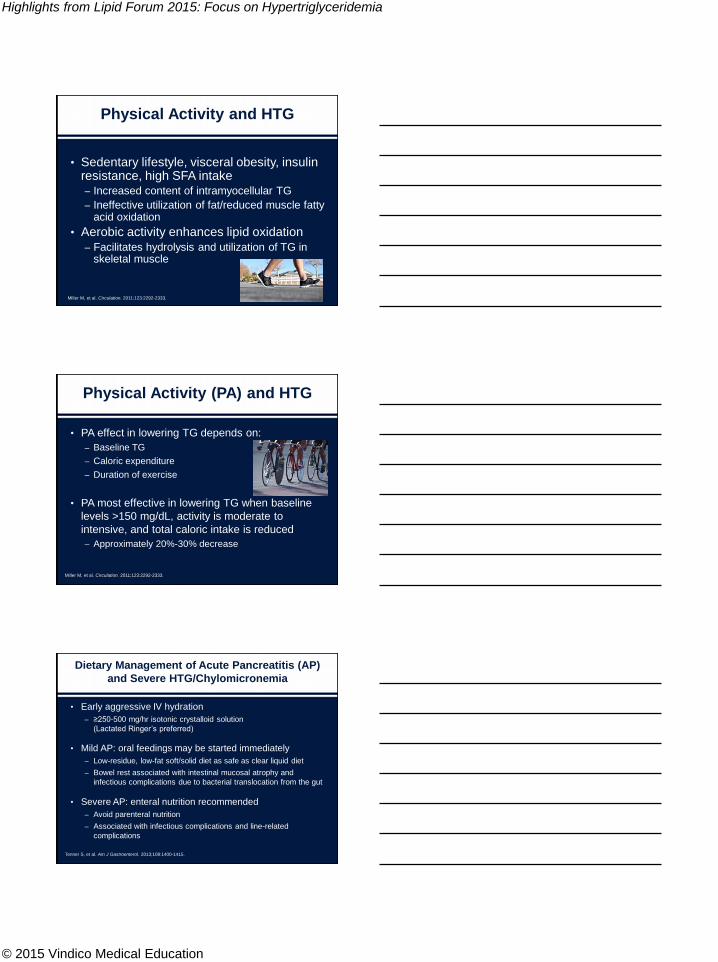
Physical Activity and HTG
• Sedentary lifestyle, visceral obesity, insulin resistance, high SFA intake– Increased content of intramyocellular TG
– Ineffective utilization of fat/reduced muscle fatty acid oxidation
• Aerobic activity enhances lipid oxidation– Facilitates hydrolysis and utilization of TG in
skeletal muscle
Miller M, et al. Circulation. 2011;123:2292-2333.
Physical Activity (PA) and HTG
• PA effect in lowering TG depends on:
– Baseline TG
– Caloric expenditure
– Duration of exercise
• PA most effective in lowering TG when baseline
levels >150 mg/dL, activity is moderate to
intensive, and total caloric intake is reduced
– Approximately 20%-30% decrease
Miller M, et al. Circulation. 2011;123:2292-2333.
Dietary Management of Acute Pancreatitis (AP)
and Severe HTG/Chylomicronemia
• Early aggressive IV hydration
– ≥250-500 mg/hr isotonic crystalloid solution
(Lactated Ringer’s preferred)
• Mild AP: oral feedings may be started immediately
– Low-residue, low-fat soft/solid diet as safe as clear liquid diet
– Bowel rest associated with intestinal mucosal atrophy and
infectious complications due to bacterial translocation from the gut
• Severe AP: enteral nutrition recommended
– Avoid parenteral nutrition
– Associated with infectious complications and line-related
complications
Tenner S, et al. Am J Gastroenterol. 2013;108:1400-1415.
Highlights from Lipid Forum 2015: Focus on Hypertriglyceridemia
© 2015 Vindico Medical Education
Summary: Diet and HTG
• Weight loss and implementation of Mediterranean dietary pattern result in greatest reduction in TG
• Increase intake of marine-derived PUFA (EPA/DHA)
• Elimination trans fat and reduction of refined carbohydrates result in more modest reductions in TGs
• Eliminate or limit alcohol intake
Miller M, et al. Circulation. 2011;123:2292-2333.
Are All Omega-3 Fish Oils
the Same?
Examining the Evidence: EPA, DHA, or Both?
R. Scott Wright, MDProfessor of Medicine
Mayo Clinic College of Medicine
Rochester, MN
Overview of -3 Fatty Acids and
-3 Products
• Objectives
– Discuss differences in forms of EPA and DHA present
in available fish oil preparations.
– Understand differences in the amounts of -3 fatty
acids in currently available prescription fish oil products
and in OTC dietary supplements.
– Review differences in the effects of EPA and DHA
formulations on lipid, lipoprotein levels, and apoC-III.
DHA, docosahexaenoic acid
EPA, eicosapentaenoic acid
Highlights from Lipid Forum 2015: Focus on Hypertriglyceridemia
© 2015 Vindico Medical Education
Overview of -3 Fatty Acids
and -3 Products
• Formulations
• Metabolism
• Bioavailability: Short-term, long-term
• Dosing: With or without high-fat meal
• EPA vs DHA
• Lipid / lipoprotein effects
Overview of -3 Fatty Acids
• Long-chain omega-3 fatty acids are primarily found
in cold-water organisms.
• The High number of double bonds lowers the
melting point.
• At low temperatures, biological structures retain the
fluidity necessary for life processes.
• Coldwater fish, microalgae, and Antarctic krill are
the greatest sources.
Schuchardt J, Hahn A. Prostaglandins, Leukot Essent Fatty Acids. 2013;89:1-8.
Different Forms of EPA and DHA
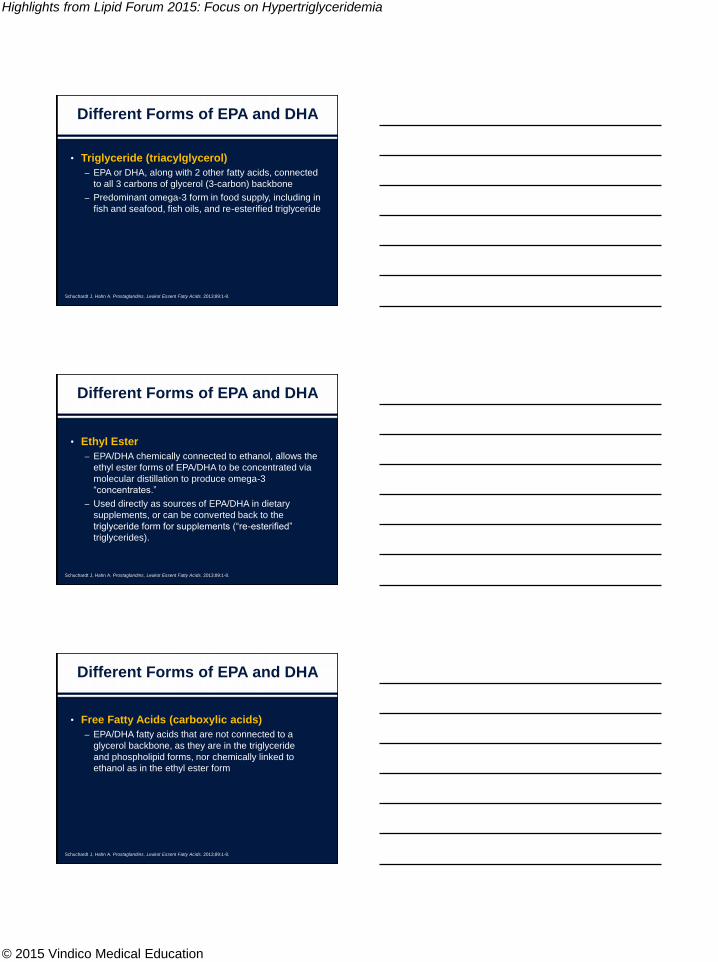
• Triglyceride (triacylglycerol)
• Ethyl Ester
• Free Fatty Acid (carboxylic acid)
• Phospholipid
Schuchardt J, Hahn A. Prostaglandins, Leukot Essent Fatty Acids. 2013;89:1-8.
Highlights from Lipid Forum 2015: Focus on Hypertriglyceridemia
© 2015 Vindico Medical Education
Different Forms of EPA and DHA
• Triglyceride (triacylglycerol)
– EPA or DHA, along with 2 other fatty acids, connected
to all 3 carbons of glycerol (3-carbon) backbone
– Predominant omega-3 form in food supply, including in
fish and seafood, fish oils, and re-esterified triglyceride
Schuchardt J, Hahn A. Prostaglandins, Leukot Essent Fatty Acids. 2013;89:1-8.
Different Forms of EPA and DHA
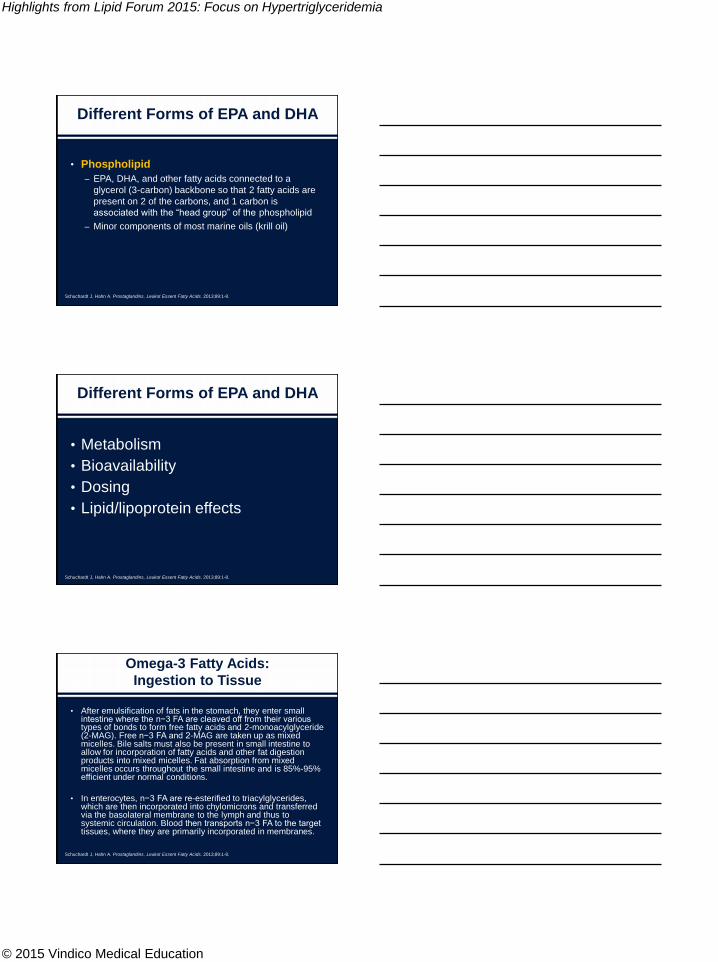
• Ethyl Ester
– EPA/DHA chemically connected to ethanol, allows the
ethyl ester forms of EPA/DHA to be concentrated via
molecular distillation to produce omega-3
“concentrates.”
– Used directly as sources of EPA/DHA in dietary
supplements, or can be converted back to the
triglyceride form for supplements (“re-esterified”
triglycerides).
Schuchardt J, Hahn A. Prostaglandins, Leukot Essent Fatty Acids. 2013;89:1-8.
Different Forms of EPA and DHA
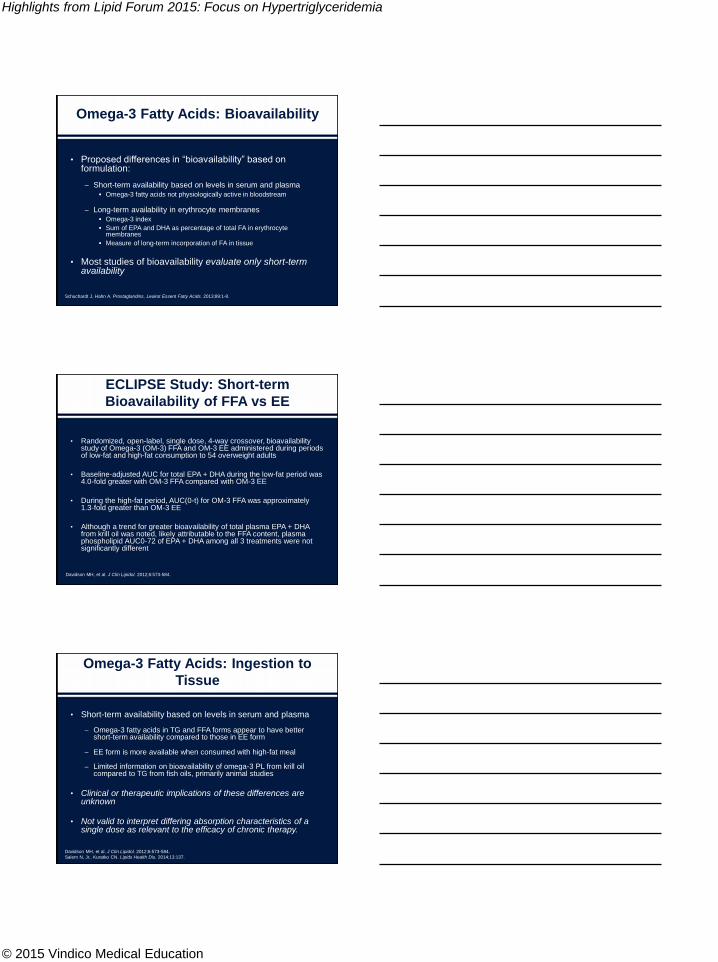
• Free Fatty Acids (carboxylic acids)
– EPA/DHA fatty acids that are not connected to a
glycerol backbone, as they are in the triglyceride
and phospholipid forms, nor chemically linked to
ethanol as in the ethyl ester form
Schuchardt J, Hahn A. Prostaglandins, Leukot Essent Fatty Acids. 2013;89:1-8.
Highlights from Lipid Forum 2015: Focus on Hypertriglyceridemia
© 2015 Vindico Medical Education
Different Forms of EPA and DHA
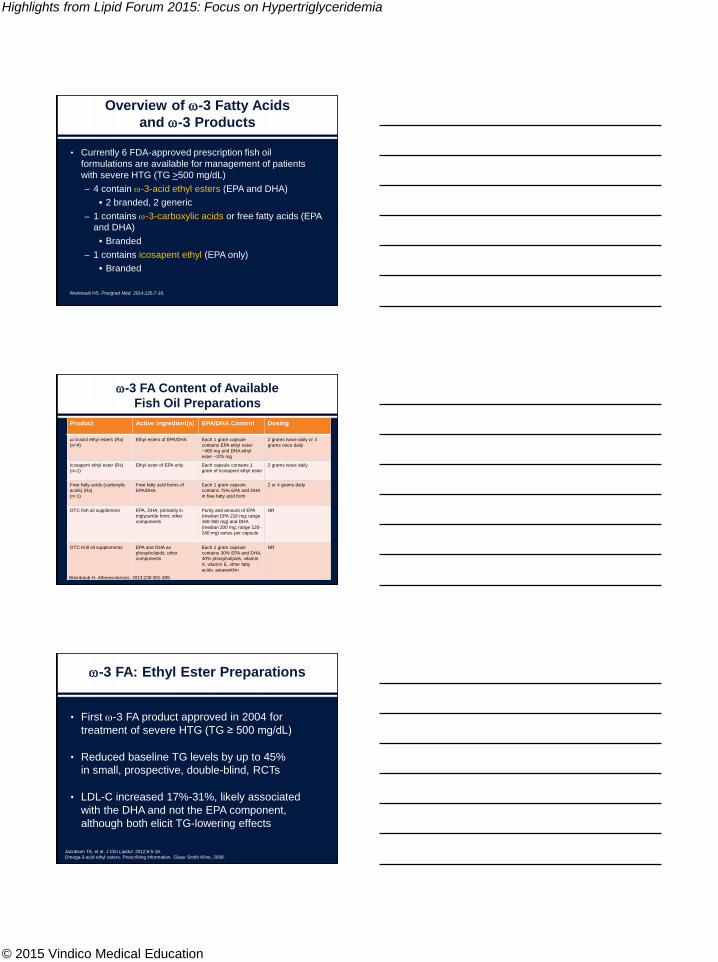
• Phospholipid
– EPA, DHA, and other fatty acids connected to a
glycerol (3-carbon) backbone so that 2 fatty acids are
present on 2 of the carbons, and 1 carbon is
associated with the “head group” of the phospholipid
– Minor components of most marine oils (krill oil)
Schuchardt J, Hahn A. Prostaglandins, Leukot Essent Fatty Acids. 2013;89:1-8.
Different Forms of EPA and DHA
• Metabolism
• Bioavailability
• Dosing
• Lipid/lipoprotein effects
Schuchardt J, Hahn A. Prostaglandins, Leukot Essent Fatty Acids. 2013;89:1-8.
Omega-3 Fatty Acids:
Ingestion to Tissue
• After emulsification of fats in the stomach, they enter small intestine where the n−3 FA are cleaved off from their various types of bonds to form free fatty acids and 2-monoacylglyceride (2-MAG). Free n−3 FA and 2-MAG are taken up as mixed micelles. Bile salts must also be present in small intestine to allow for incorporation of fatty acids and other fat digestion products into mixed micelles. Fat absorption from mixed micelles occurs throughout the small intestine and is 85%-95% efficient under normal conditions.
• In enterocytes, n−3 FA are re-esterified to triacylglycerides, which are then incorporated into chylomicrons and transferred via the basolateral membrane to the lymph and thus to systemic circulation. Blood then transports n−3 FA to the target tissues, where they are primarily incorporated in membranes.
Schuchardt J, Hahn A. Prostaglandins, Leukot Essent Fatty Acids. 2013;89:1-8.
Highlights from Lipid Forum 2015: Focus on Hypertriglyceridemia
© 2015 Vindico Medical Education
Omega-3 Fatty Acids: Bioavailability
Schuchardt J, Hahn A. Prostaglandins, Leukot Essent Fatty Acids. 2013;89:1-8.
• Proposed differences in “bioavailability” based on formulation:
– Short-term availability based on levels in serum and plasma Omega-3 fatty acids not physiologically active in bloodstream
– Long-term availability in erythrocyte membranes Omega-3 index
Sum of EPA and DHA as percentage of total FA in erythrocyte membranes
Measure of long-term incorporation of FA in tissue
• Most studies of bioavailability evaluate only short-term availability
Davidson MH, et al. J Clin Lipidol. 2012;6:573-584.
ECLIPSE Study: Short-term
Bioavailability of FFA vs EE
• Randomized, open-label, single dose, 4-way crossover, bioavailability study of Omega-3 (OM-3) FFA and OM-3 EE administered during periods of low-fat and high-fat consumption to 54 overweight adults
• Baseline-adjusted AUC for total EPA + DHA during the low-fat period was 4.0-fold greater with OM-3 FFA compared with OM-3 EE
• During the high-fat period, AUC(0-t) for OM-3 FFA was approximately 1.3-fold greater than OM-3 EE
• Although a trend for greater bioavailability of total plasma EPA + DHA from krill oil was noted, likely attributable to the FFA content, plasma phospholipid AUC0-72 of EPA + DHA among all 3 treatments were not significantly different
Omega-3 Fatty Acids: Ingestion to
Tissue
Davidson MH, et al. J Clin Lipidol. 2012;6:573-584.
Salem N, Jr., Kuratko CN. Lipids Health Dis. 2014;13:137.
• Short-term availability based on levels in serum and plasma
– Omega-3 fatty acids in TG and FFA forms appear to have better short-term availability compared to those in EE form
– EE form is more available when consumed with high-fat meal
– Limited information on bioavailability of omega-3 PL from krill oil compared to TG from fish oils, primarily animal studies
• Clinical or therapeutic implications of these differences are unknown
• Not valid to interpret differing absorption characteristics of a single dose as relevant to the efficacy of chronic therapy.
Highlights from Lipid Forum 2015: Focus on Hypertriglyceridemia
© 2015 Vindico Medical Education
Overview of -3 Fatty Acids
and -3 Products
• Currently 6 FDA-approved prescription fish oil
formulations are available for management of patients
with severe HTG (TG >500 mg/dL)
– 4 contain -3-acid ethyl esters (EPA and DHA)
2 branded, 2 generic
– 1 contains -3-carboxylic acids or free fatty acids (EPA
and DHA)
Branded
– 1 contains icosapent ethyl (EPA only)
Branded
Weintraub HS. Postgrad Med. 2014;126:7-18.
-3 FA Content of Available
Fish Oil Preparations
Product Active ingredient(s) EPA/DHA Content Dosing
ω-3-acid ethyl esters (Rx)
(n=4)
Ethyl esters of EPA/DHA Each 1 gram capsule
contains EPA ethyl ester
~465 mg and DHA ethyl
ester ~375 mg
2 grams twice daily or 4
grams once daily
Icosapent ethyl ester (Rx)
(n=1)
Ethyl ester of EPA only Each capsule contains 1
gram of icosapent ethyl ester
2 grams twice daily
Free fatty acids (carboxylic
acids) (Rx)
(n=1)
Free fatty acid forms of
EPA/DHA
Each 1 gram capsule
contains 75% EPA and DHA
in free fatty acid form
2 or 4 grams daily
OTC fish oil supplement EPA, DHA, primarily in
triglyceride form; other
components
Purity and amount of EPA
(median EPA 216 mg; range
160-360 mg) and DHA
(median 200 mg; range 120-
240 mg) varies per capsule
NR
OTC Krill oil supplements EPA and DHA as
phospholipids; other
components
Each 1 gram capsule
contains 30% EPA and DHA,
40% phospholipids, vitamin
A, vitamin E, other fatty
acids, astaxanthin
NR
Weintraub H. Atherosclerosis. 2013;230:381-389.
-3 FA: Ethyl Ester Preparations
• First -3 FA product approved in 2004 for
treatment of severe HTG (TG ≥ 500 mg/dL)
• Reduced baseline TG levels by up to 45%
in small, prospective, double-blind, RCTs
• LDL-C increased 17%-31%, likely associated
with the DHA and not the EPA component,
although both elicit TG-lowering effects
Jacobson TA, et al. J Clin Lipidol. 2012;6:5-18.
Omega-3-acid ethyl esters. Prescribing Information. Glaxo Smith Kline. 2008.
Highlights from Lipid Forum 2015: Focus on Hypertriglyceridemia
© 2015 Vindico Medical Education
-3 FA: Icosapent Ethyl (EPA only)
• Icosapent ethyl approved for severe HTG (≥500 mg/dL)
in 2012
• -3 formulation without DHA
• Does not cause an increase in LDL-C
– 4-g daily dose reduced total LDL-C by 16.3%
– 2-g daily dose led to non-significant increase in LDL-C
• TG reduced 25%-45% with 4-g daily dose in multicenter,
placebo-controlled, randomized, double-blind, 12-week
study
Weintraub H. Atherosclerosis. 2013;230:381-389.
-3 FA: Carboxylic Acid Form
• Approved for severe HTG in May 2014
• EPA and DHA in FFA form
– 50%-60% EPA and 15-25% DHA
• 12-week RCT (151 pts with severe HTG between
500 and 2000 mg/dL)
– TG reduced 33% compared to placebo
– No significant change in LDL-C or HDL-C
• Not yet commercially available
Weintraub H. Atherosclerosis. 2013;230:381-389.
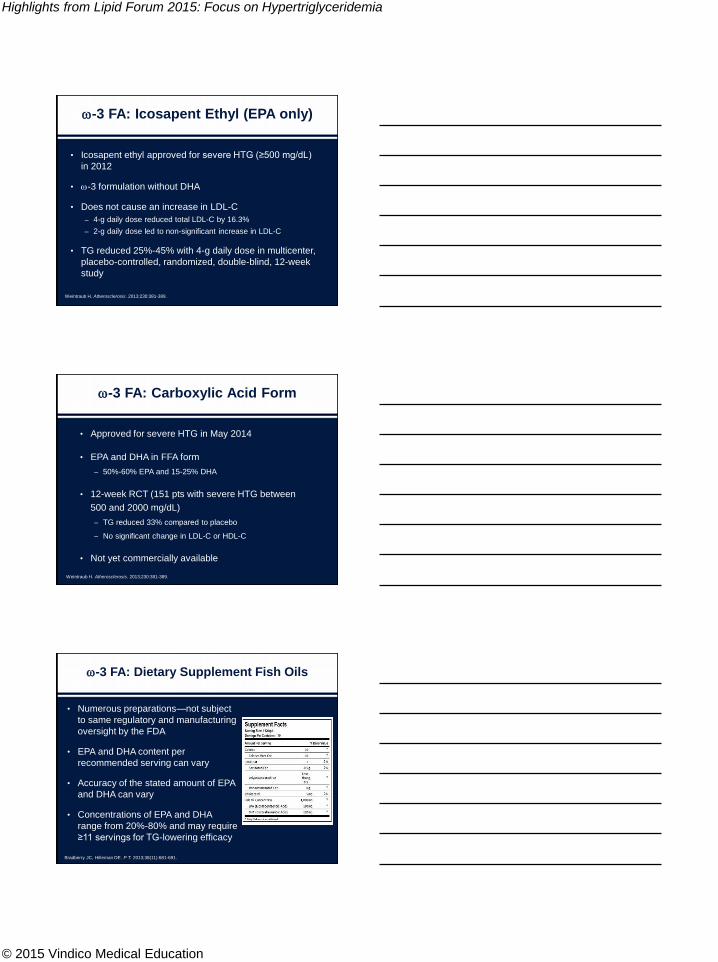
-3 FA: Dietary Supplement Fish Oils
• Numerous preparations—not subject
to same regulatory and manufacturing
oversight by the FDA
• EPA and DHA content per
recommended serving can vary
• Accuracy of the stated amount of EPA
and DHA can vary
• Concentrations of EPA and DHA
range from 20%-80% and may require
≥11 servings for TG-lowering efficacy
Bradberry JC, Hilleman DE. P T. 2013;38(11):681-691.
Highlights from Lipid Forum 2015: Focus on Hypertriglyceridemia
© 2015 Vindico Medical Education
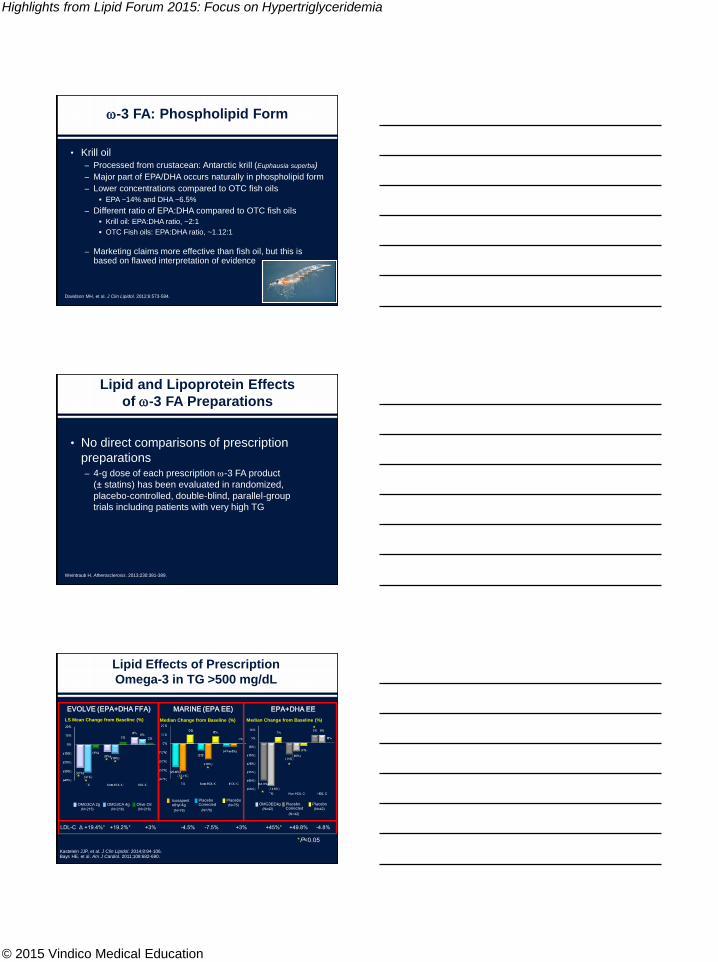
-3 FA: Phospholipid Form
Davidson MH, et al. J Clin Lipidol. 2012;6:573-584.
• Krill oil
– Processed from crustacean: Antarctic krill (Euphausia superba)
– Major part of EPA/DHA occurs naturally in phospholipid form
– Lower concentrations compared to OTC fish oils
EPA ~14% and DHA ~6.5%
– Different ratio of EPA:DHA compared to OTC fish oils
Krill oil: EPA:DHA ratio, ~2:1
OTC Fish oils: EPA:DHA ratio, ~1.12:1
– Marketing claims more effective than fish oil, but this is based on flawed interpretation of evidence
Lipid and Lipoprotein Effects
of -3 FA Preparations
Weintraub H. Atherosclerosis. 2013;230:381-389.
• No direct comparisons of prescription
preparations– 4-g dose of each prescription -3 FA product
(± statins) has been evaluated in randomized,
placebo-controlled, double-blind, parallel-group
trials including patients with very high TG
Lipid Effects of Prescription
Omega-3 in TG >500 mg/dL
Olive Oil(N=216)
OMG3CA 2g(N=215)
OMG3CA 4g(N=216)
EVOLVE (EPA+DHA FFA)
LS Mean Change from Baseline (%)
MARINE (EPA EE)
Placebo
(N=75)
Icosapent ethyl 4g
(N=76)
PlaceboCorrected
(N=76)
Median Change from Baseline (%)
Placebo
(N=42)
OMG3EE4g
(N=42)
PlaceboCorrected
(N=42)
Median Change from Baseline (%)
EPA+DHA EE
LDL-C Δ +19.4%* +19.2%* +3% -4.5% -7.5% +3% +45%* +49.8% -4.8%
*P<0.05
**
* *
*
*
*
*
*
Kastelein JJP, et al. J Clin Lipidol. 2014;8:94-106.Bays HE, et al. Am J Cardiol. 2011;108:682-690.
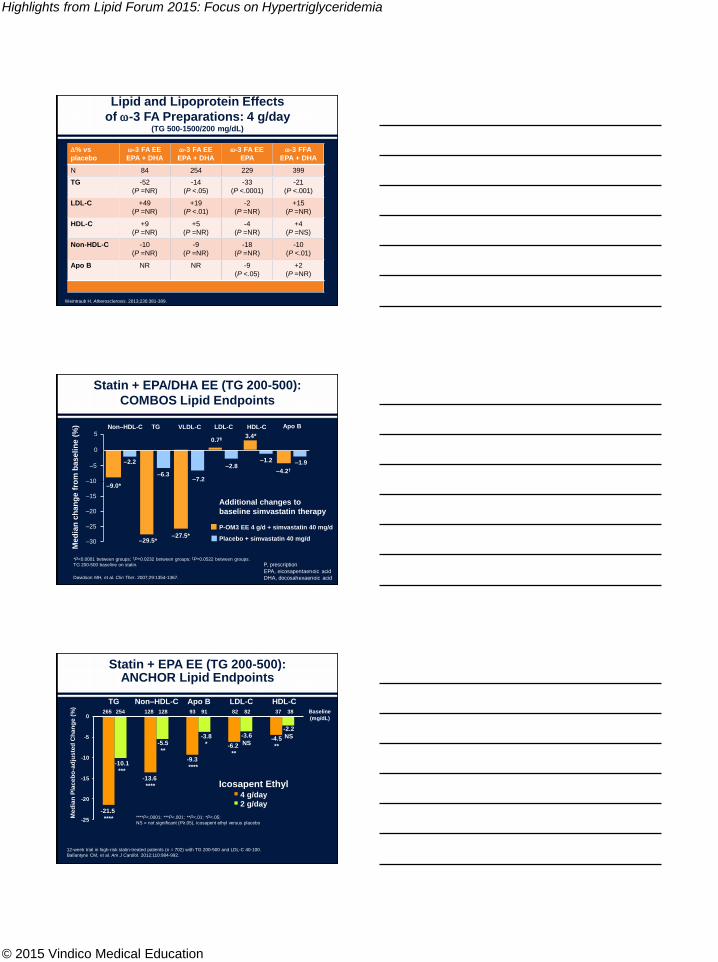
Highlights from Lipid Forum 2015: Focus on Hypertriglyceridemia
© 2015 Vindico Medical Education
Lipid and Lipoprotein Effects
of -3 FA Preparations: 4 g/day (TG 500-1500/200 mg/dL)
% vs
placebo
-3 FA EE
EPA + DHA
-3 FA EE
EPA + DHA
-3 FA EE
EPA
-3 FFA
EPA + DHA
N 84 254 229 399
TG -52
(P =NR)
-14
(P <.05)
-33
(P <.0001)
-21
(P <.001)
LDL-C +49
(P =NR)
+19
(P <.01)
-2
(P =NR)
+15
(P =NR)
HDL-C +9
(P =NR)
+5
(P =NR)
-4
(P =NR)
+4
(P =NS)
Non-HDL-C -10
(P =NR)
-9
(P =NR)
-18
(P =NR)
-10
(P <.01)
Apo B NR NR -9
(P <.05)
+2
(P =NR)
Weintraub H. Atherosclerosis. 2013;230:381-389.
Statin + EPA/DHA EE (TG 200-500):
COMBOS Lipid Endpoints
Med
ian
ch
an
ge
fro
m b
aseli
ne (
%) TG LDL-C HDL-CVLDL-C
Additional changes to
baseline simvastatin therapy
P-OM3 EE 4 g/d + simvastatin 40 mg/d
Placebo + simvastatin 40 mg/d
5
–5
–10
–15
–20
–25
–30
3.4*
–6.3–7.2
–1.2–2.8
–29.5*
0.7‡
0
–27.5*
–4.2†
–1.9
Apo BNon–HDL-C
–9.0*
–2.2
*P<0.0001 between groups; †P=0.0232 between groups; ‡P=0.0522 between groups.
TG 200-500 baseline on statin.
Davidson MH, et al. Clin Ther. 2007;29:1354-1367.
P, prescription
EPA, eicosapentaenoic acid
DHA, docosahexaenoic acid
-25
-20
-15
-10
-5
0
Statin + EPA EE (TG 200-500): ANCHOR Lipid Endpoints
****P<.0001; ***P<.001; **P<.01; *P<.05;
NS = not significant (P≥.05), icosapent ethyl versus placebo
TG Non–HDL-C Apo B
Me
dia
n P
lac
eb
o-a
dju
ste
d C
ha
ng
e (
%)
LDL-C HDL-C
-21.5
****
-10.1
***
-13.6
****
-5.5
**
-9.3
****
-3.8
* -6.2
**
-3.6
NS-4.5
**
-2.2
NS
254265 8282128128 9193 3837 Baseline
(mg/dL)
4 g/day2 g/day
Icosapent Ethyl
12-week trial in high-risk statin-treated patients (n = 702) with TG 200-500 and LDL-C 40-100.
Ballantyne CM, et al. Am J Cardiol. 2012;110:984-992.
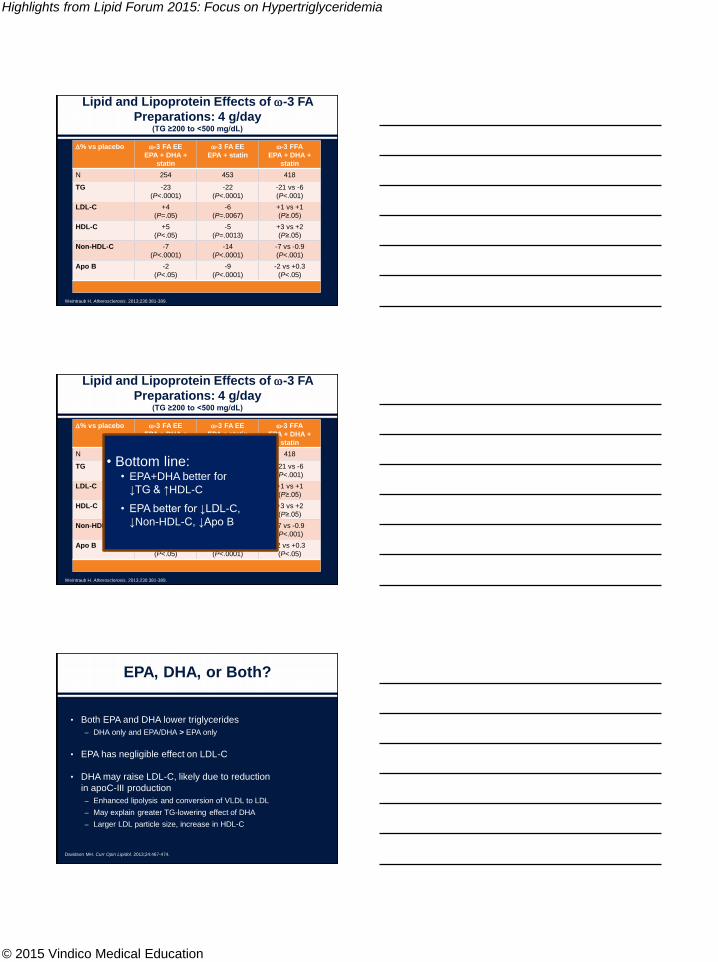
Highlights from Lipid Forum 2015: Focus on Hypertriglyceridemia
© 2015 Vindico Medical Education
Lipid and Lipoprotein Effects of -3 FA
Preparations: 4 g/day (TG ≥200 to <500 mg/dL)
% vs placebo -3 FA EE
EPA + DHA +
statin
-3 FA EE
EPA + statin
-3 FFA
EPA + DHA +
statin
N 254 453 418
TG -23
(P<.0001)
-22
(P<.0001)
-21 vs -6
(P<.001)
LDL-C +4
(P=.05)
-6
(P=.0067)
+1 vs +1
(P≥.05)
HDL-C +5
(P<.05)
-5
(P=.0013)
+3 vs +2
(P≥.05)
Non-HDL-C -7
(P<.0001)
-14
(P<.0001)
-7 vs -0.9
(P<.001)
Apo B -2
(P<.05)
-9
(P<.0001)
-2 vs +0.3
(P<.05)
Weintraub H. Atherosclerosis. 2013;230:381-389.
Lipid and Lipoprotein Effects of -3 FA
Preparations: 4 g/day (TG ≥200 to <500 mg/dL)
% vs placebo -3 FA EE
EPA + DHA +
statin
-3 FA EE
EPA + statin
-3 FFA
EPA + DHA +
statin
N 254 453 418
TG -23
(P <.0001)
-22
(P <.0001)
-21 vs -6
(P<.001)
LDL-C +4
(P =.05)
-6
(P =.0067)
+1 vs +1
(P≥.05)
HDL-C +5
(P <.05)
-5
(P =.0013)
+3 vs +2
(P≥.05)
Non-HDL-C -7
(P <.0001)
-14
(P <.0001)
-7 vs -0.9
(P<.001)
Apo B -2
(P<.05)
-9
(P<.0001)
-2 vs +0.3
(P<.05)
Weintraub H. Atherosclerosis. 2013;230:381-389.
• Bottom line: • EPA+DHA better for
↓TG & ↑HDL-C
• EPA better for ↓LDL-C,
↓Non-HDL-C, ↓Apo B
EPA, DHA, or Both?
Davidson MH. Curr Opin Lipidol. 2013;24:467-474.
• Both EPA and DHA lower triglycerides
– DHA only and EPA/DHA > EPA only
• EPA has negligible effect on LDL-C
• DHA may raise LDL-C, likely due to reduction
in apoC-III production
– Enhanced lipolysis and conversion of VLDL to LDL
– May explain greater TG-lowering effect of DHA
– Larger LDL particle size, increase in HDL-C
Highlights from Lipid Forum 2015: Focus on Hypertriglyceridemia
© 2015 Vindico Medical Education
Davidson MH. Curr Opin Lipidol. 2013;24:467-474.
EPA, DHA, or Both?
• EPA and DHA modify the composition of VLDL particles differently in patients with severe hypertriglyceridemia.
• Both EPA and DHA decrease the triglyceride composition of VLDL, but DHA also enhances the lipolysis of VLDL, resulting in greater conversion to LDL that is larger in size, as well as increases in HDL-C.
ApoC-III Promotes Dyslipidemia and
Atherosclerosis
• Liver-derived apolipoprotein is present on TG-rich
lipoproteins and HDL
• Promotes HTG by inhibiting LPL and inhibition of apo E
binding to hepatic receptors
– Thus reducing lipolysis and clearance of TG-rich lipoproteins
• ApoC-III–containing LDL is more strongly associated with
CV risk than LDL without apoC-III
HDL
Chylomicronremnants
HDL
Apolipoprotein C-III has Significant
Consequences for Lipoprotein Metabolism
1. Ooi EM, et al. Clin Sci. 2008;114:611-624; 2. Caron S, et al. Arterioscler Thromb Vasc Biol. 2011;31(3):513-519;
3. Ginsberg HN, et al. Arterioscler Thromb Vasc Biol. 2011;31:471-473; 4. Sacks FM, et al. Circulation. 2000;102:1886-1892.
ABCA1
CEFC
ApoA-I
Nascent
ApoA-Idiscs
LCAT?
Mature
CEHL
TG
Macrophage
LPL
BileLDLr
SR-B1LSR
Liver
LPL
• ApoC−III modifies particle
composition1
– Inhibits the conversion of VLDL to
LDL
– Causes an increase in small, dense LDL and a decrease in
HDL−C
• Glucose increases apoC−III gene
expression and may link diabetes and TGs2
• ApoC−III-enriched LDL can increase monocyte binding to endothelial cells3
• ApoC−III in VLDL+LDL is a marker of increased risk of recurrent coronary events4
ApoC-III Effects
LDL
VLDL
Chylomicron
___
__ ApoC-III
IDL
LSR=lipolysis stimulated lipoprotein receptor; SR-B1=scavenger
receptor class B1; LCAT=lecithin-cholesterol acyltransferase;
CETP=cholesteryl ester transfer protein; LPL=lipoprotein lipase;
LDLr=low-density lipoprotein receptor.
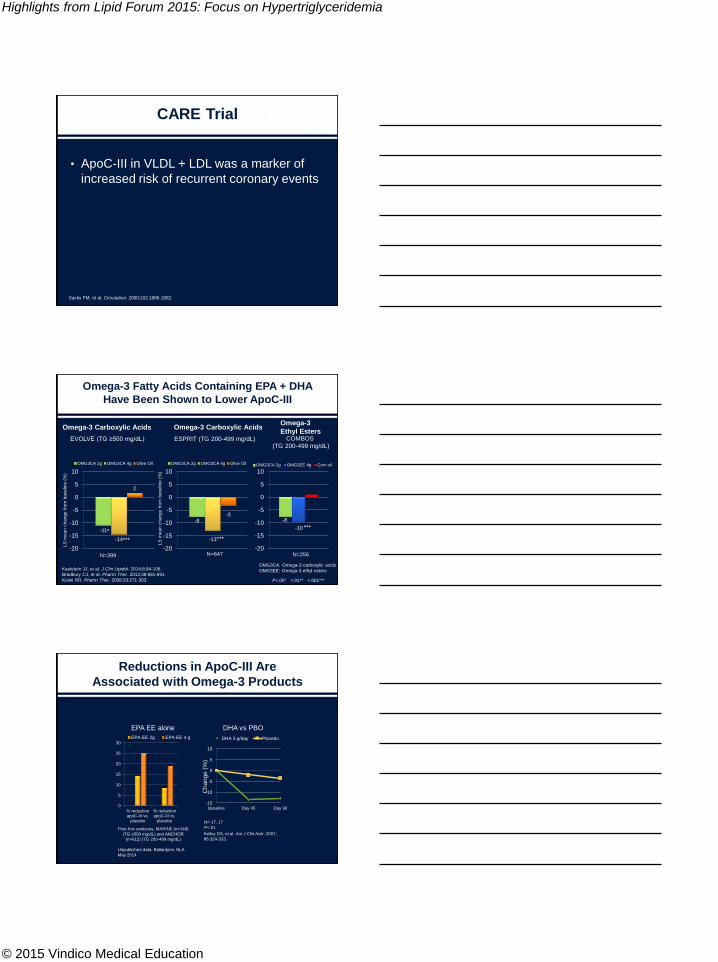
Highlights from Lipid Forum 2015: Focus on Hypertriglyceridemia
© 2015 Vindico Medical Education
Sacks FM, et al. Circulation. 2000;102:1886-1892.
CARE Trial
• ApoC-III in VLDL + LDL was a marker of
increased risk of recurrent coronary events
-11
-14
2
-20
-15
-10
-5
0
5
10
OMG3CA 2g OMG3CA 4g Olive Oil
Omega-3 Fatty Acids Containing EPA + DHA
Have Been Shown to Lower ApoC-III
LS
mean c
hange f
rom
baseline (
%)
*
***
P<.05* <.01** <.001***
EVOLVE (TG ≥500 mg/dL)
-8
-13
-3
-20
-15
-10
-5
0
5
10
OMG3CA 2g OMG3CA 4g Olive Oil
LS
mean c
hange f
rom
baseline (
%)
***
ESPRIT (TG 200-499 mg/dL)
-8
-10
-20
-15
-10
-5
0
5
10OMG3CA 2g OMG3EE 4g Corn oil
COMBOS
(TG 200-499 mg/dL)
***
Omega-3 Carboxylic AcidsOmega-3
Ethyl Esters
N=399 N=647 N=256
Omega-3 Carboxylic Acids
Kastelein JJ, et al. J Clin Lipidol. 2014;8:94-106.
Bradbury CJ, et al. Pharm Ther. 2013;38:681-691.
Koski RR. Pharm Ther. 2008;33:271-303.
OMG3CA: Omega-3 carboxylic acids
OMG3EE: Omega-3 ethyl esters
Reductions in ApoC-III Are
Associated with Omega-3 Products
-15
-10
-5
0
5
10
Baseline Day 45 Day 90
Ch
an
ge
(%
)
DHA 3 g/day Placebo
N= 17, 17
P<.01
DHA vs PBOEPA EE alone
Kelley DS, et al. Am J Clin Nutr. 2007;
86:324-333.
0
5
10
15
20
25
30
% reductionapoC-III vs.
placebo
% reductionapoC-III vs.
placebo
EPA EE 2g EPA EE 4 g
Post-hoc analyses, MARINE (n=148)
(TG ≥500 mg/dL) and ANCHOR
(n=612) (TG 200-499 mg/dL)
Unpublished data, Ballantyne, NLA
May 2014
Highlights from Lipid Forum 2015: Focus on Hypertriglyceridemia
© 2015 Vindico Medical Education
Summary: -3 FA
• Insufficient evidence regarding clinical implications of short-
and long-term bioavailability of different formulations of -3 FA
– TG vs EE vs FFA vs PL?
• EPA and DHA both have TG-lowering effects
• DHA may raise LDL-C due to enhanced lipolysis
– Increase in LDL particle size, increase in HDL-C
• EPA and omega-3 fatty acid products that contain DHA lower
apoC-III
Summary: -3 FAs
• OTC fish oil preparations are not regulated by the
FDA and may vary in consistency of concentrations
of EPA and DHA
• Krill oil preparations have lower concentrations of
-3 FAs and may require greater number of
capsules to achieve maximum/adequate TG-
lowering benefits