
Role of the human globus pallidus in tremorgenesis · Role of the human globus pallidus in...
105
Role of the human globus pallidus in tremorgenesis by Shane Ellis A thesis submitted in conformity with the requirements for the degree of Master’s of Science Department of Physiology University of Toronto© Copyright by Shane Ellis 2015
Transcript of Role of the human globus pallidus in tremorgenesis · Role of the human globus pallidus in...
Role of the human globus pallidus in tremorgenesis
by
Shane Ellis
A thesis submitted in conformity with the requirements for the degree of Master’s of Science
Department of Physiology University of Toronto© Copyright by Shane Ellis 2015

ii
Role of the human globus pallidus in tremorgenesis
Shane Ellis
Master of Science
Department of Physiology
University of Toronto
2015
Abstract
The GPi is a nucleus that serves as an output of the basal ganglia; a collection of nuclei which
function in selecting movements to be executed. Tremor is defined as an unintentional, rhythmic,
sinusoidal contraction of body parts. Currently, no scientific consensus has been reached as to
where in the brain tremor arises. Using microelectrode recordings in human patients with and
without tremor, we discovered a sub-population of cells that are capable of being induced into a
brief theta oscillation following microstimulation. However, we found that theta burst
stimulation was incapable of inducing visible tremor when microstimulating in the GPi, Vim, or
STN. We also found preliminary evidence that this theta oscillation is capable of producing an
LTP-like response within the GPi. We believe that this work adds strength to the “pallidocentric”
view of tremor initiation which holds that the GPi is responsible for the onset of tremor.

iii
Acknowledgments
First and foremost, I would like to thank my supervisor, Dr. Hutchison for his mentorship and
guidance through these last two years; I couldn’t have completed this thesis without your help.
Next, I would like to thank my parents and family for their continual support throughout the
highs and lows of this journey called life. Even if you don’t understand what I’m doing, you still
support me whole-heartedly and I couldn’t ask for anything more. To Diellor Basa (I hope I’ve
spelt your name correctly this week) and Luka Srejic, thank you for “showing me the ropes”
inside the lab. Lastly, I would like to thank Dr. Sherri Thiele and Dr. Aman Mann for keeping
me sane and for taking time out of their busy days to help me when I was struggling.

iv
Table of Contents
Acknowledgments ............................................................................................................................... iii
Table of Contents .................................................................................................................................. iv
List of Tables .......................................................................................................................................... vi
List of Figures ........................................................................................................................................vii
List of Appendices................................................................................................................................. ix
List of Abbreviations ............................................................................................................................ x
Chapter 1 Introduction ........................................................................................................................ 1
Introduction ............................................................................................................................................ 1
1.1 Basal Ganglia Function ............................................................................................................................ 1
1.1.1 The Human Globus Pallidus Internus ........................................................................................................ 1
1.2 Parkinson’s Disease .................................................................................................................................. 4
1.2.1.1 Genetics of Parkinson’s Disease ............................................................................................................... 5
1.2.1.2 Treatments of Parkinson’s Disease ......................................................................................................... 6
1.2.1.2.1 Pharmacological Treatments of PD ..................................................................................................... 6
1.2.1.2.2 Surgical Treatments ................................................................................................................................... 7
1.2.2 Explanatory Models of PD .............................................................................................................................. 8
1.2.2.1 The Rate Model ................................................................................................................................................ 8
1.2.2.2 The Center-Surround Model .................................................................................................................... 11
1.2.2.3 The Oscillatory Network Model .............................................................................................................. 15
1.2.3 Animal Models of Parkinson’s Disease .................................................................................................... 17
1.3 Dystonia ...................................................................................................................................................... 19
1.3.1 Etiology of Dystonia ........................................................................................................................................ 19
1.3.2 Genetics of Dystonia ........................................................................................................................................ 20
1.3.3 Treatment of Dystonia ................................................................................................................................... 20
1.4 Essential Tremor ..................................................................................................................................... 21
1.4.1 Etiology of Essential Tremor ....................................................................................................................... 21
1.4.2 Genetics, Diagnosis and Treatment of Essential Tremor ................................................................. 22
1.5.1 Tremor ..................................................................................................................................................... 23
v
1.6 Synaptic Plasticity ................................................................................................................................... 25
1.7 Project Rationale ..................................................................................................................................... 28
1.8 Hypothesis and Aims .............................................................................................................................. 30
Chapter 2- Methods ............................................................................................................................ 31
2.1 General Methods ...................................................................................................................................... 31
2.2 Intraoperative Microelectrode Recordings ................................................................................... 36
2.3 Tremor Entrainment with Theta Burst Stimulation ................................................................... 38
2.3 Effects of Theta Burst Stimulation on Plasticity in GPi .............................................................. 38
3.0 Chapter 3- Results ....................................................................................................................... 42
3.1 Stimulation-Induced Oscillation Characterization...................................................................... 42
3.2 Tremor Entrainment with Theta Burst Stimulation ................................................................... 52
3.2.1 Theta Burst Stimulation in the Globus Pallidus Internus ................................................................ 52
3.2.2 Tremor Entrainment with Theta Burst Stimulation Outside of The GPi ................................... 55
3.3 Effect of Theta Burst Stimulation on Plasticity within the GPi ................................................ 60
4.0 Chapter 4- Discussion ................................................................................................................ 63
4.1 Stimulation-Induced Oscillations ...................................................................................................... 64
4.2 Tremor Modification due to Theta Burst Stimulation in the Basal Ganglia ....................... 67
4.2.1 Theta Burst Stimulation in GPi ................................................................................................................... 67
4.2.2 Theta Burst Stimulation in Motor Thalamus ........................................................................................ 69
4.2.3 Theta Burst Stimulation in Sub Thalamic Nucleus ............................................................................. 70
4.3 Effect of Theta Burst Stimulation on Plasticity within the GPi ................................................ 70
4.4 Future Directions..................................................................................................................................... 73
4.5 Conclusions ................................................................................................................................................ 75
6.0 References ...................................................................................................................................... 76
Appendix ................................................................................................................................................ 85
................................................................................................................................................................... 91

vi
List of Tables
Table 1- Stereotactic coordinates of DBS targets ……………………………………………….44
vii
List of Figures
Figure 1- The connectivity of the nuclei comprising the basal ganglia…………………………15
Figure 2- Explanation of Parkinson’s disease by the rate model…………………………….….22
Figure 3- A representation of convergence and divergence in the center surround model……...24
Figure 4- A diagrammatic representation of the center-surround model of basal ganglia motor
command selection……………………………………………………………………………….26
Figure 5- An illustration demonstrating the dominance of oscillatory power of different
bandwidths as seen in Parkinson patients………………………………………………………..28
Figure 6- An example of a neuronal trace recorded from patient with dystonia………………..41
Figure 7- Sample trajectories taken to reach surgical target during mapping procedures for DBS
implantation surgeries……………………………………………………………………...…….46
Figure 8- The microelectrode setup used for microelectrode mapping prior to DBS
implantation……………………………………………………………………………………...47
Figure 9- Example traces showing the regularity of neuronal firings and the corresponding burst
index value……………………………………………………………………………………….49
Figure 10- Diagrammatic representations of stimulation protocols used to assess plastic changes
in the GPi………………………………………………………………………………………..53
Figure 11- Group analysis of baseline (pre-stimulation) firing rate and mode burst index
separated by disease and cell type………………………………………………………………………………..55
Figure 12- Effect of stimulation intensity on neuron populations separated by disease……….57
Figure 13- Individual changes in mode burst index across stimulation intensities…………….59
Figure 14- Mode burst index ratios and firing rate ratios of PD and dystonia neurons
differentiated by stimulation intensities………………………………………………………..61

viii
Figure 15- The effect of stimulation intensity on tremor FFT frequency bands……………………...63
Figure 16- The effect of TBS in the GPi on tremor and neuronal activity…………………………..66
Figure 17- The effect of TBS in the Vim on tremor and neuronal activity………………………….69
Figure 18- The effect of TBS in the STN on tremor and neuronal activity………………………….71
Figure 19- fEP amplitudes measured prior to and after TBS………………………………………...74

ix
List of Appendices
Appendix Figure 1- A sample of the read-out produced from the Matlab script MKaneoke from
the neuronal trace seen in Figure 6………………………………………………………………98
Appendix Figure 2A- The MKaneoke produced from the top trace in Figure 9 prior to
stimulation.…………………………………………………………………………………….100
Appendix Figure 2B- The MKaneoke produced from the lower trace in Figure 9 following
stimulation………………………………………………………………………………………102
Appendix Figure 3- An example of theta burst stimulation inducing visible tremor in a patients
foot during microelectrode mapping for DBS implantation surgery…………………………...104
x
List of Abbreviations
6-OHDA- 6-Hydroxydopamine
BOLD- Blood Oxygenation Level Dependent signal
COMT- Catechol-o-methyl Transferase
cTBS- Continuous Theta Burst
D1/D2- Dopamine Receptor Type 1 and 2
DBS- Deep Brain Stimulation
DYT- Dystonia-related gene
EEG- Electroencephalogram
EPSP- Excitatory Post-Synaptic Potential
EMG- Electromyogram
ET- Essential Tremor
ETM- essenetial tremor genes
FFT- Fast Fourier Transform
fEP- Field Evoked Potential
fMRI- Functional Magnetic Resonance
GABA- Gamma-Aminobutyric Acid
GI- Gastro-intestinal
GPe- Globus Pallidus Externus
GPi- Globus Pallidus Internus

xi
HFD- High Frequency Discharge
HFS- High Frequency Stimulation
IPSP- Inhibitory Post-Synaptic Potential
LIDs- Levodopa-Induced Dyskinesias
L-DOPA- L-3,4-dihydroxyphenylalanine
LINGO- Leucine Rich Repeat and Ig Domain Containing, NoGo recptor interacting protein
LRRK- Leucine-Rich Repeat Kinase
LTD- Long Term Depression
LTP- Long Term Potentiation
M1- Primary Motor Cortex
MAO- Monoamine Oxidase
MPP+- 1-methyl-4-phenylpyridinium
MPTP- 1-Methyl-4-phenyl-1,2,3,6-tetrahydropyridine
NMDA- N-Methyl-D-Aspartate
N.S.- Not Significant
PARK- Parkinson Related Gene
PAS- Paired Associative Stimulation
PD- Parkinson’s Disease
S1- Primary Somatosensory Cortex

xii
SLC1A2- Solute Carrier Family 1 Member 2
SNc- Substantia Nigra Pars Compacta
SNCA- Synuclien, Alpha
SNr- Substantia Nigra Pars Reticulata
STN- Subthalamic Nucleus
Thal- Thalamus
THAP- Trihydroxyacetophenone
TBS- Theta-burst Stimulation
TMS- Transcranial Magnetic Stimulation
Vim- Ventral Intermediate Nucleus of Thalamus
Vop- Ventral Oralis Posterior Nucleus of Thalamus

1
Chapter 1 Introduction
Introduction
1.1 Basal Ganglia Function
The basal ganglia are a collection of deep brain nuclei comprised of the caudate
and putamen (collectively known as the striatum), the external and internal segments of
the globus pallidus (GPe/GPi respectively) and substantia nigra pars reticulata (SNr), and
the subthalamic nucleus (STN). These nuclei are involved with various subsystems of the
brain including emotions, cognition, and motor control. The connectivity of the basal
ganglia is shown in Figure 1. With PD, the anatomical connectivity between nuclei
remains the same, but the gain of these connections is altered (see rate model below for
explanation and/or see figure 2). Focusing on movement commands, input to the basal
ganglia comes from the cortex and is received in the striatum and STN. The major
outputs of this circuit are the GPi and the SNr, with the GPi largely controlling movement
commands below the neck while the SNr deals with commands regarding the neck and
head (Mink 1996). Different theories (discussed below) have been put forward to explain
how information is processed within the basal ganglia, but in short, it appears that the
output nuclei (GPi and SNr) of the basal ganglia have been tasked with the final
determination of which motor programs are selected and which are inhibited.
1.1.1 The Human Globus Pallidus Internus
The GPi, along with the SNr are the major output nuclei of the basal ganglia. The
ventroposterior portion of the GPi has been shown to have neurons with kinesthetic
responses and has been identified as the sensorimotor portion of the GPi which is
anatomically separated from the limbic associative areas (Lozano and Hutchison, 2002).
As previously mentioned, the GPi is one of the major GABAergic outputs of the basal

2
ganglia, and has extensive connections to the ventral oralis posterior nucleus (Vop) of the
thalamus. It receives extensive inhibitory input from the striatum, as well as from the GPe
and some excitatory input from the STN. Also of particular interest, new evidence has
shown a direct connection between the internal pallidum and the cortex, dubbed the
“super-direct pathway”, which has been shown to be glutamatergic and targets the
peripallidal region of the pallidum (Milardi et al. 2015) (Figure 1). There are two
principle neuron types identified by electrophysiological recordings within the GPi: high
frequency discharge neurons (HFDs), and border cells. Neurons of the GPi are relatively
large and send GABAergic projections to the thalamus and brainstem (Mink 1996).
Although the majority of cells are GABAergic, the border cells are cholinergic and
populate the peri-pallidal region of the nucleus. The border cells recorded from
specifically in this thesis were recorded from the dorsal edge of the GPi (where the
medullary lamina separates the GPe and GPi), and the internal medullary lamina/GPi
borders (figure 7A). These cholinergic border cells are believed to be migrants of the
Nucleus Basalis of Meynert (Mitchell et al. 1987). During microelectrode mapping, the
GPi is identified by the presence of its high frequency discharge, irregular firing neurons,
encapsulated by the lower frequency, regular firing border cells (Hutchison, 1998).
Further, these neurons (both HFDs and border cells) are inhibited by brief electrical
stimulation, believed to be caused by the local release of GABA.

3
Figure 1- The connectivity of the nuclei comprising the basal ganglia. Nuclei
encapsulated by the yellow background are part of the indirect pathway, those on the
white background represent the direct pathway, while the red arrow represents the super-
direct pathway. Small black circles indicate inhibitory connections while green circles
indicate excitatory connections. Modified from Purves et al. Neuroscience. Sunderland:
Sinauer, 2008. Print.

4
1.2 Parkinson’s Disease
Parkinson’s disease is a debilitating degenerative disease which is characterized
by a triad of cardinal symptoms: bradykinesia, rigidity, and tremor. Its onset occurs later
in life (typically 65 years and older) and its primary cause is due to neuronal death in the
substantia nigra pars compacta- a midbrain, dopaminergic nucleus with extensive
connections to various systems in the brain, including the motor system via the basal
ganglia. The disease is named after Dr. James Parkinson who was the first to characterize
the disease back in 1817, although he initially deemed it “shaking palsy”. It has been
estimated that 1-2% of the general population over 65% contracts PD and that this
incidence increases to 3-5% in the population over 85 years of age (Alves et al, 2008).
PD diagnosis is ascertained post-mortem by the presence of Lewy body inclusions (Alves
et al, 2008) and neuronal death within the substantia nigra pars compacta. These Lewy
bodies are dense cytoplasmic inclusions of ubiquinated α-synuclein protein. Whether
these protein inclusions are cytotoxic or protective remains a debate (Visanji et al. 2013).
It is important to note that Lewy bodies are not specific to Parkinson’s disease and have
been found in other diseases such as Lewy body dementia and multiple systems atrophy
(Dehay et al. 2015), however, their contribution to these different pathologies has yet to
be confirmed.
Although most only think of the motor abnormalities seen in PD, this disease also
effects other areas and processes of the body. Such areas include the olfactory bulbs and
the gastrointestinal tracts, and other processes include cognition, and sleep. In fact,
movement abnormalities usually only arise when ~80% of the neurons of the substantia
nigra pars compacta (SNc) die (Pahuja et al. 2015) and it is believed that non-motor
abnormalities arise before the motor symptoms are seen. These symptoms include a loss
of smell (possibly due to Lewy body formation in olfactory bulbs) (Visanji et al. 2013),
and issues pertaining to the GI tract which can include constipation and delay in gastric
emptying (Fasano et al. 2015).
5
1.2.1.1 Genetics of Parkinson’s Disease
Although largely an idiopathic disease, approximately 10% of PD cases are
believed to be inherited (Thomas and Beal, 2007). Genes have been identified in these
cases which, when mutated, can be risk factors or causes of familial PD. It is important to
remember that phenotypes are the result of the interaction between the genotype and the
environment. Thus, having a genetic predisposition towards PD does not guarantee that
one will contract the disease, but is more apt to depend on the environmental stressors
present. There are 18 loci in the human genome that have been designated as PARK
regions due to their involvement with Parkinson’s disease; of which 12 have been
confirmed as Parkinson’s genes while the others may be risk factors or their effects
unsuccessfully replicated (Klein and Westenberger, 2012).
The first gene to be identified as having a role in PD was PARK1
(Polymerpoulous et al. 1996) (also known as SNCA and PARK4). The product of this
mutated gene is responsible for the α-synuclein aggregates that form the aforementioned
Lewy bodies and Lewy neurites. This mutation has a rapid progression, is implicated in
early onset PD and typically causes cognitive decline and dementia. It is also noteworthy
that it has a good initial response to levodopa treatment (Klein and Westenberger, 2012).
Another well-known mutation involved with PD is the LRRK2 (a.k.a. PARK8) gene.
This mutation causes mid-to-late onset PD without dementia and patients show a good
response to levodopa treatment. Patients with either PARK1 or PARK8 mutations have
Lewy body inclusions seen at post mortem. Parkin (PARK2) was the second Parkinson’s
gene identified. This mutation is typically associated with a slowly progressive, early
onset PD which tends to begin around 30-40 years of age, although some cases of
childhood onset have been documented (Klein and Westenberger, 2012). Many other
mutations have been noted in PD, but the last one that will be addressed in this work is
DJ-1. This mutation is of interest as it codes for protein involved in detecting oxidative
stress. Misfolding of this mutated protein renders it useless, and as such can make cells

6
more susceptible to environmental conditions (Klein and Westenberger, 2012). The DJ-1
mutation aids in showing the response between the genotype and environment.
1.2.1.2 Treatments of Parkinson’s Disease
Unfortunately, modern advances in medicine have still been unsuccessful in
developing treatment options to halt the progression of PD or reverse the damage already
done. As such, treatments of PD are currently symptomatic and developed to increase the
quality of life in PD patients (Calabresi et al. 2015).
1.2.1.2.1 Pharmacological Treatments of PD
The gold standard in treating PD is dopamine replacement therapy. This is usually
accomplished through the administration of the dopamine precursor, levodopa (L-DOPA)
that can cross the blood brain barrier and be metabolized into dopamine. An example of
such medication today is Sinemet®, a pill ingested by the patient which contains
levodopa as well as carbidopa. This combination of drugs allows the dopamine precursor
to reach the brain while preventing somatic degradation of dopamine that is designed to
keep the concentration of L-DOPA higher in the central nervous system than if L-DOPA
is delivered solely as a monotherapy (Gilbert et al. 2000). However, with chronic use of
these pharmacological replacement therapies, side effects often occur such as levodopa
induced dyskinesias (LIDs), which are abnormal involuntary movements of the limbs. As
such, investigators such as Pahuja et al. (2015) have begun looking at novel uses of
nanoparticles to deliver dopamine across the blood brain barrier and release this
dopamine in a more controlled manner in hopes of reducing side effects associated with
the treatment.

7
As previously mentioned, dopamine depletion is a hallmark of Parkinson’s
disease and hence why some pharmacological techniques seek to increase the level of
dopamine within the brain. Besides administering the metabolic precursor of dopamine to
patients, another way to keep dopamine levels elevated is to prevent their degradation.
The dopamine molecule belongs to a chemical family known as the monoamines
(includes serotonin, adrenaline, and nor adrenaline), which are degraded by a common
enzyme class known as the monoamine oxidases (MAOs). As such, a class of drugs
(monoamine oxidase B inhibitors; MAOBI) have been developed to block the function of
these enzymes (ie. rasagiline and selegiline) (Connolly and Lang 2014). Similarly,
catechol-o-methyl transferase inhibitors (COMTI) are a class of drug that prevent a
different degradation pathway from degrading dopamine and include such drugs as
entacapone and tolcapone. Yet, another strategy is to stimulate dopamine receptors with
dopamine agonists. These chemicals are able to bind to and activate the dopamine
receptor and hence simulate an environment that isn’t deprived of dopamine.
Apomorphine, pramipexole, and ropinirole are examples of this class of drugs.
1.2.1.2.2 Surgical Treatments
Even with a diverse range of drug classes, and an abundance of drugs available
within these classes, pharmacological treatment of PD has yet to be perfected. Due to the
chronic and degenerative nature of PD, patients must take these drugs for extended
periods of time. As such, many develop resistance that causes the drugs to become less
efficacious (decreases the “ON” time- the time where the drugs are maximally effective).
To combat these medically refractive cases, surgical procedures can be implemented.
Two such procedures include the implantation of deep brain stimulating (DBS)
electrodes, as well as strategically placed lesions within the brain. Undoubtedly, the most
common target for DBS electrode implantation is the STN. It is currently unknown how
this stimulation helps in PD; however, it may have an inhibitory effect within the
overactive STN which restores firing rates to a non-pathological level. Another site for
8
DBS in PD patients, albeit much less common, is the GPi. The GPi is typically reserved
as the target of choice for patients who suffer from cognitive decline or those with a
primary problem of disabling dyskinesias. Other surgical techniques other than DBS
implantation used to be pallidotomies and thalamotomies (thermo-electrolytic lesions of
the pallidum and thalamus, respectively) (Laitinen 1994). However, due to the advances
in DBS neuromodulation (such as rechargeable batteries and recording capabilities) and
the permanent nature of lesions, these techniques are much less common for the treatment
of PD nowadays.
1.2.2 Explanatory Models of PD
With the advancements in understanding the physiological processes associated
with movement and disease, such as PD, different models have been created over the
years that attempt to explain the abnormalities associated with PD. Currently, no one
model has been successful at explaining all of the symptoms and abnormalities associated
with the disease, but each model contributes its own information towards the
understanding of the pathophysiology of PD.
1.2.2.1 The Rate Model
One of the most well known models involves the balance between the so-called
“direct” and “indirect” pathways of the basal ganglia. In the direct pathway, the striatum
receives glutamatergic input from the cortex and dopaminergic input from the (SNc)
which then projects to the GPi before exiting the basal ganglia and projecting to the
ventral oralis posterior nucleus of the thalamus. In the indirect pathway, the striatum still
receives glutamatergic input from the cortex and dopaminergic input from the SNc, but
projects to the external segment of the globus pallidus as opposed to the internal segment.

9
From here, the GPe sends GABAergic projections to the STN which then synapses on the
GPi in an excitatory (glutamatergic) fashion prior to synapsing onto the Vop. Complexity
is added to this system when one considers the activity of each internuclear projection: all
projections are tonic in the presence of sufficient dopamine concentrations in the striatum
(see figure 1). As described by Albin et al (1989), neuronal death in the SNc results in
decreased dopaminergic innervation of the striatum. Within the striatum, there are two
types of dopamine receptors (D1 and D2), which have opposing effects: the D1 receptors
lie in the direct pathway and are activated when dopamine is bound. D2 receptors lie in
the indirect pathway and are inhibited by the binding of dopamine (Gerfen et. al 2003).
The end result of this dopaminergic deprivation is a decrease in activity of the direct
pathway (which promotes movements) and an increase in activity in the indirect pathway
(which inhibits movement). The leads to hyper-activity of the basal ganglia output (the
GPi), which causes increased inhibition of the motor thalamus. This model is capable of
explaining certain symptoms of PD such as akinesia, however, it fails to explain tremor.
This model can be extended to discuss hyperkinetic movements. The rate model
predicts that gain in the direct pathway is enhanced while it is decreased in the indirect
pathway in diseases (such as dystonia, hemiballism, Huntignton’s disease). This leads to
overactivity in the direct pathway (the pathway promoting movement) and underactivity
in the indirect pathway, resulting in an excess of movements, such as chorea, or muscles
contractions like those seen in dystonia.

10
Figure 2- Explanation of Parkinson’s disease as explained by the rate model.
Note the increased drive of the indirect pathway (as indicated with the extra thick arrows)
and the reduced drive in the direct pathway (indicated by the skinny arrows), including
the reduced dopaminergic input from the SNc caused by neuronal cell loss. The end
result is increased GABAergic innervation of the thalamus. STN indicates subthalamic
nucleus; GPe, globus pallidus externus; GPi, globus pallidus internus; SNr, substantia
nigra pars compacta; glu, glutamate; D2, type 2 dopamine receptor; D1, type 1 dopamine
receptor. Modified from Hutchison et al., (2004).
SNc Dopamine
D2
D1

11
1.2.2.2 The Center-Surround Model
Expanding on the model proposed by Albin et al. (1989), a new model was put
forth, incorporating the new physiology and trains of thought discovered at that time
(Mink 1996). Important to this model is that it doesn’t view the basal ganglia as the
source of movement generation, but rather the cortex generates the movement command
and passes it onto the basal ganglia for execution. This model discusses the competition
between motor programs that occurs during the execution of a movement. As seen in
figure 3, the motor cortex sends multiple overlapping representations of the motor
command to the striatum, and different parts of the striatum receive multiple inputs from
different parts of the cortex with non-functionally connected parts being sent to different
zones of the striatum. Through convergence/divergence within the striatum, a
concentrated signal is propagated to the GPi allowing for this motor command to be
executed, while sending a concentrated inhibitory signal to the GPi to inhibit other
possible motor plans that would compete with the desired movement (Mink 1996)
(Figure 3).

12
Figure 3- A representation of the convergence and divergence of different cortical areas
as hypothesized to occur between nuclei of the basal ganglia in the center-surround
model. Taken from Mink (1996).

13
Stated another way, when a motor command is generated by motor pattern
generators in the cortex, inhibitory drive in the basal ganglia is elevated for competing
motor pattern generators (thus inhibiting them), while inhibitiory activity of the
generators of interest are decreased (allowing the motor signal to be propagated). This
model predicts that the dopamine deficiency within the striatum results in increased drive
of the GPi and thereby excessively inhibits motor programs (desired movements and
competing ones) (Figure 4).

14
Figure 4- A diagrammatic representation of the centre-surround model of basal ganglia motor
command selection. Line weights indicate relative gain of connections; red lines indicate
inhibitory synapses, black indicates excitatory synapses. STN indicates subthalamic nucleus;
GPi, globus pallidus internus; SNr, substantia nigra pars reticulata. Reconstructed from Mink
(2003).
15
A second aspect of this model is needed to explain the rigidity and postural
disturbances seen with PD, however. As such, it has been further posited that the
competing motor pattern generators are not completely inhibited by the increased tonic
activity seen in the GPi, and this leads to partial activation of these programs that may be
responsible for the rigidity, bradykinesia, and postural instabilities (Mink 1996).
1.2.2.3 The Oscillatory Network Model
The above two models concentrate on single cell phenomenon within different
nuclei of the basal ganglia, but do not address how these cells interact in a network. An
important aspect to consider when determining how a cell’s output may change due to the
progression of PD is how the cell’s firing patterns may change, not just its firing rate. It
has been shown that, on top of firing rate changes, there is an increase in bursting activity
of these cells (Hutchison et al. 1997) and it has been demonstrated that there is an
increase in oscillatory connectivity within and between nuclei of the basal ganglia
(Volkmann et al. 1996, Brown et al. 2001). The increase in oscillatory activity occurs
across the theta, beta, and gamma bandwidths and the increase is believed to be due to the
dopaminergic denervation underlying PD (Brown 2003). Important to this model is that
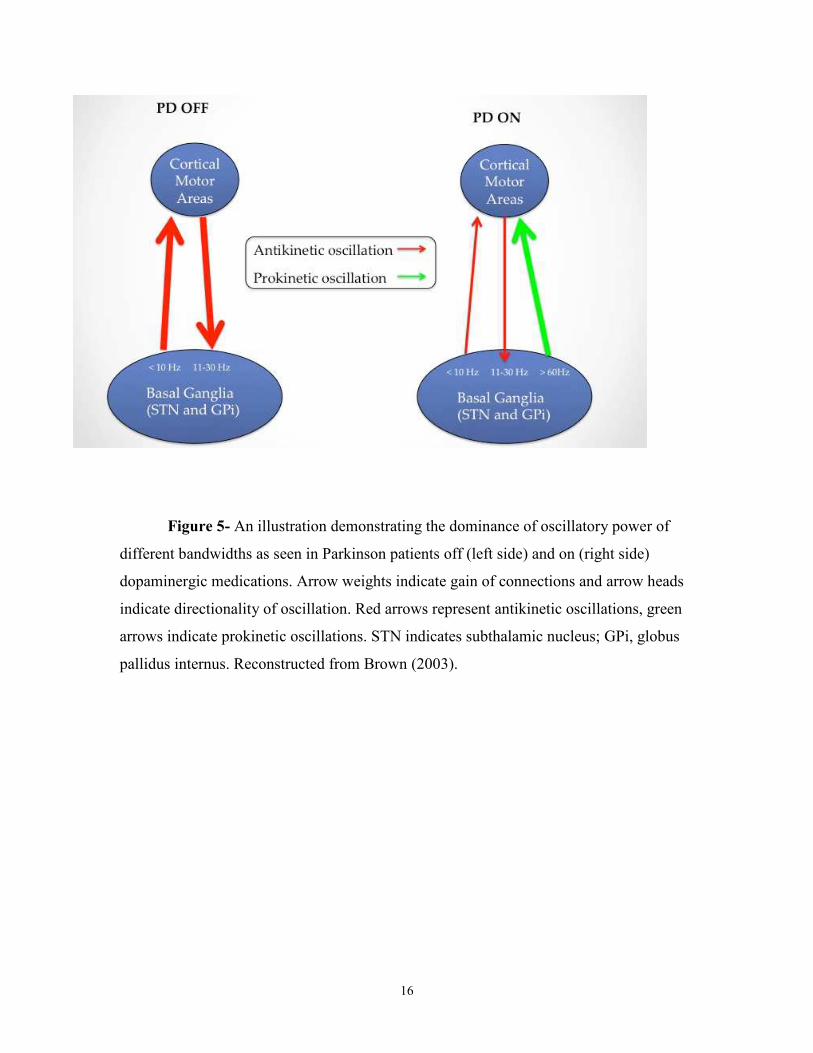
different frequencies of oscillations are believed to have different effects on movements.
In particular, oscillations below 30Hz are believed to be anitkinetic, while oscillations
above 35Hz are believed to be prokinetic (figure 5).
16
Figure 5- An illustration demonstrating the dominance of oscillatory power of
different bandwidths as seen in Parkinson patients off (left side) and on (right side)
dopaminergic medications. Arrow weights indicate gain of connections and arrow heads
indicate directionality of oscillation. Red arrows represent antikinetic oscillations, green
arrows indicate prokinetic oscillations. STN indicates subthalamic nucleus; GPi, globus
pallidus internus. Reconstructed from Brown (2003).

17
Whether these oscillations are purely pathological and what purpose they may
have in the disease course is still up for debate. For example, Little and Brown (2014)
posit that beta oscillations represent an idling rhythm in the motor circuit which promotes
the status quo and that the pathological beta power seen in PD blocks the new motor
commands leading to bradykinsia/akinesia. Beta oscillations have been reported in
healthy humans, however, the power of these oscillations has been positively correlated
with symptom severity indicating a role of the power of the oscillation in the disease
(Kuhn et al., 2006). However, the findings pertaining to beta oscillations are inconsistent.
Recent findings from this lab have found a negative correlation between beta power in
the STN and PD symptoms (Alavi et al., 2013), and reports have shown a decrease in
beta power within M1/S1 of PD patients during tapping movements as measured through
EEG recordings (Stegmoller et al., 2015). As such, the function of beta oscillatory power
has yet to be determined.
1.2.3 Animal Models of Parkinson’s Disease
As in many other diseases being studied, PD has an assortment of animal models
that have been studied to deepen our understanding of the pathology associated with the
disease. Possibly one of the most well known animals used in the study of PD is the 1-
Methyl-4-phenyl-1,2,3,6-tetrahydropiridine (MPTP) monkey. This blood-brain
permeable toxin appears to selectively target mitochondria of the substantia nigra pars
compacta where it leads to neuronal death due to the oxidative stress of its metabolite,
MPP+, as created by astrocytes (Sian et al. 1990). First discovered in synthetic drug
abusers who ingested a merperidine-related drug, this toxin produces many of the motor
abnormalities seen in PD (including the bradykinesia and rigidity) but fails to cause rest
tremor and Lewy bodies as seen in PD (Sian et al. 1990).

18
Another animal model of PD is the 6-OHDA rat model which was first used to
study PD in 1959. This toxin is effective in lesioning the nigrostriatal pathway in mice,
dogs, cats, and monkeys. The 6-OHDA molecule is structurally similar to the dopamine
molecule except 6-OHDA has an added hydroxyl group which is responsible for the
toxicity to dopaminergic neurons. As this toxin is incapable of crossing the blood brain
barrier, direct injection to the ventral tegmental area, striatum, or SNc are required to
cause a lesion (Blesa et al, 2012). Dopaminergic neurons die due to the effect of reactive
oxygen species and quinones produced by 6-OHDA (Cohen, 1984). Although this toxin
is incapable of mimicking all the pathophysiology of PD (such as olfactory deficits and
Lewy body formation), it is capable of producing dopamine depletion, nigral neuronal
death, and neurobehavioural deficits associated with PD. Another advantage of using this
model is each animal serves as it’s own control since the injection only unilaterally
effects the animal leaving an intact, healthy side for comparison sake (Blesa et al. 2012).
The above examples are considered to be excellent models, especially when
examining the effects of Parkinsonian syndromes on movements. However, they are not
particularly useful for studying neuroprotective effects of compounds designed to slow
the progression of PD. For this instance, the rotenone rodent model appears to be quite
useful. Rotenone is a naturally occurring pesticide/insecticide found in tropical plants. It
is commonly chronically injected into rats and appears to mimic many of the hallmarks of
PD, including Lewy body formation. It has been found to work by inhibiting the electron
transport chain in SNc mitochondria leading to neuronal death (Dauer and Przedborski,
2003). A downside to this model is that there is no apparent effect on humans, and as
such, this model may only be capable of explaining disease progression in rodents and
may have difficulties translating to humans.

19
1.3 Dystonia
Dystonia is a class of hyperkinetic movement disorders which includes, but is not
limited to, cervical dystonia (dystonia largely affecting the cervical spine), hand dystonia
(i.e. writers cramp- dystonia specific to the hand), blepharospasm (dystonia of the eyelids
and brow), and general dystonia (non-specific dystonia affecting the majority of the body.
Dystonia is characterized by involuntary activation of muscles leading to abnormal
postures and twisting movements. Important to this thesis, dystonia patients do not have a
dopamine deficiency and thus provide us with a pseudo-control group/comparator group
for our Parkinson’s studies.
1.3.1 Etiology of Dystonia
First identified by Oppenheim in 1911 as “dystonia musculorum deformans”,
dystonia affects people of all ages and can be primary in nature (occurrence is idiopathic
or due to genetics) or secondary (occurs because of previous lesions or disease of the
nervous system) (Albanese et al. 2013). The cause of dystonia is not currently known,
however, work by Prescott et al. (2013) indicates that GABA regulation within the output
nuclei of the basal ganglia (the GPi and SNr) may play a role. This study found that
paired-pulse ratios were decreased in dystonia patients compared to PD patients but could
be normalized with high frequency stimulation (HFS). These findings provide evidence
of abnormalities in synaptic transmission in the basal ganglia which may be underlying
the pathophysiology of dystonia. Other electrophysiological studies have shown a loss of
intracortical inhibition, and increased cortical plasticity indicating that the cortex may
also play a crucial role in this disease (Neuman et al., 2015).

20
1.3.2 Genetics of Dystonia
As mentioned previously, individuals can be genetically predisposed to dystonia.
Researchers have identified a set of genes believed to be involved in different types of
dystonia. For example, early onset torsion dystonia (DYT1) has been traced back to a
glutamic acid deletion in the gene encoding Torsin A. Products of this gene are believed
to be involved with mediating oxidative and endoplasmic reticular stress and so reports
have shown that mutations in this gene may cause flaws in the synaptic terminals which
may underlie the phenotypic expression of DYT1 (Kim et al. 2015). Another gene that
appears to play a role in different types of dystonia is THAP1. Mutations in this gene
have been shown to be related to DYT6, as well as DYT1 through its regulatory role of
Tor1A (Erogullari et al., 2014).
1.3.3 Treatment of Dystonia
Similar to PD, the medicines available to treat dystonias are currently aimed at
improving the patient’s quality of life rather than preventing further development of the
disease or reversing the current progression. One type of treatment available to those with
dystonia is a combination of physical therapy and braces which are designed to help
prevent contractions. Some braces are designed to provide a sensory trick to the patient (a
false sense of sensory input) that helps them avoid a contracted posture (Jankovich 2006).
Another non-pharmacological intervention involves transcranial magnetic stimulation
(TMS). Siebner et al (1999) have shown that transcranial magnetic stimulation at low
frequencies is capable of improving handwriting of patients with writers’ cramp. The
frontline medicinal treatment for dystonias currently is botulinum toxin injections into the
over active muscles (Bruijn et al., 2015). A small subset of patients with childhood onset
dystonia show some improvement in symptoms with dopaminergic drugs (Jankovich,
2006). Antidopaminergic drugs have been used historically, but are currently discouraged

21
due to possible side effects associated with these drugs (including sedation, tardive
dyskinesias, etc.). Other pharmacological strategies include anticholinergic medications,
and muscle relaxants (Jankovich, 2006). As a last resort for those patients who are not
responsive to the medication, surgical procedures can be performed to help ameliorate
symptoms. The most common surgery performed for those with dystonia is bilateral GPi
DBS (Lettieri et al 2014), however, pallidotomies, thalamotomies, and intrathecal
baclofen are also viable options (Marras et al., 2014).
1.4 Essential Tremor
1.4.1 Etiology of Essential Tremor
Essential tremor is a disease that manifests as an intention tremor largely affecting
the upper limbs of patients (Deuschl 1998). It occurs in approximately 0.9% of the
general population and 4.8% of the population over 65. The cerebellum is responsible for
action corrections during movement. This strengthens the theory that it is involved with
ET as tremor in ET really manifests when approaching the target of a goal-oriented
movement: the cerebellum pathologically overcorrects and this manifests as a tremor.
The involvement of the cerebellum is strengthened by the findings that DBS in the
cerebellar-receiving nucleus of the thalamus (the ventral intermediate nucleus of the
thalamus- Vim) has proven extremely successful in treating ET action tremors (Tasker
1998). Also, as discussed below, pharmaceuticals designed to treat ET, and ethanol, tends
to increase GABAergic tone in the cerebellum, further implicating its involvement in ET
(Louis 2015). Four genetic loci have been reported to be risk factors for ET: ETM1-4;
however no gene product has been identified as a causative agent (Schmouth et al. 2014).
22
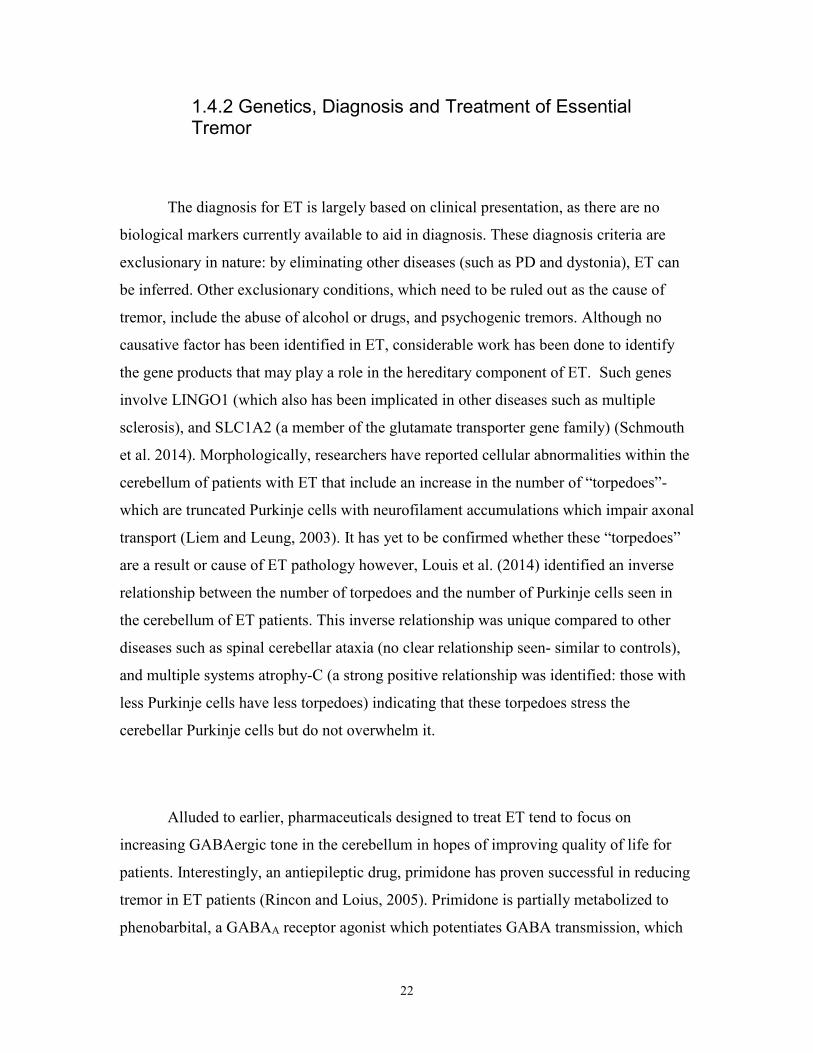
1.4.2 Genetics, Diagnosis and Treatment of Essential Tremor
The diagnosis for ET is largely based on clinical presentation, as there are no
biological markers currently available to aid in diagnosis. These diagnosis criteria are
exclusionary in nature: by eliminating other diseases (such as PD and dystonia), ET can
be inferred. Other exclusionary conditions, which need to be ruled out as the cause of
tremor, include the abuse of alcohol or drugs, and psychogenic tremors. Although no
causative factor has been identified in ET, considerable work has been done to identify
the gene products that may play a role in the hereditary component of ET. Such genes
involve LINGO1 (which also has been implicated in other diseases such as multiple
sclerosis), and SLC1A2 (a member of the glutamate transporter gene family) (Schmouth
et al. 2014). Morphologically, researchers have reported cellular abnormalities within the
cerebellum of patients with ET that include an increase in the number of “torpedoes”-
which are truncated Purkinje cells with neurofilament accumulations which impair axonal
transport (Liem and Leung, 2003). It has yet to be confirmed whether these “torpedoes”
are a result or cause of ET pathology however, Louis et al. (2014) identified an inverse
relationship between the number of torpedoes and the number of Purkinje cells seen in
the cerebellum of ET patients. This inverse relationship was unique compared to other
diseases such as spinal cerebellar ataxia (no clear relationship seen- similar to controls),
and multiple systems atrophy-C (a strong positive relationship was identified: those with
less Purkinje cells have less torpedoes) indicating that these torpedoes stress the
cerebellar Purkinje cells but do not overwhelm it.
Alluded to earlier, pharmaceuticals designed to treat ET tend to focus on
increasing GABAergic tone in the cerebellum in hopes of improving quality of life for
patients. Interestingly, an antiepileptic drug, primidone has proven successful in reducing
tremor in ET patients (Rincon and Loius, 2005). Primidone is partially metabolized to
phenobarbital, a GABAA receptor agonist which potentiates GABA transmission, which
23
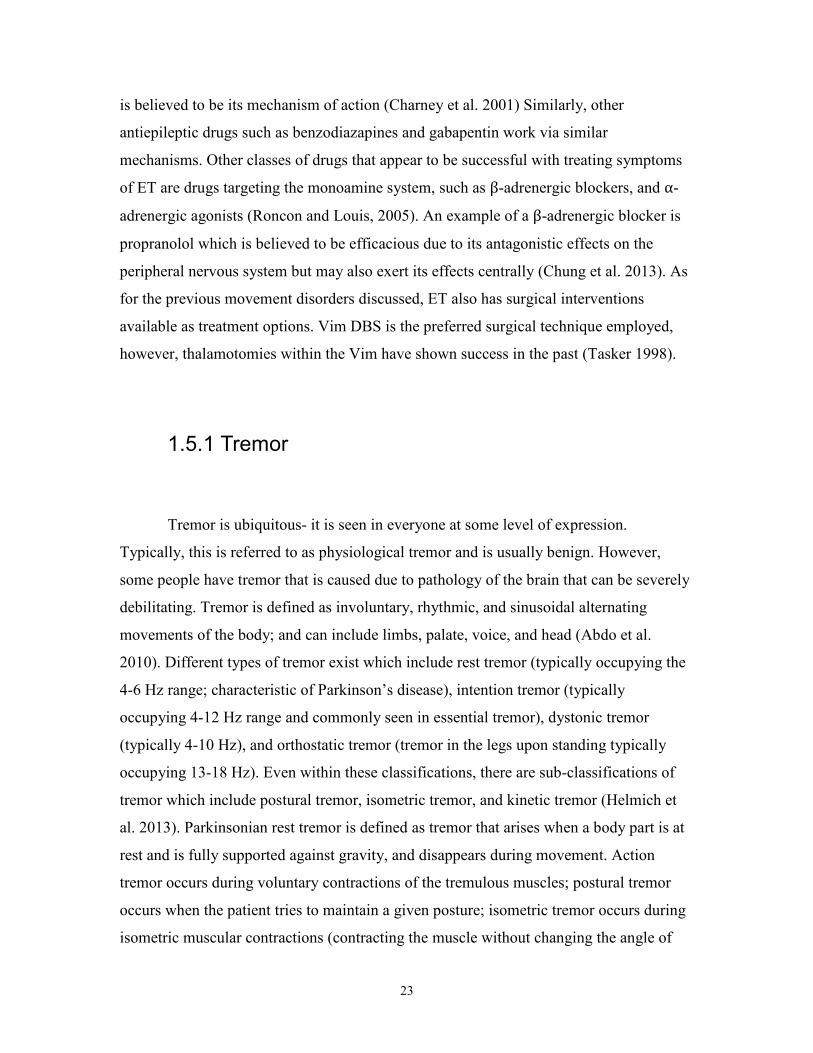
is believed to be its mechanism of action (Charney et al. 2001) Similarly, other
antiepileptic drugs such as benzodiazapines and gabapentin work via similar
mechanisms. Other classes of drugs that appear to be successful with treating symptoms
of ET are drugs targeting the monoamine system, such as β-adrenergic blockers, and α-
adrenergic agonists (Roncon and Louis, 2005). An example of a β-adrenergic blocker is
propranolol which is believed to be efficacious due to its antagonistic effects on the
peripheral nervous system but may also exert its effects centrally (Chung et al. 2013). As
for the previous movement disorders discussed, ET also has surgical interventions
available as treatment options. Vim DBS is the preferred surgical technique employed,
however, thalamotomies within the Vim have shown success in the past (Tasker 1998).
1.5.1 Tremor
Tremor is ubiquitous- it is seen in everyone at some level of expression.
Typically, this is referred to as physiological tremor and is usually benign. However,
some people have tremor that is caused due to pathology of the brain that can be severely
debilitating. Tremor is defined as involuntary, rhythmic, and sinusoidal alternating
movements of the body; and can include limbs, palate, voice, and head (Abdo et al.
2010). Different types of tremor exist which include rest tremor (typically occupying the
4-6 Hz range; characteristic of Parkinson’s disease), intention tremor (typically
occupying 4-12 Hz range and commonly seen in essential tremor), dystonic tremor
(typically 4-10 Hz), and orthostatic tremor (tremor in the legs upon standing typically
occupying 13-18 Hz). Even within these classifications, there are sub-classifications of
tremor which include postural tremor, isometric tremor, and kinetic tremor (Helmich et
al. 2013). Parkinsonian rest tremor is defined as tremor that arises when a body part is at
rest and is fully supported against gravity, and disappears during movement. Action
tremor occurs during voluntary contractions of the tremulous muscles; postural tremor
occurs when the patient tries to maintain a given posture; isometric tremor occurs during
isometric muscular contractions (contracting the muscle without changing the angle of

24
the joint), and intention tremor occurs during voluntary actions such as trying to touch
your finger to your nose (Deuschl et al. 1998). Patients with dystonic tremor tend to
appear in two cohorts. Some patients have dystonic tremor (tremor that is confined to a
dystonic limb), whereas others patients can have tremor associated with dystonia (the
tremor affects body parts unaffected by dystonia). Defazio et al., (2012) found through
clinical assessment and self-report measurements in a large Italian cohort that
approximately 17% of patients with primary adult onset dystonia present with tremor and
that this tremor was found in the head/face, neck, larynx, and upper and lower limbs.
Different brain regions appear to be affected depending on what type of tremor is
present. For instance, action tremor as commonly seen in ET patients is believed to be
due to pathology of the cerebellum. It is believed that the cerebellum is involved with
movement correction, and as such, ET may arise due to mishandling of efferent copies in
the cerebellum (Deuschl et al., 2000). Rest tremor as commonly associated with PD, is
believed to be triggered by pathology within the basal ganglia. Importantly, even though
different types of tremors may have different regions of the brain triggering the
phenotypic expression of tremor, it is possible that tremor is a network phenomenon and
not an entity created by one brain nucleus (Helmich et al., 2012).
As the main focus of this work is on PD tremor, the rest of this literature overview
shall focus solely on PD tremor. PD tremor affects three-quarters of PD patients, but the
cause of this tremor has yet to be determined. Some authors (i.e. Paré et al., 1995; Duval
et al., 2015) hold that tremor is initiated in the motor thalamus. They posit that, through
hysteresis, the thalamus (in monkeys) is capable of converting a 12-15 Hz oscillation
generated elsewhere in the brain into a 4-6 Hz oscillation which leads to the visible
expression of tremor. However, using microelectrode recordings prior to DBS electrode
placement, Hutchison et al., (1997) showed that the human GPi has neurons that fire at
tremor frequency in PD patients. This study did not find any 12-15 Hz oscillatory activity
in the GPi (speculated to be possibly due to species difference), but they found spectral
25
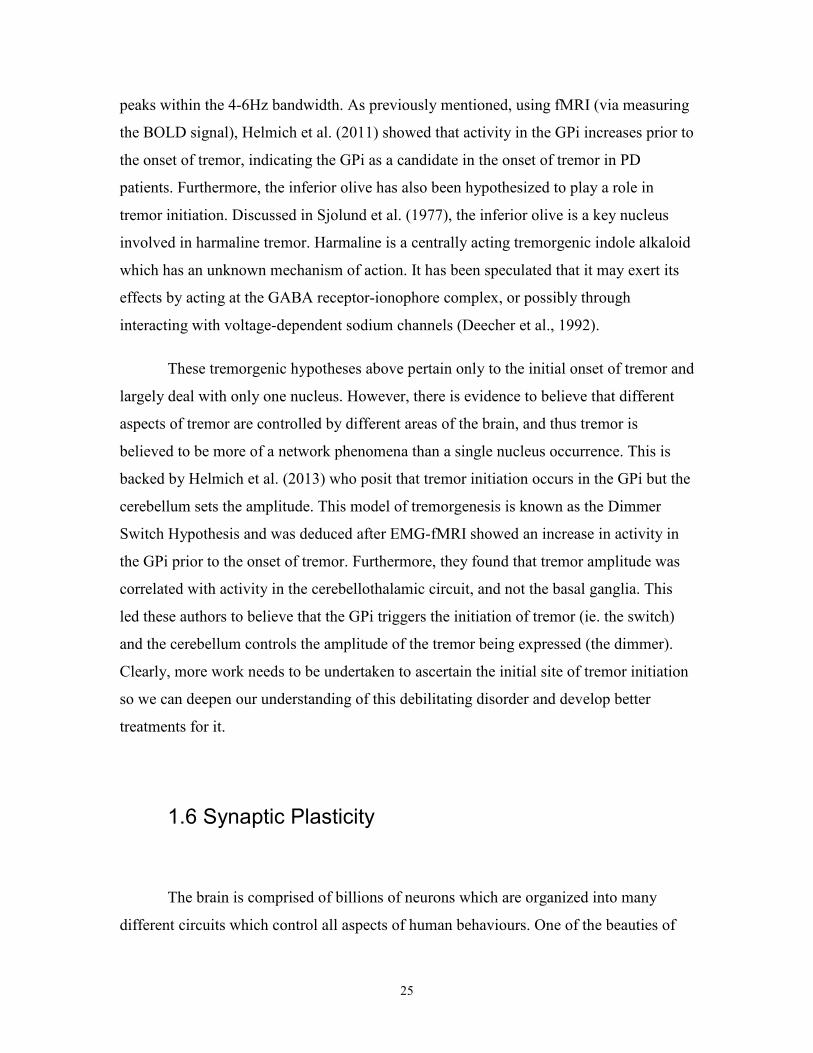
peaks within the 4-6Hz bandwidth. As previously mentioned, using fMRI (via measuring
the BOLD signal), Helmich et al. (2011) showed that activity in the GPi increases prior to
the onset of tremor, indicating the GPi as a candidate in the onset of tremor in PD
patients. Furthermore, the inferior olive has also been hypothesized to play a role in
tremor initiation. Discussed in Sjolund et al. (1977), the inferior olive is a key nucleus
involved in harmaline tremor. Harmaline is a centrally acting tremorgenic indole alkaloid
which has an unknown mechanism of action. It has been speculated that it may exert its
effects by acting at the GABA receptor-ionophore complex, or possibly through
interacting with voltage-dependent sodium channels (Deecher et al., 1992).
These tremorgenic hypotheses above pertain only to the initial onset of tremor and
largely deal with only one nucleus. However, there is evidence to believe that different
aspects of tremor are controlled by different areas of the brain, and thus tremor is
believed to be more of a network phenomena than a single nucleus occurrence. This is
backed by Helmich et al. (2013) who posit that tremor initiation occurs in the GPi but the
cerebellum sets the amplitude. This model of tremorgenesis is known as the Dimmer
Switch Hypothesis and was deduced after EMG-fMRI showed an increase in activity in
the GPi prior to the onset of tremor. Furthermore, they found that tremor amplitude was
correlated with activity in the cerebellothalamic circuit, and not the basal ganglia. This
led these authors to believe that the GPi triggers the initiation of tremor (ie. the switch)
and the cerebellum controls the amplitude of the tremor being expressed (the dimmer).
Clearly, more work needs to be undertaken to ascertain the initial site of tremor initiation
so we can deepen our understanding of this debilitating disorder and develop better
treatments for it.
1.6 Synaptic Plasticity
The brain is comprised of billions of neurons which are organized into many
different circuits which control all aspects of human behaviours. One of the beauties of
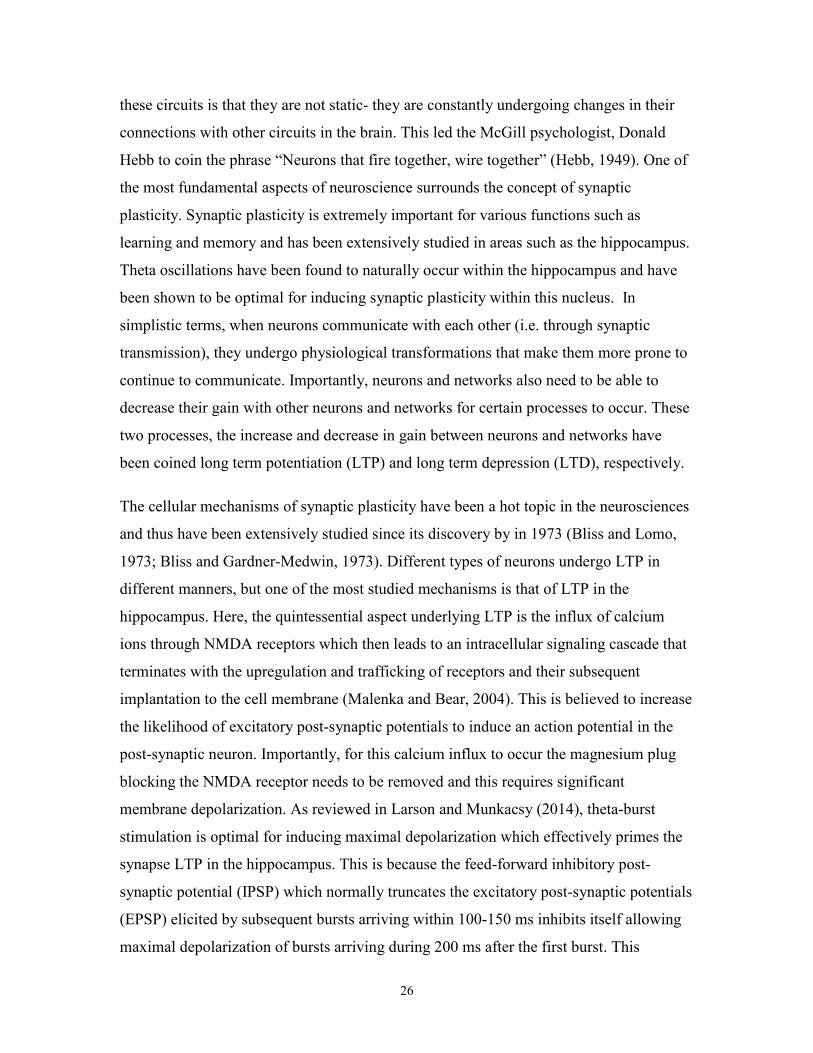
26
these circuits is that they are not static- they are constantly undergoing changes in their
connections with other circuits in the brain. This led the McGill psychologist, Donald
Hebb to coin the phrase “Neurons that fire together, wire together” (Hebb, 1949). One of
the most fundamental aspects of neuroscience surrounds the concept of synaptic
plasticity. Synaptic plasticity is extremely important for various functions such as
learning and memory and has been extensively studied in areas such as the hippocampus.
Theta oscillations have been found to naturally occur within the hippocampus and have
been shown to be optimal for inducing synaptic plasticity within this nucleus. In
simplistic terms, when neurons communicate with each other (i.e. through synaptic
transmission), they undergo physiological transformations that make them more prone to
continue to communicate. Importantly, neurons and networks also need to be able to
decrease their gain with other neurons and networks for certain processes to occur. These
two processes, the increase and decrease in gain between neurons and networks have
been coined long term potentiation (LTP) and long term depression (LTD), respectively.
The cellular mechanisms of synaptic plasticity have been a hot topic in the neurosciences
and thus have been extensively studied since its discovery by in 1973 (Bliss and Lomo,
1973; Bliss and Gardner-Medwin, 1973). Different types of neurons undergo LTP in
different manners, but one of the most studied mechanisms is that of LTP in the
hippocampus. Here, the quintessential aspect underlying LTP is the influx of calcium
ions through NMDA receptors which then leads to an intracellular signaling cascade that
terminates with the upregulation and trafficking of receptors and their subsequent
implantation to the cell membrane (Malenka and Bear, 2004). This is believed to increase
the likelihood of excitatory post-synaptic potentials to induce an action potential in the
post-synaptic neuron. Importantly, for this calcium influx to occur the magnesium plug
blocking the NMDA receptor needs to be removed and this requires significant
membrane depolarization. As reviewed in Larson and Munkacsy (2014), theta-burst
stimulation is optimal for inducing maximal depolarization which effectively primes the
synapse LTP in the hippocampus. This is because the feed-forward inhibitory post-
synaptic potential (IPSP) which normally truncates the excitatory post-synaptic potentials
(EPSP) elicited by subsequent bursts arriving within 100-150 ms inhibits itself allowing
maximal depolarization of bursts arriving during 200 ms after the first burst. This
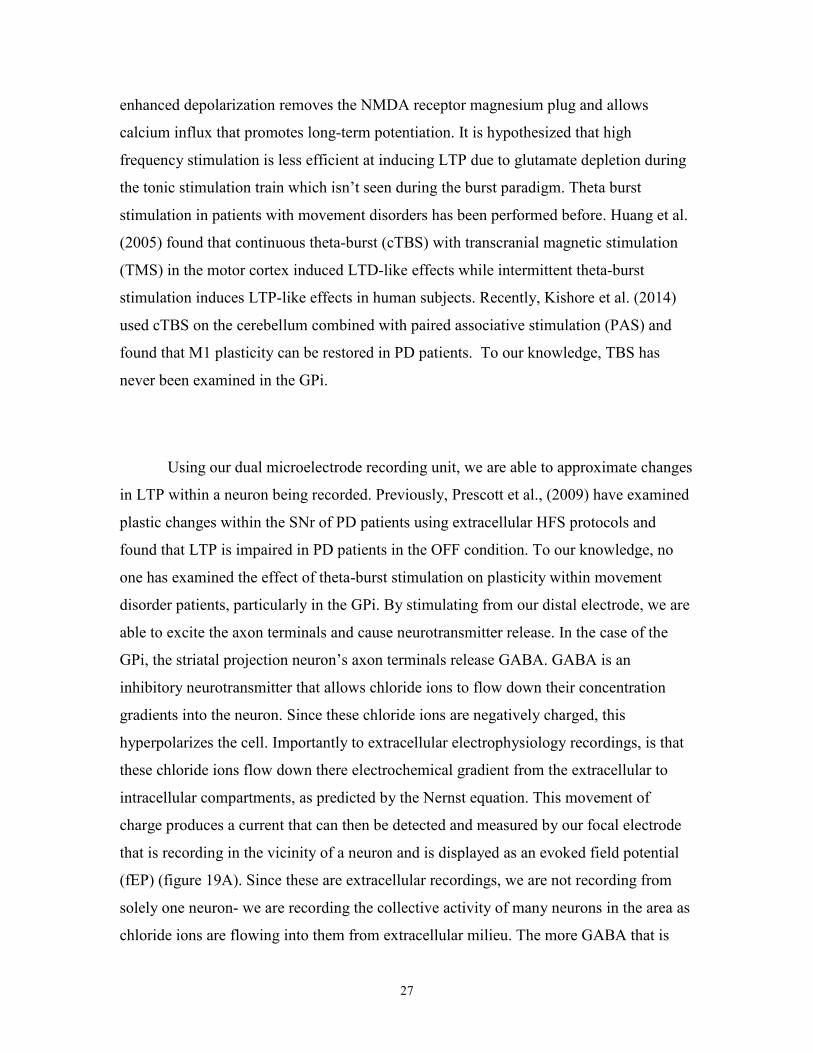
27
enhanced depolarization removes the NMDA receptor magnesium plug and allows
calcium influx that promotes long-term potentiation. It is hypothesized that high
frequency stimulation is less efficient at inducing LTP due to glutamate depletion during
the tonic stimulation train which isn’t seen during the burst paradigm. Theta burst
stimulation in patients with movement disorders has been performed before. Huang et al.
(2005) found that continuous theta-burst (cTBS) with transcranial magnetic stimulation
(TMS) in the motor cortex induced LTD-like effects while intermittent theta-burst
stimulation induces LTP-like effects in human subjects. Recently, Kishore et al. (2014)
used cTBS on the cerebellum combined with paired associative stimulation (PAS) and
found that M1 plasticity can be restored in PD patients. To our knowledge, TBS has
never been examined in the GPi.
Using our dual microelectrode recording unit, we are able to approximate changes
in LTP within a neuron being recorded. Previously, Prescott et al., (2009) have examined
plastic changes within the SNr of PD patients using extracellular HFS protocols and
found that LTP is impaired in PD patients in the OFF condition. To our knowledge, no
one has examined the effect of theta-burst stimulation on plasticity within movement
disorder patients, particularly in the GPi. By stimulating from our distal electrode, we are
able to excite the axon terminals and cause neurotransmitter release. In the case of the
GPi, the striatal projection neuron’s axon terminals release GABA. GABA is an
inhibitory neurotransmitter that allows chloride ions to flow down their concentration
gradients into the neuron. Since these chloride ions are negatively charged, this
hyperpolarizes the cell. Importantly to extracellular electrophysiology recordings, is that
these chloride ions flow down there electrochemical gradient from the extracellular to
intracellular compartments, as predicted by the Nernst equation. This movement of
charge produces a current that can then be detected and measured by our focal electrode
that is recording in the vicinity of a neuron and is displayed as an evoked field potential
(fEP) (figure 19A). Since these are extracellular recordings, we are not recording from
solely one neuron- we are recording the collective activity of many neurons in the area as
chloride ions are flowing into them from extracellular milieu. The more GABA that is

28
released, the more chloride flux there is, and hence the greater the evoked fEP. Since
plasticity deals with the connective strength of neurons, the greater the increase of the
fEP measured, the greater the change in synaptic strength.
1.7 Project Rationale
Models have been put forward to attempt to explain the cause of the
symptoms of PD but to date, no theory is capable of explaining all of the symptoms
collectively. For example, the Firing Rate model is capable of explaining
bradykinesia, and rigidity but suffers when explaining tremor. The Dimmer Switch
Model (Helmich 2012) has strengths when discussing tremor, but doesn’t deal with
bradykinesia and rigidity. This could be due to the fact that tremor still is not very
well understood. Where the site of tremorgenesis lies is currently a debate. Many
different areas of the brain have been examined for their role in tremorgenesis. A
“Thalamocentric” view, which holds that the thalamus is the site where tremor
initiates, has been put forward by Paré et al. (1992). This theory has been supported
by studies indicating that thermo-electric lesioning of the motor thalamus appears
to be the most effective surgical treatment for tremor (Duval et al. 2015). A
“Pallidocentric” view, which posits that tremor onset occurs in the pallidum, has
been put forth by Helmich et al. (2012). Although more related to essential tremor
than PD rest tremor, Deuschl et al. (2000) have collected evidence that the
cerebellum plays a role in tremorgenesis. Another candidate for the site of tremor
generation is the inferior olivary nucleus (Shaikh et al. 2010). These views are
currently hindered by the demonstration of true oscillators (neurons which can
establish the tremor rhythm as opposed to just following an oscillation established
elsewhere in the brain) within respective nuclei. There is obviously heterogeneity in
opinions as to where tremorgenesis occurs within the brain; however, there is no
reason to exclude the possibility that different types of tremor arise due to activity
in different parts of the brain.

29
This project builds on the finding of neurons within the GPi which were induced
into a tremor frequency oscillation following a brief microstimulation in patients lacking
tremor (figure 6). The fact that they lacked tremor is important because these patients
wouldn’t have had the sensory feedback from tremulous limbs which could provide input
to establish the tremor rhythm. The first aim of this project was to characterize the
distribution, incidence, background activity, and firing patterns of these oscillating
neurons. We then attempted to determine whether these neurons are responsible for
tremor initiation, and then examined the effect that these oscillating neurons may have on
the plasticity in the GPi.
Figure 6- An example of a neuronal trace recorded from patient with dystonia.
The top trace shows a baseline recording; bottom trace shows the response of the neuron
following stimulation. A clear inhibitory period is seen before the cell begins to fire
“normally” again, and then it fires in a very prominent 6 Hz oscillation. This spike train
oscillation lasted for approximately 8 seconds. This cell can be identified as a border cell
based on its regular firing pattern (pre-stimulation) and slower firing rate (26 Hz) than
seen in a typical HFD neuron.
30
1.8 Hypothesis and Aims
This thesis has three distinct, yet related sections. The first aim was discovery-
driven and was aimed at characterizing the oscillatory patterns of a newly discovered
theta (tremor) oscillation seen following focal microstimulation of a GPi border cell.
What was interesting about this oscillation was that it was initially found in a dystonic
patient who lacked tremor, and as such, did not have the sensory feedback present to set
the oscillatory rhythm. As such, it is believed that the neuron had intrinsic membrane
mechanisms or network connectivity allowing this oscillatory activity in the absence of
tremulous activity. This could implicate these cell types as the rhythm generators for rest
tremor. Consequently, these oscillations were characterized to determine if they were
significantly different from other firing patterns generated by the GPi.
The second aim of this thesis is aimed at determining if these oscillations serve a
tremorgenic role or not. It was hypothesized that if these oscillations recorded from the
GPi were tremorgenic, then stimulating the GPi (and downstream target- the motor
thalamus) with microelectrode stimulation mimicking the recorded oscillations (i.e. theta
burst stimulation) will show evidence of tremor modification (i.e. tremor resetting, phase
locking of tremor activity to bursting stimulation, tremor induction, etc.)
The third aim of this thesis is aimed at determining the effect of theta burst
stimulation on the plasticity within the GPi. It was hypothesized that theta burst
stimulation would be able to induce long-term potentiation within this nucleus.

31
Chapter 2- Methods
2.1 General Methods
Subjects studied in this work were all patients undergoing DBS implantation
surgeries for movement disorders. 23 subjects were studied in total across all
experiments. All gave informed, written consent according to the UHN Research Ethics
Review Board. PD patients were withheld from dopaminergic medications for twelve
hours prior to surgery. Surgical techniques have previously been described (Lozano et al
1998). In summary, the patient’s scalp was anaesthetized with the local anesthetic
lidocaine/marcaine to block the pain associated with the mounting of the frame to the
skull with screw-pins. One to two burr holes were drilled (depending on whether
unilateral or bilateral electrodes were implanted) 2mm anterior to the coronal suture.
Targets were stereotactically selected following 1.5T or 3T fused MRI (Table 1). See
figure 7 for example trajectories taken to reach the surgical target. All patients were
awake during microelectrode mapping procedures. Two independently driven
microelectrodes were advanced along a track directed at the surgical target. (see figure 8
for illustration of electrode setup).
32
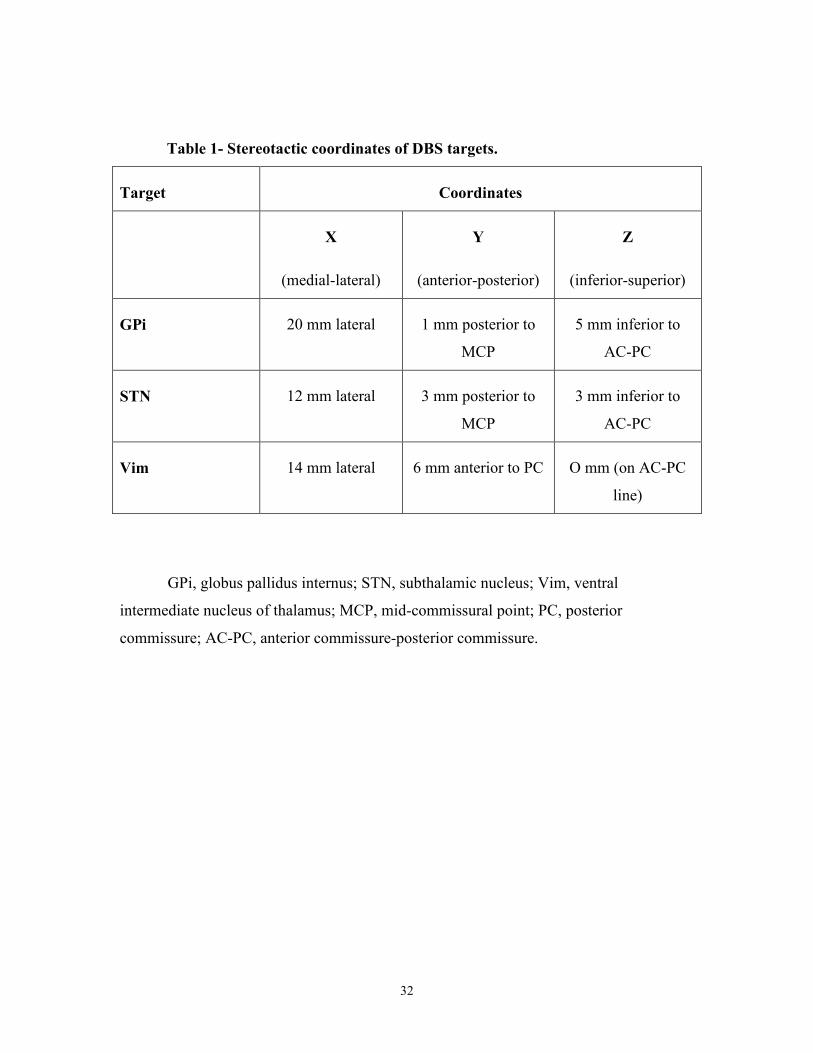
Table 1- Stereotactic coordinates of DBS targets.
Target Coordinates
X
(medial-lateral)
Y
(anterior-posterior)
Z
(inferior-superior)
GPi 20 mm lateral 1 mm posterior to
MCP
5 mm inferior to
AC-PC
STN 12 mm lateral 3 mm posterior to
MCP
3 mm inferior to
AC-PC
Vim 14 mm lateral 6 mm anterior to PC O mm (on AC-PC
line)
GPi, globus pallidus internus; STN, subthalamic nucleus; Vim, ventral
intermediate nucleus of thalamus; MCP, mid-commissural point; PC, posterior
commissure; AC-PC, anterior commissure-posterior commissure.

33
c
34
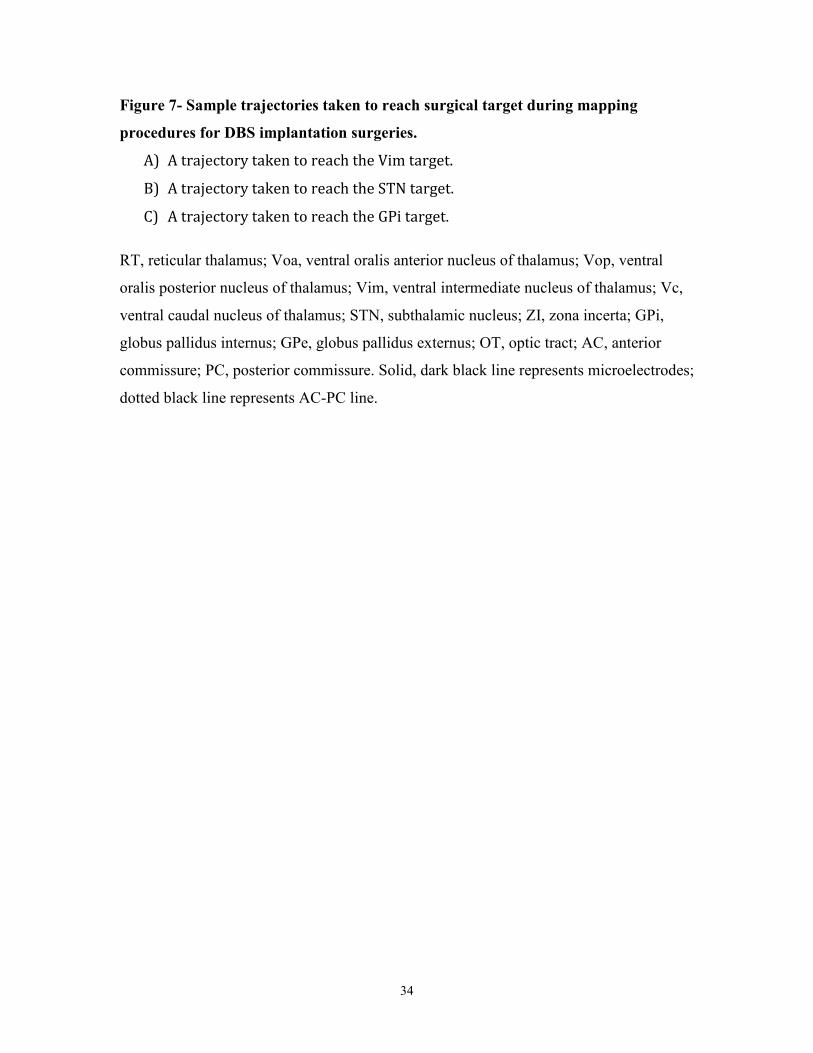
Figure 7- Sample trajectories taken to reach surgical target during mapping
procedures for DBS implantation surgeries.
A) A trajectory taken to reach the Vim target.
B) A trajectory taken to reach the STN target.
C) A trajectory taken to reach the GPi target.
RT, reticular thalamus; Voa, ventral oralis anterior nucleus of thalamus; Vop, ventral
oralis posterior nucleus of thalamus; Vim, ventral intermediate nucleus of thalamus; Vc,
ventral caudal nucleus of thalamus; STN, subthalamic nucleus; ZI, zona incerta; GPi,
globus pallidus internus; GPe, globus pallidus externus; OT, optic tract; AC, anterior
commissure; PC, posterior commissure. Solid, dark black line represents microelectrodes;
dotted black line represents AC-PC line.

35
Figure 8- The microelectrode setup used for microelectrode mapping prior to
DBS implantation.
Two independently driven microelectrodes with tips spaced 0.5 mm apart. The
terms “focal” and “distal” electrodes are relative terms describing the proximity of the
electrode of interest to the unit being recorded.
36
2.2 Intraoperative Microelectrode Recordings
Two independently driven microelectrodes (FHC; Bowdoin, ME) with
impedances ranging from 0.2-0.4 MΩ) were inserted into the brain guided by a Leksell
stereotactic frame (Leksell; Stockholm, Sweden). Electrode advancement proceeded
incrementally until isolated GPi units were identified. Electrode tips were aligned to be at
the same the depths. 10s baseline activity was recorded prior to passing electric current (3
µA, 5 µA, or 7.5µA intensity; 0.3ms biphasic pulse width; 200Hz frequency; 1 second
duration) through the stimulating (focal) electrode while cellular activity was
subsequently recorded through the focal electrode. [NOTE: distal and focal are relative
terms used to discuss the proximity of the electrodes to the unit being recorded. During
these recordings, the focal electrode (the electrode closest to the cell of interest), was the
stimulating and recording electrode.]10s of neuronal activity was collected following
stimulation. Data was recorded using Spike2 software (Cambridge Electronic Design,
UK) and stored for off-line analysis.
Using Spike2 software, trials were excised, band pass filtered (300-3000Hz) and
then template matched using principal component analysis (PCA). In short, the software
analyzes various aspects of the action potential (such as amplitude, waveform shape, and
width) and matches these spikes to other similar spikes allowing any possible spiking
activity from neighboring neurons or noise to be removed so that one cell can be studied.
Trials were segregated into pre- and post-stimulation segments, and then imported into
Matlab for analysis by the Mkaneoke script (Kaneoke and Vitek 1990) (see appendix
figure 1). Values for mode burst index (the mode value of the ratio of intraburst interval:
interburst interval- see figure 9), firing frequency, and tremor frequency signal-to-noise
ratios were collected and compared pre-stimulation against post-stimulation.
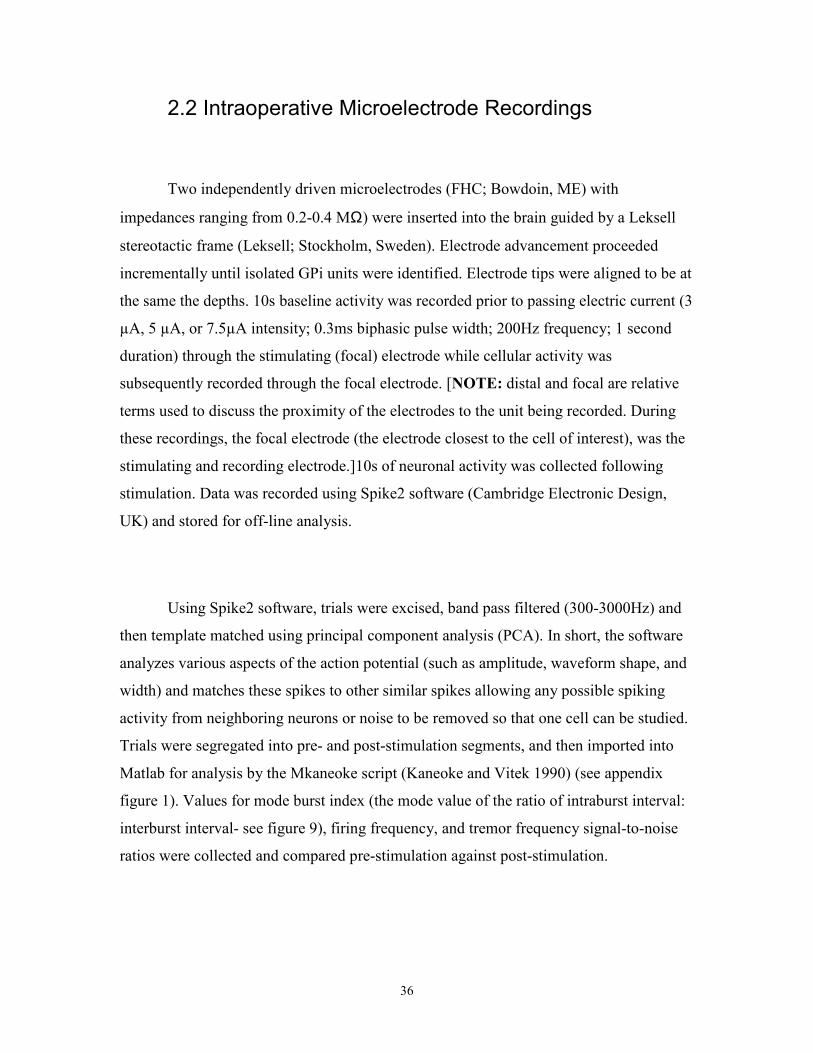
37
Figure 9- Example traces showing the regularity of neuronal firings and the
corresponding burst index value.
A) A regular firing neuronal trace with a mode burst index of 1.04 (See appendix
Figure 2 A & B).
B) A slightly more bursty cell with a mode burst index of 3.04.
Both traces are 3 seconds long.
38
2.3 Tremor Entrainment with Theta Burst Stimulation
Patient selection and surgical procedures were performed as outlined in 2.1.
Again, using two independently driven microelectrodes, single neuronal units were
identified and 10s of baseline activity was recorded from the focal electrode. The distal
electrode was connected to a stimulus isolation unit and electrical current (100µA, 4
pulses per burst, 10ms intraburst interval, 200ms interburst interval, 5-10s duration) was
passed into the nucleus. 10s of neuronal activity was recorded following stimulation.
Data was saved for offline analysis. Recordings were excised, and band pass filtered
(300-3000Hz) before being template matched in Spike2 software. Stimulation artifacts
were removed using the Spike2 Artrem script which replaced the stimulation artifacts
with a flat connecting line. Phase histograms were then constructed to look for phase
locking of the tremor peaks with the action potentials and/or theta burst stimulation. Each
phase began at the onset of theta burst stimulation and triggers were placed on the peaks
of the tremor amplitudes as recorded by the accelerometer. These tremor peaks were used
in the phase histogram to examine any realignment of tremor peaks with cellular activity.
2.3 Effects of Theta Burst Stimulation on Plasticity in GPi
Patient selection and surgical procedures were performed as outlined in 2.1.
Single stable units were isolated. Two baseline test pulses were delivered from the distal
electrode (stimulation parameters: 100µA, 10s, 1Hz, 10s rest between sets of test pulses.)
In a non-randomized fashion, theta burst stimulation preceded high frequency
stimulation, allowing the cell to recover before the HFS protocol. Using a stimulus
isolation unit, theta burst stimulation was delivered so that the total energy delivered was
matched in energy to high frequency stimulation (TBS stimulation parameters: 40s, 10ms
intraburst interval, 200ms intraburst interval, 100µA). Test pulses were repeated, except
30s were waited between test pulses instead of 10 (3 to 4 test pulses were
delivered)(Figure 6a). High frequency stimulation was applied for 5-10s (stimulation
parameters: 2s stimulation at 100Hz and 100µA with 8s rest; repeated 4 times) (see figure
39
6b). This was not a balanced study- both times, the HFS occurred after the neuron
recovered from TBS. Offline, field evoked potential amplitudes (fEP) were measured and
compared pre stimulation vs post stimulation.
Statistical Analysis
ANOVAs were performed with SPSS (v.22, IBM Corp, Armonk, New York
USA) and T-tests were carried out using GraphPad Prism (version 5 for Mac OS X,
GraphPad Software, San Diego California USA) statistical programs.
40

41
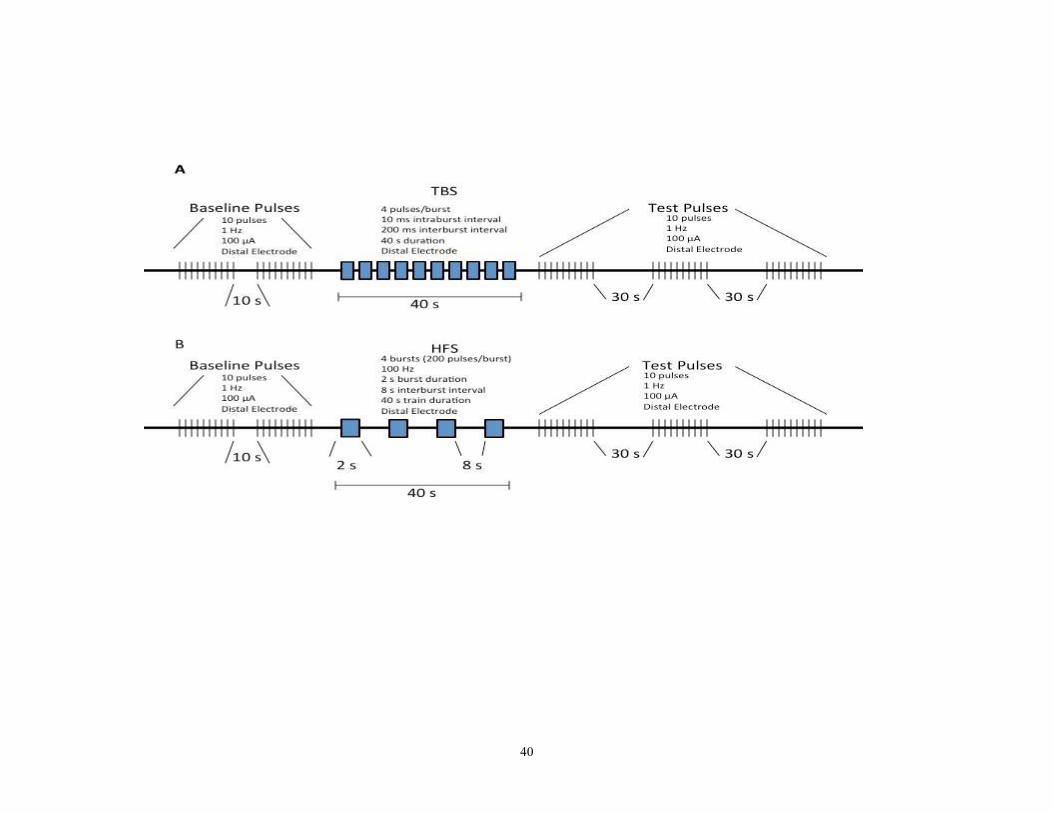
Figure 10- Diagrammatic representations of stimulation protocols used to assess plastic changes in the GPi.
Stimulation paradigms were matched for energy delivery to the tissue. Each was comprised of 800 pulses at 100µA intensity.
A) The theta burst stimulation used. TBS indicated theta burst stimulation.
B) The high frequency stimulation protocol employed. HFS indicates high frequency stimulation.

42
3.0 Chapter 3- Results
3.1 Stimulation-Induced Oscillation Characterization
95 neurons were sampled from 16 patients- 58 neurons from PD patients, and 37
neurons from the comparison group (dystonia/dystonia-related diseases). 2 neurons were
excluded from analysis as 1 cell was identified as a low frequency bursting cell of the
GPe (identification based on the recording depth in the track, firing rate, burst index, and
visual firing signature), and 1 neuron was lost following electrical stimulation. In
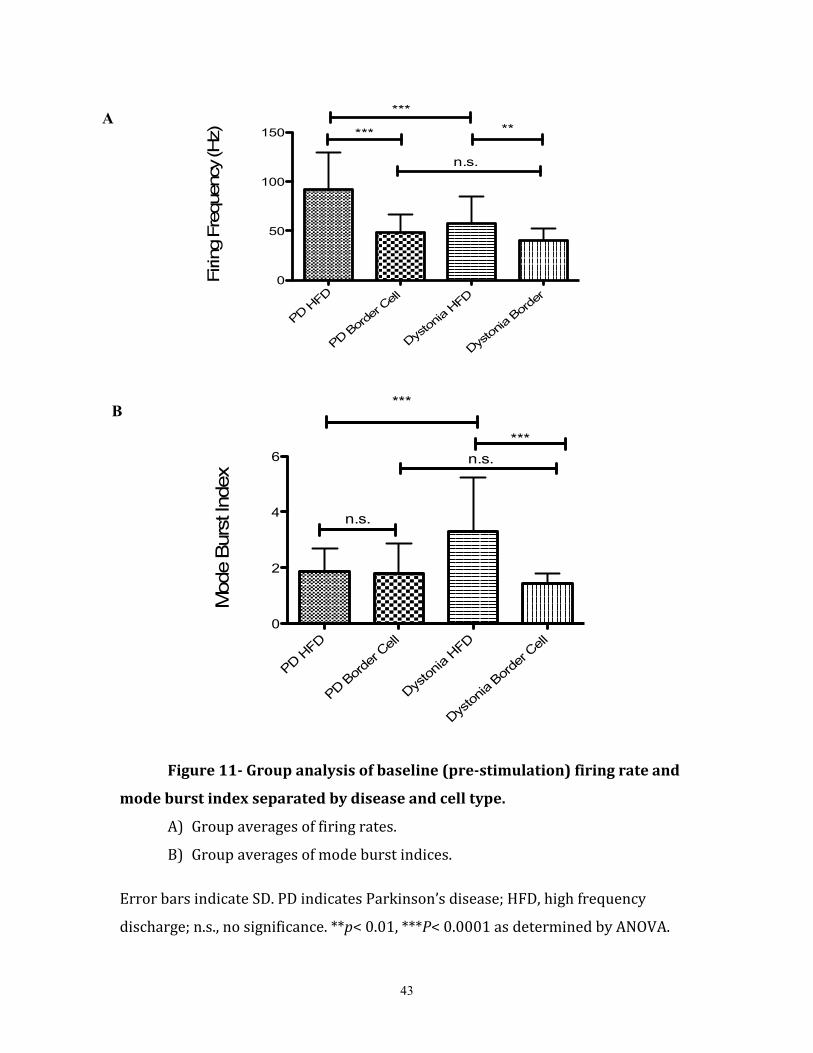
examining the pre-stimulation baseline firing (irrespective of stimulation intensity), it
was found that PD HFDs had a significantly higher mean firing rate (93.46 ± 38.01 Hz
(SD), N= 41 cells) than the PD border cells (47.93 ± 18.44 Hz, N=17 cells) (unpaired-
t83=5.39, p< 0.0001) and the dystonia HFDs (57.95 ± 27.17 Hz, N= 28 cells)
(unpaired-t98= 4.88, p<0.0001). Dystonia HFDs had a significantly higher mean
firing rate than the dystonia border cells (40.17 ± 11.90 Hz, N= 9 dystonia border
cells)(unpaired-t58=2.90 p<0.01), however, there was no significant difference
between the PD and dystonia border cell firing rates (unpaired-t43= 1.67, p=0.10)
(figure 11A). As shown in figure 11 B, the dystonia HFDs (average mode burst
index= 3.32 ± 0.31) were found to have a significantly higher pre-stimulation mode
burst index than the PD HFDs (average mode burst index= 1.85 ± 0.11) (unpaired-
t100=5.20, p<0.0001), and the dystonia border cells (average mode burst index= 1.43
±0.08) (unpaired-t60=4.49, p<0.0001). There was no significant difference found
between the average pre-stimulation mode burst index of PD and dystonia border
cells (unpaired-t45=1.55, p=0.13).
43
PD H
FD
PD B
orde
r Cell
Dys
toni
a HFD
Dys
tonia
Borde
r 0
50
100
150
***
*** **
n.s.
Firin
g F
requency (H
z)
PD H
FD
PD B
orde
r Cell
Dys
toni
a HFD
Dys
tonia
Bor
der C
ell
0
2
4
6
n.s.
***
***
n.s.
Mode B
urs
t In
dex
Figure 11- Group analysis of baseline (pre-stimulation) firing rate and
mode burst index separated by disease and cell type.
A) Group averages of firing rates.
B) Group averages of mode burst indices.
Error bars indicate SD. PD indicates Parkinson’s disease; HFD, high frequency
discharge; n.s., no significance. **p< 0.01, ***P< 0.0001 as determined by ANOVA.
A
B
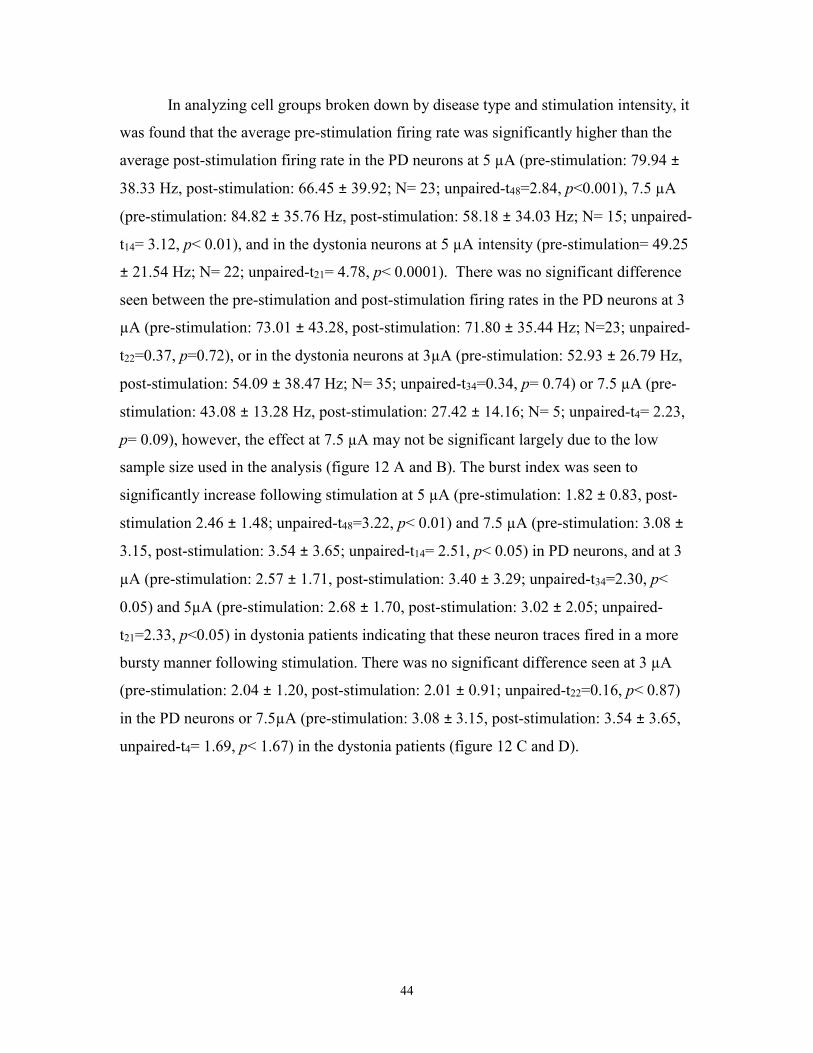
44
In analyzing cell groups broken down by disease type and stimulation intensity, it
was found that the average pre-stimulation firing rate was significantly higher than the
average post-stimulation firing rate in the PD neurons at 5 µA (pre-stimulation: 79.94 ±
38.33 Hz, post-stimulation: 66.45 ± 39.92; N= 23; unpaired-t48=2.84, p<0.001), 7.5 µA
(pre-stimulation: 84.82 ± 35.76 Hz, post-stimulation: 58.18 ± 34.03 Hz; N= 15; unpaired-
t14= 3.12, p< 0.01), and in the dystonia neurons at 5 µA intensity (pre-stimulation= 49.25
± 21.54 Hz; N= 22; unpaired-t21= 4.78, p< 0.0001). There was no significant difference
seen between the pre-stimulation and post-stimulation firing rates in the PD neurons at 3
µA (pre-stimulation: 73.01 ± 43.28, post-stimulation: 71.80 ± 35.44 Hz; N=23; unpaired-
t22=0.37, p=0.72), or in the dystonia neurons at 3µA (pre-stimulation: 52.93 ± 26.79 Hz,
post-stimulation: 54.09 ± 38.47 Hz; N= 35; unpaired-t34=0.34, p= 0.74) or 7.5 µA (pre-
stimulation: 43.08 ± 13.28 Hz, post-stimulation: 27.42 ± 14.16; N= 5; unpaired-t4= 2.23,
p= 0.09), however, the effect at 7.5 µA may not be significant largely due to the low
sample size used in the analysis (figure 12 A and B). The burst index was seen to
significantly increase following stimulation at 5 µA (pre-stimulation: 1.82 ± 0.83, post-
stimulation 2.46 ± 1.48; unpaired-t48=3.22, p< 0.01) and 7.5 µA (pre-stimulation: 3.08 ±
3.15, post-stimulation: 3.54 ± 3.65; unpaired-t14= 2.51, p< 0.05) in PD neurons, and at 3
µA (pre-stimulation: 2.57 ± 1.71, post-stimulation: 3.40 ± 3.29; unpaired-t34=2.30, p<
0.05) and 5µA (pre-stimulation: 2.68 ± 1.70, post-stimulation: 3.02 ± 2.05; unpaired-
t21=2.33, p<0.05) in dystonia patients indicating that these neuron traces fired in a more
bursty manner following stimulation. There was no significant difference seen at 3 µA
(pre-stimulation: 2.04 ± 1.20, post-stimulation: 2.01 ± 0.91; unpaired-t22=0.16, p< 0.87)
in the PD neurons or 7.5µA (pre-stimulation: 3.08 ± 3.15, post-stimulation: 3.54 ± 3.65,
unpaired-t4= 1.69, p< 1.67) in the dystonia patients (figure 12 C and D).

45
0
50
100
150 ** *
Firin
g F
req
uen
cy (
Hz)
3 5 7.50
2
4
6
8
** *
Stimulation Intensity (µA)
Mo
de
Burs
t In
dex
0
50
100
150
***
Firin
g F
reque
ncy (
Hz)
3 5 7.50
2
4
6
8 ** *
Stimulation Intensity (µA)
Mode
Burs
t In
dex
A B
C D
nn= 23
np= 5
nn= 36
np=7
nn= 5
np= 3
nn= 23
np=7
nn= 50
np= 8
nn= 15
np= 6
PD Dystonia
Figure 12- Effect of stimulation intensity on neuron populations separated by
disease.
A) and B) The effect of stimulation intensity on mean firing rate in PD and
dystonia neurons, respectively.
C) and D) The effect of stimulation intensity on mean mode burst index in PD and
dystonia neurons, respectively.
Black bars indicate pre-stimulation, grey bars indicate post-stimulation. Error bars
indicate SD. *P< 0.05; **p<0.005; p< 0.0001. nn indicates number of neurons included in
sample; np indicates number of patients analyzed.

46
1
10
Log M
ode
Burs
t In
de
x
n.s.
1
10
Log M
ode
Burs
t In
de
x
**
Pre Stim Post Stim
1
10*
Log M
ode B
urs
t In
dex
1
10
**
1
10
*
Pre Stim Post Stim
1
10
n.s.
Ai)
Aii)
Aiii)
Bi)
Bii)
Biii)

47
Figure 13- Individual changes in mode burst index across stimulation intensities.
A) PD neurons.
B) Dystonia neurons.
Each light gray line indicates the change in mode burst index of a single cell; dark black
lined indicate the significant average changes. i= 3 µA; ii= 5 µA; iii= 7.5 µA. *p< 0.05;
**p< 0.005; n.s., no significance.

48
These findings are further supported by figure 13 A i-iii which shows the
individual changes in mode burst index of each PD cell (light grey lines) with the
overlying group average superimposed (dark grey line), and figure 13 B i-iii which shows
the same results but for the dystonia cells.
A one-way ANOVA found that there was no significant difference in the mode
burst index ratio (post-stim/pre-stim) for either PD or dystonia neurons indicating that
cells do not get more bursty with higher stimulation intensities. However, with the PD
neurons, the trend shows an increase in burstiness at 5 µA compared to 3 µA, however
this plateaus at 7.5 µA, possibly indicating a ceiling for how bursty a cell can become.
This trend was not seen in the dystonia neurons (figure 14 A and B). Similarly, there was
no significant difference in the firing rate ratios (post-stimulation/pre-stimulation) of PD
or dystonia neurons as determined by a one-way ANOVA, however, the trend appears to
indicate that there is a greater suppression of firing rates following stimulation (figure 14
C and D), possibly due to a longer inhibitory period post-stimulation, however, this is just
speculation.
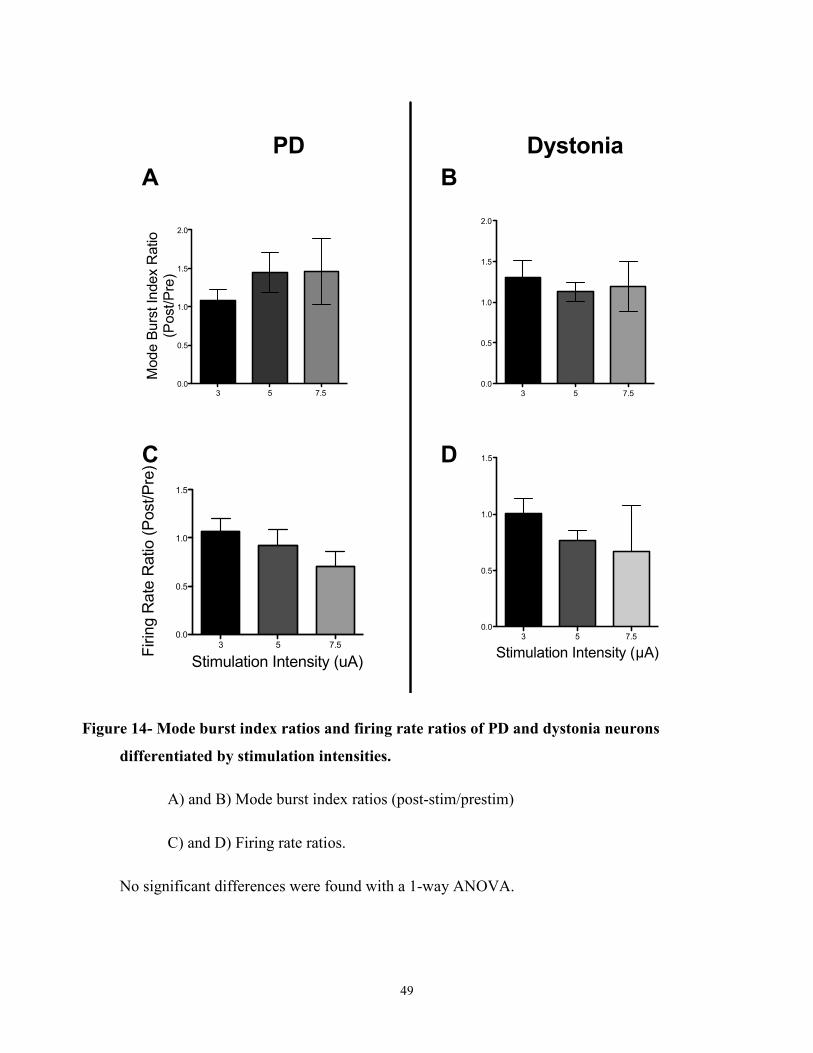
49
3 5 7.5 0.0
0.5
1.0
1.5
2.0
Mode B
urs
t In
dex R
atio
(Post/P
re)
3 5 7.5
0.0
0.5
1.0
1.5
Stimulation Intensity (uA)
Firin
g R
ate
Ratio (
Post/P
re)
3 5 7.5
0.0
0.5
1.0
1.5
2.0
3 5 7.5
0.0
0.5
1.0
1.5
Stimulation Intensity (µA)
PD Dystonia
A B
C D
Figure 14- Mode burst index ratios and firing rate ratios of PD and dystonia neurons
differentiated by stimulation intensities.
A) and B) Mode burst index ratios (post-stim/prestim)
C) and D) Firing rate ratios.
No significant differences were found with a 1-way ANOVA.

50
In analyzing tremor power (via fast-Fourier transforms- FFT) it was seen that
there was a significant decrease in the 3-6 Hz range in the dystonia HFD neurons at 5 µA
only (pre-stimulation mean signal-to-noise ratio: 1.86 ± 0.66 dB, post-stimulation mean
signal-to-noise ratio: 1.53 ± 0.72 dB; unpaired-t12= 3.3, p<0.01). There was no
significant difference seen in any other class of neuron (i.e. PD border cells or HFDs,
or dystonia border cells) at any stimulation intensity (figure 15).

51
0
1
2
3
4
3-6
Hz R
an
ge
Po
we
r (d
B)
3 5 7.50
1
2
3
4
Stimulation Intensity (µA)
3-6
Hz R
an
ge
Po
we
r (d
B)
0
1
2
3
4
3 5 7.50
1
2
3
4
**
Stimulation Intensity (µA)
A B
C D
nn= 23
np=7
nn= 50
np= 8
nn= 15
np= 6
nn= 23
np= 5
nn= 36
np=7
nn= 5
np= 3
PD Dystonia
Figure 15- The effect of stimulation intensity on tremor FFT frequency bands.
PD neurons are shown on the left side while dystonia neurons are on the right.
A) and B) are the border cell populations of each disease group.
C) and D) are the HFD cell populations of each disease group.
Dark black bars indicate pre-stimulation averages; lighter gray bars are post-stimulation
averages. Error bars indicate 95% confidence intervals. **p< 0.01.
nn indicates the number of neurons sampled; np indicates the number of patients sampled.

52
3.2 Tremor Entrainment with Theta Burst Stimulation
The novel finding of the stimulation-induced neurons described in the above
section are of interest as they may provide new insight into the site of tremor initiation.
However, just because these neurons fire at the tremor frequency in one of the output
nuclei of the basal ganglia, does not mean that they are necessarily involved with tremor.
To test this relationship, neurons in the GPi (the nucleus where these border burst
neurons are found), as well as upstream and downstream targets, were stimulated with a
stimulation paradigm that mimicked the oscillations recorded from border burst cells and
were qualitatively assessed for changes in tremor as well as cellular response to the
stimulation.
3.2.1 Theta Burst Stimulation in the Globus Pallidus Internus
In the GPi, 7 neurons from 4 different patients were stimulated with theta burst
stimulation (TBS). No evidence of tremor modifications as recorded via an accelerometer
were noted in any of these trials. The cellular responses were also analyzed during TBS
(figure 16). 2 neurons appeared to be driven by the stimulation (i.e. their firing rates
increased immediately following burst stimulation). Due to the removal of the artifacts
(and subsequent replacement with filler data), spiking activity during the stimulation
burst could not be analyzed. Of these two neurons that were initially driven by TBS, 1
neuron was only driven for 11 blocks of stimulation near the start of the stimulation train
before being inhibited for the latter blocks of stimulation. The other neuron did not
appear to have this same primacy effect due to the theta burst stimulation but appeared to
be driven throughout the entire stimulation paradigm. These two neurons were recorded
in separate patients. The remaining 5 neurons that were recorded were all at least partially
inhibited (i.e. showed a reduced firing rate compared to the baseline recording) by the
TBS throughout the duration of the stimulation.

53
A
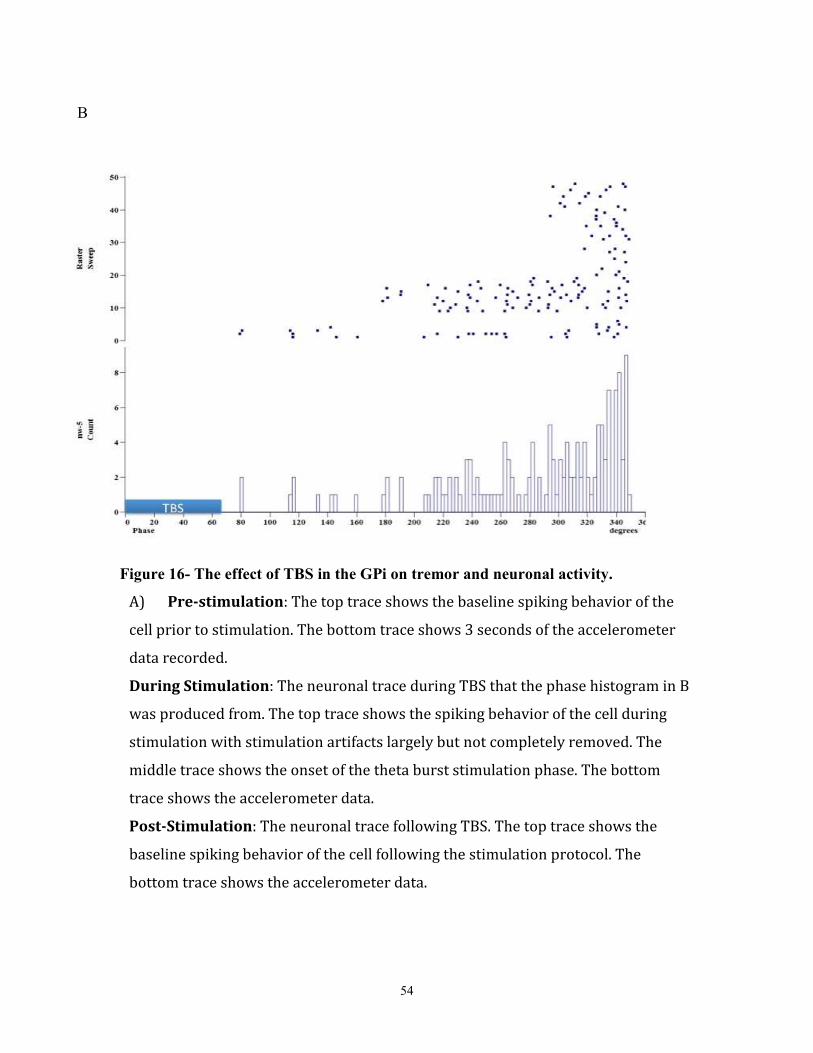
54
Figure 16- The effect of TBS in the GPi on tremor and neuronal activity.
A) Pre-stimulation: The top trace shows the baseline spiking behavior of the
cell prior to stimulation. The bottom trace shows 3 seconds of the accelerometer
data recorded.
During Stimulation: The neuronal trace during TBS that the phase histogram in B
was produced from. The top trace shows the spiking behavior of the cell during
stimulation with stimulation artifacts largely but not completely removed. The
middle trace shows the onset of the theta burst stimulation phase. The bottom
trace shows the accelerometer data.
Post-Stimulation: The neuronal trace following TBS. The top trace shows the
baseline spiking behavior of the cell following the stimulation protocol. The
bottom trace shows the accelerometer data.
B

55
The top plot is a raster plot of the neuronal firing behavior (indicated by the solid dots)
throughout the TBS train. A phase is defined as the start of TBS to the start of the next
stimulation burst. TBS indicates when theta burst stimulation was applied
3.2.2 Tremor Entrainment with Theta Burst Stimulation Outside of The GPi
As can be seen in figure 1, the connectivity of the basal ganglia is quite complex.
Electrical stimulation of the brain as in GPi DBS can have antidromic as well as
orthodromic effects (Liu et al., 2012) Therefore, we also examined the effect of TBS on
nuclei both upstream (the STN), and downstream (the motor thalamus) of the GPi.
Within the motor thalamus, we stimulated and recorded from 17 neurons across 6
patients. Of these 17 neurons, 9 were initially driven for the first few bursts of theta burst
stimulation before being inhibited later in the train, and of these 9, 2 cells showed
prolonged inhibition even after the stimulation ceased (both neurons from the same
patient). Also of importance is that in 3 of these 9 cells (from 2 different patients)
evidence of tremor reduction (figure 17) was seen during stimulation (no cell that showed
tremor reduction was inhibited after the stimulation was turned off). Also within the
motor thalamus, 2 cells (from 2 patients) were driven, 4 (from 3 patients) were inhibited,
and 2 cells (from 2 different patients) appeared to not have any effect for the duration of
the burst stimulation. Stimulating upstream of the GPi (the STN), 6 neurons were
recorded from 2 different patients. None of these neurons showed tremor reduction in the
accelerometer recording during stimulation (figure 18). 1 neuron was initially driven
before being inhibited towards the end of the stimulation train, 3 neurons were driven
throughout the stimulation train, and 2 appeared to be inhibited throughout the duration
of the stimulation.
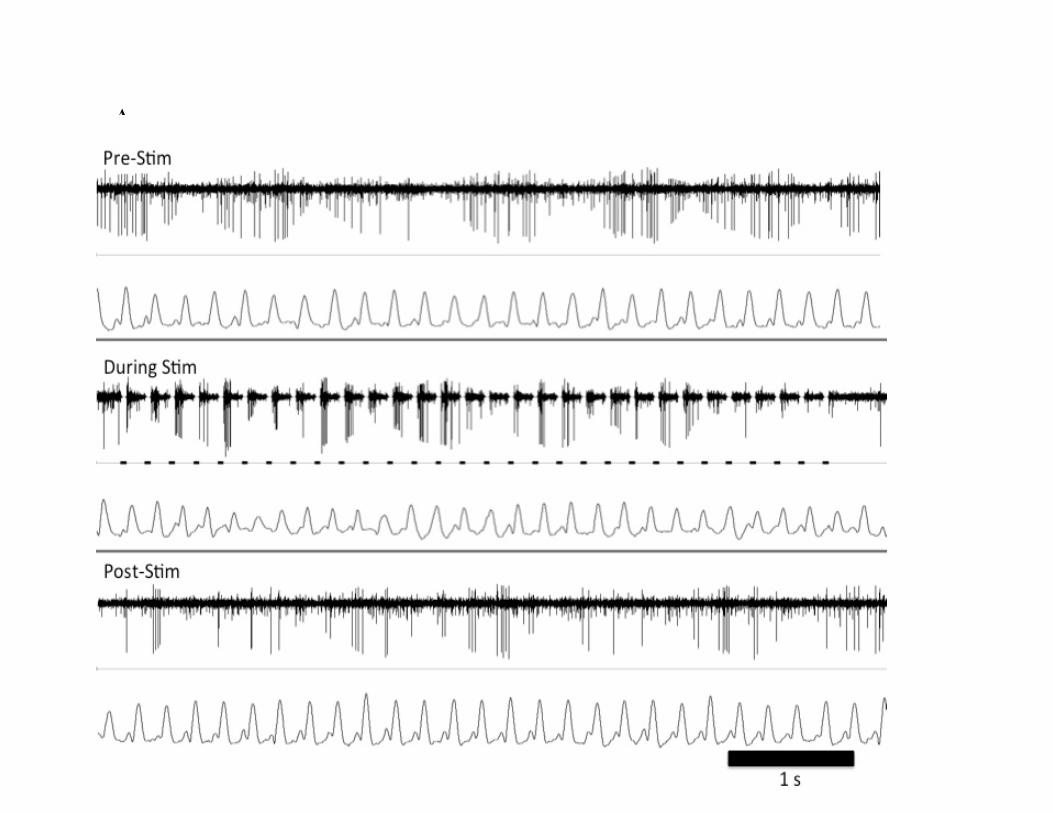
56
A
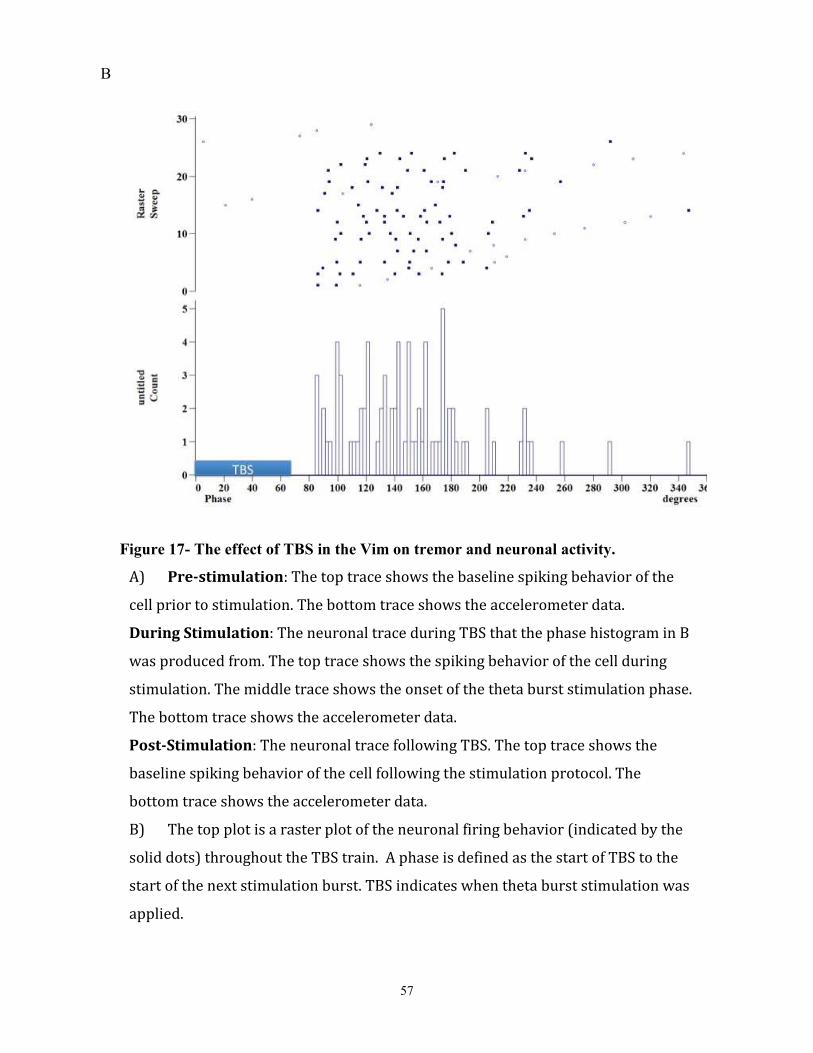
57
Figure 17- The effect of TBS in the Vim on tremor and neuronal activity.
A) Pre-stimulation: The top trace shows the baseline spiking behavior of the
cell prior to stimulation. The bottom trace shows the accelerometer data.
During Stimulation: The neuronal trace during TBS that the phase histogram in B
was produced from. The top trace shows the spiking behavior of the cell during
stimulation. The middle trace shows the onset of the theta burst stimulation phase.
The bottom trace shows the accelerometer data.
Post-Stimulation: The neuronal trace following TBS. The top trace shows the
baseline spiking behavior of the cell following the stimulation protocol. The
bottom trace shows the accelerometer data.
B) The top plot is a raster plot of the neuronal firing behavior (indicated by the
solid dots) throughout the TBS train. A phase is defined as the start of TBS to the
start of the next stimulation burst. TBS indicates when theta burst stimulation was
applied.
B

58
A

59
Figure 18- The effect of TBS in the STN on tremor and neuronal activity.
A) Pre-stimulation: The top trace shows the baseline spiking behavior of the
cell prior to stimulation. The bottom trace shows the accelerometer data.
During Stimulation: The neuronal trace during TBS that the phase histogram in B
was produced from. The top trace shows the spiking behavior of the cell during
stimulation. The middle trace shows the onset of the theta burst stimulation phase.
The bottom trace shows the accelerometer data.
Post-Stimulation: The neuronal trace following TBS. The top trace shows the
baseline spiking behavior of the cell following the stimulation protocol. The
bottom trace shows the accelerometer data.
B) The top plot is a raster plot of the neuronal firing behavior (indicated by the
solid dots) throughout the TBS train. A phase is defined as the start of TBS to the
start of the next stimulation burst. TBS indicates when theta burst stimulation was
applied.
B

60
3.3 Effect of Theta Burst Stimulation on Plasticity within the GPi
Seeing as the tremor frequency lies within the theta bandwidth, we examined the
effect of theta burst stimulation on synaptic plasticity within the GPi of PD and dystonia
patients. We stimulated 6 cells from three patients with theta burst stimulation- 2 neurons
were from patients with PD while 4 neurons were from a patient with dystonia. fEP
amplitudes were measured for up to 90s post stimulation to examine the effect of theta
burst stimulation on plasticity (figure 19 A and B). Data was unavailable for one PD cell
at 60 s and 90 s post stimulation due to recording noise. The other cell showed an initial
65% increase in fEP amplitude compared to baseline at the 30 s time point, and an fEP
peak at 170% of the baseline which was recorded at the 60s post stimulation time point
providing an inverted u-shaped curve. Even at 90s post stimulation, the fEP was still
150% of the baseline. In analyzing the data recorded across the 4 cells from the 1 patient
with dystonia, the peak fEP amplitude across all trials was only 125% of the baseline
measure and occurred at the 90 s stimulation time point (figure 19 C).
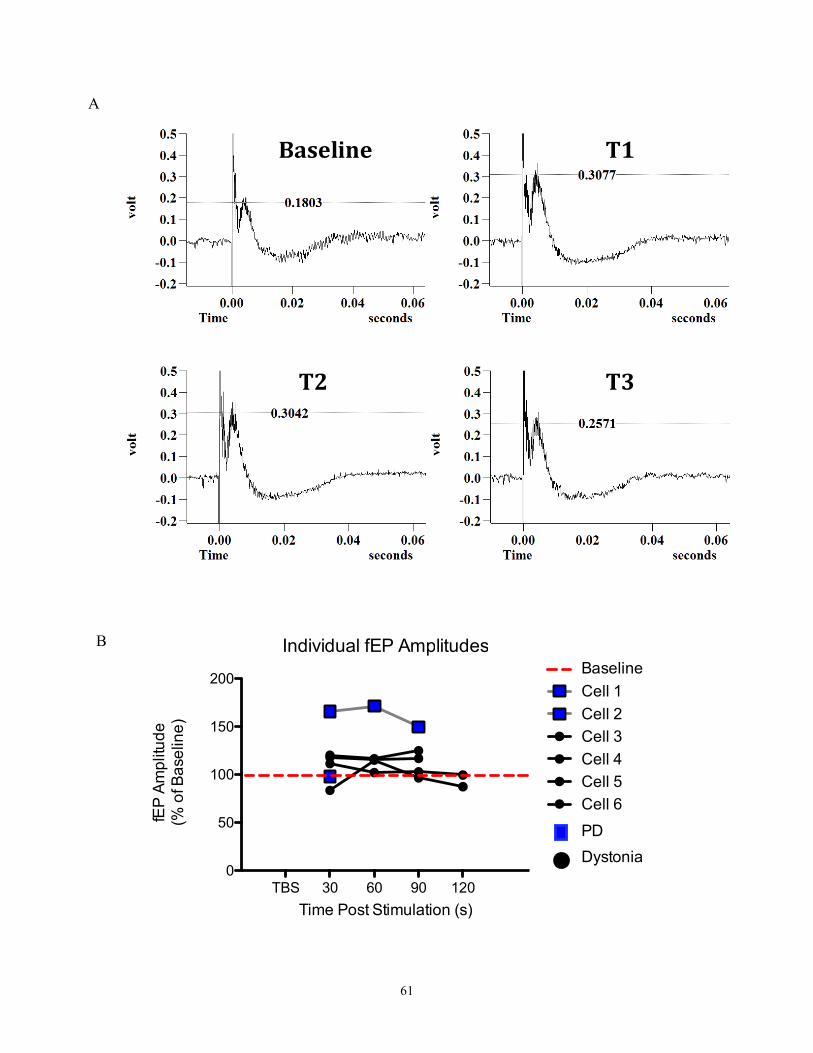
61
Individual fEP Amplitudes
TBS 30 60 90 1200
50
100
150
200Cell 1
Cell 2
Cell 3
Cell 4
Cell 5
Cell 6
PD
Dystonia
Baseline
Time Post Stimulation (s)
fEP
Am
plit
ud
e
(% o
f B
ase
line
)
Baseline T1
T2 T3
A
B
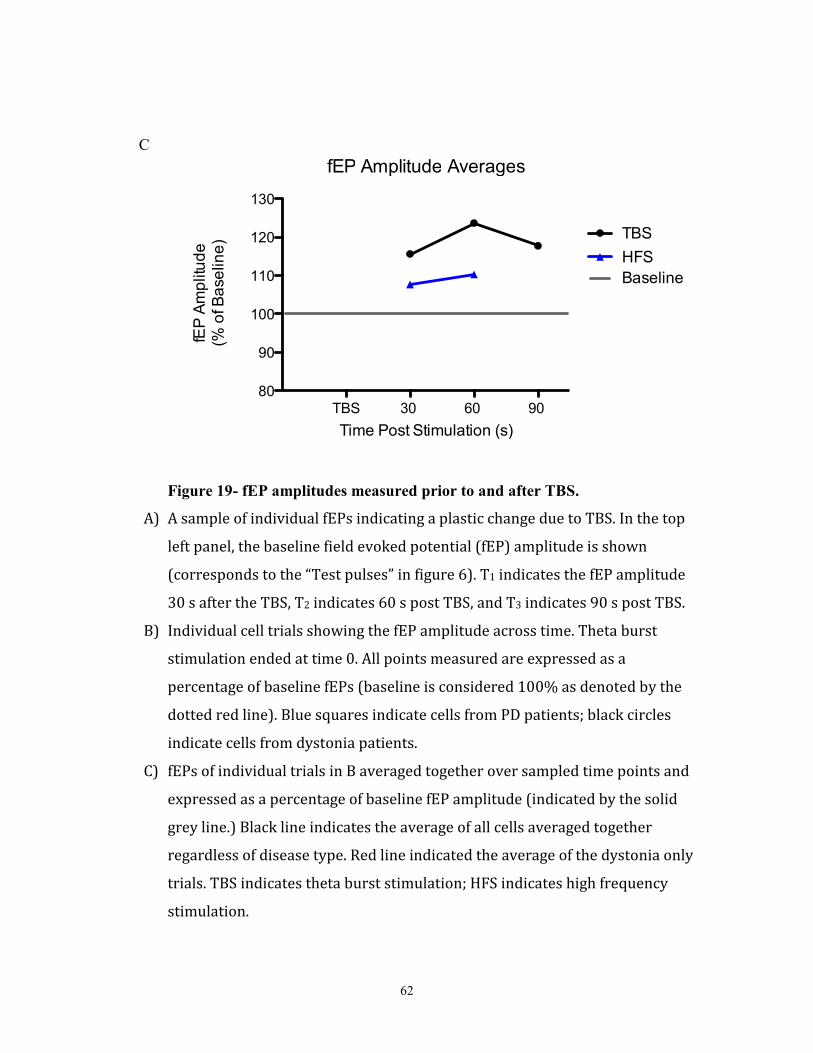
62
fEP Amplitude Averages
TBS 30 60 90 80
90
100
110
120
130
TBS
HFS
Baseline
Time Post Stimulation (s)
fEP
Am
plit
ud
e
(% o
f B
ase
line
)
Figure 19- fEP amplitudes measured prior to and after TBS.
A) A sample of individual fEPs indicating a plastic change due to TBS. In the top
left panel, the baseline field evoked potential (fEP) amplitude is shown
(corresponds to the “Test pulses” in figure 6). T1 indicates the fEP amplitude
30 s after the TBS, T2 indicates 60 s post TBS, and T3 indicates 90 s post TBS.
B) Individual cell trials showing the fEP amplitude across time. Theta burst
stimulation ended at time 0. All points measured are expressed as a
percentage of baseline fEPs (baseline is considered 100% as denoted by the
dotted red line). Blue squares indicate cells from PD patients; black circles
indicate cells from dystonia patients.
C) fEPs of individual trials in B averaged together over sampled time points and
expressed as a percentage of baseline fEP amplitude (indicated by the solid
grey line.) Black line indicates the average of all cells averaged together
regardless of disease type. Red line indicated the average of the dystonia only
trials. TBS indicates theta burst stimulation; HFS indicates high frequency
stimulation.
C

63
Another question we set out to answer dealt with how TBS compares to HFS. As
such, we also compared the amplitudes of fEP prior to and following HFS stimulation in
2 neurons from a patient with dystonia at 30 s and 60 s post-stimulation (Figure 19C). No
significance tests have been performed due to the low sample size of this study. However,
in comparing both neurons’ results from TBS and HFS respectively (i.e. neuron 1 TBS to
neuron 1 HFS, and neuron 2 TBS to neuron 2 HFS), it was found that the TBS always
produced a greater increase in fEP than the HFS. In fact, in comparing HFS to TBS
irrespective of aligning trials, it was found that the lowest measured fEP amplitude
recorded from TBS was higher than the highest fEP amplitude recorded following HFS.
The data was then averaged and analyzed as two groups: TBS (PD and dystonia
combined), and dystonia HFS (figure 19 C). Again, no test of significance was performed
due the small sample size; however, although this data is very preliminary, the data is
indicating that TBS is more efficacious at inducing LTP than HFS, as evidenced by the
higher fEP amplitudes measured after the stimulation protocol. This preliminary data
should be taken cautiously, especially due to the PD cell which may be considered an
outlier in this data series.
4.0 Chapter 4- Discussion
The bulk of this thesis has been dedicated to the characterization of the firing
patterns of this new class of border burst cells recently identified in our lab. Smaller side
studies also attempted to determine if this new class of neurons is responsible for
initiating tremor, and also what role these oscillations may play (if any) on plasticity
within the GPi. This work focuses on the role of theta oscillations as pertaining to tremor.
However, to fully discuss theta oscillations, it should be noted that theta oscillations
underlie many other phenomena within the body. Within the hippocampus, theta
oscillations are believed to be intricately linked with learning and memory. Other studies
have shown theta oscillations to be present in the GPi of patients with dystonia (Moll et
al. 2014), and during periods of dyskinesias (Cenci and Lindgren, 2007). As such, even if

64
the induced theta oscillations presented in this thesis are responsible for initiating tremor,
theta oscillations may sub serve other functions, both in and outside of the motor system.
4.1 Stimulation-Induced Oscillations
To date, there is no widespread scientific consensus as to what initiates tremor in
patients with movement disorders. Tremor is a very heterogeneous phenomenon that is
present in a variety of different diseases, and therefore it is unlikely that one “umbrella”
explanation will be capable of explaining all types of tremor. Parkinson’s disease is a
disease commonly affected by tremor as outlined in the introduction. Many theories have
been put forward to explain various aspects of the symptoms of PD, however, no theory
presently available can account for all aspects of the disease collectively. Helmich et al.,
(2011) used a combination of fMRI and SPECT imaging in combination with EMG
recordings and found that activity in the basal ganglia increases prior to the onset of
tremor in PD patients, indicating a role of the GPi in tremor. Specifically, it was found
that activity increased prior to the tremulous EMG activity but then became incoherent
with tremor activity soon after. This led to the formulation of the “Dimmer-Switch
Hypothesis” which states that the GPi initiates the tremor and the cerebellum controls the
amplitude. What is missing from Helmich’s work is what or how tremor actually starts
because imaging studies only indirectly measure the metabolic response to neuronal
activity (i.e. blood flow). In this regard, oscillatory activity in neurons cannot be
measured with the resolution of this technique. We believe to have accumulated evidence
suggesting a pivotal role of the GPi in this capacity. Our data indicates that certain
neurons in patients with and without tremor can be induced into a theta oscillation
(specifically within the tremor frequency) following brief microstimulations ranging from
3-7.5uA. There was a significant increase in burst index in PD patients when stimulated
at 5 and 7.5µA, and in dystonia patients when stimulated with 3 and 5µA indicating that
these neurons are becoming more bursty after their inhibitory period, however, no
significant difference was found in the burst index or firing rate ratios between PD and

65
dystonia patients (i.e. neither group can be deemed to become more bursty than the other
following stimulation.). There was a corresponding significant decrease in firing rate
between pre-stimulation and post-stimulation in PD patients when stimulated with 5 and
7.5µA, and in dystonia patients when stimulated with 5µA. Interestingly, it was found
that dystonia HFD neurons had a significantly lower pre-stimulation firing rate and a
significantly higher pre-stimulation mode burst index compared to the PD HFD neurons.
These findings are in agreement with Vitek et al (1999) who found lower firing rates and
increased burstiness in dystonia patients compared to PD patients. However, these
findings are contrast to those reported by Hutchison et al. (2003) who found no difference
between firing rates. This discrepancy may be due to the anesthetics used during surgery,
If a difference does exist, these findings would add support to the rate model of
movement disorders which imply that hyperkinetic (i.e. dystonia) disorders, such as
dystonia, occur due to decreased neuronal activity in the GPi which leads to decreased
inhibition of the motor thalamus, whereas hypokinetic disorders (i.e. PD) occur due to
increased inhibition of the thalamus from the GPi. Looking at the power spectra, there
was no significant difference in the theta and tremor frequency power spectra between
pre- and post-stimulation, regardless of stimulation intensity, except for tremor power in
dystonia patients at 5µA. Bear in mind that this study utilized microelectrodes, and thus
the amount of energy delivered to the brain is not likely to have been capable of inducing
a significant change in the oscillatory behavior of a network of cells. This finding could
be important as it may answer the “where” question pertaining to tremorgenesis. Another
important aspect to be addressed here is that the MKaneoke script which analyzed the
neuronal activity calculated values (i.e. firing rate, burst index, etc.) based on the whole
sampling window. As all neurons went through a silent period of varying lengths
following stimulation, this may influence (i.e. lower) the values that were attained by this
script. To better characterize these values, a measure such as the silent period (the time
from the end of the stimulation until the first spike) could be used. A 10 s sampling
window was chosen so that the sampling time was small while still having enough spikes
in the spike train during the recovery period.

66
Building on these findings and taking into consideration recent work by Milardi et
al., (2015) and Smith and Wichmann (2015), these border burst cells, if responsible for
the initial instigation of tremor, lie in a critical location within the brain that may endow
them with the potential to start tremor. Milardi and colleagues, using a constrained
spherical deconvolution technique demonstrated the presence of white matter tracts
directly connecting the GPi with the cortex in humans, now deemed the “super-direct”
pathway. In addition to this, Mathai et al. (2012), and Smith et al., (2014) using primates,
determined that this super-direct pathway connects the peripallidal regions of the GPi to
the cortex and uses glutamate as a neurotransmitter. It is in these regions of the GPi
where these border burst cells have been identified. We speculate that these border burst
cells may be initiating the tremor rhythm and the super-direct pathway acts as a short
circuit allowing for the signal to increase in gain to the point of phenotypic expression of
tremor. This discovery is important as it has now been demonstrated that one of the major
outputs of the basal ganglia encompasses neurons that can initiate a theta oscillation that
can be passed on to the downstream Vop of the thalamus and have reverberation directly
from the cortex. From the Vop, the thalamus then projects to the motor cortex; closing
the corticobasal-thalamic loop which is responsible for selecting which movement
commands are executed and which are discarded.
If future work were to confirm that these border burst cells are responsible for the
induction of tremor, more work would have to be undertaken to determine what triggers
these oscillations in the first place. Slice work by Llinas and Yarom (1986) showed that
depending on the membrane polarization state, neurons of the guinea pig inferior olive
could be induced into two different rhythms: if the membrane was depolarized, the cells
preferentially oscillated at 9-12 Hz. However, if the membrane was hyperpolarized, the
neurons would preferentially oscillate at 3-6 Hz. Liu et al., (2012) showed evidence of
decreased GPi firing rates due to stimulation within the GPi with microelectrodes. They
hypothesize that this inhibitory effect is due to the local release of GABA from afferent
67
terminals. In our recordings, all our cells, whether they oscillated or not, experienced a
short inhibitory period (indicating local hyperpolarization) following stimulation. Seeing
as some cells were then induced into a 4-6 Hz oscillatory rhythm following this
inhibition, one could speculate that the same mechanisms seen in the inferior olive
neurons are at play in the pallidal cells as well. Llinas and Yarom (1986) found that the
oscillations were produced due to a subthreshold membrane calcium dependent
oscillation. In short, calcium influx leads to the activation of calcium-dependent
potassium channels that then hyperpolarize the cell. This hyperpolarization leads to a
calcium rebound, which then depolarizes the cell and creates a membrane oscillation.
Cooper and Stanford (2000), using whole-cell recordings, found that the rat globus
pallidus includes neurons characterized by a voltage-dependent inward rectifying and low
threshold calcium currents. However, further work would have to confirm that these
currents are identical to those discussed by Llinas and Yarom, and that they exist within
human subjects.
4.2 Tremor Modification due to Theta Burst Stimulation in the Basal Ganglia
4.2.1 Theta Burst Stimulation in GPi
It is important to remember that just because these border burst cells have been
found to be able to generate their own tremor rhythm following a short microstimulation,
and the fact that they lie within one of the major output nuclei of the basal ganglia does
not necessarily mean that they are intricately involved with initiating tremor. To address
this, we applied theta burst stimulation (a protocol that mimics the induced-oscillations
that were recorded) to the GPi in patients undergoing GPi DBS implantation and looked
for the effect of stimulation on both the cellular activity and tremor activity as recorded
by an accelerometer. We also looked at upstream (STN) and downstream (motor
68
thalamus) targets to determine if theta burst stimulation had any effect. Within the GPi
we didn’t see any evidence of tremor modification. Although we did not collect evidence
of tremor modification from stimulating the GPi, we do have one example where
stimulating during a DBS implantation in the thalamus did induce tremor (see appendix
figure 3). However, it is believed that the electrode was lateral to the intended target and
may have been stimulating the corticospinal fibers of passage. We had hypothesized that
if the GPi is a tremorgenic nucleus, then we should see phase locking/resetting of the
tremor during stimulation theta burst stimulation. However, as previously mentioned, the
microelectrode setup that we used for this work isn’t likely to transfer enough energy to
induce a widely dispersed network of cells into a tremor rhythm and hence why we may
not have seen any effect. Plaha et al. (2008) have shown tremor induction through
stimulation of the zona incerta with DBS macroelectrodes. It is believed that if the GPi is
truly the originator of the tremorgenic oscillation that stimulating the GPi with an
electrode that delivers more energy may be capable of entraining the tremor network
neurons responsible for tremor initiation with in the GPi. In further reviewing the
literature, it was found that Constantoyannis et al., (2004) were able to induce postural
and action tremor in two patients by stimulating the ventral posteromedial nucleus of the
thalamus (aka, the Vop) with DBS electrodes. However, in this report, they only used
non-patterned stimulation, and only saw postural and action tremor, but not rest tremor
indicative of PD.
Looking at the cellular response to the theta burst stimulation, the majority (5/7)
of cells appeared to be inhibited by the stimulation protocol. This is expected due to the
local release of GABA due to the microstimulation as mentioned earlier by Liu et al.,
(2012). Seeing as the GPi sends tonically active GABAergic efferents to the motor
thalamus, inhibition of these GPi neurons would promote disinhibition of the thalamic
neurons. I speculate that if this disinhibition occurred rhythmically (say, at tremor
frequency) this could promote a tremor signal to be propagated to the motor cortex and
allow for the phenotypic expression of tremor.
69
4.2.2 Theta Burst Stimulation in Motor Thalamus
We also looked to see what effect theta burst stimulation may have on tremor
expression and cellular activity when applied to the Vim in Essential Tremor patients. As
the Vim is a common target of DBS electrode implantation/ thalamotomies for tremor,
we hoped to bypass any divergence of tremor activity that may be passed on from the
basal ganglia. Also, whereas we speculate that the GPi is a tremorgenic center but other
authors hypothesize that the thalamus is the site of tremor initiation, we wondered if theta
burst stimulation in the Vim could induce signs of tremor modification. Initially, I had
predicted that since tremor occurs between 4-6 Hz, that stimulating motor centers of the
brain would initiate tremor or cause a resetting of the tremor rhythm to the stimulation
frequency. Interestingly, in the motor thalamus, the only evidence of tremor modification
that were noted was some cases of tremor reduction. When the cellular activity of the
neurons being stimulated was analyzed, it was found that in three examples where tremor
reduction was seen, the cells were initially driven by the stimulation and then inhibited
later in the stimulation train. This is contrary to what we predicted. If the motor thalamus
is responsible for initiating tremor, and the theta burst stimulation is initially driving the
cellular activity, I would expect that the tremor should have been driven as well, not have
had an amplitude reduction as seen in one isolated case. However, this may be explained
by a recent review by Chiken and Nambu (2015) that discusses that DBS may not exert
its effects through excitation or inhibitory effects on cells/fibers of passage, but instead,
DBS may work via disconnecting the sensory input from the motor output. It is this
interaction of the two signals that is believed to underlie the pathology in many
movement disorders. This may be applicable to what we are seeing when stimulating the
motor thalamus with TBS: the stimulation may be activating the thalamocortical loop
allowing the sensory afferents to be disconnected from the motor efferents, and the
disconnection of these two signals may be reducing the amplitude of the tremor recorded.
Another important result that was seen when analyzing the phase histograms produced
following the theta burst stimulation is that the neuronal activity in the Vim was capable
70
of being entrained to the burst stimulation. This shows that these neurons are capable of
being entrained to a rhythm set elsewhere in the brain. As the GPi is an upstream nucleus
of the motor thalamus, this could strengthen the hypothesis that tremor initiation initially
occurs within the GPi and the tremorgenic signal is capable of entraining neurons in
downstream projections which play an integral part in movement selection.
4.2.3 Theta Burst Stimulation in Sub Thalamic Nucleus
Lastly, we examined the effect of theta burst stimulation on tremor and cellular
activity when the STN was stimulated. As the STN is an upstream target of the GPi, we
were curious to see if a theta burst signal produced here could elicit signs of tremor
modification, presumably through its glutamatergic projections to the GPi. Again, no
evidence of tremor modification was noted in any of the trials. There did not appear to be
any significant phase locking of the neuronal activity either- neuronal activity was diffuse
and sporadic throughout the phase. These findings tend to indicate that a theta rhythm in
the STN does not have the capacity to effect the phenotypic expression of tremor. This
does not necessarily rule out the STN as having a role in tremor but rather that our
experimental protocol was not sufficient in eliciting tremor modifications.
4.3 Effect of Theta Burst Stimulation on Plasticity within the GPi
The last component to this project deals with analyzing the changes in synaptic
plasticity that may be occurring in the GPi due to theta oscillations. As previously stated,
the activity of one cell in a network is not likely to have a large effect on the rest of the
network. Plasticity is important to this project since, for these border burst cells to have a
chance at inducing tremor, they have to be able to entrain other neurons to fire in

71
synchrony with them. We have an example from a patient with PD that shows a 75%
increase in the fEP recorded following TBS compared to before stimulation. Since the
fEP is indicative of the neurotransmitter release from a collection of other local neurons,
and the primary neurotransmitter within the GPi is GABA, this indicates that there is the
ability to induce plastic changes as a result of theta burst stimulation. This outcome was
only seen in one site however, and thus these findings are preliminary. One possible
reason for this enhanced efficacy seen with theta-burst stimulation over high-frequency
stimulation may be due to habituation of the cell during HFS that isn’t seen during TBS.
Since TBS is a burst stimulation paradigm, it has inherent pauses that could allow the cell
to recuperate (i.e. produce more/reuptake expelled neurotransmitter). This is in contrast to
HFS which doesn’t have pauses during the stimulation protocol, and thus
neurotransmitter stores may deplete over the stimulation duration. In looking at the rest of
the data, something else that was found striking was that the change in the fEP amplitude
from the PD neuron appeared to be much greater than that seen in the dystonia neurons.
Although both showed an increase in fEP from baseline conditions, the PD fEP amplitude
reached a maximum of 170% of baseline whereas the average maximum fEP amplitude
of the dystonia neurons only reached 111% of baseline, and the individual peak
maximum only reached 125% of the baseline. Clearly, more work needs to be done in
this area to determine if these results are significant. If found to be significant, the next
question would most likely be: What is responsible for the difference between the two
groups? One explanation could lie in recording variations that naturally occur. Anecdotal
evidence from performing these recordings has shown that the amplitude of the fEP can
vary depending on the proximity of the electrode tip to recording unit. This makes sense
intuitively: the closer the tip is to the cell, the more concentrated the chloride gradient in
the local milieu and this would register as a greater voltage in an electrical recording,
manifested as a larger fEP. It is important to note that these possible confounds could also
explain within group differences along with intergroup differences, and hence why these
results are volatile with small sample sizes. However, these results could also be due to
physiological differences in the neurons of the two disease groups. It is well known that
PD patients have a dopamine deficiency and this is not seen in dystonia groups. Previous
work has shown that there are plasticity abnormalities in PD patients due to this
72
dopamine deficiency. Piccconi et al., (2012) discuss that a lack of dopaminergic
innervation in PD leads to decreased cell excitability, and this has a profound effect on
the susceptibility of neurons to undergo plastic changes. Prescott et al., (2014) showed a
lack of depotentiation (a form of plasticity wherein synapses that have undergone long
term potentiation return back to their baseline gain) in the GPi and SNr of PD patients
taking L-DOPA. Based on these previous findings, one might expect to see atypical
plasticity in PD patients due to dopamine deficiency. However, one may also speculate
that it is not the dopamine levels per se that are responsible for the potential difference in
fEP amplitudes recorded, but the long term administration of L-DOPA commonly
prescribed to those with PD. Studies have posited that chronic L-DOPA therapy can lead
to pathological plastic changes that may underlie levodopa induced dyskinesias (Grace
2008). As such, this L-DOPA-dependent plasticity may be the underlying cause of this
yet-to-be-significantly-determined effect.
Not only did we look at the plastic response of the GPi to theta burst stimulation,
but we also attempted to determine the efficacy of TBS compared to HFS. TBS in the
hippocampus has been shown to be the ideal stimulation frequency as this frequency
allows priming of the synapse (which involves blocking presynaptic GABAB
autoreceptors allowing for maximal post-synaptic excitation leading to the opening of a
maximal number of NMDA receptors (Larson and Munkascy 2014). Zhu et al., (2015)
showed that HFS was also able to elicit LTP in hippocampal neurons, albeit by different
intracellular signaling mechanisms. Although a small sample size was used for this
study, it appeared that TBS may be more efficacious at inducing LTP in GPi neurons that
HFS, irrespective of disease type. However, HFS was only examined in dystonia patients
and therefore, this is not a balanced comparison. Further analysis of this data in light of
the possible plastic abnormalities expected in PD due to dopamine loss appears to show
that HFS and TBS are equally efficacious in eliciting LTP in a dystonia patient. However,
these results are only from one patient with 4 trials of TBS and two of HFS and tests of
significance have yet to be performed.
73
4.4 Future Directions
The work presented here is just the beginning of a possible explanation to
tremorgenesis. Future work needs to be undertaken to confirm these newly identified
border burst cells as the initiators of tremor. We examined the role of theta oscillation in
tremor modification with the use of microelectrodes. An alteration to the tremor
entraining methodology we used in this work could be to record EMG activity as well as
accelerometer data as there may have been tremulous activity occurring in the muscle but
was not detected visibly or by the accelerometer. Another approach to determining if
these oscillations are tremorgenic would be to stimulate the GPi with theta burst
stimulation while a second electrode records in the Vop. This would help determine if the
oscillatory activity in the GPi is transmitted to the motor thalamus; an assumption up to
this point. This experiment would most likely have to be performed in an animal model
due to the surgical restraints of performing this in humans- this protocol would require
two separate trajectories due to the location of the thalamus and GPi within the brain,
which would add to the invasiveness of the surgery.
Also of importance is determining what neuronal properties are responsible for
creating these oscillations. Although not presented in this work, we initially thought that
recurrent inhibitory collaterals within the GPi may have been responsible for setting the
theta oscillation, however, the anatomical connectivity of the GPi does not support this
theory (Bar-Gad et al., 2003). We now speculate that plasma membrane calcium channels
might play a role. Yarom and Llinas (1986) discovered that calcium dependent potassium
channels were responsible for the tremor-frequency oscillatory activity seen in guinea pig
inferior olive neurons (further discussed in the introduction). This may serve as a model
for our neurons.
74
Since the GPi tends to deal with motor commands being distributed to the body,
whereas the SNr distributes motor commands to the head, it would be interesting to see if
neurons in the SNr are capable of initiating their own theta rhythm like the border cells of
the GPi. Although the work presented here deals largely with rest tremor as seen in PD, it
would be unable to explain common tremors associated with dystonia, such as palatal
tremor or blepharospasms.
Lastly, another obvious future direction is to continue the work on the effect of
theta burst stimulation in the GPi to determine the effects of stimulation on plasticity.
With a larger sample size, we could try to determine if any significant difference exists
between PD and dystonia patients, as well as between theta burst stimulation and high
frequency stimulation. This could implicate whether the theta rhythm is capable of
inducing substantial plastic changes within the GPi that may be needed to entrain
networks of cells to fire at the tremor frequency.
75
4.5 Conclusions
This project was not able to successfully indicate the GPi as a tremorgenic nucleus. Data
was collected showing that neurons within the GPi could be induced into a tremor
stimulation following a brief electrical stimulation. However, we were unable to collect
evidence of tremor modification that may have drawn causation between the oscillation
and tremor. We have begun to look at the effect of theta burst stimulation on plasticity
within the GPi but have not collected enough data to draw conclusive results yet.
76
6.0 References
Abdo, W. F., van de Warrenburg, B. P. C., Burn, D. J., Quinn, N. P., & Bloem, B. R.
(2010). The clinical approach to movement disorders. Nature Reviews. Neurology, 6(1),
29–37. http://doi.org/10.1038/nrneurol.2009.196
Alavi, M., Dostrovsky, J. O., Hodaie, M., Lozano, A. M., & Hutchison, W. D. (2013).
Spatial extent of β oscillatory activity in and between the subthalamic nucleus and
substantia nigra pars reticulata of Parkinson's disease patients. Experimental Neurology,
245, 60–71. http://doi.org/10.1016/j.expneurol.2012.09.021
Albanese, A., Bhatia, K., Bressman, S. B., Delong, M. R., Fahn, S., Fung, V. S. C., et al.
(2013). Phenomenology and classification of dystonia: a consensus update. Movement
Disorders, 28(7), 863–873. http://doi.org/10.1002/mds.25475
Albanese, A., Bhatia, K., Bressman, S. B., Delong, M. R., Fahn, S., Fung, V. S. C., et al.
(2013). Phenomenology and classification of dystonia: a consensus update. Movement
Disorders, 28(7), 863–873. http://doi.org/10.1002/mds.25475
Alves, G., Forsaa, E. B., Pedersen, K. F., Dreetz Gjerstad, M., & Larsen, J. P. (2008).
Epidemiology of Parkinson's disease. Journal of Neurology, 255 Suppl 5(S5), 18–32.
http://doi.org/10.1007/s00415-008-5004-3
Balint, B., & Bhatia, K. P. (2014). Dystonia: an update on phenomenology, classification,
pathogenesis and treatment. Current Opinion in Neurology, 27(4), 468–476.
http://doi.org/10.1097/WCO.0000000000000114
Bar-Gad, I., Heimer, G., Ritov, Y., & Bergman, H. (2003). Functional correlations
between neighboring neurons in the primate globus pallidus are weak or
nonexistent. The Journal of Neuroscience : the Official Journal of the Society for
Neuroscience, 23(10), 4012–4016.

77
Blesa, J., Phani, S., Jackson-Lewis, V., & Przedborski, S. (2012). Classic and New
Animal Models of Parkinson's Disease. Journal of Biomedicine and Biotechnology,
2012(3), 1–10. http://doi.org/10.1155/2012/845618
Bliss, T. V., & Gardner-Medwin, A. R. (1973). Long-lasting potentiation of synaptic
transmission in the dentate area of the unanaestetized rabbit following stimulation of the
perforant path. The Journal of Physiology, 232(2), 357–374.
Bliss, T. V., & Lomo, T. (1973). Long-lasting potentiation of synaptic transmission
in the dentate area of the anaesthetized rabbit following stimulation of the
perforant path. The Journal of Physiology, 232(2), 331–356.
http://doi.org/10.1111/(ISSN)1469-7793
Brown, P. (2003). Oscillatory nature of human basal ganglia activity: relationship to the
pathophysiology of Parkinson's disease. Movement Disorders, 18(4), 357–363.
http://doi.org/10.1002/mds.10358
Brown, P., Oliviero, A., Mazzone, P., Insola, A., Tonali, P., & Di Lazzaro, V. (2001).
Dopamine dependency of oscillations between subthalamic nucleus and pallidum in
Parkinson's disease. The Journal of Neuroscience : the Official Journal of the Society for
Neuroscience, 21(3), 1033–1038.
Clark, L. N., & Louis, E. D. (2015). Challenges in essential tremor genetics. Revue
Neurologique, 171(6-7), 466–474. http://doi.org/10.1016/j.neurol.2015.02.015
Cohen, G. (1984) “Oxy-radical toxicity in catecholamine neurons,” NeuroToxicology,
vol. 5, no. 1, pp. 77–82
Cooper, A. J., & Stanford, I. M. (2000). Electrophysiological and morphological
characteristics of three subtypes of rat globus pallidus neurone in vitro. The Journal of
Physiology, 527 Pt 2(2), 291–304. http://doi.org/10.1111/j.1469-7793.2000.t01-1-
00291.x
Connolly, B. S., & Lang, A. E. (2014). Pharmacological treatment of Parkinson disease: a
review. Jama, 311(16), 1670–1683. http://doi.org/10.1001/jama.2014.3654
78
Connolly, A. T., Jensen, A. L., Bello, E. M., Netoff, T. I., Baker, K. B., Johnson, M. D.,
& Vitek, J. L. (2015). Modulations in oscillatory frequency and coupling in globus
pallidus with increasing parkinsonian severity. The Journal of Neuroscience : the Official
Journal of the Society for Neuroscience, 35(15), 6231–6240.
http://doi.org/10.1523/JNEUROSCI.4137-14.2015
Chung, S. J., Kwon, H., Lee, D.-K., Hong, J. Y., Sunwoo, M.-K., Sohn, Y. H., et al.
(2013). Neuroanatomical heterogeneity of essential tremor according to propranolol
response. PloS One, 8(12), e84054. http://doi.org/10.1371/journal.pone.0084054
Cenci, M. A., & Lindgren, H. S. (2007). Advances in understanding L-DOPA-induced
dyskinesia. Current Opinion in Neurobiology, 17(6), 665–671.
http://doi.org/10.1016/j.conb.2008.01.004
Dauer, W., & Przedborski, S. (2003). Parkinson's disease: mechanisms and models.
Neuron, 39(6), 889–909.
Deecher, D. C., Teitler, M., Soderlund, D. M., Bornmann, W. G., Kuehne, M. E., &
Glick, S. D. (1992). Mechanisms of action of ibogaine and harmaline congeners based on
radioligand binding studies. Brain Research, 571(2), 242–247.
Deuschl, G., Bain, P., & Brin, M. (1998). Consensus statement of the Movement
Disorder Society on Tremor. Ad Hoc Scientific Committee. Movement Disorders, 13
Suppl 3, 2–23.
Defazio, G., Gigante, A. F., Abbruzzese, G., Bentivoglio, A. R., Colosimo, C., Esposito,
M., et al. (2013). Tremor in primary adult-onset dystonia: prevalence and associated
clinical features. Journal of Neurology, Neurosurgery, and Psychiatry, 84(4), 404–408.
http://doi.org/10.1136/jnnp-2012-303782
Duval C. & Daneault J-F. (2015) A novel brain network model explaining tremor in
Parkinson’s disease. Manuscript Revision.
De Bruijn, E., Nijmeijer, S. W. R., Forbes, P. A., Koelman, J. H. T. M., van der Helm, F.
C. T., Tijssen, M. A. J., & Happee, R. (2015). Improved identification of dystonic

79
cervical muscles via abnormal muscle activity during isometric contractions. Journal of
the Neurological Sciences, 354(1-2), 10–16. http://doi.org/10.1016/j.jns.2015.03.047
Dehay, B., Bourdenx, M., Gorry, P., Przedborski, S., Vila, M., Hunot, S., et al. (2015).
Targeting α-synuclein for treatment of Parkinson's disease: mechanistic and therapeutic
considerations. The Lancet Neurology. http://doi.org/10.1016/S1474-4422(15)00006-X
Erogullari, A., Hollstein, R., Seibler, P., Braunholz, D., Koschmidder, E., Depping, R., et
al. (2014). THAP1, the gene mutated in DYT6 dystonia, autoregulates its own
expression. Biochimica Et Biophysica Acta, 1839(11), 1196–1204.
http://doi.org/10.1016/j.bbagrm.2014.07.019
Fasano, A., Visanji, N. P., Liu, L. W. C., Lang, A. E., & Pfeiffer, R. F. (2015).
Gastrointestinal dysfunction in Parkinson's disease. The Lancet Neurology, 14(6), 625–
639. http://doi.org/10.1016/S1474-4422(15)00007-1
Fujioka, S., Strongosky, A. J., Hassan, A., Rademakers, R., Dickson, D. W., & Wszolek,
Z. K. (2015). Clinical presentation of a patient with SLC20A2 and THAP1 deletions:
differential diagnosis of oromandibular dystonia. Parkinsonism & Related Disorders,
21(3), 329–331. http://doi.org/10.1016/j.parkreldis.2014.12.024
Gerfen, C. R. (2003). D1 dopamine receptor supersensitivity in the dopamine-depleted
striatum animal model of Parkinson's disease. The Neuroscientist : a Review Journal
Bringing Neurobiology, Neurology and Psychiatry, 9(6), 455–462.
http://doi.org/10.1177/1073858403255839
Gilbert, J. A., Frederick, L. M., & Ames, M. M. (2000). The aromatic-L-amino acid
decarboxylase inhibitor carbidopa is selectively cytotoxic to human pulmonary carcinoid
and small cell lung carcinoma cells. Clinical Cancer Research : an Official Journal of the
American Association for Cancer Research, 6(11), 4365–4372.
Huang, Y.-Z., Edwards, M. J., Rounis, E., Bhatia, K. P., & Rothwell, J. C. (2005). Theta
burst stimulation of the human motor cortex. Neuron, 45(2), 201–206.
http://doi.org/10.1016/j.neuron.2004.12.033

80
Hutchison, W.; Dostrosvky J.O.; Walters J.R.; Coutemanche, R.; Boraud, T.; Goldberg,
J.; Brown, P. (2004) Neuronal Oscillations in the Basal Ganglia and Movement
Disorders: Evidence from Whole Animal and Human Recordings. The Journal of
Neuroscience, 24(42): 9240-9243
Jinnah, H. A., & Factor, S. A. (2015). Diagnosis and treatment of dystonia. Neurologic
Clinics, 33(1), 77–100. http://doi.org/10.1016/j.ncl.2014.09.002
Kim, A.-Y., Seo, J. B., Kim, W.-T., Choi, H. J., Kim, S.-Y., Morrow, G., et al. (2015).
The pathogenic human Torsin A in Drosophila activates the unfolded protein response
and increases susceptibility to oxidative stress. BMC Genomics, 16(1), 338.
http://doi.org/10.1186/s12864-015-1518-0
Kishore, A., Popa, T., Balachandran, A., Chandran, S., Pradeep, S., Backer, F., et al.
(2014). Cerebellar sensory processing alterations impact motor cortical plasticity in
Parkinson's disease: clues from dyskinetic patients. Cerebral Cortex (New York, N.Y. :
1991), 24(8), 2055–2067. http://doi.org/10.1093/cercor/bht058
Klein, C., Breakefield, X. O., & Ozelius, L. J. (1999). Genetics of primary dystonia.
Seminars in Neurology, 19(3), 271–280. http://doi.org/10.1055/s-2008-1040843
Kühn, A. A., Kupsch, A., Schneider, G.-H., & Brown, P. (2006). Reduction in
subthalamic 8-35 Hz oscillatory activity correlates with clinical improvement in
Parkinson's disease. The European Journal of Neuroscience, 23(7), 1956–1960.
http://doi.org/10.1111/j.1460-9568.2006.04717.x
D.O. Hebb The Organization of Behavior, Wiley (1949)
Iacono, R. P., Lonser, R. R., Ulloth, J. E., & Shima, F. (1995). Postero-ventral
pallidotomy in Parkinson's disease. Journal of Clinical Neuroscience : Official Journal of
the Neurosurgical Society of Australasia, 2(2), 140–145.
Laitinen, L. V. (1994). Ventroposterolateral pallidotomy. Stereotactic and Functional
Neurosurgery, 62(1-4), 41–52.

81
Larson, J., & Munkácsy, E. (2014). Theta-burst LTP. Brain Research.
http://doi.org/10.1016/j.brainres.2014.10.034
Lettieri, C., Rinaldo, S., Devigili, G., Pisa, F., Mucchiut, M., Belgrado, E., et al. (2015).
Clinical outcome of deep brain stimulation for dystonia: constant-current or constant-
voltage stimulation? A non-randomized study. European Journal of Neurology : the
Official Journal of the European Federation of Neurological Societies, 22(6), 919–926.
http://doi.org/10.1111/ene.12515
Little, S., & Brown, P. (2014). The functional role of beta oscillations in Parkinson's
disease. Parkinsonism & Related Disorders, 20 Suppl 1, S44–8.
http://doi.org/10.1016/S1353-8020(13)70013-0
Neuronal intermediate filament overexpression and neurodegeneration in transgenic
mice. (2003). Neuronal intermediate filament overexpression and neurodegeneration in
transgenic mice., 184(1), 3–8.
Larson, J., & Munkácsy, E. (2014). Theta-burst LTP. Brain Research.
http://doi.org/10.1016/j.brainres.2014.10.034
Louis, E. D., Lee, M., Babij, R., Ma, K., Cortés, E., Vonsattel, J.-P. G., & Faust, P. L.
(2014). Reduced Purkinje cell dendritic arborization and loss of dendritic spines in
essential tremor. Brain, 137(Pt 12), 3142–3148. http://doi.org/10.1093/brain/awu314
Louis, E. D., Kuo, S.-H., Vonsattel, J.-P. G., & Faust, P. L. (2014). Torpedo formation
and Purkinje cell loss: modeling their relationship in cerebellar disease. Cerebellum
(London, England), 13(4), 433–439. http://doi.org/10.1007/s12311-014-0556-5
Louis, E. D. (2015). Essential Tremor: A Common Disorder of Purkinje Neurons? The
Neuroscientist : a Review Journal Bringing Neurobiology, Neurology and Psychiatry,
1073858415590351. http://doi.org/10.1177/1073858415590351
Liu LD, Prescott IA, Dostrovsky JO, Hodaie M, Lozano AM, Hutchison WD. (2012).
Frequency-dependent effects of electrical stimulation in the globus pallidus of dystonia
patients., 108(1), 5–17. http://doi.org/10.1152/jn.00527.2011
82
Mathai A, Pare JF, Jenkins S, Smith Y. (2012) A vGluT1-positive projection to the
primate globus pallidus: evidence for a cortico-pallidal system in primates? Soc Neurosci
Abstr; 790:06
Martinez-Martin, P., Rodriguez-Blazquez, C., Forjaz, M. J., & Kurtis, M. M. (2015).
Impact of Pharmacotherapy on Quality of Life in Patients with Parkinson's Disease. CNS
Drugs, 1–17. http://doi.org/10.1007/s40263-015-0247-x
Milardi D, Gaeta S, et al, (2015) Basal ganglia network by constrained spherical
deconvolution: a possible cortico-pallidal pathway? Mov Disord, 30(3):342-349
Mink, J. W. (1996). The basal ganglia: focused selection and inhibition of competing
motor programs. Progress in Neurobiology, 50(4), 381–425.
Mink, J. W. (2003). The Basal Ganglia and involuntary movements: impaired inhibition
of competing motor patterns. Archives of Neurology, 60(10), 1365–1368.
http://doi.org/10.1001/archneur.60.10.1365
Moll, C. K. E., Galindo-Leon, E., Sharott, A., Gulberti, A., Buhmann, C., Koeppen, J. A.,
et al. (2014). Asymmetric pallidal neuronal activity in patients with cervical dystonia.
Frontiers in Systems Neuroscience, 8, 15. http://doi.org/10.3389/fnsys.2014.00015
Ni, Z., Gunraj, C., Kailey, P., Cash, R. F. H., & Chen, R. (2014). Heterosynaptic
modulation of motor cortical plasticity in human. The Journal of Neuroscience : the
Official Journal of the Society for Neuroscience, 34(21), 7314–7321.
http://doi.org/10.1523/JNEUROSCI.4714-13.2014
Pahuja, R., Seth, K., Shukla, A., Shukla, R. K., Bhatnagar, P., Chauhan, L. K. S., et al.
(2015). Trans-blood brain barrier delivery of dopamine-loaded nanoparticles reverses
functional deficits in parkinsonian rats. ACS Nano, 9(5), 4850–4871.
http://doi.org/10.1021/nn506408v
Picconi, B., Piccoli, G., & Calabresi, P. (2012). Synaptic dysfunction in Parkinson's
disease. Advances in Experimental Medicine and Biology, 970, 553–572.
http://doi.org/10.1007/978-3-7091-0932-8_24

83
Prescott, I. A., Dostrovsky, J. O., Moro, E., Hodaie, M., Lozano, A. M., & Hutchison, W.
D. (2009). Levodopa enhances synaptic plasticity in the substantia nigra pars reticulata of
Parkinson's disease patients. Brain, 132(Pt 2), 309–318.
http://doi.org/10.1093/brain/awn322
Prescott, I. A., Dostrovsky, J. O., Moro, E., Hodaie, M., Lozano, A. M., & Hutchison, W.
D. (2013). Reduced paired pulse depression in the basal ganglia of dystonia patients.
Neurobiology of Disease, 51, 214–221. http://doi.org/10.1016/j.nbd.2012.11.012
Rincon, F., & Louis, E. D. (2005). Benefits and risks of pharmacological and surgical
treatments for essential tremor: disease mechanisms and current management. Expert
Opinion on Drug Safety, 4(5), 899–913. http://doi.org/10.1517/14740338.4.5.899
Schmouth, J.-F., Dion, P. A., & Rouleau, G. A. (2014). Genetics of essential tremor: from
phenotype to genes, insights from both human and mouse studies. Progress in
Neurobiology, 119-120, 1–19. http://doi.org/10.1016/j.pneurobio.2014.05.001
Sian J, Youdin MBH, Reiderer P, Gerlach M. MPTP-induced parkinsonian syndrome
(1999) Basic Neurochemistry: Molecular, cellular, and medical aspects. 6th edition.
Philadelphia: Lippincott- Raven
Siebner H. R., Tormos J. M., Ceballos-Baumann A. O., Auer, C, Catala, M. D., Conrad,
B., Pascual-Leone, A. (1999) Low- frequency repetitive transcranial magnetic stimulation
of the motor cortex in writer’s cramp. Neurology, 52: 529–37.
Smith Y, Mathai A, Pare JF, Moot RC. (2014) A putative vGluT1-Positive glutamatergic
cortico-pallidal projection: Differential organization between the internal and external
globua pallidus. Soc Neurosci Abstr; 248:10
Smith, Y., and Wichmann, T. (2015) The cortico-pallidal projection: An additional route
for cortical regulation of the basal ganglia circuitry. Mov Disord 30(3): 293-295
Stegemöller, E. L., Allen, D. P., Simuni, T., & MacKinnon, C. D. (2015). Motor cortical
oscillations are abnormally suppressed during repetitive movement in patients with
Parkinson's disease. Clinical Neurophysiology : Official Journal of the International
84
Federation of Clinical Neurophysiology. http://doi.org/10.1016/j.clinph.2015.05.014
Tasker, R. R. (1998). Deep brain stimulation is preferable to thalamotomy for tremor
suppression. Surgical Neurology, 49(2), 145–53– discussion 153–4.
Thomas, B., & Beal, M. F. (2007). Parkinson's disease. Human Molecular Genetics, 16
Spec No. 2(R2), R183–94. http://doi.org/10.1093/hmg/ddm159
Volkmann, J., Joliot, M., Mogilner, A., Ioannides, A. A., Lado, F., Fazzini, E., et al.
(1996). Central motor loop oscillations in parkinsonian resting tremor revealed by
magnetoencephalography. Neurology, 46(5), 1359–1370.
Yelnik, J., Percheron, G., & François, C. (1984). A Golgi analysis of the primate globus
pallidus. II. Quantitative morphology and spatial orientation of dendritic arborizations.
The Journal of Comparative Neurology, 227(2), 200–213.
http://doi.org/10.1002/cne.902270206
Zhu, G., Liu, Y., Wang, Y., Bi, X., & Baudry, M. (2015). Different patterns of electrical
activity lead to long-term potentiation by activating different intracellular pathways. The
Journal of Neuroscience : the Official Journal of the Society for Neuroscience, 35(2),
621–633. http://doi.org/10.1523/JNEUROSCI.2193-14.2015

85
Appendix
a
b
c
d e

86
Appendix Figure 1- A sample of the read-out produced from the Matlab script
MKaneoke from the neuronal trace seen in Figure 6.
A) A raster plot showing discriminated spikes in time (vertical lines). Vertical
lines connected with horizontal lines indicate bursts identified by the script.
Each row represents 1 s with the start of the trace beginning in the bottom
left corner of the plot.
B) A plot showing the instantaneous firing frequency of the cell across time. Red
dots indicate firing frequencies significantly higher than the average firing
rate.
C) A wavelet spectrogram showing the power of the signal across time. Note the
theta-band dominance of the this signal.
D) An autocorelogram showing the periodicity of this oscillation.
E) The power spectra determined by the fast Fourier transform (FFT) showing
power bands throughout the recording. Note the largest power peak occupies
the 4-6 Hz range (part of the theta band).

87

88
Appendix Figure 2A- The MKaneoke produced from the top trace in Figure 9 prior
to stimulation.
A) A raster plot showing discriminated spikes in time (vertical lines). Vertical
lines connected with horizontal lines indicate bursts identified by the script.
Each row represents 1 s with the start of the trace beginning in the bottom
left corner of the plot.
B) A plot showing the instantaneous firing frequency of the cell across time. Red
dots indicate firing frequencies significantly higher than the average firing
rate.
C) A wavelet spectrogram showing the power of the signal across time.
D) An autocorelogram showing the periodicity of this oscillation.
E) The power spectra determined by the fast Fourier transform (FFT) showing
power bands throughout the recording.

89

90
Appendix Figure 2B- The MKaneoke produced from the lower trace in Figure 9
following stimulation.
A) A raster plot showing discriminated spikes in time (vertical lines). Vertical
lines connected with horizontal lines indicate bursts identified by the script.
Each row represents 1 s with the start of the trace beginning in the bottom
left corner of the plot.
B) A plot showing the instantaneous firing frequency of the cell across time. Red
dots indicate firing frequencies significantly higher than the average firing
rate.
C) A wavelet spectrogram showing the power of the signal across time.
D) An autocorelogram showing the periodicity of this oscillation.
E) The power spectra determined by the fast Fourier transform (FFT) showing
power bands throughout the recording.

91

104
Appendix Figure 3- An example of theta burst stimulation inducing visible tremor in a
patients foot during microelectrode mapping for DBS implantation surgery.
Although the target of this surgery was the thalamus, it is believed that the electrodes missed the
target and are stimulating the fibers of passage of the internal capsule.
A) EMG activity recorded from the patient’s left leg.
B) EMG activity from the patient’s right arm.
C) Accelerometer activity recorded from the patient’s right arm.
D) Accelerometer activity recorded from the patient’s right foot.
E) EMG activity recorded from the patient’s right leg,
F) Activity recorded from the distal electrode during theta burst stimulation.
Vertical dotted lined are spaced 1 s apart and aligned with the onset of the TBS. Notice that the
TBS precedes the right leg EMG activity, which precedes the tremor recorded by the
accelerometer attached to the right foot. Also, the tremor amplitude appears to increase as TBS
continues.

204


