Role of surrogate markers in assessment of insulin resistance in females with thyroid disorders
4
Original article Role of surrogate markers in assessment of insulin resistance in females with thyroid disorders Binita Goswami a,1, *, Bhawna Singh b,1 a Department of Biochemistry, Lady Hardinge Medical College, New Delhi 110001, India b Department of Biochemistry, G B Pant Hospital, New Delhi 110002, India 1. Introduction Glucose homeostasis is under stringent regulation of counter regulatory hormones with insulin being the prime anti diabeto- genic hormone; glucagons, thyroid hormones, cortisol, growth hormones, etc. belonging to the group of diabetogenic hormones. The metabolic syndrome is an agglomeration of interrelated risk factors that indicate individuals at increased risk for type 2 diabetes mellitus (DM) and coronary artery disease (CAD). Insulin resistance (IR) along with visceral adiposity, dyslipidemia and chronic subclinical proinflammatory state are the main charac- teristic features of metabolic syndrome. Insulin resistance syndrome has assumed epidemic proportions in India in last few decades [1]. The role of thyroid hormones in the pathogenesis of IR is controversial. Thyroid hormones influence glucose metabolism and glucose intolerance is associated with hypothyroidism as well as hyperthyroidism [2,3]. A number of surrogate markers have been used to assess the insulin resistance. Homeostatic model assessment (HOMA) is the most common and sensitive methodology for assessment of b-cell function and insulin resistance (IR). The homeostasis model assessment (HOMA) for insulin resistance (HOMA-IR) derives estimates of insulin sensitivity from the mathematical modeling of fasting plasma glucose and insulin concentrations [4]. Other markers such as fasting glucose and insulin, glucose/insulin ratio, insulin/c peptide and glucose/c peptide ratio may also be used to estimate the glucose tolerance/IR. C-peptide is released by the pancreatic b cell during cleavage of proinsulin in equimolar amounts with insulin. C peptide has long been thought to be biologically inert, but now several studies are pointing towards its etio-pathophysiological role associated with hyperinsulinemia and atherosclerosis [5]. Iron stores, expressed as serum ferritin concentration, have been proposed to be a component of the insulin–resistance Diabetes & Metabolic Syndrome: Clinical Research & Reviews 6 (2012) 163–166 A R T I C L E I N F O Keywords: Insulin Hypothyroidism Hyperthyroidism HOMA-IR Ferritin C-peptide A B S T R A C T Introduction: Thyroid status is known to affect insulin sensitivity although conflicting data have been reported regarding hypothyroid and hyperthyroid states. Assessment of insulin resistance is difficult, therefore we compared homeostasis model assessment (HOMA), glucose to insulin (G:I) ratio, glucose to C-peptide (G:C) ratio and ferritin of hypothyroid and hyperthyroid subjects with euthyroid, euglycemic subjects. Methods: The study group comprised of 40 hypothyroid, 25 hyperthyroid female subjects and 40 euthyroid controls. Serum samples of all the patients were assayed for thyroid profile, glucose, Insulin, C- peptide and ferritin. Homeostasis model of assessment (HOMA-IR), (G:I), (G:C) and ferritin were employed as surrogate measures to assess the level of insulin resistance. The area under the curves for the surrogate markers was determined from the receiver operating characteristics (ROC) curves for the hypothyroid and hyperthyroid patients. Results: Patients with hypothyroidism demonstrated insulin resistance as observed by the higher HOMA-IR and G:I ratio as compared to the controls whereas insulin resistance was not detected in the hyperthyroid patients in our study. Conclusion: Thyroid dysfunction attributes to deranged glucose metabolism. Assessment of the surrogate markers might prove to be beneficial in detecting insulin resistance at the incipient stages and subsequent management. ß 2012 Diabetes India. Published by Elsevier Ltd. All rights reserved. * Corresponding author. Tel.: +91 09718599056. E-mail addresses: [email protected] (B. Goswami), [email protected] (B. Singh). 1 Both authors contributed equally. Contents lists available at SciVerse ScienceDirect Diabetes & Metabolic Syndrome: Clinical Research & Reviews jo ur n al h o mep ag e: www .elsevier .c om /loc ate/d s x 1871-4021/$ – see front matter ß 2012 Diabetes India. Published by Elsevier Ltd. All rights reserved. http://dx.doi.org/10.1016/j.dsx.2012.09.003
Transcript of Role of surrogate markers in assessment of insulin resistance in females with thyroid disorders

Diabetes & Metabolic Syndrome: Clinical Research & Reviews 6 (2012) 163–166
Original article
Role of surrogate markers in assessment of insulin resistance in females withthyroid disorders
Binita Goswami a,1,*, Bhawna Singh b,1
a Department of Biochemistry, Lady Hardinge Medical College, New Delhi 110001, Indiab Department of Biochemistry, G B Pant Hospital, New Delhi 110002, India
A R T I C L E I N F O
Keywords:
Insulin
Hypothyroidism
Hyperthyroidism
HOMA-IR
Ferritin
C-peptide
A B S T R A C T
Introduction: Thyroid status is known to affect insulin sensitivity although conflicting data have been
reported regarding hypothyroid and hyperthyroid states. Assessment of insulin resistance is difficult,
therefore we compared homeostasis model assessment (HOMA), glucose to insulin (G:I) ratio, glucose to
C-peptide (G:C) ratio and ferritin of hypothyroid and hyperthyroid subjects with euthyroid, euglycemic
subjects.
Methods: The study group comprised of 40 hypothyroid, 25 hyperthyroid female subjects and 40
euthyroid controls. Serum samples of all the patients were assayed for thyroid profile, glucose, Insulin, C-
peptide and ferritin. Homeostasis model of assessment (HOMA-IR), (G:I), (G:C) and ferritin were
employed as surrogate measures to assess the level of insulin resistance. The area under the curves for
the surrogate markers was determined from the receiver operating characteristics (ROC) curves for the
hypothyroid and hyperthyroid patients.
Results: Patients with hypothyroidism demonstrated insulin resistance as observed by the higher
HOMA-IR and G:I ratio as compared to the controls whereas insulin resistance was not detected in the
hyperthyroid patients in our study.
Conclusion: Thyroid dysfunction attributes to deranged glucose metabolism. Assessment of the
surrogate markers might prove to be beneficial in detecting insulin resistance at the incipient stages
and subsequent management.
� 2012 Diabetes India. Published by Elsevier Ltd. All rights reserved.
Contents lists available at SciVerse ScienceDirect
Diabetes & Metabolic Syndrome: Clinical Research &Reviews
jo ur n al h o mep ag e: www .e lsev ier . c om / loc ate /d s x
1. Introduction
Glucose homeostasis is under stringent regulation of counterregulatory hormones with insulin being the prime anti diabeto-genic hormone; glucagons, thyroid hormones, cortisol, growthhormones, etc. belonging to the group of diabetogenic hormones.The metabolic syndrome is an agglomeration of interrelated riskfactors that indicate individuals at increased risk for type 2diabetes mellitus (DM) and coronary artery disease (CAD). Insulinresistance (IR) along with visceral adiposity, dyslipidemia andchronic subclinical proinflammatory state are the main charac-teristic features of metabolic syndrome. Insulin resistancesyndrome has assumed epidemic proportions in India in lastfew decades [1].
* Corresponding author. Tel.: +91 09718599056.
E-mail addresses: [email protected] (B. Goswami),
[email protected] (B. Singh).1 Both authors contributed equally.
1871-4021/$ – see front matter � 2012 Diabetes India. Published by Elsevier Ltd. All r
http://dx.doi.org/10.1016/j.dsx.2012.09.003
The role of thyroid hormones in the pathogenesis of IR iscontroversial. Thyroid hormones influence glucose metabolismand glucose intolerance is associated with hypothyroidism as wellas hyperthyroidism [2,3].
A number of surrogate markers have been used to assess theinsulin resistance. Homeostatic model assessment (HOMA) is themost common and sensitive methodology for assessment of b-cellfunction and insulin resistance (IR). The homeostasis modelassessment (HOMA) for insulin resistance (HOMA-IR) derivesestimates of insulin sensitivity from the mathematical modeling offasting plasma glucose and insulin concentrations [4]. Othermarkers such as fasting glucose and insulin, glucose/insulin ratio,insulin/c peptide and glucose/c peptide ratio may also be used toestimate the glucose tolerance/IR.
C-peptide is released by the pancreatic b cell during cleavage ofproinsulin in equimolar amounts with insulin. C peptide has longbeen thought to be biologically inert, but now several studies arepointing towards its etio-pathophysiological role associated withhyperinsulinemia and atherosclerosis [5].
Iron stores, expressed as serum ferritin concentration, havebeen proposed to be a component of the insulin–resistance
ights reserved.
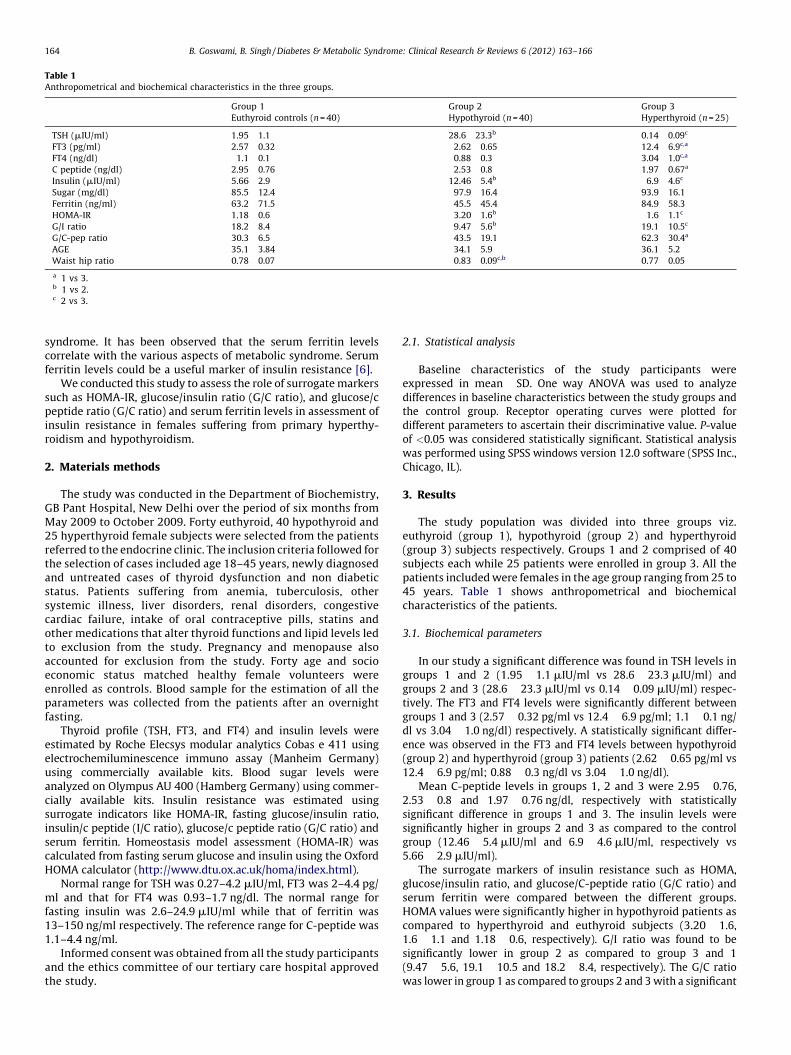
Table 1Anthropometrical and biochemical characteristics in the three groups.
Group 1
Euthyroid controls (n = 40)
Group 2
Hypothyroid (n = 40)
Group 3
Hyperthyroid (n = 25)
TSH (mIU/ml) 1.95 � 1.1 28.6 � 23.3b 0.14 � 0.09c
FT3 (pg/ml) 2.57 � 0.32 2.62 � 0.65 12.4 � 6.9c,a
FT4 (ng/dl) 1.1 � 0.1 0.88 � 0.3 3.04 � 1.0c,a
C peptide (ng/dl) 2.95 � 0.76 2.53 � 0.8 1.97 � 0.67a
Insulin (mIU/ml) 5.66 � 2.9 12.46 � 5.4b 6.9 � 4.6c
Sugar (mg/dl) 85.5 � 12.4 97.9 � 16.4 93.9 � 16.1
Ferritin (ng/ml) 63.2 � 71.5 45.5 � 45.4 84.9 � 58.3
HOMA-IR 1.18 � 0.6 3.20 � 1.6b 1.6 � 1.1c
G/I ratio 18.2 � 8.4 9.47 � 5.6b 19.1 � 10.5c
G/C-pep ratio 30.3 � 6.5 43.5 � 19.1 62.3 � 30.4a
AGE 35.1 � 3.84 34.1 � 5.9 36.1 � 5.2
Waist hip ratio 0.78 � 0.07 0.83 � 0.09c,b 0.77 � 0.05
a 1 vs 3.b 1 vs 2.c 2 vs 3.
B. Goswami, B. Singh / Diabetes & Metabolic Syndrome: Clinical Research & Reviews 6 (2012) 163–166164
syndrome. It has been observed that the serum ferritin levelscorrelate with the various aspects of metabolic syndrome. Serumferritin levels could be a useful marker of insulin resistance [6].
We conducted this study to assess the role of surrogate markerssuch as HOMA-IR, glucose/insulin ratio (G/C ratio), and glucose/cpeptide ratio (G/C ratio) and serum ferritin levels in assessment ofinsulin resistance in females suffering from primary hyperthy-roidism and hypothyroidism.
2. Materials methods
The study was conducted in the Department of Biochemistry,GB Pant Hospital, New Delhi over the period of six months fromMay 2009 to October 2009. Forty euthyroid, 40 hypothyroid and25 hyperthyroid female subjects were selected from the patientsreferred to the endocrine clinic. The inclusion criteria followed forthe selection of cases included age 18–45 years, newly diagnosedand untreated cases of thyroid dysfunction and non diabeticstatus. Patients suffering from anemia, tuberculosis, othersystemic illness, liver disorders, renal disorders, congestivecardiac failure, intake of oral contraceptive pills, statins andother medications that alter thyroid functions and lipid levels ledto exclusion from the study. Pregnancy and menopause alsoaccounted for exclusion from the study. Forty age and socioeconomic status matched healthy female volunteers wereenrolled as controls. Blood sample for the estimation of all theparameters was collected from the patients after an overnightfasting.
Thyroid profile (TSH, FT3, and FT4) and insulin levels wereestimated by Roche Elecsys modular analytics Cobas e 411 usingelectrochemiluminescence immuno assay (Manheim Germany)using commercially available kits. Blood sugar levels wereanalyzed on Olympus AU 400 (Hamberg Germany) using commer-cially available kits. Insulin resistance was estimated usingsurrogate indicators like HOMA-IR, fasting glucose/insulin ratio,insulin/c peptide (I/C ratio), glucose/c peptide ratio (G/C ratio) andserum ferritin. Homeostasis model assessment (HOMA-IR) wascalculated from fasting serum glucose and insulin using the OxfordHOMA calculator (http://www.dtu.ox.ac.uk/homa/index.html).
Normal range for TSH was 0.27–4.2 mIU/ml, FT3 was 2–4.4 pg/ml and that for FT4 was 0.93–1.7 ng/dl. The normal range forfasting insulin was 2.6–24.9 mIU/ml while that of ferritin was13–150 ng/ml respectively. The reference range for C-peptide was1.1–4.4 ng/ml.
Informed consent was obtained from all the study participantsand the ethics committee of our tertiary care hospital approvedthe study.
2.1. Statistical analysis
Baseline characteristics of the study participants wereexpressed in mean � SD. One way ANOVA was used to analyzedifferences in baseline characteristics between the study groups andthe control group. Receptor operating curves were plotted fordifferent parameters to ascertain their discriminative value. P-valueof <0.05 was considered statistically significant. Statistical analysiswas performed using SPSS windows version 12.0 software (SPSS Inc.,Chicago, IL).
3. Results
The study population was divided into three groups viz.euthyroid (group 1), hypothyroid (group 2) and hyperthyroid(group 3) subjects respectively. Groups 1 and 2 comprised of 40subjects each while 25 patients were enrolled in group 3. All thepatients included were females in the age group ranging from 25 to45 years. Table 1 shows anthropometrical and biochemicalcharacteristics of the patients.
3.1. Biochemical parameters
In our study a significant difference was found in TSH levels ingroups 1 and 2 (1.95 � 1.1 mIU/ml vs 28.6 � 23.3 mIU/ml) andgroups 2 and 3 (28.6 � 23.3 mIU/ml vs 0.14 � 0.09 mIU/ml) respec-tively. The FT3 and FT4 levels were significantly different betweengroups 1 and 3 (2.57 � 0.32 pg/ml vs 12.4 � 6.9 pg/ml; 1.1 � 0.1 ng/dl vs 3.04 � 1.0 ng/dl) respectively. A statistically significant differ-ence was observed in the FT3 and FT4 levels between hypothyroid(group 2) and hyperthyroid (group 3) patients (2.62 � 0.65 pg/ml vs12.4 � 6.9 pg/ml; 0.88 � 0.3 ng/dl vs 3.04 � 1.0 ng/dl).
Mean C-peptide levels in groups 1, 2 and 3 were 2.95 � 0.76,2.53 � 0.8 and 1.97 � 0.76 ng/dl, respectively with statisticallysignificant difference in groups 1 and 3. The insulin levels weresignificantly higher in groups 2 and 3 as compared to the controlgroup (12.46 � 5.4 mIU/ml and 6.9 � 4.6 mIU/ml, respectively vs5.66 � 2.9 mIU/ml).
The surrogate markers of insulin resistance such as HOMA,glucose/insulin ratio, and glucose/C-peptide ratio (G/C ratio) andserum ferritin were compared between the different groups.HOMA values were significantly higher in hypothyroid patients ascompared to hyperthyroid and euthyroid subjects (3.20 � 1.6,1.6 � 1.1 and 1.18 � 0.6, respectively). G/I ratio was found to besignificantly lower in group 2 as compared to group 3 and 1(9.47 � 5.6, 19.1 � 10.5 and 18.2 � 8.4, respectively). The G/C ratiowas lower in group 1 as compared to groups 2 and 3 with a significant

Table 2Area under curve for the different parameters under study.
Group 2
Hypotyhroid (n = 40)
Group 3
Hyperthyroid
(n = 25)
AUC P AUC P
HOMA 0.903 <0.001 0.582 ns
Ferritin 0.538 ns 0.645 ns
G/C – pep ratio 0.752 0.019 0.882 0.003
G/I ratio 0.138 0.001 0.5 ns
B. Goswami, B. Singh / Diabetes & Metabolic Syndrome: Clinical Research & Reviews 6 (2012) 163–166 165
difference present only in group 3 (30.3 � 6.5, 43.5 � 19.1 and62.3 � 30.4, respectively). Serum ferritin levels were observed to behigher in hyperthyroid patients and lower in hypothyroid patientswhen compared with the control group (84.9 � 58.3, 45.5 � 45.4 and63.2 � 71.5, respectively). However, no statistical significance differ-ence was noticed.
3.2. Area under the curves for the different surrogate markers
The area under the curves for the surrogate markers such asHOMA-IR, glucose/insulin ratio (G/I ratio), glucose/c peptide ratio(G/C ratio) and serum ferritin levels were determined from thereceiver operating characteristics (ROC) curves for the hypothyroidand hyperthyroid patients. Among the hypothyroid patients,HOMA and G/C ratio emerged as good indicators of insulinresistance with area under curves of 0.903 and 0.752, respectively.On the other hand, G/C ratio was superior to the other surrogatemarkers as determined from the ROC curve in hyperthyroidpatients with an AUC of 0.882. All other markers were notsignificantly different between the hyperthyroid and euthyroidsubjects (Table 2).
4. Discussion
An intricate interplay exists between thyroid hormones,carbohydrate metabolism and diabetes. Thyrotoxicosis can altercarbohydrate metabolism in type 2 diabetes [7]. Incidence ofthyroid disorder has been reported to be 13.4% in patients withdiabetes which is significantly higher than that in the generalpopulation [8].
Thyroid disease is much more prevalent in women thanmen—women are five to eight times more likely to develophypothyroidism [9] and 5–10 times more likely to develophyperthyroidism [10]. Shantha et al. have observed that femaleswith insulin resistance have significant association withsubclinical and overt hypothyroidism [11]. Thyroid diseasecan increase the risk of diabetes, cardiovascular disease,infertility, and osteoporosis [12]. Tuzcu et al. observed thathypothyroidism may be associated with fasting hyperinsuline-mia [13]. Bakker et al. [14] demonstrated significant interactionsbetween insulin resistance and thyroid function in euthyroidnondiabetic adults. In the present study we aimed to evaluatethe effect of thyroid disorders on insulin resistance ineuglycemic patients with varying degrees of thyroid status.
Blood glucose or serum insulin levels determined at oneinstance is not considered to be ideal predictors of abnormalitiesin insulin action [15,16]. Various combinations or permutations ofthese two parameters as surrogate markers such as HOMA, G/C, G/I have proved beneficial for assessment of insulin resistance.These are easily obtainable, highly sensitive, and specificmeasures of insulin sensitivity. The role of ferritin in insulinresistant states has been implicated [1] and hence it can beexplored as another putative bio marker in patients with hyperand hypothyroidism.
HOMA of b-cell function and insulin resistance (IR) is themethod of choice for evaluating b-cell function and IR from fastingglucose and insulin/C-peptide concentrations [4]. The relationshipbetween glucose and insulin in the basal state reflects the balancebetween hepatic glucose output and insulin secretion, which ismaintained by a feedback loop between the liver and b-cells [17].The use of HOMA to estimate insulin sensitivity helps to compareinsulin sensitivity in subjects with abnormal glucose tolerance.
Our study demonstrated that hypothyroidism may lead to astate of insulin resistance as depicted by the significantly highlevels of HOMA in hypothyroid patients as compared to euthyroidand hyperthyroid subjects. Our findings are in conformity withMaratou et al. [18] who demonstrated association between insulinresistance and hypothyroidism. HOMA in hyperthyroid subjectswas comparable with the euthyroid subjects although there arestudies which have reported positive correlation between hyper-thyroidism and glucose intolerance as measured by HOMA [19].
Legro et al. concluded from their study on women sufferingfrom poly cystic ovarian disease, which is also characterized byinsulin resistance, that fasting G:I ratio may be a useful screeningtest for detecting insulin resistance [20]. In our study G:I ratioshowed a significant difference in this ratio between hypothyroidand euthyroid females. However, extensive cross sectional studiesare required to establish the role of G:I ratio as surrogate marker insuch patients. There was however no significant difference in G:Iratio between hyperthyroid and euthyroid subjects, signifying thatit might not be useful to characterize insulin resistance inhyperthyroid patients.
C-peptide is formed from pro-insulin and co-secreted withinsulin and is a robust measure of insulin secretion but not ofinsulin action. C-peptide might be regarded as a separate entitywith biochemical and physiological characteristics different fromthose of insulin [21]. It is utilized in calculation of HOMA toevaluate insulin resistance [4]. We attempted to evaluate theinsulin resistance in our study groups by comparing the mean Cpeptide levels and using G/C ratio as surrogate marker of insulinresistance. The G/C ratio was lower in euthyroid controls ascompared to hypothyroid and hyperthyroid with a significantdifference present only in hyperthyroid. Our results illustrate thata fasting G:C ratio can be treated as a good measure of insulinsensitivity in detecting insulin-resistant hypothyroid as well ashyperthyroid women. Area under curve calculated by ROC curvessuggested that G:C ratio emerged as best marker for insulinresistance in both hypo as well as hyperthyroid subjects whencompared to other parameters evaluated in our study.
Increased serum ferritin has been associated with a variety ofconditions that contribute to the metabolic syndrome [1,22,23].Various theories have been postulated to explain the possible linkbetween insulin resistance and ferritin. Elevated iron stores havebeen implicated to affect the insulin release from liver thus causingperipheral hyperinsulinemia [24,25]. Generation of free radicals bythe iron mediated Fenton and Heber Weiss reaction may also leadto development of insulin resistance [26,27]. However in our studyno significant difference was observed in ferritin levels betweenthe three groups viz. hypothyroid, hyperthyroid and euthyroidsubjects. Hence ferritin levels cannot be considered to be an idealcandidate as surrogate marker for insulin resistance.
5. Conclusion
We evaluated the roles of HOMA-IR, G/I ratio, G/C ratio andserum ferritin levels as surrogate markers for the assessment ofinsulin resistance in females suffering from hyperthyroidism andhypothyroidism. Insulin resistance was observed to be prevalent inthe hypothyroid female patients as suggested by significantlyraised G:I ratio, HOMA-IR. However, presence of insulin resistance
B. Goswami, B. Singh / Diabetes & Metabolic Syndrome: Clinical Research & Reviews 6 (2012) 163–166166
in hyperthyroidism still remains enigmatic due to conflictingresults as depicted by higher G:C ratio and comparable HOMA-IRvalues viz. the euthyroid group. The findings of our study need tobe substantiated by further population based prospective studies.
Conflict of interest
None declared.
References
[1] Singh B, Arora S, Goswami B, Mallika V. Metabolic syndrome: a review ofemerging markers and management. Diabetes and Metabolic Syndrome.Clinical Research and Reviews 2009;3(4):240–54.
[2] Ortega E, Koska J, Pannacciulli N, Bunt JC, Krakoff J. Free triiodothyronineplasma concentrations are positively associated with insulin secretion ineuthyroid individuals. European Journal of Endocrinology 2008;158(2):217–21.
[3] Owecki M, El Ali Z, Nikisch E, Sowinski J. Serum insulin levels and the degree ofthyroid dysfunction in hypothyroid women. Neuro Endocrinology Letters2008;29(1):137–40.
[4] Wallace TM, Levy JC, Matthews DR. Use and abuse of HOMA modeling.Diabetes Care 2004;27:1487–95.
[5] Bruemmer D. C-peptide in insulin resistance and vascular complications.Teaching an old dog new tricks. Circulation Research 2006;99(11):1149–51.
[6] Fernandez-Real JM, Lopez-Bermejo A, Ricart W. Cross-talk between ironmetabolism and diabetes. Diabetes 2002;51:2348–54.
[7] Potenza M, Via MA, Yanagisawa RT. Excess thyroid hormone and carbohydratemetabolism. Endocrine Practice 2009;15(3):254–62.
[8] Perros P, McCrimmon R, Shaw G, Frier B. Frequency of thyroid dysfunction indiabetic patients: value of annual screening. Diabetic Medicine 1995;7:622–7.
[9] Sisk J. Thyroid disease in women. For the Record 2005;17(14):34.[10] American Association of Clinical Endocrinologists. Hyperthyroidism; 2006.
Available at: www.aace.com/pub/thyroidbrochures/pdfs/Hyperthyroidism.pdf[accessed 30.04.07].
[11] Shantha GPS, Kumar AA, Jeyachandran V, Rajamanickam D, Rajkumar K, SalimS, et al. Association between primary hypothyroidism and metabolic syn-drome and the role of C reactive protein: a cross-sectional study from SouthIndia. Thyroid Research 2009;2:2.
[12] Johnson JL, Duick DS. Diabetes and thyroid disease: a likely combination.Diabetes Spectrum 2002;5:140–2.
[13] Tuzcu A, Bahceci M, Gokalp D, Tuzun Y, Gunes K. Subclinical hypothyroidismmay be associated with elevated high-sensitive C-reactive protein (low gradeinflammation) and fasting hyperinsulinemia. Endocrine Journal 2005;52:89–94.
[14] Bakker SJL, Ter Maaten JC, Popp-Snijders C, Slaets JPJ, Heine RJ, Gans ROB. Therelationship between thyrotropin and low density lipoprotein cholesterol ismodified by insulin sensitivity in healthy euthyroid subjects. The Journal ofClinical Endocrinology & Metabolism 2001;86:1206–11.
[15] Laakso M. How good a marker is insulin level for insulin resistance? AmericanJournal of Epidemiology 1993;137:959–65.
[16] American Diabetic Association. Consensus development conference on insulinresistance. Diabetes Care 1998;21:310–4.
[17] Turner RC, Holman RR, Matthews D, Hockaday TD, Peto J. Insulin deficiencyand insulin resistance interaction in diabetes: estimation of their relativecontribution by feedback analysis from basal plasma insulin and glucoseconcentrations. Metabolism Clinical and Experimental 1979;28:1086–96.
[18] Maratou E, Hadjidakis D, Kollias A, Tsegka K, Peppa M, Alevizaki M, et al.Studies of insulin resistance in patients with clinical and subclinical hypothy-roidism. European Journal of Endocrinology 2009;160(5):785–90.
[19] Shen DC, Davidson MB. Hyperthyroid graves’ disease causes insulin antago-nism. Journal of Clinical Endocrinology and Metabolism 1985;60(5):1038–41.
[20] Legro RS, Finegood D, Dunaif A. A fasting glucose to insulin ratio is a usefulmeasure of insulin sensitivity in women with polycystic ovary syndrome.Journal of Clinical Endocrinology and Metabolism 1998;83(8):2694–8.
[21] Wahren J, Ekberg K, Johansson J, Henriksson M, Pramanik A, Johansson B. Roleof C-peptide in human physiology. American Journal of Physiology – Endocri-nology and Metabolism 2000;278:E759–68.
[22] Dandona P, Hussain MA, Varghese Z, Politis D, Flynn DM, Hoffbrand AV. Insulinresistance and iron overload. Annals of Clinical Biochemistry 1983;20:77–9.
[23] Piperno A. Classification and diagnosis of iron overload. Haematologica1998;83:447–55.
[24] Piperno A, Trombini P, Gelosa M, Mauri V, Pecci V, Vergani A, et al. Increasedserum ferritin is common in men with essential hypertension. Journal ofHypertension 2002;20:1513–8.
[25] Salonen JT, Nyyssonen K, Korpela H, Tuomilehto J, Seppanen R, Salonen R. Highstored iron levels are associated with excess risk of myocardial infarction ineastern Finnish men. Circulation 1992;86:803–11.
[26] Adult Treatment Panel III. Third Report of the National Cholesterol EducationProgram (NCEP) expert panel on detection, evaluation, and treatment of highblood cholesterol in adults (Adult Treatment Panel III): final report. Circulation2002;106:3143–421.
[27] Bozzini C, Girelli D, Olivieri O, Martinelli N, Bassi A, De Matteis G, et al.Prevalence of body iron excess in the metabolic syndrome. Diabetes Care2005;28:2061–3.