Role of State Owned Enterprises in India's Economic Development
60
Workshop on State-Owned Enterprises in the Development Process Paris, 4 April 2014 OECD Conference Centre, Room 4 ROLE OF STATE-OWNED ENTERPRISES IN INDIA’S ECONOMIC DEVELOPMENT by Professor Ram Kumar Mishra This paper serves as background material for the Workshop on SOEs in the Development Process taking place in Paris on 4 April 2014. It was prepared by Professor Ram Mishra from the Institute of Public Enterprise in India, working as a consultant for the OECD Secretariat. The opinions and views expressed and arguments employed herein are those of the author and do not necessarily reflect or represent the official views of the OECD or of the governments of its member countries.
-
Upload
truongliem -
Category
Documents
-
view
221 -
download
5
Transcript of Role of State Owned Enterprises in India's Economic Development

Workshop on State-Owned Enterprises in the
Development Process
Paris, 4 April 2014
OECD Conference Centre, Room 4
ROLE OF STATE-OWNED ENTERPRISES IN INDIA’S ECONOMIC DEVELOPMENT
by Professor Ram Kumar Mishra
This paper serves as background material for the Workshop on SOEs in the Development Process taking place in Paris on 4 April 2014. It was prepared by Professor Ram Mishra from the Institute of Public Enterprise in India, working as a consultant for the OECD Secretariat.
The opinions and views expressed and arguments employed herein are those of the author and do not necessarily reflect or represent the official views of the OECD or of the governments of its member countries.

1
Role of State Owned Enterprises in India’s Economic Development
R K Mishra
Economic Development has been the prime concern of the Indian state since the inception of
India’s independence in 1947. India was born independent with mass poverty, illiteracy,
unemployment and disease. It faced the challenge of growth and change to catch up with the
developed countries. It had to decide on vital issues such as its development strategy for the
future, the industrial policy it had to adopt to achieve the goals of the development strategy,
the corporate action that had to follow as a consequence of such industrial policy, the need
for setting up the State Owned Enterprises (SOEs) as an instrument of implementing the
public policy and to provide a fillip to the private sector to make India a mixed economy. The
purpose of this paper is to narrate, in brief, a historic overview of evolving development
strategies and industrial policies in India, discuss at length the experience over recent decades
with assigning SOEs with public policy objectives in pursuit of developmental goals, focus
on state-controlled alternatives to SOEs in detail and, finally based on the Indian experience
outline lessons for other countries that have embarked on the path of economic development.
Senior Professor and Director, Institute of Public Enterprise, OU Campus, Hyderabad
Email : [email protected]
I express my gratitude to OECD secretariat for the opportunity given to write the paper. However, I alone am
responsible for the facts and opinions contained in the paper.
2
SECTION: I
Historic overview of evolving development strategies and industrial policies
India’s experience with development strategies has been of great interest as reflected in the
‘Hindu rate of growth of three percent’ between 1951 and 1991 to a ‘galloping rate of growth
of eight percent and above’ in 2008 which declined to less than five percent in 2013 due to
global depression. India’s developmental exercise started in 1951 with the formulation and
implementation of its First Five Year Plan. Between 1951 and now, India has had 12 Five
Year Plans and three rolling plans. Currently, India is in the XII Five Year Plan which
commenced on April 1, 2012 and would terminate on March 31, 2017 (2012 – 17). The
political economy of India has undergone a complete transformation from a one party
dominance at the Centre, provinces and union territories to a motley coalition of several
political parties at the Centre, 28 provinces and seven union territories forming the Indian
union.
Development Strategy
The objective of India’s development strategy has been to establish a socialistic pattern of
society through economic growth with self-reliance, social justice and alleviation of poverty.
These objectives were to be achieved within a democratic political framework using the
mechanism of a mixed economy where both public and private sectors co-exist. India
initiated planning for national economic development with the establishment of the Planning
Commission. Since Independence, the Indian economy has been premised on the concept of
planning. This has been carried through the Five Year Plans (FYP), developed, executed, and
monitored by the Planning Commission. The Eleventh Plan completed its term in March
2012 and the twelfth plan is currently underway.
First Five Year Plan (1951 – 1956)
India launched its First FYP in 1951, immediately after independence under socialist
influence of first Prime Minister Jawaharlal Nehru. FYPs are centralized and integrated
national economic programs. The first Five-Year Plan was one of the most important because
it has a great role in the launching of Indian development after the Independence. Thus, it
strongly supported agriculture production and it also launched the industrialization of the
country. It built a particular system of "Mixed economy", with a great role for the public
sector, as well as a growing private sector.
Second Five Year Plan (1956 – 1961)
The second plan, particularly focused on the development of the public sector. The plan
followed the Mahalanobis model1, an economic development model developed by the Indian
statistician Prasanta Chandra Mahalanobis in 1953. The plan attempted to determine the
optimal allocation of investment between productive sectors in order to maximize long-run
economic growth. The plan assumed a closed economy in which the main trading activity
would be centered on importing capital goods. Hydroelectric power projects and five steel
plants at Bhilai, Durgapur, and Rourkela were established. Coal production was increased.
More railway lines were added in the north east. The Tata Institute of Fundamental Research
was established as a research institute. In 1957 a talent search and scholarship program was
1 Ryutaro Komiya, A Note on Professor Mahalanobis' Model of Indian Economic Planning, The Review of
Economics and Statistics Vol. 41, No. 1 (Feb., 1959), pp. 29-35

3
begun to find talented young students to train for work in nuclear power. The total amount
allocated under the second five-year plan in India was Rs 48 billion. This amount was
allocated among various sectors: Power and irrigation, Social services, Communications and
transport. The target growth rate was 4.5% and the actual growth rate was 4.27%.
Third Five Year Plan (1961 – 1966) The third Five-year Plan stressed agriculture and improvement in the production of wheat,
but the brief Sino-Indian War of 1962 exposed weaknesses in the economy and shifted the
focus towards the defence industry and the Indian Army. There was also a severe drought in
1965. The war led to inflation and the priority was shifted to price stabilisation. The
construction of dams continued. Many cement and fertilizer plants were also built. Punjab
began producing an abundance of wheat. Many primary schools were started in rural areas. In
an effort to bring democracy to the grass-root level, Panchayat elections were started and the
states were given more development responsibilities. State electricity boards and state
secondary education boards were formed. States were made responsible for secondary and
higher education. State road transportation corporations were formed and local road building
became a state responsibility. The target growth rate was 5.6%, but the actual growth rate was
2.4%.
Due to miserable failure of third plan the government was forced to declare "plan holidays"
(from 1966 – 67, 1967 – 68, and 1968 – 69). Three annual plans were drawn during this
intervening period. During 1966-67 there was again the problem of drought. Equal priority
was given to agriculture, its allied activities, and industrial sector. The main reasons for plan
holidays were the war, lack of resources, and increase in inflation.
Fourth Five Year Plan (1969 – 1974)
During this plan government nationalized 14 major Indian banks and the Green Revolution in
India advanced agriculture. In addition, the situation in East Pakistan (now Bangladesh) was
becoming dire as the Indo-Pakistan War of 1971 and Bangladesh Liberation War took funds
earmarked for industrial development had to be diverted for the war effort. India also
performed the Smiling Buddha underground nuclear test in 1974, partially in response to the
United States deployment of the Seventh Fleet in the Bay of Bengal. The fleet had been
deployed to warn India against attacking West Pakistan and extending the war. The target
growth rate was 5.6%, but the actual growth rate was 3.3%.
Fifth Five Year Plan (1974 – 1979) The fifth Five-year Plan laid stress on employment, poverty alleviation, and justice. The plan
also focused on self-reliance in agricultural production and defence. In 1978 the newly
elected Morarji Desai government rejected the plan. The Electricity Supply Act was amended
in 1975, which enabled the central government to enter into power generation and
transmission. The Indian national highway system was introduced and many roads were
widened to accommodate the increasing traffic. Tourism also expanded. It was followed from
1974 to 1979. The target growth rate was 4.4% and the actual growth rate was 5.0.
Rolling Plan (1978 – 1980)
The Janata Party government rejected the fifth five year plan and introduced a new Sixth five
year plan (1978 – 1983). This plan was again rejected by the Indian National Congress
government in 1980 and a new sixth plan was made. The earlier one was subsequently
referred to as a rolling plan.

4
Sixth Five Year Plan (1980 – 1985)
The sixth Five-year Plan marked the beginning of economic liberalisation. Price controls
were eliminated and ration shops were closed. This led to an increase in food prices and an
increase in the cost of living. Family planning was also expanded in order to prevent
overpopulation. In contrast to China's strict and binding one-child policy, Indian policy did
not rely on the threat of force. More prosperous areas of India adopted family planning more
rapidly than less prosperous areas, which continued to have a high birth rate. The sixth Five-
year Plan was a great success to Indian economy. The target growth rate was 5.2% and the
actual growth rate was 5.4%.
Seventh Five Year Plan (1985 – 1990)
The plan laid stress on improving the productivity level of industries by upgrading of
technology. The main objectives of the 7th Five-year Plan were to establish growth in areas
of increasing economic productivity, production of food grains, and generating employment.
As an outcome of the sixth Five-year Plan, there had been steady growth in agriculture,
controls on the rate of inflation, and favourable balance of payments which had provided a
strong base for the seventh Five-year Plan to build on the need for further economic growth.
The seventh plan had strived towards socialism and energy production at large. The thrust
areas of the seventh Five-year Plan were: Social Justice, Removal of oppression of the weak,
Using modern technology, Agricultural development, Anti-poverty programs, Full supply of
food, clothing, and shelter, Increasing productivity of small and large-scale farmers, and
Making India an Independent Economy. Based on a 15-year period of striving towards steady
growth, the seventh plan was focused on achieving the pre-requisites of self-sustaining
growth by the year 2000. The plan expected a growth in labour force by 39 million people
and employment was expected to grow at the rate of 4% per year. The target growth rate was
5.0% and the actual growth rate was 6.01%.
Eighth Five Year Plan (1992 – 1997)
1989 – 91 was a period of economic instability in India and hence no five-year plan was
implemented. Between 1990 and 1992, there were only Annual Plans. In 1991, India faced a
crisis in Foreign Exchange (Forex) reserves, left with reserves of only about US$1 billion.
Thus, under pressure, the country took the risk of reforming the socialist economy. At that
time India launched its free market reforms that brought the nearly bankrupt nation back from
the edge. It was the beginning of privatisation and liberalisation in India where the new
economic policy was introduced in July, 1991.
Modernization of industries was a major highlight of the Eighth Plan. Under this plan, the
gradual opening of the Indian economy was undertaken to correct the burgeoning deficit and
foreign debt. Meanwhile India became a member of the World Trade Organization on 1
January 1995. The major objectives included, controlling population growth, poverty
reduction, employment generation, strengthening the infrastructure, Institutional building,
tourism management, Human Resource development, Involvement of Panchayat raj, Nagar
Palikas, N.G.O'S and Decentralisation and people's participation. Energy was given priority
with 26.6% of the outlay. An average annual growth rate of 6.78% against the target 5.6%
was achieved.
Ninth Five Year Plan (1998 – 2002)
The Ninth Five Year Plan tried primarily to use the latent and unexplored economic potential
of the country to promote economic and social growth. The Ninth Five Year Plan offered
strong support to the social spheres of the country in an effort to achieve complete
elimination of poverty. The satisfactory implementation of the Eighth Five Year Plan also

5
ensured in the States ability to proceed on the path of faster development. The Ninth Five
Year Plan also saw joint efforts from the public and the private sectors in ensuring economic
development of the country. In addition, the Ninth Five Year Plan saw contributions towards
development from the general public as well as Governmental agencies in both the rural and
urban areas of the country. New implementation measures in the form of Special Action
Plans (SAPs) were evolved during the Ninth Five Year Plan to fulfil targets within the
stipulated time with adequate resources. The SAPs covered the areas of social infrastructure,
agriculture, information technology and Water policy.
The Ninth Five Year Plan focused the relationship between the rapid economic growth and
the quality of life for the people of the country. The prime focus of the Ninth Five Year Plan
was to increase growth in the country with an emphasis on social justice and equity. The
Ninth Five Year Plan paid considerable importance on combining growth oriented policies
with the mission of achieving the desired objective of improving policies which would work
towards the improvement of the poor in the country. The Ninth Five Year Plan also aimed at
correcting the historical inequalities which were still prevalent in the society. The Ninth Five
Year Plan achieved a growth rate of 5.4% against a target of 6.5%.
Tenth Five Year Plan (2002 – 2007)
The main objectives of the tenth Five Year Plan of India were the following: (1) Attain 8%
GDP growth per year; (2) Reduction of poverty rate by 5 percentage points by 2007; (3)
Providing gainful and high-quality employment at least to the addition to the labor force; 4.
Reduction in gender gaps in literacy and wage rates by at least 50% by 2007; 5. 20-point
program was introduced; 6. The target growth was 8.1% and growth achieved was 7.7%.
Eleventh Five Year Plan (2007 – 2012)
The eleventh plan emphasizes faster and more inclusive growth. According to the plan
document the strategy for inclusive growth in the eleventh plan is not just a conventional
strategy for the growth to which some element aimed at inclusion have been added. On the
contrary, it is a strategy which aims at achieving particular type of growth process which will
meet the objectives of inclusiveness and sustainability. This strategy must be based on sound
economic preconditions for rapid growth and support key drivers of this growth. It must also
include sector specific policies which will ensure that the structure of growth that is generated
and the institutional environment in which it occurs, achieves the objectives of inclusiveness
in all its many dimensions. The strategy of development in Eleventh Plan is given in Box 1.
Box 1 : Eleventh Plan Strategy of Development
1. Rapid growth at 9 percent that reduces poverty and creates employment.
2. Equality of opportunity
3. Access to essential services in heath and education especially for the poor
4. Empowerment through education and skill development
5. Employment opportunities underpinned by the national rural employment
guarantee
6. Environment sustainability
7. Reorganization of women agency
8. Good governance

6
Twelfth Five Year Plan (2012 – 2017)
The Twelfth Five-Year Plan of the Government of India has decided for the growth rate at
8.2% but the National Development Council (NDC) on 27 Dec 2012 approved 8% growth
rate for 12th
five-year plan. The government intends to reduce poverty by 10 percent during
the 12th
Five-Year Plan.
Industrial Policy in India
When India achieved Independence in 1947, the national consensus was in favour of rapid
industrialization of the economy which was seen not only as the key to economic
development but also to economic sovereignty. In the subsequent years, India's Industrial
Policy evolved through successive Industrial Policy Resolutions and Industrial Policy
Statements. Specific priorities for industrial development were also laid down in the
successive Five Year Plans. Building on the so-called "Bombay Plan" in the pre-
Independence era, the first Industrial Policy Resolution announced in 1948 laid down broad
contours of the strategy of industrial development.
Important distinctions were made among industries to be kept under the exclusive ownership
of Government, i.e., the public sector, those reserved for private sector and the joint sector.
Subsequently, the Industrial (Department and Regulation) Act (IDR Act) was enacted in 1951
with the objective of empowering the Government to take necessary steps to regulate the
pattern of industrial development through licensing. This paved the way for the Industrial
Policy Resolution of 1956, which was the first comprehensive statement on the strategy for
industrial development in India.
Industrial Strategy
The seeds of India’s industrial strategy were sown in pre-independence era, more precisely in
the report of the National Economic Planning Committee set up by the All India Congress
Committee in 1937 headed by Mr Jawaharlal Nehru. The report suggested vigorous efforts
for India’s industrial development through a mixed economy with a dominant role for the
public sector. This was followed by the ‘Peoples Plan’ prepared by Mr M N Roy, a leading
Member of the Communist Party of India in 1941 which provided all-in-all role to public
sector and financing of the industrial plan through internal resources. The Tata-Birla plan of
industrial development also known as the Bombay Plan, prepared in 1944-45, had
recommended government support for industrialization, including a direct role in the
production of capital goods. It had called for a substantial role of the private sector in the
industrial development. The ‘interim rule’ put in place by the British government in 1945
had under the Defence of India Rules charted out a path for industrial development of India.
The plan suggested by the interim government for industrial development categorized
industries into four divisions of which two were exclusively reserved for public sector and
these related to core and heavy industrial sectors. Of the remaining two, public and private
sectors were allowed access to intermediate industries forming the third sector while the
consumer goods industry was reserved for the private sector. Interestingly, the first Industrial
Policy Statement of 1948 was a restatement of the 1945 categorization as adopted by the
interim government. The role of the state in the national development was debated
intensively since the declaration of the Industrial Policy Statement of 1948 in the Parliament.
Industrial Policy Statement – 1948
The Government of India announced its first Industrial Policy Statement in 19482 whereby
both public and private sectors were involved towards industrial development. Accordingly,
2 Statement On Industrial Policy, July 24, 1991, Ministry Of Industry, GoI
7
the industries were divided into four broad categories: Exclusive State Monopoly included
the manufacture of arms and ammunition, production and control of atomic energy and the
ownership and management of railway transport. These industries were the exclusive
monopoly of the Central Government. State Monopoly for New Units included coal, iron and
steel, aircraft manufacture, ship building, manufacture of telephone, telegraphs and wireless
(apparatus (excluding radio receiving sets) and mineral oils. New undertakings in this
category could from then onward be taken the State. State Regulated category included
industries of such basic importance like machine tools, chemicals, fertilizers, non-ferrous
metals, rubber manufactures, cement, paper, newsprint, automobiles, electric engineering etc.
which the Central Government could feel necessary to plan and regulate. Unregulated private
enterprises category included the industries that were left open to the private sector,
individual as well as cooperative.
Industrial Policy Resolution – 1956
The Industrial Policy Resolution – 1956 was shaped by the Mahalanobis Model of growth,
which suggested that emphasis on heavy industries would lead the economy towards a long
term higher growth path. The Resolution widened the scope of the public sector. The
objective was to accelerate: 1. Bombay Plan prepared3 by leading Indian industrialists in
1944-45 had recommended government support for industrialization, including a direct role
in the production of capital goods. 2 economic growth and boost the process of
industrialization as a means to achieving a socialistic pattern of society. Given the scarce
capital and inadequate entrepreneurial base, the Resolution accorded a predominant role to
the State to assume direct responsibility for industrial development. All industries of basic
and strategic importance and those in the nature of public utility services besides those
requiring large scale investment were reserved for the public sector. The Industrial Policy
Resolution - 1956 classified industries into three categories. The first category comprised 17
industries (included in Schedule A of the Resolution) exclusively under the domain of the
Government. These included inter alia, railways, air transport, arms and ammunition, iron
and steel and atomic energy.
The second category comprised 12 industries (included in Schedule B of the Resolution),
which were envisaged to be progressively State owned but private sector was expected to
supplement the efforts of the State. The third category contained all the remaining industries
and it was expected that private sector would initiate development of these industries but they
would remain open for the State as well. It was envisaged that the State would facilitate and
encourage development of these industries in the private sector, in accordance with the
programmes formulated under the Five Year Plans, by appropriate fiscal measures and
ensuring adequate infrastructure. Despite the demarcation of industries into separate
categories, the Resolution was flexible enough to allow the required adjustments and
modifications in the national interest. Another objective spelt out in the Industrial Policy
Resolution – 1956 was the removal of regional disparities through development of regions
with low industrial base. Accordingly, adequate infrastructure for industrial development of
such regions was duly emphasized. Given the potential to provide large-scale employment,
the Resolution reiterated the Government’s determination to provide all sorts of assistance to
small and cottage industries for wider dispersal of the industrial base and more equitable
distribution of income. The Resolution, in fact, reflected the prevalent value system of India
in the early 1950s, which was centered around self sufficiency in industrial production. The
3 Amal Sanyal, The Curious Case of the Bombay Plan, Contemporary Issues and Ideas in Social
Sciences, June 2010

8
Industrial Policy Resolution – 1956 was a landmark policy statement and it formed the basis
of subsequent policy announcements.
Industrial Policy Measures in the 1960s and 1970s
Monopolies Inquiry Commission (MIC) was set up in 1964 to review various aspects
pertaining to concentration of economic power and operations of industrial licensing under
the IDR Act, 1951. While emphasizing that the planned economy contributed to the growth
of industry, the Report by MIC concluded that the industrial licensing system enabled big
business houses to obtain disproportionately large share of licenses which had led to pre-
emption and foreclosure of capacity. Subsequently, the Industrial Licensing Policy Inquiry
Committee (Dutt Committee), constituted in 1967, recommended that larger industrial houses
should be given licenses only for setting up industry in core and heavy investment sectors,
thereby necessitating reorientation of industrial licensing policy.
In 1969, the Monopolies and Restrictive Trade Practices (MRTP) Act was introduced to
enable the Government to effectively control concentration of economic power. The Dutt
Committee had defined large business houses as those with assets of more than Rs.350
million. The MRTP Act, 1969 defined large business houses as those with assets of Rs. 200
million and above. Large industries were designated as MRTP companies and were eligible
to participate in industries that were not reserved for the Government or the Small scale
sector. The new Industrial Licensing Policy of 1970 classified industries into four categories.
First category, termed as ‘Core Sector’, consisted of basic, critical and strategic industries.
Second category termed as ‘Heavy Investment Sector’, comprised projects involving
investment of more than Rs.50 million. The third category, the ‘Middle Sector’ consisted of
projects with investment in the range of Rs.10 million to Rs.50 million. The fourth category
was ‘De- licensed Sector’, in which investment was less than Rs.10 million and was
exempted from licensing requirements. The industrial licensing policy of 1970 confined the
role of large business houses and foreign companies to the core, heavy and export oriented
sectors.
The Industrial Policy Statement – 1973
With a view to prevent excessive concentration of industrial activity in the large industrial
houses, this Statement gave preference to small and medium entrepreneurs over the large
houses and foreign companies in setting up of new capacity particularly in the production of
mass consumption goods. New undertakings of up to Rs.10 million by way of fixed assets
were exempted from licensing requirements for substantial expansion of assets. This
exemption was not allowed to MRTP companies, foreign companies and existing licensed or
registered undertakings having fixed assets of Rs.50 million and above.
The Industrial Policy Statement – 1977
This Statement emphasized decentralization of industrial sector with increased role for small
scale, tiny and cottage industries. It also provided for close interaction between industrial and
agricultural sectors. Highest priority was accorded to power generation and transmission. It
expanded the list of items reserved for exclusive production in the small scale sector from
180 to more than 500. For the first time, within the small scale sector, a tiny unit was defined
as a unit with investment in machinery and equipment up to Rs.0.1 million and situated in
towns or villages with a population of less than 50,000 (as per 1971 census). Basic goods,
capital goods, high technology industries important for development of small scale and
agriculture sectors were clearly delineated for large scale sector.

9
It was also stated that foreign companies that diluted their foreign equity up to 40 per cent
under Foreign Exchange Regulation Act (FERA) 1973 were to be treated at par with the
Indian companies. The Policy Statement of 1977 also issued a list of industries where no
foreign collaboration of financial or technical nature was allowed as indigenous technology
was already available. Fully owned foreign companies were allowed only in highly export
oriented sectors or sophisticated technology areas. For all approved foreign investments,
companies were completely free to repatriate capital and remit profits, dividends, royalties,
etc. Further, in order to ensure balanced regional development, it was decided not to issue
fresh licenses for setting up new industrial units within certain limits of large metropolitan
cities (more than 1 million population) and urban areas (more than 0.5 million population).
Industrial Policy Statement – 1980
The industrial Policy Statement of 1980 placed accent on promotion of competition in the
domestic market, technological up-gradation and modernization of industries. Some of the
socio-economic objectives spelt out in the Statement were (i) optimum utilisation of installed
capacity, (ii) higher productivity, (iii) higher employment levels, (iv) removal of regional
disparities, (v) strengthening of agricultural base, (vi) promotion of export oriented industries
and (vii) consumer protection against high prices and poor quality.
Policy measures were announced to revive the efficiency of the SOEs by developing the
management cadres in functional fields, viz., operations, finance, marketing and information
system. An automatic expansion of capacity up to five per cent per annum was allowed,
particularly in the core sector and in industries with long-term export potential. Special
incentives were granted to industrial units which were engaged in industrial processes and
technologies aiming at optimum utilization of energy and the exploitation of alternative
sources of energy. In order to boost the development of small scale industries, the investment
limit was raised to Rs.2 million in small scale units and Rs.2.5 million in ancillary units. In
the case of tiny units, investment limit was raised to Rs.0.2 million.
Industrial Policy Measures during the 1980s
Policy measures initiated in the first three decades since Independence facilitated the
establishment of basic industries and building up of a broad- based infrastructure in the
country. The Seventh Five Year Plan (1985-1900), recognized the need for consolidation of
these strengths and initiating policy measures to prepare the Indian industry to respond
effectively to emerging challenges. A number of measures were initiated towards
technological and managerial modernization to improve productivity, quality and to reduce
cost of production. The public sector was freed from a number of constraints and was
provided with greater autonomy. There was some progress in the process of deregulation
during the 1980s. In 1988, all industries, excepting 26 industries specified in the negative list,
were exempted from licensing. The exemption was, however, subject to investment and
locational limitations. The automotive industry, cement, cotton spinning, food processing and
polyester filament yarn industries witnessed modernization and expanded scales of
production during the 1980s.
With a view to promote industrialization of backward areas in the country, the Government
of India announced in June, 1988 the Growth Centre Scheme under which 71 Growth Centers
were proposed to be set up throughout the country. Growth centers were to be endowed with
basic infrastructure facilities such as power, water, telecommunications and banking to
enable them to attract industries.

10
Industrial Policy Statement – 1991
The Industrial Policy Statement of 1991 stated that “the Government will continue to pursue
a sound policy framework encompassing encouragement of entrepreneurship, development
of indigenous technology through investment in research and development, bringing in new
technology, dismantling of the regulatory system, development of the capital markets and
increased competitiveness for the benefit of common man". It further added that "the spread
of industrialization to backward areas of the country will be actively promoted through
appropriate incentives, institutions and infrastructure investments”.
The objective of the Industrial Policy Statement – 1991 was to maintain sustained growth in
productivity, enhance gainful employment and achieve optimal utilization of human
resources, to attain international competitiveness, and to transform India into a major partner
and player in the global arena. Quite clearly, the focus of the policy was to unshackle
the Indian industry from bureaucratic controls. This called for a number of far-reaching
reforms:
1. A substantial modification of Industry Licensing Policy was deemed necessary
with a view to ease restraints on capacity creation; respond to emerging domestic
and global opportunities by improving productivity. Accordingly, the Policy
Statement included abolition of industrial licensing for most industries, barring a
handful of industries for reasons of security and strategic concerns, social and
environmental issues. Compulsory licensing was required only in respect of 18
industries. These included, inter-alia, coal and lignite, distillation and brewing of
alcoholic drinks, cigars and cigarettes, drugs and pharmaceuticals, white goods,
hazardous chemicals. The small scale sector continued to be reserved. Norms for
setting up industries (except for industries subject to compulsory licensing) in
cities with more than one million population were further liberalised.
2. Recognising the complementarily of domestic and foreign investment, foreign
direct investment was accorded a significant role in policy announcements of
1991. Foreign direct investment (FDI) up to 51 per cent foreign equity in high
priority industries requiring large investments and advanced technology was
permitted. Foreign equity up to 51 per cent was also allowed in trading companies
primarily engaged in export activities. These important initiatives were expected
to provide a boost to investment besides enabling access to high technology and
marketing expertise of foreign companies.
3. With a view to inject technological dynamism in the Indian industry, the
Government provided automatic approval for technological agreements related to
high priority industries and eased procedures for hiring of foreign technical
expertise.
4. Major initiatives towards restructuring of Public Sector Units (PSUs) were
initiated, in view of their low productivity, over staffing, lack of technological up-
gradation and low rate of return. In order to raise resources and ensure wider
public participation PSUs, it was decided to offer its shareholding stake to mutual
funds, financial institutions, general public and workers. Similarly, in order to
revive and rehabilitate chronically sick PSUs, it was decided to refer them to the
Board for Industrial and Financial Reconstruction (BIFR). The Policy also
provided for greater managerial autonomy to the Boards of PSUs.
5. The Industrial Policy Statement of 1991 recognized that the Government’s
intervention in investment decisions of large companies through MRTP Act had
proved to be deleterious for industrial growth. Accordingly, pre-entry scrutiny of
investment decisions of MRTP companies was abolished. The thrust of policy was

11
more on controlling unfair and restrictive trade practices. The provisions
restricting mergers, amalgamations and takeovers were also repealed.
Industrial Policy Measures Since 1991
Since 1991, industrial policy measures and procedural simplifications have been reviewed on
an ongoing basis. Presently, there are only six industries which require compulsory licensing.
Similarly, there are only three industries reserved for the public sector. Some of important
policy measures initiated since 1991 are set out below:
1. Since 1991, promotion of foreign direct investment has been an integral part of
India’s economic policy. The Government has ensured a liberal and transparent
foreign investment regime where most activities are opened to foreign investment
on automatic route without any limit on the extent of foreign ownership. FDI up to
100 per cent has also been allowed under automatic route for most manufacturing
activities in Special Economic Zones (SEZs). More recently, in 2004, the FDI
limits were raised in the private banking sector (up to 74 per cent), oil exploration
(up to 100 per cent), petroleum product marketing (up to 100 per cent), petroleum
product pipelines (up to 100 per cent), natural gas and LNG pipelines (up to 100
per cent) and printing of scientific and technical magazines, periodicals and
journals (up to 100 per cent). In February 2005, the FDI ceiling in telecom sector
in certain services was increased from 49 per cent to 74 per cent.
2. Reservation of items of manufacture exclusively in the small scale sector has been
an important tenet of industrial policy. Realizing the increased import competition
with the removal of quantitative restrictions since April 2001, the Government has
adopted a policy of de-reservation and has pruned the list of items reserved for
SSI sector gradually from 821 items as at end March 1999 to 506 items as on
April 6, 2005. Further, the Union Budget 2005-06 has proposed to de-reserve 108
items which were identified by Ministry of Small Scale Industries. The investment
limit in plant and machinery of small scale units has been raised by the
Government from time to time. To enable some of the small scale units to achieve
required economies of scale, a differential investment limit has been adopted for
them since October 2001. Presently, there are 41 reserved items which are allowed
investment limit up to Rs.50 million instead of present limit of Rs.10 million
applicable for other small scale units.
3. Equity participation up to 24 per cent of the total shareholding in small scale units
by other industrial undertakings has been allowed. The objective therein has been
to enable the small sector to access the capital market and encourage
modernization, technological up-gradation, ancillarisation, sub-contracting, etc.
4. Under the framework provided by the Competition Act 20024, the Competition
Commission of India was set up in 2003 so as to prevent practices having adverse
impact on competition in markets.
5. In an effort to mitigate regional imbalances, the Government announced a new
North-East Industrial Policy in December 1997 for promoting industrialization in
the North-Eastern region. This policy is applicable for the States of Arunachal
Pradesh, Assam, Manipur, Meghalaya, Mizoram, Nagaland and Tripura. The
Policy has provided various concessions to industrial units in the North
Eastern Region, e.g., development of industrial infrastructure, subsidies under
various schemes, excise and income-tax exemption for a period of 10 years, etc.
4 Competition Commission Act, 2003, No. 12, Competitive Commission of India, Government of India

12
North Eastern Development Finance Corporation Ltd. has been designated as the
nodal disbursing agency under the Scheme.
6. The focus of disinvestment process of PSUs has shifted from sale of minority
stakes to strategic sales. Up to December 2004, PSUs have been divested to an
extent of Rs.478 billion.
7. Apart from general policy measures, some industry specific measures have also
been initiated. For instance, Electricity Act 2003 has been enacted which
envisaged to de-license power generation and permit captive power plants. It is
also intended to facilitate private sector participation in transmission sector and
provide open access to grid sector. Various policy measures have facilitated
increased private sector participation in key infrastructure sectors such as,
telecommunication, roads and ports. Foreign equity participation up to 100 per
cent has been allowed in construction and maintenance of roads and bridges.
MRTP provisions have been relaxed to encourage private sector financing by
large firms in the highway sector.
Evidently, in the process of evolution of industrial policy in India, the Government’s
intervention has been extensive. Unlike many East Asian countries which used the State
intervention to build strong private sector industries, India opted for the State control over
key industries in the initial phase of development. In order to promote these industries the
Government not only levied high tariffs and imposed import restrictions, but also subsidized
the nationalized firms, directed investment funds to them, and controlled both land use and
many prices.
In India, there has been a consensus for long on the role of government in providing
infrastructure and maintaining stable macroeconomic policies. However, the path to be
pursued toward industrial development has evolved over time. The form of government
intervention in the development strategy needs to be chosen from the two alternatives:
‘Outward-looking development policies’ encourage not only free trade but also the free
movement of capital, workers and enterprises. By contrast, ‘inward-looking development
policies’ stress the need for one’s own style of development. India initially adopted the latter
strategy.
The advocates of import substitution in India believed that we should substitute imports with
domestic production of both consumer goods and sophisticated manufactured items while
ensuring imposition of high tariffs and quotas on imports. In the long run, these advocates
cite the benefits of greater domestic industrial diversification and the ultimate ability to
export previously protected manufactured goods, as economies of scale, low labour costs, and
the positive externalities of learning by doing cause domestic prices to become more
competitive than world prices.
However, pursuit of such a policy forced the Indian industry to have low and inferior
technology. It did not expose the industry to the rigours of competition and therefore it
resulted in low efficiency. The inferior technology and inefficient production practices
coupled with focus on traditional sectors choked further expansion of the India industry and
thereby limited its ability to expand employment opportunities. Considering these
inadequacies, the reforms currently underway aim at infusing the state of the art
technology, increasing domestic and external competition and diversification of the industrial
base so that it can expand and create additional employment opportunities.
13
In retrospect, the Industrial Policy Resolutions of 1948 and 1956 reflected the desire of the
Indian State to achieve self sufficiency in industrial production. Huge investments by the
State in heavy industries were designed to put the Indian industry on a higher long-term
growth trajectory. With limited availability of foreign exchange, the effort of the
Government was to encourage domestic production. This basic strategy guided
industrialization until the mid-1980s. Till the onset of reform process in 1991, industrial
licensing played a crucial role in channelling investments, controlling entry and expansion of
capacity in the Indian industrial sector. As such industrialization occurred in a protected
environment, which led to various distortions.
Tariffs and quantitative controls largely kept foreign competition out of the domestic market,
and most Indian manufacturers looked on exports only as a residual possibility. Little
attention was paid to ensure product quality, undertaking R&D for technological
development and achieving economies of scale. The industrial policy announced in 1991,
however, substantially dispensed with industrial licensing and facilitated foreign investment
and technology transfers, and threw open the areas hitherto reserved for the public sector.
The policy focus in the recent years has been on deregulating the Indian industry, enabling
industrial restructuring, allowing the industry freedom and flexibility in responding to market
forces and providing a business environment that facilitates and fosters overall industrial
growth. The future growth of the Indian industry as widely believed, is crucially dependent
upon improving the overall productivity of the manufacturing sector, rationalisation of the
duty structure, technological up-gradation, the search for export markets through promotional
efforts and trade agreements and creating an enabling legal environment.
This gave birth to the formulation of the second Industrial Policy Statement in 1956. The
role state was revisited and restricted to the core industry whereas both the public and the
private sectors were allowed to set up the heavy industries. The consumer goods industry
continued to be the forte of the private sector. However, the most important highlight of the
1956 second Industrial Policy Statement was a clear position taken by the State that India was
a mixed economy where both the public and the private sectors would operate and this has
continued as a permanent feature of the industrial policy resolutions of 1973, 1977 and 1980
and the most important one being that of the 1991 redefined the role of public and private
sectors in industry and significantly reduced the list of reserved industries in the ‘core sector’
which was the preserve of public sector. The ‘core sector’ of industries included atomic
energy, mineral oils, coal and lignite, mining of several minerals, aircraft, rail transport, and
ship building. The rest of the industries were left to the private sector. The Industrial Policy
Resolution of 1991 discussed in detail the policy in regard to industrial licensing, foreign
investments, foreign technology agreements, and the Monopolies and Restrictive Trade
Practices Act. The 1991 Industrial Policy Resolution abolished the industrial licensing,
except those specified, irrespective of levels of investment. The Resolution provided
approval for direct foreign investment up to 51% for equity in such industries. The
Resolution provided automatic approval for technology agreement related to high priority
industries within specified parameters. The Resolution identified priority areas for growth of
public enterprises concerning in essential infrastructure goods and services; exploration and
exploitation of oil and mineral resources; technology development and building of
manufacturing capabilities in areas which are crucial in the long term development of the
economy and where private sector investment is inadequate; manufacture of products where
strategic considerations predominate such as defence equipment. The Resolution indicated
that the pre-entry scrutiny of investment decisions by so called MRTP companies was no
longer required. Instead, emphasis was to be placed on controlling and regulating

14
monopolistic, restrictive and unfair trade practices rather than making it necessary for the
monopoly house to obtain prior approval of Central Government for expansion, establishment
of new undertakings, merger, amalgamation and takeover and appointment of certain
directors.
Between 1991 and 2013, Industrial Policy has continued liberalizing its various stands the
Foreign Direct Investment (FDI) limits have been heavily liberalized. The MRTP Act has
been replaced by the Competition Act, 2002. Many windows have been created for the
participation of private sector and global firms to work with the public sector in industries
exclusively reserved for it. The FDI limits in various sectors has been liberalised and
increased to 100 per cent excepting defence production items, etc where it is limited to 26 per
cent.

15
SECTION: II
Experiencing with SOEs with assigning public policy objectives in pursuit of
developmental goals
This section sheds light on the following questions:
(1) Why did the government rely on SOEs rather than subsidise and regulate private
enterprises?
(2) What were the main successes and failures of these approaches?
(3) How did this affect the ownership structure of the SOE sector and the governance
of individual SOEs? This section should be backed by relevant case examples
To answer these question, it is necessary to study the public enterprise policy enunciated in
the Industrial Policy Resolutions, National Common Minimum Programmes adopted by the
United Progressive Alliance Government I & II, and the various Five Year Plans, study the
performance of public enterprises and then analyse the impact of such performance on the
ownership structure of the SOE sector and on the governance of individual SOEs and backing
the various assertions by relevant case examples.
Public Enterprise Policy enunciated in the Industrial Policy Resolutions, National
Common Minimum Programmes (NCMP) and Five Year Plans:
The Industrial Policy Resolution of 1948 reserved all the ‘core industries’ for the public
sector. Both the public and private sectors were eligible to enter the ‘non-core industries’
sector. The Industrial Policy Resolution of 1956 made public sector responsible for the future
development of the industries mentioned in the Industrial Policy Resolution of 1948. It
indicated a set of industries in the second category which were to be progressively ‘state-
owned’ and the state was to take initiative to establish new undertakings, but private
enterprise was also expected to supplement to the efforts of the State. The 12 industries in
this category are given in Box 2.
Box 2: Industrial Policy and Sector
S No Plan Sector
1 Industrial Policy
Resolution, 1948
Coal, Iron &Steel, Aircraft manufacture, Shipbuilding, manufacture of
telephone, telegraph and wireless apparatus
2 Industrial Policy
Resolution, 1956
Coal, Iron &Steel, Aircraft manufacture, Shipbuilding, manufacture of
telephone, telegraph and wireless apparatus, heavy plant and
machinery, heavy electrical plants, mining and iron, machine tools,
copper processing, atomic energy, generation and distribution of
electricity
3 Industrial Policy
Resolution, 1977
Production of important strategic goods of basic nature, essential
supplies for consumer, ancillary industries, small-scale and cottage
industries,
4 Industrial Policy
Resolution, 1991
High-tech and essential infrastructure, review sick industries, MoU,
Performance improvement

16
Statement on Industrial Policy of 1991
The Statement on Industrial Policy of 1991 inter-alia included Public Sector Policy and
contained the following decisions:
“Portfolio of public sector investments will be reviewed with a view to focus the
public sector on strategic, high-tech and essential infrastructure. Whereas some
reservation for the public sector is being retained, there would be no bar for area
of exclusivity to be opened up to the private sector selectivity. Similarly, the
public sector will also be allowed entry in areas not reserved for it.
Public enterprises which are chronically sick and which are unlikely to be turned
around will, for the formulation of revival / rehabilitation schemes, be referred to
the Board for Industrial and Financial Reconstruction (BIFR), or other similar
high level institutions created for the purpose.
A social security mechanism will be created to protect the interests of workers
likely to be affected by such rehabilitation packages.
In order to raise resources and encourage wider public participation, a part of the
government’s shareholding in the public sector would be offered to mutual funds,
financial institutions, general public and workers
Board of public sector companies would be made more professional and given
greater powers.
There will be a greater thrust on performance improvement through the
Memorandum of Understanding (MoU) system through which managements
would be granted greater autonomy and will be held accountable. Technical
expertise on the part of the Government would be upgraded to make the MoU
negotiations and implementation more effective
To facilitate a fuller discussion on performance, the MoU signed between
Government and the public enterprises would be placed in Parliament. While
focusing on major management issues, this would also help place matters on day-
to-day operations of public enterprises in their correct perspective
In accordance with the decision announced in the aforesaid statement on Industrial policy, the
public sector in particular and the economy in general experienced the economic reforms.
That was the beginning of de licensing, de regulation and dismantling of inspection raj. A
programme of partial disinvestments of Government equity in selected Public Sector
Enterprises was started. In order to encourage wider participation and promote greater
accountability, the Government equity in selected SOEs was offered to Mutual funds,
financial institutions, workers and the general public. The areas reserved for the public sector
were opened up for the private sector and budgetary support was significantly reduced for the
public sector.
National Common Minimum Programme (NCMP)
The present Government policy towards Public Sector Enterprises as contained in the
National Common Minimum Programme (NCMP), were as under:
1. To devolve full managerial and commercial autonomy to successful, profit-
making companies operating in a competitive environment
2. Profit-making companies will not be privatized
3. Every effort will be made to modernize and restructure sick public sector
companies and revive sick industry
4. Chronically loss-making companies will either be sold-off, or closed, after all
workers have got their legitimate dues and compensation.

17
5. Private industry will be inducted to turn-around companies that have potential for
revival.
6. Privatization revenues will be used for designated social sector schemes
7. Public sector companies will be encouraged to enter the capital market to raise
resources and offer new investment avenues to retail investors.
Public Enterprise Policy enunciated in Five Year Plans
First Five Year Plan: The plan presented to the government by the Planning Commission in
December 1952, indicated the need for “a rapid expansion of the economic and social
responsibilities of the state” to satisfy the “legitimate expectations of the people”. It however
stated that this “need not involve complete nationalization of the means of production or
elimination of private agencies in agriculture or business and industry.” Only a “progressive
widening of the public sector and a re-orientation of the private sector to the needs of planned
economy” was envisaged. The plan idealised by stating that “the concept of private
enterprise, as indeed, of private property, is undergoing rapid change, and the view that
private enterprise can function only on the basis of unregulated profits is already an
anachronism.” It was also stated that “the private and the public sectors cannot be looked
upon anything like two separate entities; they are and must function as parts of a single
organism.”
Second Five Year Plan (1956-61): Like the first plan, it was pointed out that the two sectors
would have “to function in unison” and were to be “viewed as parts of a single mechanism.”
It was also stated that the plan could “go through only on the basis of simultaneous and
balanced development in the two sectors.” In the words of the plan: “It is appropriate to think
more and more in terms of an interpenetration of the public and private sectors rather than of
two separate sectors.”
The plan document made it clear that expansion of the public sector should not “mean
centralisation of decision-making and of exercise of authority. The aim should be to secure
an appropriate devolution of function and to ensure to public enterprises the fullest freedom
to operate within a framework of broad directives or rules of the game.”
Third Five Year Plan (1961-66): According to this plan, an important purpose to be served
by the public sector was to prevent concentration of economic power and growth of
monopolistic tendencies. The public sector with its growing strength in the economy was also
to be used “to determine the character and functioning of the economy as a whole.” This plan
expected that “an expanding public sector, engaged specially in developing basic industries
and producing large surpluses for development will itself be one of the most important factors
determining the rate at which the economy can grow.”
Fourth Five Year Plan (1969-74): The plan envisaged that the public sector would be “the
dominant and effective area of the economy” and “take charge more and more of the
commanding heights in the production and distribution of basic consumer goods.” It
reiterated that the private sector will function within the framework of national planning and
in harmony with its overall aims, and with understanding of its obligations towards the
community as a whole. Thus, the hope of the private sector being imbued with public purpose
continued in this plan.
Fifth and sixth Five Year Plans (1974-79 and 1980-85): The plans seem to have no
significant pronouncement regarding PE policy, except that the latter plan envisaged SOEs to

18
steer the distribution of essential commodities and provision of infrastructure facilities for
low income people.
Seventh Five Year Plan (1985-90): This plan justified private enterprise growth by stating
that the industrial economy visualised in the Industrial Policy Resolution of 1956 is
characterised by a “symbiotic and complementary relationship between the public and private
sector.” This, however, hides the important fact that the 1956 Resolution aimed at PE
operating as a dominant and pervasive force and the private sector was only to complement
and supplement it. The plan document de-emphasised PE when it observed that the stress
“should be on consolidation, improvement and modernisation rather than on large expansion
of capacity, except when it is imperative.”
Eighth Five Year Plan (1992-97): This plan was for “managing the transition from centrally
planned economy to market led economy.” The plan aimed to “roll back” the public sector
investment from those sectors of the economy where the private sector could move in. The
problems afflicting SOEs in strategic, high-tech and essential infrastructure were to be
“squarely addressed with a view to making this sector strong and dynamic.”
Ninth Five Year Plan (1997-2002): The plan stated the Vajpayee government’s policy that
there was “no particular reason why the government should retain a majority equity stake
except for those (SOEs) that are in the strategic areas where national security is involved”.
For all other SOEs, the government “will dilute its holding to 26% as early as possible”. The
plan hoped that reduction in government’s equity holding will result in the removal of
interference and provide SOEs “the corporate freedom they need to function efficiently in a
competitive market.”
Tenth Five Year Plan (2002-2007) : The plan stated : “The public sector is much less
dominant than it used to be in many critical sectors and its relative position is likely to
decline further as Government ownership in many existing public sector organisations is
expected to decline substantially. It is clear that industrial growth in future will depend
largely upon the performance of the private sector and our policies must therefore provide an
environment which is conducive to such growth.” The plan envisaged that “the policy of
disinvestment of public enterprises, should be pursued so as to enable the realization of
Rs.16, 000 crore per annum, to finance the plan.”
Eleventh Five Year Plan (2007-2012): The Approach Paper to XI envisaged greater
autonomy, delegation of more powers to PE boards, freedom from informal levels of control
exercised by the administrative ministries, and a clear statement from the government on
future ownership of SOEs. The document states: “If these conditions are met, SOEs do not
need to be supported by measures such as administered prices, or price or purchase
preference in government purchases or any type of de jure or de facto favourable treatment
vis-à-vis the private sector.”
Twelfth Five Year Plan (2012-17) : The XII Plan envisages public enterprises to be on there
own, approaching capital markets for garnering funding, becoming competitive, upgrading
technologies, partnering with private sector, internationalizing their operations, going in for
inorganic growth through mergers and acquisitions, and yielding money to the State though
disinvestments.
To summarize, the SOEs were preferred to private enterprises to achieve the goals of public
policy for the following reasons:

19
1. State Control: In the strategic and core sectors of industry, the government
wanted to keep the ownership and control its hands.
2. Constitutional Provisions: The preamble of the Constitution of India envisages
India as a ‘socialist’ republic, and its article 39(b) and (c) directs the state to
secure “that the ownership and control of the material resources of the community
are so distributed as best to sub serve the common good” and “that the operation
of the economic system does not result in the concentration of wealth and means
of production to the common detriment”. According to article 38, “The state
shall strive to promote the welfare of the people by securing and protecting as
effectively as it may, a social order in which justice, social, economic and political
shall inform all the institutions of the national life.” Thus, publicly owned
financial, commercial, industrial, developmental, promotional and welfare
institutions become relevant and have played an important role in the economy.
3. Establishment of a socialist society: Since 1955, India resolved to establish a
socialist pattern of society in India. The private sector was to play an effective role
in it, no doubt. Yet basic, key and strategic industries which were of vital
importance for the economic regeneration of the country, were entrusted to the
public sector. Gradually, insurance, banking, finance and many other sectors
which were considered vital for the promotion of socialist objectives in the
country were brought under the public sector. Thus on ideological ground "the
increasing participation of the state in industrial and commercial enterprises is
inevitable, irresistible and compulsive."
4. Policy of economic planning: After independence India adopted the planned
path to economic development. Under the Five-Year Plan certain objectives were
laid down. Targets were fixed. It was considered that public sector enterprises
would serve as an effective tool for a better and rapid implementation of planned
programmes. The public sector is more suitable to achieve the national goals and
priorities than the private-sector.
5. Industrial policy resolutions: The Industrial Policy Resolutions of 1948 and
1956 also laid the foundation of a mixed economy, where the public and private
sectors were to coexist. The 1980 Industrial Policy also emphasized upon the
active and dynamic role of the public sector.
6. Development of the infrastructure: India’s colonial past had hindered
comprehensive development of infrastructure, so vitally essential for economic
development. Development of infrastructure such as roads, railways,
telecommunications, bridges, power, water supply, irrigation, etc., can be properly
developed only when the state steps in. Today in many developing countries, such
as Brazil, Mexico, Ethiopia, Sri Lanka, etc., a sizable section of power generation,
transport and communication and irrigation systems belong to the public sector.
For example, in India, Nigeria, Ghana, etc., more than 90 per cent electricity
generation is done by the public sector.
7. Long gestation period: There are certain basic and heavy industries which are
highly capital intensive. Such undertakings may give rise to returns after a long
period. Take the case of steel, fertilizers, chemicals, aluminium, etc. The private
sector may not be in a position to wait for a long period. Besides, such industries
enjoy a sort of semi-monopolistic position in the economy. Development of
private monopoly in such basic industrial activity is not a very rational step.
Public sector is justified in this case.
8. Risky enterprises: Besides, private entrepreneurs may be shy to come forward
for certain activities where the elements of risk and uncertainty are too high. For

20
instance, take the case of the exploration of oil and natural gas, generation of
atomic energy, etc. Private enterprise is dominated by short-sighted calculation of
cost and profit. It cannot view the social needs from an aggregative point of view.
Such activities also have to be assumed by the state itself.
9. Foreign collaboration: If an industry calls for external aid and Foreign
collaboration, then also an enterprise in the public sector is in a favourable
position. It can more easily assure a guaranteed return to the foreign participant.
Besides, the countries of the socialist bloc prefer to render technical and financial
assistance to the public enterprises.
10. Removal of regional disparities: Public enterprises may be used as a tool for
reducing regional disparities in economic development. In India certain states like
Orissa, Rajasthan, Madhya Pradesh, etc., are comparatively more backward.
Through central government initiative public sector projects may be sponsored in
such areas. Public sector financial institutions may play a central role in
promoting industrial and commercial activities in these backward regions.
11. Reduction of economic inequalities: Extension of the public sector is also
justified on the ground that it can serve as an effective means for dealing with the
problem of wide economic inequalities. If profits are earned by public enterprises,
such profits can be further diverted for general welfare. Such profits, again, do not
lead to private enrichment. Such enterprises can create employment opportunities
for the poor unemployed. They also act as model employers and improve the
incomes of the employees. Thus the setting up of public enterprises is likely to
have a favourable redistributive effect on income and wealth in the society.
Performance of SOEs
The performance of SOEs could be studied in terms of financial and non-financial
parameters. Table 1 depicts the share of SOEs to the domestic output in key sectors of the
economy. It is seen that the SOEs form the backbone of important production items such as
coal, petroleum products, nuclear power generation and telecommunication services through
wired lines.
Table 1: Share of SOEs to the Domestic Output in Key Sectors for the year 2010-11
S No Selected Item Units Domestic
Production / Output
Total output
by SOEs
Share of SOEs to
Domestic Output (%)
1 Coal
1.1 Hard Coal (Non
Coking Coal)
Million Tones 483.543 390.219 80.7
1.2 Coking Coal Million Tones 49.533 42.496 85.8
2 Petroleum Products
2..1 Crude Oil MMT 37.68 27.9 74
2.2 Natural Gas BCM 52.22 25.45 48.7
2.3 Refineries
Throughput
MMT 196.5 115.1 58.5
3 Power Generation
3.1 Thermal GWh 665008 273775 41.2
3.2 Hydro GWh 114257 46049 40.3
3.3 Nuclear GWh 26266 26266 100

21
4 Telecommunication
Services
4.1 Wired Lines Nos. (in Cr) 3.47 2.87 82.7
4.2 Wire Less Nos. (in Cr) 81.16 9.73 11.99
5 Fertilizers
5.1 Nitrogenous Lakh MT 121.57 31.67 26.05
5.2 Phosphotic Lakh MT 4.23 2.27 5.37
Source: Public Enterprise Survey 2012-13, Department of Public Enterprise, GoI Vol 1
Table 2 provides the macro view of financial performance of SOEs in India during 2006-07
and 2012-13. The table shows that 277 SOEs had a paid up capital of Rs 1,85,282 crore in
2013. The total investment during this period stood at Rs 8,50,599 crore. The total turnover
of these enterprises during this period was Rs 19,45,777 crore. The overall net profit earned
by the SOEs was Rs 1,15,300 crore. The sales to capital employed ratio for SOEs was
128.83 per cent in 2012-13. The net profit to capital employed ratio during this period was
7.63 per cent. The net profit to turnover ratio stood at 5.93 percent. The dividend payout ratio
was 43.11 per cent. The interest to gross profit ratio was 19.86 per cent
Table 2: Macro Financial Profile of SOEs (Rs in crore)
Year / Parameters 2006-07 2012-13
Operating enterprises (in numbers) 217 229
Capital Employed 661338 1510373
Turnover 964890 1945777
Total income 970356 1931149
Net worth 454134 851245
Depreciation 33141 66117
Interest 27481 37789
Tax provisions 34352 51008
Profit of profit making SOEs 89581 143559
Loss of Loss Making SOEs 8526 28260
Profit Making SOEs No. 154 149
Loss Making SOEs Nos. 61 79
Dividend 26819 49701
Dividend tax 4107 6703
Sales to Capital Employed Ratio 145 128
Net Profit to Turnover Ratio 8 6
Net Profit to Capital Employed Ratio 12 7
Dividend Payout Ratio 33 43
Interest to Gross Profit Ratio 20 19
Source: Public Enterprise Survey 2012-13, Department of Public Enterprise, GoI Vol 1
It is interesting to note that during the economic liberalisation regime, much against the
popular public perception, the SOEs have performed admirably well. Their profitability ratios

22
have registered an upward trend and sectoral performance has phenomenally improved
especially in oil and natural gas, mining and steel and electricity generation sector. The
number of loss making SOEs has declined steeply whereas the number of profit making
enterprises has gone up significantly. SOEs have become a formidable source of non-tax
revenue for the State. The dividend payout ratio has varied in the region of 25-50 per cent.
The turnover of SOEs is increasing year-on-year (YOY) at a rate of 15 per cent.
Although there is a significant financial improvement in the performance of the SOEs, there
have been contradictory claims comparing public sector profitability with private sector
underlining the low trend of profitability in the case of the former5 as shown in the figure 1
and figure 2.
5 Mishra, R. K, Performance of Public Enterprises in the Era of Economic Liberalization, Pauperizing
Masses, Alternative Economic Survey, 2006-07, Daanish Books, New Delhi

23
Fig 1: Return on Sales of Private Firms and SOEs: 1992-2005
Source: Suryanarayan, Pavithra, Network on Corporate Governance of State-Owned Enterprises in Asia, A
presentation made in the OECD Conference on Corporate Governance 25-26 June 2008, New Delhi
Fig 2: Annual Sales Growth Rates: 1992-2005
Source: Suryanarayan, Pavithra, Network on Corporate Governance of State-Owned Enterprises in Asia, A
presentation made in the OECD Conference on Corporate Governance 25-26 June 2008, New Delhi)
-7
-6
-5
-4
-3
-2
-1
0
1
2
1992 1993 1994 1995 1996 1997 1998 1999 2000 2001 2002 2003 2004 2005
Private
Cos SOEs
-0.1
-0.05
0
0.05
0.1
0.15
0.2
0.25
0.3
0.35
1993 1994 1995 1996 1997 1998 1999 2000 2001 2002 2003 2004 2005
Private Cos
SOEs
s
24
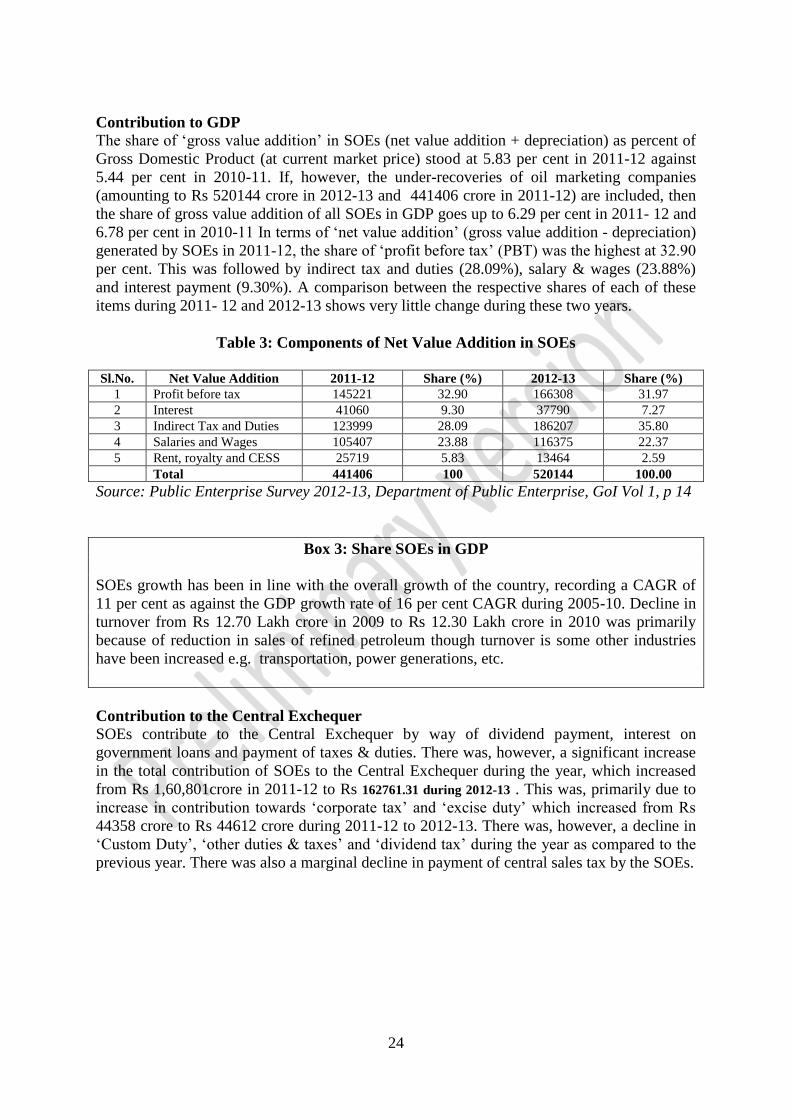
Contribution to GDP
The share of ‘gross value addition’ in SOEs (net value addition + depreciation) as percent of
Gross Domestic Product (at current market price) stood at 5.83 per cent in 2011-12 against
5.44 per cent in 2010-11. If, however, the under-recoveries of oil marketing companies
(amounting to Rs 520144 crore in 2012-13 and 441406 crore in 2011-12) are included, then
the share of gross value addition of all SOEs in GDP goes up to 6.29 per cent in 2011- 12 and
6.78 per cent in 2010-11 In terms of ‘net value addition’ (gross value addition - depreciation)
generated by SOEs in 2011-12, the share of ‘profit before tax’ (PBT) was the highest at 32.90
per cent. This was followed by indirect tax and duties (28.09%), salary & wages (23.88%)
and interest payment (9.30%). A comparison between the respective shares of each of these
items during 2011- 12 and 2012-13 shows very little change during these two years.
Table 3: Components of Net Value Addition in SOEs
Sl.No. Net Value Addition 2011-12 Share (%) 2012-13 Share (%)
1 Profit before tax 145221 32.90 166308 31.97
2 Interest 41060 9.30 37790 7.27
3 Indirect Tax and Duties 123999 28.09 186207 35.80
4 Salaries and Wages 105407 23.88 116375 22.37
5 Rent, royalty and CESS 25719 5.83 13464 2.59
Total 441406 100 520144 100.00
Source: Public Enterprise Survey 2012-13, Department of Public Enterprise, GoI Vol 1, p 14
Box 3: Share SOEs in GDP
SOEs growth has been in line with the overall growth of the country, recording a CAGR of
11 per cent as against the GDP growth rate of 16 per cent CAGR during 2005-10. Decline in
turnover from Rs 12.70 Lakh crore in 2009 to Rs 12.30 Lakh crore in 2010 was primarily
because of reduction in sales of refined petroleum though turnover is some other industries
have been increased e.g. transportation, power generations, etc.
Contribution to the Central Exchequer
SOEs contribute to the Central Exchequer by way of dividend payment, interest on
government loans and payment of taxes & duties. There was, however, a significant increase
in the total contribution of SOEs to the Central Exchequer during the year, which increased
from Rs 1,60,801crore in 2011-12 to Rs 162761.31 during 2012-13 . This was, primarily due to
increase in contribution towards ‘corporate tax’ and ‘excise duty’ which increased from Rs
44358 crore to Rs 44612 crore during 2011-12 to 2012-13. There was, however, a decline in
‘Custom Duty’, ‘other duties & taxes’ and ‘dividend tax’ during the year as compared to the
previous year. There was also a marginal decline in payment of central sales tax by the SOEs.

25
Table 4: Contribution to Exchequer
S No Particulars 2011-12 2012-13 Growth in
%
1 On investment by Central Govt in PSUs
A. Dividend 28502.39 28864.38 1.19
B. Interest 282.68 795.43 -60.64
Total (1) 28787.07 29659.81 30.04
2 Taxes & Duties
A. Excise Duty 61165.14 59413.66 -2.86
B. Custom Duty 11518.43 6072.62 -47.28
C. Corporate Tax 44358.47 44612.48 0.95
D. Dividend Tax 6093.33 6470.41 6.08
E. Sales Tax 2234.09 2796.49 25.17
F. Service Tax 3249.71 5586.71 71.77
Other Duties & Taxes 3394.57 8149.13 140.77
Total (2) 132013.74 133101.50 0.94
3 Total contributions (1+2) 160800.81 162761.31 0.22
Source: Public Enterprise Survey 2012-13, Department of Public Enterprise, GoI Vol 1, p 15
Removal of Regional Disparities:
The SOEs have made great strides in regard to removal of regional disparities which have
hampered the uniform growth of different regions in India. One-third of the total districts in
India have been classified as backward districts. The private sector has not made any
overtures since independence to make its presence widely felt in such areas. However,
whatever little presence of private sector is there in such districts, it is not due to their
development commitment but on account of the tax concessions offered by the government.
The state wise distribution of ‘gross block’ shows a significant change over the years (Table
2.9) a comparison of percent age share of different states over the years shows that whereas
the state of Bihar (21.91 percent) M.P. (13.04 percent) , West Bengal (6.71) percent and
Orissa (5.65 percent ) claimed the largest share in investment until 1977, it is now (2012-13)
the state of Maharashtra (18.35 percent), Andhra Pradesh (7.37 percent), Tamilnadu (7.17
percent) , U.P. (6.55 percent) hold rank number 1,2,3 and 4 respectively , Orissa (5.28
percent) and West Bengal (5.16 percent ) in terms of investment held 5th
and 6th
place during
the year 2012-13. These changes, in good measure, have occurred mainly on account of
higher investments in oil explorations (e.g. Mumbai High, power project and
telecommunications vis-à-vis investments in steel, heavy engineering and coal mining made
in the earlier years, some like differences have also occurred due to bifurcation of state like
Bihar into Bihar and Jharkhand , Madhya Pradesh in Madhya Pradesh and Chhattisgarh and
Uttar Pradesh into Uttar Pradesh and Uttrakhand as well as closing down of some CPSEs and
conversion of other CPSE in to Joint Ventures with private companies. In absolute terms,
however, there has generally been increase in investments in most states.

26
Table 5: State-wise Distribution of ‘Gross Block’
S
No
State / Union
Territory
Gross Block (Rs in Crore) % share in total gross block
1977 1987 1997 2013 1977 1987 1997 2013
1. Andhra Pradesh 390.70 6761.52 19486.16 1122825.61 3.41 9.94 6.85 7.37
2. Arunachal Pradesh - - 1489.20 11104.80 0.00 0.00 0.52 0.73
3. Assam 312.90 3808.72 12448.89 63602.15 2.73 5.60 4.38 4.16
4. Bihar 2509.10 6969.2 19982.51 43298.69 21.91 10.24 7.03 2.83
5. Chhattisgarh 49964.85 - - 60498.93 3.64 3.95
6. Delhi 400.70 1928.48 15014.81 68679.98 3.50 2.83 5.28 4.49
7. Goa 3.30 35.27 144.57 1618.06 0.03 0.05 0.05 0.10
8. Gujarat 523.40 3197.79 20092.87 69922.70 4.57 4.70 7.07 5.57
9. Haryana 142.70 649.69 4352.25 44854.43 1.25 0.95 1.53 2.93
10. Himachal Pradesh 11.80 527.43 4720.54 34436.74 0.10 0.78 1.66 2.25
11. Jammu & Kashmir 5.70 117.84 6413.36 21531.30 0.05 0.17 2.26 1.41
12. Jharkhand - - - 36921.16 - - - 2.41
13. Karnataka 268.20 1721.52 6439.48 51629.75 2.34 2.53 2.26 3.37
14. Kerala 274.10 1074.44 3991.76 31460.19 2.39 1.58 1.40 2.06
15. Madhya Pradesh 1492.70 8571.69 21503.52 64929.56 13.04 12.60 7.56 4.24
16. Maharashtra 630.30 10905.09 54854.07 280948.44 5.50 16.02 19.29 18.35
17. Manipur - 139.68 148.31 468.82 0.00 0.21 0.05 0.03
18. Meghalaya - 4.27 53.43 333.80 0.00 0.01 0.02 0.02
19. Mizoram - - 30.03 - - - 0.01 0.05
20. Nagaland - 78.17 465.36 1183.68 0.00 0.11 0.16 0.07
21. Orissa 646.50 4637.65 17101.40 80811.28 5.65 6.81 6.01 5.28
22. Punjab 197.80 641.02 2077.85 15800.18 1.73 0.94 0.73 1.03
23. Rajasthan 227.10 780.95 6065.94 31887.35 1.98 1.15 2.13 2.08
24. Sikkim 0.55 241.13 3704.81 3956.67 0.00 0.08 0.27 0.26
25. Tamil Nadu 466.90 3018.82 13539.28 109738.08 4.08 4.44 4.76 7.17
26. Tripura 160.83 830.54 4185.58 4860.76 0.24 0.29 0.30 0.32
27. Uttar Pradesh 376.20 3913.96 20767.92 100320.42 3.29 5.75 7.30 6.55
28. Uttaranchal - - - 23215.33 - - - 1.52
29. West Bengal 768.30 4524.94 18677.33 78906.86 6.71 6.65 6.57 5.16
30. Andaman & Nicobar
Islands
- 9.89 27.10 2581.75 0.00 0.01 0.01 0.17
31. Chandigarh - 4.06 289.30 504.66 0.00 0.01 0.10 0.03
32. Pondicherry - 8.53 30.40 333.41 15.74 0.01 0.01 0.02
33. Others and
unallocated
1802.80 3859.87 13082.21 76877.37 100.00 5.67 4.60 5.02
a. Total 11451.20 68051.8 284361.52 1530744.97 100.00 100.00 100.00 100.00

27
Source: Public Enterprise Survey 2011-12, Department of Public Enterprise, GoI Vol 1
Employment Generation
The SOEs have taken lead in generating productive employment in India which has been a
major problem facing the economy. Further, the SOEs have also provided contract
employment and the contract employees happen to be one-third of the regular workforce. As
a model employer, the salaries and perquisites of the SOE employees far exceed the salaries
and perquisites of their counter parts in the private sector. This is discerned in Table 6A and
6B
Table 6A: Total Employees and Per Capita Emoluments
Year Employees (Nos in lakh) Total Emoluments (in Crore) Per Capita Emoluments
(INR)
2006-07 16.14 52586 325869
2007-08 15.65 64306 410898
2008-09 15.33 83045 541716
2009-10 14.90 87792 589210
2010-11 14.40 98402 683347
2011-12 13.98 105407 753984
2012- 13 14.04 116375 828882
Source: Public Enterprise Survey 2011-12, Department of Public Enterprise, GoI Vol 1, p 16
Table 6B: Group-wise percentage of Employees
Category Group ‘A’ & ‘B’ Group ‘C’ Group ‘D’
Scheduled castes 15% 15% 15%
Scheduled tribes 7.5% 7.5% 7.5%
Other backward classes 27% 27% 27%
Physically handicapped persons 3% 3% 3%
Ex – servicemen & dependents of those
killed in action
- 14.5% 24.5%
Source: Public Enterprise Survey 2011-12, Department of Public Enterprise, GoI Vol 1, p 106
To enforce equity and social justice, the SOEs have taken a special care of providing
employment to the socially and economically backward communities in India by reserving
quota varying from 53 per cent to 77 per cent in various groups of SOEs.
Memorandum of Understanding (MoU)
The MoU, patterned on the French Model and Korean Models of evaluating the performance
of an enterprise based on the vision and mission, objectives, targets and performance score on
the part of enterprise and the obligations of the Government to the enterprise, was introduced
as a performance evaluation measure in the SOEs in the year 1986-87 in four enterprises.
During 1991-92, as a part of economic liberalization policy, the Government decided to
extend the MoU system to as many SOEs as possible which resulted in 195 signing MoU

28
with the Government during 2011-12. The introduction of MoU has given an opportunity
both to the Government and SOEs to negotiate certain measure of performance and compare
the ex-post performance with the ex-ante performance. Most of the MoU signing enterprises
have shown a great deal of appreciation for the MoU system which distinguishes the
managerial performance in CPSE with the enterprise performance. The MoU system also
presents an objective solution to the problem of conflicting interests of principals with the
agent. The Arjun Sengupta generation of MoUs has undergone changes with the current
generation of MoUs based on the scrutiny of the Cabinet Secretariat of the expert committee
report prepared by the National Council of Applied Economic Research. The revised system
relies more on dynamic indicators as compared to the static indicators that formed the base of
the first generation MoUs6. Table below shows the rankings of MoUs and the number of
enterprises signing MoUs with the government
Table 7: MoU Entered by SOEs between 2008-09 to 2012-13
Particulars 2008-09 2009-10 2010-11 2011-12 2012-13
Excellent 47 74 67 76 75
Very Good 34 30 44 39 39
Good 25 0 24 33 38
Fair 17 20 24 25 36
Poor 01 01 02 0 02
No of Enterprise entered MoU 125 145 161 175 190
Box 4: Revamping MoUs
MoU system was revamped in 2004-05 with the Nation Council of Applied Economic
Research (NCAER) recommendations. Equal weights (50%) to both ‘financial’ and ‘non-
financial’ parameters were assigned following the Balanced Scorecard approach. Financial
parameters presented in absolute values as well as ratios, while non-financial parameters
further divided into dynamic parameters, enterprise-specific parameters and sector-specific
parameters. Another set of changes were brought about in 2008 with the recommendations of
Ashok Chandra Committee. It suggested that target setting process in an enterprise must be
based on its past 5 year performance record. Focus was provided on the working of Task
Force and its strengthened role. Based on the Management Development Institute’s report,
sector specific formats for MoUs were developed - (Manufacturing and Mining Sectors,
Trading and Consulting Sectors, Social Sector, Financial Sector and Sick enterprises). Two
additional enterprise specific parameters were introduced like physical production,
globalization, capital expenditure, expansion plans, economy measures to cut costs etc) of 10
marks each against the 10 marks meant for enterprise specific variations Source: Public Enterprise Survey 2011-12, Department of Public Enterprise, GoI
Government Disinvestment in SOEs
Disinvestment of minority shares in SOEs has become an important source of raising
resource for the Government. The policy of ‘disinvestment’ in SOEs has evolved over the
years. Disinvestment of government equity in SOEs began in 1991-92 following the
Industrial Policy Statement of 1991, which stated that the Government would divest part of
its holdings (minority share-holding) in select SOEs. During 2013-14, a target of Rs 40,000
6 Report of the Committee on MoU System - 2012 (Mankad Committee Report), Department of Public
Enterprise, Government of India

29
crore has been fixed for disinvestment from the SOEs. Annexure 2 provides details of the
targeted and actual proceeds from disinvestment from SOEs during 1992-2013.
Limitations of SOEs
Governance Challenges: One of the major challenges faced by SOEs is to continuously
reinvent themselves as organisations of relevance in the changing scenario and to develop a
shared vision and objective in synch with the national priorities and goals. SOEs operate in a
highly competitive environment and face immense challenges in terms of accountability and
oversight by multiple authorities, outdated processes and lack of new technology, weak
internal controls marring the corporate governance practices, working in silos, mindset issues
and lack of motivation in employees to excel.
Box 5: Governance Highlight
There is a widely held connotation that its difficult for any organisation to sustain and grow if
they lack proper governance structure. The same holds good for public sector enterprise. If
several reporting agencies exist with their own specific agendas that may be conflicting with
the objectives of the enterprise, the efficiency of the enterprise is likely to get impaired. Thus,
many SOEs have reorganised their governance structure to bring about ‘ownership
management’
Source: Report on Public Enterprises, KPMG, 2011, p 16
Absence of Clear Ownership: SOEs face a typical challenge as a government owned
organisation which are yet to see a clear cut demarcation between ownership and
management. As a consequence, there is a frequent interference of the government in the
working of these entities and enterprises not functioning as Board managed organisations.
This leads to slow and poor decision making and bureaucratisation of SOEs.
Poor Project Planning: Investment decisions in many SOEs are not based upon proper
evaluation of demand and supply, cost benefit analysis and technical feasibility. Lack of a
precise criterion an flaws in planning have caused undue delays and inflated costs in the
commissioning of projects. Sometimes, projects are launched without clear-cut objectives an
serious thought. Many projects in the public sector have not been finished according to the
time schedule. Barauni Refinery was commissioned two years behind schedule and the
Tromby fertilizer plant was delayed by three years thereby causing an increase of Rs. 13
crore in the original cost estimates.
Over-capitalization: Due to inefficient financial planning, lack of effective financial control
and easy availability of money from the government, several public enterprises suffer from
over-capitalization The Administrative Reforms Commission found that Hindustan
Aeronautics, Heavy Engineering Corporation and Indian Drugs and Pharmaceuticals Ltd.
Were over-capitalized. Such over-capitalization resulted in high capital-output ratio an
wastage of scare capital resources.
Excessive Overheads: SOEs incur heavy expenditure on social on overheads like townships,
schools, hospitals, etc. In many cases such establishment expenditure amounted to 10 percent
of the total project cost. Recurring expenditure is required for the maintenance of such
overhead and welfare facilities. Hindustan Steel alone incurred an outlay of Rs. 78.2 crore on

30
townships. Such amenities may be desirable but the expenditure on them should not be
unreasonably high.
Overstaffing: Manpower planning is not effective due to which several public enterprises
like Bhilai Steel have excess manpower. Recruitment is not based on sound labour
projections. On the other hand, posts of Chief Executives remain unfilled for years despite the
availability of required personnel. As many as 26 public sector units were top[less on January
1, 1987.
Under-utilisation of Capacity: One serious problem of the public sector has been low
utilisation of installed capacity. In the absence of definite targets of production, effective
production planning and control, proper assessment of future needs, adequate supply of
power and industrial peace, many industrial peace, many undertakings have failed to make
full use of their fixed assets. The average capacity utilisation in more than 5p per cent of the
public enterprises has been less than 75 per cent. There is considerable idle capacity. In some
cases productivity is low on account of poor materials management or ineffective inventory
control.
Lack of a Proper Price Policy: There is no clear-cut price policy for public enterprises and
the Government has not laid down guidelines for the rate of return to be earned by different
undertakings. Public enterprises are expected to achieve various socioeconomic objectives
and in the absence of a clear directive, pricing decisions are not always based on rational
analysis. In addition to dogmatic price policy, there is lack of cost-consciousness, quality
consciousness, and effective control on waste and efficiency.
Inefficient Management: The management of public enterprises in our country leaves much
to be desired. Managerial efficiency an effectiveness have been low due to inept
management, uninspiring leadership, too much centralisation, frequent transfers and lack of
personal stake. Civil servants who are deputed to manage the enterprises often lack proper
training an use bureaucratic practices. Political interference in day-to-day affairs, rlgid
bureaucratic control and ineffective delegation of authority hamper initiative, flexibility and
quick decisions. Motivations and morale of both executives and workers are low due to the
lack of appropriate incentives.
Unsatisfactory industrial Relations: In several public enterprises relations between
management and labour are far from cordial. There has been serious and frequent labour
trouble in Durgapur steel. Plant, Bharat Heavy Electrical, Bhopal, and in Bangalore-based
undertakings. Millions of mandays and output worth crores of rupees have been lost due to
strikes and gheraos. Wage disparities have been the main cause of labour trouble in the public
sector. The percentage increase in the per cent emoluments of public sector employees had
been higher than the percentage increase in consumer price index.
Lack of Coordination: Various public enterprises are dependent on one another as the
output of one enterprise is the input of another. For instance, the efficient functioning of
power and steel plants depends on the production and transportation of coal which n turn is
dependent upon supplies of heavy equipment machinery. Despite such interdependence,
materials management and research has not been achieved. A coordination in the production
programmes of different enterprises at various stages would help to reduce excess stocks and
shortages of vital inputs.
31
Impact on Ownership Structure of the SOEs Sector and the Governance of Individual
SOEs: The continuing limitations of SOEs have created conditions for the government to
initiate some radical changes to enable them to function as business entities manned by
professionals of competence. Some of the major initiatives in this regard are described below:
Corporate Governance Standards: The government has imposed on itself the CG code
formulated by the Securities and Exchange Board of India (SEBI)7 in currency for the listed
companies. As per section 49 of the Listing Agreement of the SEBI, the listed SOEs have to
have 50 per cent of independent directors as board members to enrich the strategy,
formulation and implementation. The SEBI guidelines also make it mandatory on such
enterprises to appoint the audit committee, and nominations and remuneration committee.
The onus of disclosure of certain financial information is also such SOEs. The Companies
Act, 2013 has made it obligatory on the SOEs to spend 2 % of their average profits for the
last three consecutive years or explain as to why they could not adhere to this mandate. The
SOEs now have to give a full-fledged and special treatment to the disclosure of the related-
party transaction. The relationship between the holding company and its subsidiaries in terms
of financial transaction has also to be disclosed fully and the any loan giving by the holding
company to the subsidies stands completely bard.
Box 6 : Important highlights on Board’s Role in SOEs from Companies Act, 2013
Disclosures in the Directors’ Responsibility Statement by all companies
The boards would now have to articulate their policy on directors’ appointment and
remuneration [Sec.178(4)]
The boards would have to explain if there are any qualifications in the secretarial audit
report [Sec. 134(3)]
The boards would have to lay down its policies for regulatory compliance and risk
management and ensure these are operating effectively [Sec. 134(3)]
The boards would have to devise proper systems to ensure compliance with the
provisions of all applicable laws and that such systems were adequate and operating
effectively [Sec. 134(5)]
The boards have to make annual assessment of the internal financial controls and may
consider getting an independent expert assurance on such systems
The boards would have to lay down the manner of formal evaluation of performance of
the board, its committees and individual directors for listed and public companies. Source: Companies Act 2013, Ministry of Corporate Affairs, Government of India
Shareholding pattern: The shareholding patter of the SOEs, especially the profitable ones,
has undergone a fundamental transformation in the sense that in the case of 40 large SOEs the
government shareholdings have reduced from 100 per cent to 52 per cent8. A ‘government
enterprise’ is one which has a shareholding of 51 per cent or more of the central government,
state government or by both. As per Article 211 of the Indian Constitution, the Government
cannot reduce its shareholdings below 51 per cent in these enterprises. The impact of
reduction in the shareholding has been found some what positive.
Accountability: The SOEs have been made more accountable for their performance through
greater delegation of financial powers. The SOEs have been divided into four categories viz.
7 Report of Panel of Experts on Reforms in Central Public Sector Enterprises (CPSEs) (Roongta Committee
Report), Ministry of Corporate Affairs, Government of India, pp 9-16 8 www.bsepsu.com/list-cpse.asp

32
Maharatna, Navratna, Miniratna I and Miniratna II for delegation of the financial powers. The
criteria of determination of the status of enterprise for inclusion in various categories are
stated below:
Table 8: Classification Criteria
Miniratna I Miniratna II Navratna Maharatna
Should have made
profit for the last 3
year and have a
positive net worth
Have not defaulted
on loans/ interest
repayment of the
Government
No dependency up
on budgetary
support or
government
guarantees
Boards restructured
with presence of
atleast three non-
official directors
Eg. Ed.CIL, HMT,
MECON Ltd
Should have
reported profits in
the last 3 years with
pre-tax profit of Rs
30 crore or more in
any one of the last 3
year
Have not defaulted
on loans / interest
No dependency on
budgetary support of
Government
guarantees
Boards restructured
with presence of at
least three non
official directors
AAI, BEML,
Concord, EIL,
IRCTC, etc
Should be a
Miniratna
Should have
‘excellent’ very
good rating in 3 of
the last 5 MoUs
Have secured
composite score of
60 or more for 7
identified
parameters
BEL, BHEL, BPCL,
etc
Should have Navratna
status
Listed on Indian stock
exchange, with
minimum prescribed
public shareholding
under SEBI regulation
Average annual
turnover of over Rs
25000 crore in the last
3 years
Average annual net
profit after tax of over
Rs 5000 crore in the
last 3 years
Notable global
presence or
international operations
Eg. Coal India, IOCL,
NTPC, etc
The following Box 7 shows the autonomy to the SOEs in the above mentioned categories:
Box 7: Autonomy to the SOEs

33
Source: Government of India, Arjunsen Gupta Committee Report, 1996 & www.dpe.nic.in
Access to Information
The SOEs are mandated to follow provision of Right to Information Act, 20059. According to
the new Act which the Government of India has passed, all the public agencies have to put
their organisational information in the public domain including processes, financial
transactions, human resource management related information, procurement and tendering
related information through the web, annual reports, press briefing, parliamentary questions
and corporate week interactions. Implementation of RTI Act 2005 has changed the secrecy
culture of an organisation and is slowly bringing in the transparency and openness in the
organsaitions. SOEs are no exception and are also going through the process of
transformation.
Integrity Pact
The Integrity Pact (IP) is a tool developed in 1990s by Transparency Interna6onal (TI) to help
governments, businesses and civil society to fight corruption in public contracting and
procurements. It is a tool which establishes mutual contractual rights and obligations to
reduce the high cost and effects of corruption. IP is intended to make public contracting and
procurement transparent by binding all to ethical conduct. It also envisages a monitoring role
for the civil society which is the ultimate beneficiary of such action. The IP consists of a
9 Guide on Right to Information Act, 2005, Ministry of Personnel and Public Grievance and
Pension, Training, Government of India

34
process of signing an agreement between the government or a government department and
bidders for a public sector contract.
The IP was introduced in India in 2006 with the initiative of (Late) Shri Subir Raha, the then
CMD of Oil & Natural Commission (ONGC). Then the Second Administra6ve Reforms
Commission (ARC) in its IV Report on Ethics in Governance made the recommenda6on for
IP’s adop6on in order to make contracting process more transparent. But it got the real boost
due to the support of Central Vigilance Commission (CVC) which issued its first circular on
Dec. 4, 2007 recommending the adoption of Integrity Pact in all major procurements of
central PSUs. The Prime Minister in his address on August 26, 2009 to CBI and State Anti-
corruption Bureau also mentioned IP as a tool to curb corrup6on. As a result, so far 44 PSUs
adopted IP since 2006.
Transparency : The SOEs now put all the information in the public domain including
processes, financial transactions, human resource management related information,
procurement and tendering related information through the web, annual reports, press
briefing, parliamentary questions and corporate week interactions. The SOEs mandatory
follow provision of Right to Information Act, 200510
.
SECTION: III
Alternatives to SOEs
To combat the menace of burgeoning current account deficit and increasing fiscal deficit
giving rise to difficult to tame inflation, the government has introduced some very important
policy instruments to contain the growth of SOEs and take suitable steps to progressively
reduce investments therein but not below 51% of the shareholdings. Some of these vital
initiatives relate to the promotion of the Special Economic Zones, provision of subsidies,
direct or indirect, to the concerned clientele and promote entrepreneurship not only to
supplement and supplant the ongoing development efforts through SOEs but to strengthen
private sector in such a way that the need to continue with the SOEs becomes minimal.
Special Economic Zones (SEZ) in India
India was one of the first in Asia to recognize the effectiveness of the Export Processing Zone
(EPZ) model in promoting exports, with Asia's first EPZ set up in Kandla in 1965. With a
view to overcome the shortcomings experienced on account of the multiplicity of controls
and clearances; absence of world-class infrastructure, and an unstable fiscal regime and with
a view to attract larger foreign investments in India, the Special Economic Zones (SEZs)
10
Guide on Right to Information Act, 2005, Ministry of Personnel and Public Grievance and
Pension, Training, Government of India
35
Policy was announced in April 2000. The major difference between an SEZ and EPZ is that
the former is an integrated township with fully developed infrastructure where as an EPZ is
just an industrial enclave.
The SEZ policy of 2000 was intended to make SEZs an engine for economic growth
supported by quality infrastructure complemented by an attractive fiscal package, both at the
Centre and the State level, with the minimum possible regulations. Under the new scheme, all
the eight existing EPZs located at Kandla and Surat (Gujarat), Santa Cruz (Maharashtra),
Cochin (Kerala), Chennai (Tamil Nadu), Vishakhapatnam (Andhra Pradesh), Falta (West
Bengal) and Noida (U.P) have been converted into SEZs. The salient features of the SEZ
scheme are: 1. A designated duty free enclave to be treated as foreign territory only for trade
operations and duties and tariffs. 2. No license required for import. 3. Manufacturing or
service activates allowed. 4. SEZ units to be positive net foreign exchange earners within
three years. 5. Domestic sales subject to full customs duty and import policy in force. 6. Full
freedom for subcontracting and 7. No routing examination by customs authorities of export
and import cargo.
SEZ Act, 2005
To instil confidence in investors and signal the Government's commitment to a stable SEZ
policy regime and with a view to impart stability to the SEZ regime thereby generating
greater economic activity and employment through the establishment of SEZs, a
comprehensive draft SEZ Bill was prepared after extensive discussions with the important
stakeholders of the economy. As a result, The Special Economic Zones Act, 2005, was
passed by Parliament in May, 2005 and after extensive consultations, the SEZ Act, 2005,
supported by SEZ Rules, came into effect from 10th February, 2006, providing for drastic
simplification of procedures and for single window clearance on matters relating to central as
well as state governments. The main objectives of the SEZ Act are: (a) generation of
additional economic activity; (b) promotion of exports of goods and services; (c) promotion
of investment from domestic and foreign sources; (d) creation of employment opportunities
and (e) development of infrastructure facilities. Overall, the SEZ Act is intended to trigger a
large flow of foreign and domestic investment in SEZs, in infrastructure and productive
capacity, leading to generation of additional economic activity and creation of employment
opportunities.
SEZ and Governance
The SEZ Act 2005 envisages key role for the State Governments in Export Promotion and
creation of related infrastructure. A Single Window SEZ approval mechanism has been
provided through a 19 member inter-ministerial SEZ Board of Approval (BoA) constituted by
the central government. The applications duly recommended by the respective State
Governments/UT administration are considered by this BoA periodically. All decisions of the
Board of approvals are with consensus. The SEZ Rules provide for different minimum land
requirement for different class of SEZs. Every SEZ is divided into a processing area where
alone the SEZ units would come up and the non-processing area where the supporting
infrastructure is to be created. The SEZ Rules provide for: 1. Simplified procedures for
development, operation, and maintenance of the Special Economic Zones and for setting up
units and conducting business in SEZs; 2. Single window clearance for setting up of an SEZ;
3. Single window clearance for setting up a unit in a Special Economic Zone; 4. Single
Window clearance on matters relating to Central as well as State Governments; 5. Simplified
compliance procedures and documentation with an emphasis on self certification; 6.
Approval mechanism and Administrative set up of SEZs; and 7.

36
Approval Mechanism of SEZs
The developer submits the proposal for establishment of SEZ to the concerned State
Government. The State Government has to forward the proposal with its recommendation
within 45 days from the date of receipt of such proposal to the Board of Approval. The
applicant also has the option to submit the proposal directly to the Board of Approval.
Administrative set up of SEZs
The functioning of the SEZs is governed by a three tier administrative set up. The Board of
Approval is the apex body and is headed by the Secretary, Department of Commerce. The
Approval Committee at the Zone level deals with approval of units in the SEZs and other
related issues. Each Zone is headed by a Development Commissioner, who is ex-officio
chairperson of the Approval Committee.
Once an SEZ has been approved by the Board of Approval and Central Government has
notified the area of the SEZ, units are allowed to be set up in the SEZ. All the proposals for
setting up of units in the SEZ are approved at the Zone level by the Approval Committee
consisting of Development Commissioner, Customs Authorities and representatives of State
Government. All post approval clearances including grant of importer-exporter code number,
change in the name of the company or implementing agency, broad banding diversification,
etc. are given at the Zone level by the Development Commissioner. The performance of the
SEZ units are periodically monitored by the Approval Committee and units are liable for
penal action under the provision of Foreign Trade (Development and Regulation) Act, in case
of violation of the conditions of the approval.
Incentives and facilities offered to the SEZs
The incentives and facilities offered to the units in SEZs for attracting investments into the
SEZs, including foreign investment include the following:
Box 8 : Incentives and facilities offered to the SEZs
1. Duty free import/domestic procurement of goods for development, operation and
maintenance of SEZ units
2. 100% Income Tax exemption on export income for SEZ units under Section 10AA of the
Income Tax Act for first 5 years, 50% for next 5 years thereafter and 50% of the ploughed
back export profit for next 5 years.
3. Exemption from minimum alternate tax under section 115JB of the Income Tax Act.
4. External commercial borrowing by SEZ units upto US $ 500 million in a year without
any maturity restriction through recognized banking channels.
5. Exemption from Central Sales Tax.
6. Exemption from Service Tax.
7. Single window clearance for Central and State level approvals.
8. Exemption from State sales tax and other levies as extended by the respective State
Governments.
The major incentives and facilities available to SEZ developers include the following:
1. Exemption from customs/excise duties for development of SEZs for authorized
operations approved by the BOA.
2. Income Tax exemption on income derived from the business of development of the
SEZ in a block of 10 years in 15 years.

37
3. Exemption from minimum alternate tax.
4. Exemption from dividend distribution tax.
5. Exemption from Central Sales Tax (CST).
6. Exemption from Service Tax.
SEZs in India and their Performance
Since SEZ Act and rules were notified in 2006, formal approvals have been granted for
setting up of 571 SEZs out of which 346 have been notified. A total of 160 SEZs are
exporting goods and services. Of this 93 are IT/ITES, 17 multi-product and 50 other sector-
specific SEZs. The total number of units in these SEZs is 3308.
The total employment provided to 9,45,990 persons in SEZs as a whole, that to 8,11,286
persons is incremental employment generated after February 2006 when the SEZ Act came
into force. This is apart from the million mandays of employment created by the developer
for infrastructure activities. While in 2010-11 physical exports from SEZs were worth Rs.
3,15,867.85 crore, in 2011-12 the figure had gone up Rs. 3,64,477.73 crore in 2011-12,
registering a growth of 15.4 per cent. The total investment in SEZs till 30 September 2012
was Rs. 2,18,795.41 crore approximately, including Rs. 2,14,759.90 crore in the newly
notified zones.
Table 9A: Exports from the functioning SEZs in India
Year Value (Rs. Crore) Growth Rate ( over previous year)
2003-2004 13,854 39%
2004-2005 18,314 32%
2005-2006 22 840 25%
2006-20007 34,615 52%
2007-2008 66,638 93%
2008-2009 99,689 50%
2009-2010 2,20,711.39 121.40%
Source: www.sezindia.nic.in
Table 9B: Exports from the functioning SEZs in India
2005–06 2006-07 2007-08 2008-09 2009-10
Central Government SEZs
Value (Rs. crore) 19,657 23,358 39,275 46,985 58,037
Growth (%) 29.0 54.9 19.6 23.5
Share (%) 86.1 73.3 58.9 47.1 26.3
State government/private SEZs established prior to SEZ Act 2005
Value (Rs. crore) 3,183 9,134 22,167 31,640 44,729
Growth (%) 1 187 142.7 42.7 41.4
Share (%) 13.9 26.4 33.3 31.7 20.3
Source: Economic Survey, Govt. of India
Table 9C: Comparative View of SEZs in India and China
Government ownership Private ownership, majority of SEZs developed by real
estate firms in India
China has less than 10 SEZs No. of SEZs in India (notified): 377
Largest SEZ: Shenzen (32,700 ha) Largest SEZ: Reliance (14,000 ha)
Exports from SEZ (Shenzen alone) in 2008: US$
179.72 billion
Exports from SEZs (total) in 2008: US$ 22.1 billion
Source: Khan (2008)

38
SEZs and its Challenges
1. The biggest challenges faced by SEZ’s in today’s scenario are the taking away of
agricultural land from the farmers. The farmers are being paid disproportionate money
which is not in lieu of the current land prices. One of the best examples in the resent
past could be seen in the case of farmers from Kalinganagar in Orissa where the
money given was disproportionate to as high as 1:10 with respect to the market rates.
Moreover SEZ’s are leading to decrease in crop production (arable Land Grabbing)
thus slowing down of agricultural activity in the country. More and more farmers are
moving towards the lucrative manufacturing side in search of greater economic
security. Moreover the greatest problem that seems to be emerging out is that arable
land is being used for non agricultural purpose which could lead to food crisis and
loss of self sustenance in future. For example: Nadigram district of West Bengal.
2. The most contentious debates have been regarding the acquisition of land for these
zones. SEZs have highlighted existing ambiguities in the laws on land acquisition as
well as the process for determining compensations.
3. In more recent months, financial viabilities of SEZs have been under the scanner with
certain zone developers contemplating exits due to poor economic prospects. The SEZ
policy is also inviting criticism for having a myopic vision on urban management and
constitutional identities of the zones.
Road Ahead for SEZs:
As evidence over the years has shown, this single-minded pursuit of growth has lowered the
efficiency and effectiveness of economic policies, besides incurring huge resource and
environmental costs. The Chinese experience offers a valuable lesson for India. Neither the
international nor the Indian experience with SEZs has been particularly happy. Globally, only
a handful of SEZs, of the hundreds that exist, have generated substantial exports, along with
significant domestic spin-offs in demand or technology up-gradation. For each successful
Shannon (Ireland) or Shenzhen (China), there are 10 failures – in the Philippines, Malaysia,
Brazil, Mexico, Colombia, Sri Lanka, Bangladesh, and to some extent India. A 1998 report
by the Comptroller and Auditor General (CAG) on export processing zones (EPZs) says:
“Customs duty amounting to Rs. 7,500 crore was forgone for achieving net foreign exchange
earnings of Rs.4,700 crore.
The Reserve Bank of India says that large tax incentives can be justified only if SEZ units
establish strong “backward and forward linkages with the domestic economy” which is a
doubtful proposition. It has been argued that not only will the SEZs make the government
forgo revenue it can ill afford to lose; they also offer firms an incentive to shift existing
production to the new zones at substantial cost to society.
As much as 75 per cent of the SEZ area can be used for non-core activities, including
development of residential or commercial properties, shopping malls and hospitals.
Developers will surely use this to make money via the real estate route rather through export
promotion. This represents a potentially humongous urban property racket of incalculable
dimensions.
Subsidies in India
The debate on selective targeting of subsidies has always occupied a centre stage in the
domain of India’s fiscal policy. The debate assumes significance more so after the discussion
paper on subsidies was released in the year 1997 by ministry of finance. This discussion
paper which took a broad view of subsidies can be called as the first attempt on the

39
expenditure side reform in the post reform era. Subsequently, two papers released in the year
2003 and 2004 also suggested comprehensive recommendations regarding rationalization of
subsidies. This was another significant development.
Subsidies are used with redistributive objectives and have a positive impact on the welfare of
the society. The positive impact is sustainable only when the subsidies are designed
efficiently and or not irrational. Ill conceived and ineffectively designed subsidies would be
very costly. In the beginning of the planning era subsidies were thought of as a policy for
the welfare of the poor. Thus subsidies such as food, fertiliser, power, became part and parcel
of Indian agriculture. There are other subsidies such as petroleum, transport and export
subsidies. For Indian economy, which always had eradication of poverty as a cherished goal,
provision of subsidies has a welfare dimension. However, subsidies over the years
degenerated into politics of populism. Political parties in India started using subsidies as an
election plank that would catapult them to power.
In 1979, Vadilal Dagli committee was constituted to evaluate and review the subsidies and
make recommendations. The committee pointed out the fact that subsidy regime in India has
never been selective. It has not reached the intended beneficiaries. The committee also
mentioned that cross subsidies have increased where one set of consumers subsidise the
other. Irrespective of studies it has been noted that subsides have led to misallocation of
resources and malpractices. It was being realised by all concerned that subsidies are assuming
dangerous proportions creating an adverse impact on the finances of the state. Irrational and
untargeted subsidies are stumbling blocks to the goal of minimising the fiscal deficit. .
The 1997 Discussion Paper and subsequent papers and report: The paper criticized the
subsidy regime in India as unduly large, non-transparent, largely input based and poorly
targeted. The paper argued that the proliferation of subsidies in India flowed from an undue
expanse and growth of governmental activities in the provision of private goods. Government
at the centre and in the states, actively participate in the provision of range of private goods in
the category of social and economic services. In the cases where the budgetary cost of
providing a good or service exceeds the recovery made from the recipient of the service, arise
budgetary subsidies. The difference between the two is borne by the tax payer. The paper
classified the goods into merit and non merit subsidies. The merit goods were further
classified into Merit I and Merit II.
Elementary Education, primary health centres are some of the areas in the Merit I list.
Education other than elementary, family welfare and urban development are some of the
areas in the Merit II list. Whatever is not there in either of the lists it would be in the Non
Merit list. The study made by National Institute of Finance and Public Policy in the year
2003 was also very comprehensive. It gave the statistics of various subsidies. According to
the study, the central budgetary subsidies in 1998-99 are estimated to be Rs 79828 crore,
which amounted to 4.59 per cent of GDP. The non merit subsidies amounted to about 75 per
cent of the total subsidies. The study also mentioned the salary revisions as another reason for
surge in subsidies during the period 1997-98, in the wake of the fifth pay commission
recommendations. The explicit subsidies mainly food and fertiliser increased by a margin of
Rs 8094 crore from 1997 to 1999. Railways, which was a surplus sector in 1996-97, became
a subsidy sector in 1998-99. The subsidies in this sector amounted to more than 4000 crore.
The food subsidies have grown by more than 200 per cent in a period of five years from
1997-98, and more so since 2000-01. It suggested specific reform measures for almost all the
subsidies. In case of food subsidies it recommended that they should be de-linked from

40
policies to support agriculture. In case of fertiliser subsidies it mentioned that they promote
inefficiencies and are ill targeted. The study stressed upon the fact that the fertiliser subsidy
has all along supported inefficiency in the production units, because the production units are
assured of a substantial return on capital even if they compromised on some of the norms
and operate at sub optimal level. Therefore there is a need that the fertiliser subsidy should be
a income support for the small and marginal farmers. The rich farmers have taken advantage
of the fertiliser subsidy because of their high purchasing power. This further gave rise to
mounting subsidy bills.
The study recommended phasing out the subsidies in the present form in the next five years.
Phasing out the cross subsidies in the power sector, pruning the existing staff in the irrigation
sector, discouraging the non merit subsidies, rationalisation of petroleum subsidies, better
targeting of subsidies and increased access by the beneficiaries were some of its
recommendations. The other major development was the white paper released in the year
2004. As per the report, the subsidies during the year 2003-04, was to the tune of 1,15,824
crores. It reiterated the concerns expressed by the previous study. The report mentioned the
fact that during the year 2003-04, the share of merit subsidies was 42 per cent and that of the
non merit was 58 per cent. One of its important recommendations related to bringing down
the food subsidies was that, before sowing season, food procurement target should be fixed.
Food Corporation of India should suspend purchase of operations once the targets are
achieved. Introduction of food coupons for the poor, for better penetration of public
distribution system, reduction of fertiliser subsidy to both farmers as well as industry,
reduction of petroleum subsidy and above all the requirement of political will to implement
these measures were some of the other important recommendations of the report.
Composition and Recent Trends of Indian Subsidies:
Table 10 depicts the composition of trends in subsidies in India and the percentage of the
subsidy to the GDP.
Table 10: Subsidy Trends India
Particulars 2008-
09
2009-
10
2010-
11
2011-
12
2012-
13
2012-13
vis-à-vis
2011-12
growth
rates
CAGR
10
Years
CAGR
5 Years
Total Subsidies
(Rs crore)
129,708 141,351 173,420 216,297 190,015 -12.20% 19.20% 31.90%
( % of GDP) 2.30% 2.20% 2.30% 2.40% 1.90%
Fertilizer Subsidy 76,602 61,264 62,301 67,199 60,974 -9.30% 22.30% 21.40%
( % of GDP) 1.40% 0.90% 0.80% 0.80% 0.60%
Food Subsidy 43,751 58,443 63,844 72,823 75,000 3.00% 13.00% 22.20%
( % of GDP) 0.80% 0.90% 0.80% 0.80% 0.70%
Petroleum
Subsidy
2,852 14,951 38,371 68,481 43,580 -36.40% 30.40% 120.70
%
( % of GDP) 0.10% 0.20% 0.50% 0.80% 0.40%
Interest Subsidy 3,493 2,686 4,680 5,791 7,968 37.60% 25.20% 19.60%
( % of GDP) 0.10% 0.00% 0.10% 0.10% 0.10%
Other Subsidy 3,009 4,006 4,223 2,002 2,493 24.50% -1.90% -0.80%

41
( % of GDP) 0.10% 0.10% 0.10% 0.02% 0.02%
Source: Budget Documents
Subsidy Issues in India
The size, incidence, allocation distortions, and recent upsurge in some subsidies are the key
issues in the context of budgetary subsidies in India. The main issues pertaining to subsidies
in India may be listed as: (i) are budgetary subsidies provided for the right reasons; (ii) are
many wrong goods/services being subsidised; (iii) does over-subsidisation lead to harmful
effects; (iv) are subsidies too large relative to resources; (v) what are the implications of
cross-subsidies and off-budget subsidies; (vi) has there been an upsurge in some subsidies in
recent years; (vii) what are the implications of subsidising inputs; (viii) is the subsidy regime
in India regressive; (ix) what is the interface of subsidies with inefficiencies; (x) is there a
case for increasing subsidies in some sectors; and (xi) is there a need for distinguishing long-
term subsidies from those that should have a limited life?
Public Private Partnership (PPP)
Public Private Partnership (PPP) refers to a cooperative relationship between government and
private sector, for the provision of infrastructure services effectively. Each of the partner in
this relationship brings with it what the other lacks. The private participation could help to
bring technical and managerial expertise, injection of huge capital, which the government
may not possess. On the other hand, a private developer would take many years to arrange
for land, water, roads, ports and obtain all the clearances required, which the government as
the largest land owner is best suited to do. It is strongly believed that the PPP approach is best
suited for the infrastructure sector. It supplements scarce public resources, creates a more
competitive environment and helps to reduce costs. It facilitates the best practices related to
management by private sector. Considering the paucity of public funds more so in developing
countries, it is imperative that private participation be invited in the process of strengthening
infrastructure. Developing countries are adopting PPP model on a wide scale for
infrastructure. Be it airports, highways, ports, power, PPP is fast emerging as a solution for
infrastructure bottlenecks. India is no exception to this rising trend of adoption of PPP model.
Not just the physical infrastructure but even in economic infrastructure, such as education and
health PPP is seriously being considered as a panacea for the problem of infrastructure
inadequacies. There are presently 750 projects in India.
Public Private Partnership as an alternative delivery system: In the last decade and half
countries all over the world have experienced problems with service delivery and have been
looking at alternative service delivery methods and new project finance options. The reality is
that governments have come under intense pressure to provide better and affordable public
services. Therefore the governments are contemplating partnership arrangements with the
private sector to meet these growing demands of providing better and affordable public
services.
While traditional services such as provision of water and sanitation, solid waste collection
and disposal, bus and urban transit, and road construction and repair have been some of the
most typical examples of public private partnerships, partnerships techniques are being
applied in numerous non-traditional areas such as the provision of utility billing and
collection services, school and education management, the management and operation of job
training centres, the construction and operation of prisons, the construction and operation of
health services, and even the provision of information technology systems for local and
regional governments. Public Private Partnerships (PPP’s) permit an expansion of
infrastructure provision, an expansion beyond what government on its own could achieve

42
given budgetary constraints The twelfth Plan approach paper mentions the following, as far
as the infrastructure development based on PPP is concerned. Inadequate infrastructure was
recognised in the Eleventh Plan as a major constraint on rapid growth. The Plan had,
therefore, emphasized the need for massive expansion in investment in infrastructure based
on a combination of public and private investment, the latter through various forms of public-
private partnerships. Substantial progress has been made in this respect. The total investment
in infrastructure which includes roads, railways, ports, airports, electricity,
telecommunications, oil gas pipelines and irrigation is estimated to have increased from 5.7
per cent of GDP in the base year of the Eleventh Plan to around 8.0 per cent in the last year of
the Plan. The pace of investment has been particularly buoyant in some sectors, notably
telecommunications, oil and gas pipelines, while falling short of targets in electricity
railways, roads and ports. Efforts to attract private investment into infrastructure through the
PPP route have met with considerable success, not only at the level of the Central
Government, but also at the level of the individual States.
Box 9: Evolution of Public Private Partnership in India
Phase 1 from 19th
century and early 20th
century: Some of the notable PPPs during this
time were: The great Indian Peninsular Railway company in 1853, the Bombay Tramway
Company’s tramway services im Mumbai in 1874, PPP models were there in power
generation and distribution in Mumbai and Kolkata in the early 20th
century.
Phase 2 from 1991-2006:
Only 86 PPP projects worth INR 340 billion were awarded till 2004. Most of the projects
were in bridges and road sector.
Phase 3 after 2006: Increasing acceptance of PPP model due to favorable policy reforms and
innovative PPP structures Source: Accelerating public private partnerships in India, FICCI and Ernst & Young Report, 2012
Details of some of the important sectors are as follows:
Power Sector being in thick of controversy always, the PPP in power sector needs a detailed
explanation. Some highlights of other sectors are also mentioned. Power Sector: Private
Sector participation in power sector was one of the key areas of reforms since 1991, when the
reforms began. India’s current installed power generation capacity is about 2, 28, 000 MW.
By 2031-32 the generation capacity required would be 8,00, 000 MW.(Integrated Energy
Policy- Report of the expert committee 2006). In spite of expected strong growth in capacity
addition, India’s power shortage is likely to remain very high. By the end of 2009 the peak
power shortage crossed 14% (position paper on ‘The Power Sector in India 2009).. The 17th
Electric Power Survey which is conducted by Central Electricity Authority has forecast that
the peak demand will be growing at a CAGR of 7.8% during eleventh plan. (ibid 2009). This
calls for encouragement to private participation in the sector, as public sector alone would not
be able to achieve the plan targets. The private players in the power sector have announced a
target of 100 GW of capacity addition. (ibid 2009). PPP model is being hailed as the
harbinger of change in power sector. PPP got an impetus during the second generation
reforms. However PPP existed even prior to the second generation reforms in power sector.
The first effort for PPP was the Dabhol power plant in Maharahstra which started in the year
1992. The American company Enron owned about 85% along with other American
companies and the Maharashtra State Electricity Board owned 15%. The project got bogged
down by various problems and had to be closed. The other PPPs in power sector are:
a) Tala Transmission Project: This PPP is a joint venture model. It is joint venture
between PGCIL which has 49% stake and Tata power with 51% stake. The project is

43
meant to evacuate surplus power from 1,020 MW Tala hydro electric power plant in
Bhutan and bring it to India.
b) Franchisee model of UPPCL and MSEDCL: In this case the PPP model is based on
management contract. The selected private player will be a franchisee of the discom
to purchase and distribute electricity in the franchisee area. As a distribution
franchisee the discom acquires all rights. The torrent power which is the distribution
franchisee for the Bhiwandi circle of Mumbai, has been successful in bringing down
the distribution losses2
c) AP Gas Power Corporation Ltd.: This is an example of PPP that existed even
before the reforms in power sector were envisaged. It is joint venture between
erstwhile APSEB and several companies from public and private sector3. It was
successful in meeting the objectives for which it was promoted. For example, it was
successful in supplementing power from grid, meeting the demands of energy of the
participating industries without restrictions.
UMPPs are the new PPPs in power sector. They are being developed on Build Own and
Operate (BOO) basis4. It has now become a thrust area in the reforms of power sector. This
study is focussed on UMPPs with special reference to Sasan and Mundra Power Projects
which are first to come into existence. The following table gives details of the present
UMPPs.
Table 11: Details of UMPPs
UMPP Developer Expected commissioning Year
Sasan, Madhya Pradesh Reliance Power 2012
Mundra, Gujrat Tata Power 2012
Krishnapatnam, AP Reliance Power 2015
Tilaiya, Jharkand Reliance Power 2015
Source: Position Paper on Power Sector in India- Department of Economic Affairs, Ministry of
Fianance-2009
ULTRA MEGA POWER PROJECTS: UMPPs are very large sized projects, of 4000 MW
each, involving an estimated investment of Rs 16,000 crore. These UMPPs are expected to
generate power at a cheaper rate, which would ultimately help affordable tariffs to the
consumers because the generation costs are a pass through in the consumer tariff. The
electricity act, the national electricity policy, the national tariff policy, emphasize that it is the
competition among the multiple power suppliers that will drive down the consumer tariffs.
44
Highways: This sector consists of 405 projects at INR 1,760 billion approximately, accounts
for 53 per cent of the total number and 46 per cent of the total value of PPP projects in India.
The most common form of PPP in national highways is, Built Own and Transfer (BOT) and
Special Purpose Vehicles (SPVs). He state governments of Andhra Pradesh, Gujarat,
Karnataka, Maharashtra, Rajasthan and Madhya Pradesh are taking initiatives to promote
PPP based state highways.
Railways: The railways sector just experienced four PPP contracts valued at INR 15.7
billion. The projects have been contracted either by domestic competitive bidding or through
negotiated MOUs. Some of the PPP projects initiatives are, Container Corporation of India
limited, Pipavav Railway Corporation Ltd, Rail Vikas Nigam Limited.
Urban Infrastructure: The urban Infrastructure sector witnessed a about 152 projects
valued at INR 294 billion. The government launched the Jawaharlal Nehru National Urban
Renewal Mission, in order to promote PPP in states and urban local governments. The
integrated solid waste management project in Chennai and water supply sewerage project in
Kolkata are some of the significant PPP initiatives in Urban Infrastructure.
Viability Gap Funding: The scheme aims at supporting infrastructure projects that are
economically justified but fall short of financial viability. Support under this scheme would
be available only for infrastructure projects where private sector sponsors are selected
through a process of competitive bidding. The total Viability Gap Funding under this scheme
will not exceed twenty percent of the Total Project Cost; provided that the Government or
statutory entity that owns the project may, if it so decides provide additional grants out of its
budget, but not exceeding a further twenty percent of the Total Project Cost.
The government will provide a Viability Gap Funding (VGF) which shall not exceed 20 per
cent of the Total Project Cost; provided that the Government or statutory entity that owns the
project may, if it so decides it will provide additional grants out of its budget, but not
exceeding a further 20 per cent of the Total Project Cost. VGF under this scheme will
normally be in the form of a capital grant at the stage of project construction. Proposals for
any other form of assistance may be considered by the Empowered Committee and
sanctioned with the approval of Finance Minister on a case-to-case basis. VGF up to Rs. 100
crore for each project may be sanctioned by the Empowered Institution subject to the
budgetary ceilings indicated by the Finance Ministry. In order to be eligible for funding under
VGF Scheme, a PPP project should meet the following criteria:
a) The project should be implemented i.e. developed, financed, constructed,
maintained and operated for the Project Term by a Private Sector Company to be
selected by the Government or a statutory entity through a process of open
competitive bidding; provided that in case of railway projects that are not
amenable to operation by a Private Sector Company, the Empowered Committee
may relax this eligibility criterion.
b) The project should provide a service against payment of a pre-determined tariff or
user charge.
c) The concerned Government/statutory entity should certify, with reasons:
That the tariff/user charge cannot be increased to eliminate or reduce the
viability gap of the PPP;
That the Project Term cannot be increased for reducing the viability gap;
and

45
That the capital costs are reasonable and based on the standards and
specifications normally applicable to such projects and that the capital
costs cannot be further restricted for reducing the viability gap.
Notwithstanding the approvals granted under this scheme, projects promoted by the Central
Government or its statutory entities are approved and implemented in accordance with the
procedures specified from time to time.
Issues, Challenges and Future: Public Private Partnership is indeed a significant policy
measure. However the issues challenges inherent cannot be ignored.
Independent regulator is required for the PPP related projects. This will establish a
strong regulatory environment, which would attract international funding.
A database consisting of various documents such as, feasibility reports and
concession agreements is required.
The dependency of private sector on the commercial banks to raise debt for the
PPP projects is another issue. The commercial banks have reached the sectoral
exposure limits. There is also the problem of highly leveraged Indian
Infrastructure companies, because of which funding has become difficult.
PPP projects are hindered by limited institutional capacities at various central
ministries; hinder the translation of targets into projects. The recent developments
on the front of Ultra Mega Power Projects and also the developments pertaining to
PPP in Roads sector have bought the problems to the fore.
Mundra Power Project which one of the first two Ultra Mega Power Projects (other being
Sasan), is 4000 MW project. When Ultra Mega Power Projects were conceptualized it was
expected that the power generated from these would be cost effective. There were factors that
supported this fact. Payment Security Mechanism and Ownership of Resources given to the
power generator, the Super Critical Technology, are some of the factors that were supposed
to result in cost effective generation. The Force Majeure Clause, in the power purchase
agreement was expected to ensure the performance of both the procurer and also the power
generator. However, certain adverse developments led to problems on this front. Mundra
Power is a coastal project which is depended on imported coal from Indonesia. Indonesia
hiked the price of the coal because of which the owner of Mundra Power, Tata Power pleaded
that it cannot supply the power at the original rate and that the rate be hiked. The state power
distribution companies refused to accept this plea. Central Electricity Regulatory
Commission under the headship of Deepak Parekh. The committee decided in favor of Tata
power. This has not gone down well with the state distribution companies. In case of road
sector also there is an attempt to revert to the EPC route, rather than PPP. Above all, there is
the challenge of balancing the interests of profit motive of private sector and the public sector
interest for public service. The perpetual challenge would be apportionment of risk that is
fair, rational and sustainable
Box 10: Public Private Partnership
Energy Transport Social Urban infra
Case II bids Toll roads Hospitals Water Supply and
sanitation
UMPP Terminals in major
ports
Schools Solid waste
management
Power transmission Airport
Power Distribution

46
Source: Report on Public Enterprises, KPMG, 2011, p 16
Promoting Entrepreneurship through Developmental Banking
The history of entrepreneurship is important worldwide, even in India. In the pre colonial
times the Indian trade and business was at its peak. Indians were experts in smelting of metals
such as brass and tin. Kanishka Empire in the 1st century started nurturing Indian
entrepreneurs and traders. Following that period, in around 1600 A.D., India established its
trade relationship with Roman Empire. Gold was pouring from all sides. Then came the
Portuguese and the English. They captured the Indian sea waters and slowly entered the
Indian business. They forced the entrepreneurs to become traders and they themselves took
the role of entrepreneurs. This was the main reason for the downfall of Indian business in the
colonial times which had its impact in the post-colonial times too. The colonial era make the
Indian ideas and principles rigid. A region of historic trade routes and vast empires, the Indian
subcontinent was identified with its commercial and cultural wealth for much of its long history.
Gradually annexed by the British East India Company from the early eighteenth century and
colonized by the United Kingdom from the mid-nineteenth century, India became an independent
nation in 1947 after a struggle for independence that was marked by widespread nonviolent
resistance. It has the world's twelfth largest economy at market exchange rates and the fourth
largest in purchasing power. Economic reforms since 1991 have transformed it into one of the
fastest growing economies however, it still suffers from high levels of poverty, illiteracy, and
malnutrition. For an entire generation from the 1950s until the 1980s, India followed socialist-
inspired policies. The economy was shackled by extensive regulation, protectionism, and public
ownership, leading to pervasive corruption and slow growth. Since 1991, the nation has moved
towards a market-based system. Entrepreneurship is the result of three dimensions working
together: conducive framework conditions, well-designed government programmes and
supportive cultural attitudes. Across these three perspectives of entrepreneurship, two major
conclusions are apparent. Firstly, the economic, psychological and sociological academic
fields accept that entrepreneurship is a process. Secondly, despite the separate fields of
analysis, entrepreneurship is clearly more than just an economic function.
The private financing initiative has caught up in India in line with the global trend wherein
specialized institutions have been created to finance medium and large scale industries in the
private sector. It is common-knowledge that the private sector in developing countries has
experience and knowledge but starved of funds. This was well understood in India since the
inception of independence. The Industrial Finance Corporation of India (IFCI) was setup in
1948 followed by the Industrial Development Bank of India (IDBI) in 1964. Both these
institutions were set up in public sector. To facilitate the drawl of financial support from the
International Finance Corporation for private sectors, the Industrial Credit and Investment
Corporation of India (ICICI) was set up 1955. A host of development banks were set up
thereafter. Some of these include National Bank for Agriculture and Rural Development
(NABARD) set up 1982, Industrial Investment Bank of India (IIBI) set up in 1971, Small
Industries Development Bank of India (SIDBI), 1990 and Export Import Bank of India
(EXIMB) set up 1982. The provincial governments also set up a chain of developmental
banks including the State Financial Corporations (SFCs), the State Industrial Development
Banks (SIDCs), Small Scale Industries Developments Corporations (SSIDCs), and the State
Industrial Infrastructure Development Corporations (SIIDCs). These corporations provide
project financing for medium and long-term periods at interest rates cheaper than the short-
term lending rates charged by the commercial banks. The credit provided is for longer period
and for higher volumes. These development banks have performed well. However, they have
faced the problem of a huge gap between sanctions and disbursements, realizing principal and
interest within the time period granted. The time taken in processing loans has turned out to

47
be inordinately long and the project appraisal systems have been found wanting. The
executives in the development banks lack generally the sensitization of the philosophy of
development banking. The genuineness of the applicants seeking loans from these banks and
also the quality of project proposals have also been found questionable. The global trend of
economic sectors targeted by development banks include services, industry / manufacturing,
agribusiness, construction, energy, infrastructure, health, education and mining. The Indian
development banks scenario, by and large, follow this pattern. To strengthen, the
development banks in India, it is desirable to add to their capital base, ensure capital
adequacy, reorient there systems and procedures to finance new economy industry and
professionalize their personnel. Table 12 depicts the financial assistance sanctioned and
disbursed by developmental banks in India

48
Table 12: Financial Assistance Sanctioned and Disbursed by Financial Institutions
S
No Institutions
Loans Underwriting and
Direct Subscription Others Total
2011-12 2011-12 2011-12 2011-12
S D S D S D S D
A.
All India Financial
Institutions (1, 2 & 3) 463.2 446.2 16.1 28.4 0.8 0.3 480.1 474.9
1. IFCI 31.5 32.1 14.8 24.7 0.5 0.0 46.7 56.8
2. SIDBI 431.7 414.1 1.3 3.7 0.3 0.3 433.4 418.1
3. IIBI - - - - - - - -
B.
Specialised Financial
Institutions (4, 5 & 6) 10.3 7.9 0.0 0.0 0.6 0.6 10.9 8.5
1. IVCF 3.1 2.9 0.0 0.0 0.0 0.0 3.1 2.9
2. ICICI Venture - - - - - - - -
3. TFCI 7.2 5.0 0.0 0.0 0.6 0.6 7.8 5.6
C.
Investment
Institutions (7 & 8) 17.4 27.0 524.9 490.1 1.8 2.5 544.1 519.7
1. 7. LIC 17.4 27.0 512.3 477.6 1.8 2.5 531.5 507.1
2. 8. GIC@ 0.0 0.0 12.6 12.6 0.0 0.0 12.6 12.6
D Financial Institutions
(A+B+C) 490.9 481.1 541.0 518.5 3.2 3.4 1035.1 1003.1
E
Total Assistance by
All Financial
Institutions 490.9 481.1 541.0 518.5 3.2 3.4 1035.1 1003.1
To summarize, the SOEs have held commanding heights of the Indian economy by acting as
growth engines, operating in infrastructure sectors, redressing the socio-economic inequities,
generating productive employment, providing wherewithal for economic development and
there by achieving the twin objectives of socio-economic development of India. The SOEs
have faced many limitations ranging from governance challenges to excessive oversight.
Many vital steps have been taken to remove these irritants bringing about far reaching
changes in the ownership policies in regard to SOEs resulting in creating a state of level
playing field between them and their counterparts in the private sector.

49
SECTION: IV
Best Practices of SOEs
Enhancing Performance in SOEs
Steel Authority of India Limited
o SAIL developed an on-line Employee Performance Management System (EPMS) which
is a transparent process and follows a KPA (Key Performance Area) based performance
appraisal system wherein KPAs for individual / department are finalized by breaking
down the organization objectives to the individual / departmental level. An individual is
expected to maintain an online performance diary and is assessed through multi stage
assessment (self, reporting & reviewing). Based on the performance rating, annual salary
increment & career progression of employees is determined. Further, the process of 360
degree feedback has been initiated in SAIL during 2009-10. The EPMS drives a
performance based culture by (i) incentivising high performers by identifying their major
achievements during the assessment by the Performance Management Committee
("PMC") (ii) developing poor performers by identifying their shortcomings during
assessment phase and preparing specific development plans for them.
Indian Oil Corporation Limited
o IOCL has an online Performance Monitoring System (e-PMS) since 2005-2006, and has
been able to successfully link the departmental promotions, incentives for individuals.
The IOCL e-PMS is transparent, involves goal setting across all grades through KRAs
with specific weightages and the appraisal is based on role based KRA and competencies
and level based values and potential.
Bharat Heavy Electricals Limited
o BHEL has adopted a Balanced Scorecard (BSC) based system to plan, monitor &
measure performance at various levels. The BSC prepared at organization level is
cascaded to manufacturing / business unit level and further to department / function /
section level. KRAs for employees in these departments / functions / sections are
finalized such that these are aligned with the Company targets & objectives. This entire
process has been e-enabled wherein the relevant parameters & targets get cascaded
automatically.
Environmental Aspects
Indian Oil Corporation Limited
o IOCL has invested around Rs. 7,000 crore in state-of-the-art technologies at its
refineries for production of green fuels meeting global standards.
National Thermal Power Corporation
o NTPC has adopted various environment planning and preservation activities including
establishment of the Centre for Power Efficiency & Environmental Protection
(CenPEEP) in collaboration with USAID with a mandate to reduce Greenhouse Gas
emissions per unit of electricity generated by improving the overall performance of
coal-fired power plants.
Community-related initiatives

50
• Indian Oil Corporation
o Some key initiatives of IOCL with regard to community-focused initiatives
include i) allotment of petrol/diesel station dealerships and LPG distributor- ships
to beneficiaries from among Scheduled Castes, Scheduled Tribes, physically
handicapped, ex-servicemen, war widows, etc., ii) setting up of the Indian Oil
Foundation (IOF) as a non-profit trust to protect, preserve and promote national
heritage monuments
• Steel Authority of India Limited
o SAIL serves the community through establishment and maintenance of more than
17 hospitals throughout the country out of which 7 are specialty hospitals and 54
primary health centres. SAIL has established 146 schools in its townships and 286
schools outside townships for educational development
• National Thermal Power Corporation
o NTPC runs around 48 schools in its power project townships benefitting 40,000
students and providing quality education. These schools are managed by premier
academic societies like the DPS Society, the DAV Society, the Chinmaya Mission
Trust, St. Joseph's Society and the Kendriya Vidyalaya Sangathan etc.

51
SECTION: V
India’s Development Strategy, Industrial Development and SOEs: Experience and
Pitfalls
India’s Development Strategy The centre piece of India’s development strategy was modernization through industrialization
especially given prominence to State Owned Enterprises along with nurturing the private
industrial sector. India viewed private industrial effort as inadequate for the economic and
social development. Underlying this view was a realization that infrastructure has public
good aspects and characteristics, or positive spillovers that could lead to under provision of
economic and socials goods and services if left entirely to the private sector. Even non-
infrastructure sectors such as steel, chemicals or machine tools may be subject to
coordination or linkage issues that require a ‘big push’ further supporting public intervention.
Therefore, India embarked on a programme of government occupation of the ‘commanding
heights’ of the economy. An alternative approach of using tax and subsidy instruments to
influence private actors was possibly viewed as infeasible, given the limited scope of the tax
base and quantity of revenue at the time. Public sector enterprises were created to take
leading roles in all industries and sectors viewed as central to the industrialization
programme, including steel, chemicals, and engineering, as well as trade and finance.
The economic development in places such as Britain, the Netherlands and the United States
had been driven by relatively decentralized commercial interests, later European models of
development, such as Germany and France, relied more explicitly on direction from the state.
Most strikingly, the Soviet Union followed a model that included not just state guidance, but
intervention in almost all aspects of the daily functioning of the economy. The latter required
an elaborate conceptual and administrative apparatus of economic planning. The Soviet
model also diverged from previous state-led industrializations in attempting to remove, rather
than co-opt or collaborate with the commercial classes.
Unlike the Soviet model, in India however, private property was not discarded, and
democratic institutions were successfully created and implemented. This approach reflected
influence of British in India. In this context, bureaucratic control—by civil servants reporting
to elected politicians became an important feature of the development strategy of India. This
manifested itself in multi-layered indicative planning exercises, administrative discretion in
the allocation of financial capital, private sector industrial location decisions, pricing
decisions, and numerous other discretionary restrictions on private economic activity. While
active bureaucratic participation had been an important part of much of continental Europe’s
economic development, as well as that of Japan, in the Indian case, its scope and depth were
in many ways more reminiscent of the Soviet Union.
Another important dimension of India’s development strategy was the development of
international trade and finance. After independence India followed policies that restricted
international trade and finance. India followed the older infant industry argument, which
suggested that initial protection from external competition was essential to industrialization,
so that firms and industries could develop sufficiently to compete internationally. Further
India imposed restrictions on foreign investment and technology transfer, arguing that these
would stunt the growth of domestic industries. Also India had a perspective of export
pessimism, which held that exports of goods in which developing countries had natural
comparative advantages, such as primary products, were subject to inelastic demand, and

52
therefore unlikely to be an engine of growth. Therefore, international openness was seen as
threatening, without significant countervailing benefits to India’s developmental plans.
While industrialization in India was viewed as the key player of development strategy, Indian
policymakers also gave importance to agriculture, since it provided the largest source of
employment in the economy. The potential for modernization of agriculture was not fully
realized until the innovations that enabled the green revolution in the 1960s, but this was
preceded by considerable government attention to creating the institutional and physical
infrastructure necessary to improve agricultural productivity, including irrigation works and
dams, rural roads and markets, credit cooperatives, price support programmes and extension
programmes for education and training of farmers. Land reform were also initiated by India
as a way of improving productivity as well as distributional equity, but limited progress was
made on that front due to political obstacles, namely, opposition from politically powerful
landed interests.
Finally, another significant dimension of India’s development strategy pertained to improving
the wellbeing or capabilities of the population, by public provision of minimum levels of
basic services in areas such as health and education. After independence, India faced the
problem of population explosion where the average life expectancy and educational
attainment were both very low. Therefore, India also undertook this challenge and therefore,
conceived of as part of development. At the same time, India promoted higher education as
critical to the main goal of modernization through industrialization.
India’s Development Strategy: Experience India’s GDP growth and improvements in human development indicators have improved
considerably since independence. This achievement came while preserving a democratic
political system, with minimal reliance on outside help, and accompanied by the development
of a rich set of governance and private sector institutions for delivering food, health, shelter
and education to a much greater proportion of the population than ever before in the region’s
history. Infrastructure investment was greater than before, industries were developed in
support of modernization goals, and higher education, in particular, grew dramatically. India
also sustained relatively low inflation rates, preventing the kind of tax on the poor that has
been characteristic of Latin American economies, several of which have experienced hyper-
inflations of varying severity.
Growth in the 1980s was aided by some reforms, as well as a macroeconomic stimulus that
turned out to be unsustainable, and an external payments crisis in 1991 forced some dramatic
changes in economic policy. Essentially, openness to international trade was increased
dramatically through tariff reductions and replacement of import quotas by tariffs, and the
scope of domestic industrial licensing was drastically reduced. In the 1990s and subsequently,
India has been one of the fastest growing economies in the world, and it is this last period that
can be generally characterized as a success in terms of economic development, and an
illustration of successful policy reform guided by economic analysis.
Aggregate capital intensity in India’s economy had long been identified as relatively high,
and was a consequence of policies that pushed heavy industrialization. India’s restrictive laws
on hiring and firing labour have also contributed to a bias towards capital, though often
because of other policy restrictions without allowing firms to grow enough to reap economies
of scale. High capital intensity was also arguably caused by inefficient use of capital
associated with the control regime, including domestic licensing and prohibitive trade
restrictions. More recently, India’s incremental capital-output ratio (ICOR) has declined

53
somewhat, suggesting better use of capital. Furthermore, investment rates in India have gone
up in the past decade, especially in the last few years. They are now approaching the levels
observed in past East Asian successes, though still below China’s.
Despite improvements in capital use, India’s capacity to generate employment in labour-
intensive manufacturing still remained limited. As a result, there has been limited absorption
of the rural labour force into manufacturing. Indian manufacturing has been, and remains
unusually skilled-labour-intensive. The roots of this situation can be traced to the overall
development strategy and its particular implementation through industrial and trade policy.
Labour laws which bite more stringently for unskilled versus skilled workers have also been a
factor.
The services sector in India has received considerable attention as one of the engines of the
country’s recent growth. The sector has contributed over half of GDP growth since the 1990s.
On the whole the services sector also displays some of the skill-intensity that characterizes
Indian manufacturing. This is particularly true of areas in which India is best known as a
global competitor, namely, information technology (IT) specifically software development
and IT-enabled services (ITES, e.g., business process outsourcing, customer service, medical
transcription, and financial research).
Software and ITES have been export-oriented. It has been argued that the success of India’s IT
and ITES industries was the result of the post-independence development strategy focused on
modernization and growth through industrialization. Certainly, the creation of top-notch
engineering and technology institutes as part of that strategy, and the availability of their
graduates, contributed to the success of India.
Further, the domestic appetite for consumer goods, both durables and non-durables, has
spurred foreign and domestic investment to meet this growing demand. Rising incomes and
demographic changes have also encouraged savings. A final factor in this mix has been
improved efficiency in financial intermediation, through a combination of entry of new
private firms, organizational reform of public sector financial firms, and substantial
regulatory reform in the financial sector. In some ways, this combination of growth factors is
quite different from the initial development strategy, which was geared towards a much more
limited set of consumer goods and financial services.
Table 13 to Table 15 summarizes some aspects of India’s economic growth performance after
independence.
Table 13: Annual Growth Rate: GDP and Sectoral Growth Rates
Year GDP Agriculture, forestry
and fishing Industry Manufacturing Services
1951-65 4.10 2.90 6.70 6.60 4.70
1965-81 3.20 2.10 4.00 3.90 4.30
1981-88 4.80 2.10 6.30 7.10 6.30
1988-06 6.30 3.40 6.50 6.80 7.80
2006-07 9.60 3.80 10.60 12.00 11.2
2007-08 9.00 4.50 8.10 8.80 10.7 Source: Panagariya (2008)
Table 14: Annual Growth Rates of per capita income

54
Year Per Capita NNP
1960-61 5.51
1970-71 2.20
1980-81 5.01
1990-91 2.75
2000-01 1.69
2007-08 8.07
2008-09 4.69
2009-10 6.76
2010-11 7.20
2011-12 4.66 Source: Handbook of Statistics of Indian Economy, RBI
Table 15: Growth of Saving and Investment Rates in India
Rate of Gross Domestic Saving Rate of Gross Domestic Capital Formation
1951-52 9.8 11.4
1960-61 11.6 14.3
1970-71 14.3 15.1
1980-81 17.8 19.2
1990-91 22.9 26
2000-01 23.7 24.3
2005-06 33.4 34.7
2006-07 34.6 35.7
2007-08 36.8 38.1
2008-09 32 34.3
2009-10 33.7 36.5
Source: Source: Handbook of Statistics of Indian Economy, RBI
India’s Development Strategy: Pitfalls In entirety India’s development strategy, faced three sets of problems which arose with
implementation. First, policy measures often were inferior ways of achieving stated goals.
This was mainly because the policies were often misguided, since economic principles were
not always well understood, at least by the policymakers. Quantitative controls, case-by-case
discretion for approvals, and outright prohibitions permeated all aspects of the economy,
including industry, agriculture and international trade and finance which started acting as
obstacles for effective decision making. Even when taxes and tariffs were used, so that the
price system and markets could do some of the work of resource allocation, there were often
multiple, arbitrarily high and non-transparent rates, which encouraged evasion and distorted
decision making. A major example of price distortion occurred with the exchange rate, which
was kept artificially high, contributing to a fulfillment of the attitude of export pessimism.
Competition policy was not applied in an economically rational manner and was, in any case,
undercut by the artificial restrictions placed on industrial capacity.
Second, the system of discretionary bureaucratic control created classic ‘vested interests’ that
prevented reform. Once policies that created distortions were in place, situations almost
invariably arose where there were beneficiaries of these distortions, through the economic
rents created. Customs officers and income tax officials became notorious for extracting
payments in return for ignoring punitive restrictions or tax rates, but all government
bureaucrats were put in positions where they had the potential to profit from the lawful or
unlawful exercise of their discretionary control. In many cases, politicians became eager

55
collaborators in, or even drivers of, this process to claim their share of the rents. Even in the
current liberalized regime, some of these problems remain. Further, policy restrictions and
entry barriers also created rents for private economic actors: industrial license holders,
middlemen in agricultural markets, licensed foreign exchange dealers, import license holders
and so on. These groups also developed interests in preserving the status quo. Indeed, there
was a long period after independence in which economic controls steadily increased, as more
and more groups and organizations sought to create rent-seeking opportunities.
Third, the short-run political logic of governing India often conflicted with long-term
economic rationality. India’s size and diversity required considerable attention to creating
winning political coalitions—in this respect, India is quite distinct from state-led
industrializers such as France, Germany or Japan. In India a system in which the government
occupied the commanding heights became a natural tool for seeking political advantage.
Examples include the spread of all kinds of subsidies including commitments of free electric
power and water for farmers. Essentially, some of these exercises in competitive populism
were often driven not by economic logic, however imperfectly applied, but by political
imperatives. Once the new interest groups were created as beneficiaries of the transfers or
economic rents, they made it difficult to reverse the process, thereby adversely impacting the
development strategy of India.

56
SECTION VI
India’s Development Strategy, Industrial Development and SOEs: Lessons for other
Countries
While India has demonstrated that it can grow at almost double digit rates, comparable to
those achieved by the economies of the East Asian ‘miracle’, it faces numerous challenges if
that growth is to be sustained for long enough to raise average levels of living comparable to,
say, South Korea and China. Human development indicators such as literacy, educational
attainment and infant mortality also show significant deficits, when comparisons are made to
other countries with similar income levels.
A clear danger is that the current pattern of skill-intensive growth will be accentuated.
Increasing inequality of income is paralleled by increasing regional inequality. These trends
can create political instability, or lead to growth that peters out, leaving a wealthy class
connected with the global market economy, and significant numbers of poor people.
Reductions in public investments in health, education and infrastructure, and tendencies for
the upper-income groups to effectively secede into gated communities and private transport
can accentuate this danger. Policy responses to this situation that re-introduce controls and
exacerbate rent seeking e.g., through expanded quotas in higher education, or the introduction
of quotas for private sector employment represent another threat to sustained high growth.
One of the features of the Indian development model was its ability to balance different
interests through formal democratic processes as well as informal political bargaining, albeit
at the cost of higher growth. The challenge now is to create a new social contract that softens
the growth-equity trade-off, so that both can be better achieved.
Agriculture remains one of the biggest challenges for India’s future development, though it
must be recognized that agricultural modernization cannot be a substitute for growth in
labour-intensive manufacturing. After the diffusion of the green revolution, which introduced
high-yielding varieties of several cereal crops, along with increased fertilizer use and
irrigation, agricultural growth has slowed. New investments are required throughout the
agricultural value chain, but these also require innovations in risk management and
adjustment assistance that have been slow to develop, especially for agricultural producers.
While rural development through road building, better telecommunications connections and
investments in health and education can help to create non-agricultural rural employment, it
remains the case that urban, industrial employment must increase dramatically. As
agricultural productivity increases, labour will be freed up and must be absorbed into industry
and services. Given the limitations of services as an employer of unskilled labour, Indian
policy reform must be geared towards creating the conditions for large-scale labour-intensive
manufacturing, for the domestic as well as the international market.
At the national level, the change in India’s growth rate and prospects, following policy
reforms that opened up the economy to foreign trade and investment and substantially
removed domestic industrial controls, seems to provide strong support for the view that
policy matters and it is a important lesson for the emerging and developing economies. It is
also plausible that some of the areas where India faces significant challenges, such as
agriculture and higher education, are precisely ones where reform has been almost non-
existent, leaving the old control regime with artificial scarcities and allocation distortions in
place from which other economies can learn.

57
India’s development has attracted worldwide attention particularly because this growth
has been pursuant to the wide range of economic reforms introduced in the early 1990s.
Many other developing economies also intensified liberalization during this period but were
unable to experience similar spurt in their economic growth. One of the distinctive feature of
Indian liberalization experience is the gradual and calibrated manner in which reforms were
introduced, especially with respect to external liberalization be it in the financial, agricultural
and industrial and sector. India embarked on the path of slow and steady liberalization and
still maintains high tariffs on many agricultural products and has also given limited access to
foreign investors in many sectors. Though the industrial sector grew fast especially post
liberalization it did not grew as fast as the services sector which India thereafter nurtured it
well. Since then, much of the GDP growth in India has been contributed by the services
sector.
India’s trade policy has also played a significant role in nurturing India’s exports during
the last two decades or so. In particular India’s trade policy gave a significant role to the
Indian manufacturing sector which is a important lesson not only for India but for other
developing economies. During 1980s the Indian trade policy was more towards promoting
exports, while the 1990s and 2000s saw more emphasis on import liberalization. The import
liberalization policy of India differed from many other developing countries considerably.
The import liberalization policy followed by India is described as cautious and sequential.
However, during liberalization India’s industrial policy changed form and became much
more pragmatic. Instead of planning inputs and outputs for each firm and each industry, the
government adopted indicative planning. However, it did not abandon instruments of
industrial policy instruments such as very high tariffs by international standards and
restrictions on portfolio and foreign direct investment. Today the Indian industrial policy has
not just been confined to upgrading the industrial structure and promoting its industrial
revolution in a broad sense, but has instead provided an overall integrated direction for the
development of the whole economy which is very important and a good strategy to be
adopted by other developing economies. The planning and industrial policy are well
embedded in the Indian political economy is a major advantage compared with some Latin
American countries and other developing economies who have no such heritage.
A main lesson to learn from India is the need to establish appropriate institutions to formulate
and promote industrial policy and that these need to win wide social acceptance. The optimal
industrial policy for other countries can be specified only by examining their past economic
history, the kind of economic constraints with which they are faced, and the global economic
environment, both current and prospective. Industrial policy should be concerned with
charting a long-term sustainable path for the economy that is both feasible and ambitious.
Regarding the takeaway for the other countries from the SOEs experience of India, it could
be pointed out that the infrastructure development and growth promoted by the SOEs in India
have paved the way for many other enterprises to establish themselves and contribute to the
growth of India. The SOEs filled up the entrepreneurial void through corporate action
preparing a fertile ground for the private financial initiative (PFI). This has resulted in the
decline of the public sector investment as a part of the total planned investments in India
allowing private sector to snatch, albeit in a small way, the commanding heights of the
economy. The SOEs in India adopted the public corporation model of organisation initially
but later the government went in for the company form of organisation. This was good from
the point of view of setting up a public sector organisation. However, eventually it robbed the

58
SOEs of their autonomy. In the beginning, it was good to set up enterprises under the various
ministries. However, this led to fragmentation of control and impeded autonomy. Many other
countries have brought all the SOEs under the umbrella of one ministry. The Indian model of
reforms in the SOEs is partial in the sense that the government does not divest its stake below
51 per cent. This has disallowed the disinvested enterprises to have a level playing field with
their counterparts in private sector. Many initiatives have been taken by the Government of
India in terms of introducing performance contracting system to improve the accountability in
the working of these agencies, and providing considerable financial leverage to the
management of SOEs for taking effective decision. Despite all these efforts being made by
the government, there are still performance challenges that the SOEs are facing in terms of
inadequate systems, processes, technology, organisational structure, building up strategic
vision, enhancing competitiveness, freeing boards from the clutches of the government by
handing down a proper ownership policy and setting an appropriate performance culture are
the key for any major improvements. Cultural and mindset aspects are the key for any success
in this direction. Pushing performance culture and blending it with the psyche is a critical
aspect not only for India but also for other countries. The Indian model of the SOEs has been
different as compared to the other models of the SOEs adopted in several other countries. In
that they have to perform as a part of the mixed economy and compete within, with private
sector and there counterparts in other countries and yet they could continue to have their
identity as the SOEs. The Indian model of the SOEs has created inter se competition among
the SOEs by classifying them in different categories such as mini-ratnas, navratnas and
maharatnas. The SOEs in India are subjected to regulation the same way the private sector
enterprises are regulated.
To conclude, the SOEs have played a pivotal role in India’s economic development. In the
liberalised economic regime and in line with the global policy and practices in respect of
economic development, the role and functioning of these enterprises has undergone a
significant transformation yet they continue to play a vital role in India’s socio-economic
development. India’s experience with the SOEs as a part of its development strategy and
industrial policy clearly points out that given the requisite autonomy, these enterprises can
continue to make significant contribution.

59
References:
1. Accelerating public private partnerships in India – FICCI and Ernst & Young report-
2012.
2. Agrawal, A N (1995). Indian Economy: Problems of development and planning. pune:
Wishwa Prakashan.
3. Ahluwalia, I.J. (1991) Productivity and Growth in Indian Manufacturing, Oxford
University Press, Delhi.
4. Asher, Manshi, and Yamini Atmavilas. 2010. “Special Economic Zones: The New ‘Land’
Mines”. In Hari Mohan Mathur, ed., Resettling Displaced People: Policy and Practice in
India, 317–35. Routledge: Delhi.
5. Baldev Raj Nayar, (2001) Globalization and Nationalism: The Changing Balance Of
India's Economic Policy, 1950–2000, Sage, New Delhi
6. Bosworth, B., S. M. Collins, and A. Virmani (2007). ‘Sources of Growth in the Indian
Economy’. In S. Bery, B. Bosworth and A. Panagariya (eds), India Policy Forum 2006-
07. New Delhi: Sage Publications.
7. Economic Survey, various issues, Ministry of Finance, Govt. of India.
8. Faster Sustainable and More Inclusive Growth, An Approach to Twelfth five Year Plan-
Planning Commission of India-2011.
9. Government of India Handbook of Industrial Policy and Statistics (Various Issues), Office
of Economic Adviser, Ministry of Commerce and Industry. New Delhi.
10. Jalal Alamgir, (2008) India's Open-Economy Policy: Globalism, Rivalry, Continuity,
Routledge, London and New York.
11. Khan, Saeed Ahmed. 2008. “India’s SEZ-Business Zones Development: Economic
Performance, Social/Environmental Impacts” In Audhinarayana Vavili, ed., Special
Economic Zones: Present and Future. Hyderabad: ICFAI Press. Available online at
http:// ssrn.com/abstract=1292195.
12. L. N. Dash (2000). World bank and economic development of India. APH Publishing.
13. Mishra, S.K and Puri, V.K (2010), Indian Economy-its development experience, HPH,
Mumbai.
14. Panagariya, A. (2005). ‘The Triumph of India’s Market Reforms: The Record of the
1980s and 1990s’. Policy Analysis, 7 (554). Washington, DC: CATO Institute.
15. Panagariya, A. (2006). ‘India and China: Trade and Foreign Investment’. SCID Working
Paper 302. Stanford: Stanford Center for International Development.
16. Panagariya, A. (2008). India: The Emerging Giant. New York: Oxford University Press.
17. Planning Commission (1997). "A Background Note on Gadgil Formula for distribution of
Central Assistance for State Plans".
18. Planning Commission, Government of India: Five Year Plans.
19. Public Private Partnership as an alternative service delivery option: A Multiple Case
Study of the Health Sector in South Africa – Kosice Jacobus Haarhoff- 2008
20. Public Private Partnership in Power Sector: A Focus on Ultra Mega Power Projects-
Rajesh Gangakhedkar, R K Mishra – Journal Infrastructure Development – June 2012.
21. Reserve Bank of India (2008). Macroeconomic and Monetary Developments (various
issues), RBI.
22. Rodrik, D. (2006). ‘Industrial Development: Stylized Facts and Policies’. In D. O’Connor
(ed.), Industrial Development for the 21st Century: Sustainable Development
Perspectives. New York: UN-DESA, 7-28.
23. Singh, N. (2006). ‘Services-Led Industrialization in India: Assessment and Lessons’. In D.
O’Connor (ed.), Industrial Development for the 21st Century: Sustainable Development
Perspectives. New York: UN-DESA, 235-91.22
24. www.pppindiadatabase.com