Role of PKCγ cleavage and autophagy in protein aggregation ... MSc_CPereira... · membros,...
74
DEPARTAMENTO DE CIÊNCIAS DA VIDA FACULDADE DE CIÊNCIAS E TECNOLOGIA UNIVERSIDADE DE COIMBRA Role of PKCγ cleavage and autophagy in protein aggregation and clearance: 2011 Spinocerebellar ataxia type 14 as a neurodegeneration model Maria da Conceição Moutinho Pedroso Pereira
Transcript of Role of PKCγ cleavage and autophagy in protein aggregation ... MSc_CPereira... · membros,...
DEPARTAMENTO DE CIÊNCIAS DA VIDA
FACULDADE DE CIÊNCIAS E TECNOLOGIA UNIVERSIDADE DE COIMBRA
Role of PKCγ cleavage and autophagy in protein aggregation and clearance:
2011
Spinocerebellar ataxia type 14 as a neurodegeneration model
Maria da Conceição Moutinho Pedroso Pereira
DEPARTAMENTO DE CIÊNCIAS DA VIDA
FACULDADE DE CIÊNCIAS E TECNOLOGIA UNIVERSIDADE DE COIMBRA
Role of PKCγ cleavage and autophagy in protein aggregation and clearance:
2011
Dissertação apresentada à Universidade de Coimbra para cumprimento dos requisitos necessários à obtenção do grau de Mestre em Biologia Celular e Molecular, realizada sob a orientação científica da Professora Doutora Isabel da Conceição Moreira Pereira Alonso (Universidade do Porto) e do Professor Doutor Carlos Jorge Bandeira Alves Duarte (Universidade de Coimbra)
Spinocerebellar ataxia type 14 as a neurodegeneration model
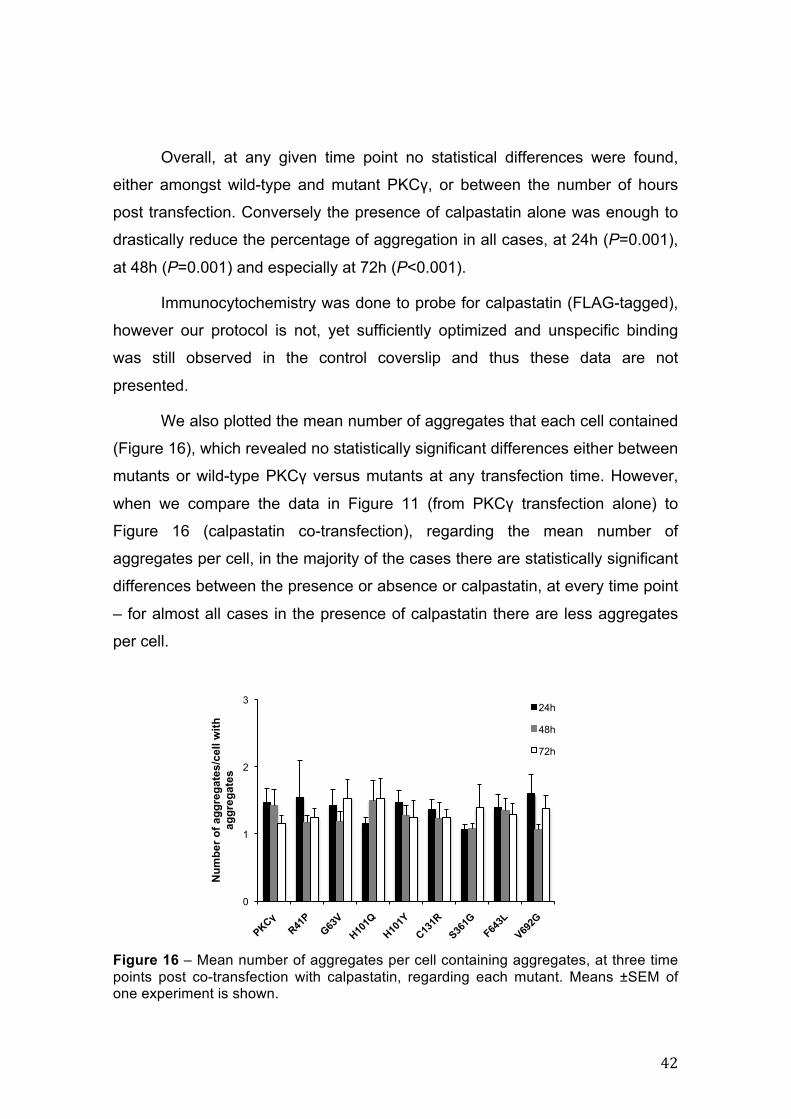
Maria da Conceição Moutinho Pedroso Pereira
Table of Contents
Abreviations........................................................................................................ I
Abstract............................................................................................................ IV
Sumário ............................................................................................................. V
1. Introduction ...................................................................................................1
1.1. Neurodegeneration............................................................................................ 1
1.2. Spinocerebellar ataxias .................................................................................... 2
1.2.1. Spinocerebellar ataxia type 14 ..................................................................... 3
1.3. The PKC family .................................................................................................. 4
1.3.1. PKC building blocks...................................................................................... 6
1.3.2. PKC expression profile ................................................................................. 7
1.3.3. PKC life cycle: control by phosphorylation.................................................... 7
1.3.4. PRKCG/PKCγ............................................................................................... 9
1.4. The calpain system ......................................................................................... 11
1.5. Autophagy........................................................................................................ 13
1.5.1. Macroautophagy ......................................................................................... 14
1.5.2. Chaperone-mediated autophagy ................................................................ 16
2. Objectives ....................................................................................................19
3. Material and Methods..................................................................................20
3.1. DNA constructs ............................................................................................... 20
3.2. Site-directed mutagenesis.............................................................................. 20
3.3. Plasmid DNA isolation .................................................................................... 21
3.4. Direct sequencing ........................................................................................... 22
3.5. Cell culture and transfection .......................................................................... 23
3.6. RNA extraction................................................................................................. 24
3.7. Real-Time PCR................................................................................................. 25
3.8. Protein extracts ............................................................................................... 26
3.9. Western blotting .............................................................................................. 26
3.10. Immunofluorescence assays ....................................................................... 27
3.11. Aggregate quantification .............................................................................. 28
3.12. Cell viability assay......................................................................................... 28
3.13. Statistical analysis ........................................................................................ 28
4. Results .........................................................................................................30
4.1. PKCγ wild-type and mutant cell line characterization ................................. 30
4.1.1. PKCγ expression in SH-SY5Y cells............................................................ 31
4.1.2. Cell survival in wild-type and mutant PKCγ cell lines ................................. 33
4.1.3. Wild-type and mutant PKCγ aggregate formation ...................................... 34
4.2. Calpain cleavage: influence on pathogenesis.............................................. 39
4.2.1. Calpastatin expression levels ..................................................................... 39
4.2.2. Impact of calpastatin expression in cell survival ......................................... 40
4.2.4. Impact of calpastatin in aggregation formation ........................................... 41
4.3. Activation of the macroautophagy pathway ................................................. 43
4.3.1. Impact of rapamycin in cell survival ............................................................ 43
4.3.2. Effect of rapamycin in aggregate formation ................................................ 44
4.4. PKCγ: a possible CMA substrate................................................................... 45
4.5. SH-SY5Y transgenic wild-type and mutant PKCγ cell lines ........................ 46
5. Discussion ...................................................................................................48
5.1. PKC gamma aggregation................................................................................ 48
5.2. Calpain inhibition in SCA14............................................................................ 51
5.3. Autophagy activation and aggregate clearance........................................... 53
5.3.1. Protein kinase C gamma as a possible substrate for CMA ........................ 54
6. Conclusions.................................................................................................55
8. References ...................................................................................................58
Acknowledgments...........................................................................................64
I
Abreviations
χ2 – Chi-square
a.u. – Arbitrary units
ACTB – β-actin gene
AMPAR – 2-amino-3-(5-methyl-3-oxo-1,2- oxazol-4-yl) propanoic acid receptor
ANOVA – ANalysis Of VAriance
aPKC – Atypical protein kinase C
Atg – Autophagy related protein
CAST – Calpastatin gene
CHIP – Co-chaperone carboxyl terminus of Hsp70-interacting protein
CID – Calpain inhibitory domain
CMA – Chaperone-mediated autophagy
cPKC – Conventional protein kinase C
Ct – Threshold cycle
DAG – Diacylglycerol
DEPC – Diethylpyrocarbonate
DMEM - Dulbecco's Modified Eagle Medium
DMSO - Dimethyl sulfoxide
DNA – Deoxyribonucleic acid
EGF - Epidermal growth factor
FBS – Fetal bovine serum
GABAA – γ-aminobutyric acid type A
GFP – Green fluorescent protein
h – hour
Ham – Ham's F-12 tissue culture medium
II
HBSS – Hank's Balanced Salt Solution
LAMP-2A
LB – Luria Bertani medium
LTP – Long-term potentiation
MARCKS - Myristoylated alanine-rich C kinase substrate
min – Minute
mRNA – Messenger ribonucleic acid
NMDAR – N-methyl-D-aspartic acid receptor
nPKC – Novel protein kinase C
PAR6-CDC42 - Partitioning defective 6 factor and cell division cycle-42 protein
PBS-T – Phosphate buffered saline-0.1% Tween20
PDK-1 - Phosphoinositide-dependent kinase-1
PE – phosphatidylethanolamine
PI3K - Class III phosphatidylinositol kinase
PKA – Protein kinase A
PKB – Protein kinase B
PKCγ – Protein kinase C isoform gamma
PKM – Protein kinase C permanently active fragment
PKN – PKC-related kinase
PM – Powder milk
PMA – Tumor promoter phorbol 12-myristate 13-acetate
PRKCG – Protein kinase C isoform gamma gene
PVDF – Polyvinylidene fluoride
R.F.U. – Relative fluorescence units
III
RhoA-GTPase - Ras homolog type A, guanine triphosphate, hydrolyzing
enzime
RIPA – Radioimmunoprecipitation buffer
RNA – Ribonucleic acid
rpm – rotations per minute
SCA – Spinocerebellar ataxia
SDS – Sodium dodecyl sulfate
SEM – Standard error of the mean
TPA - Tumor promoter 12-O-Tetradecanoylphorbol 13-acetate
UVRAG – UV radiation resistance associated gene
IV
Abstract
Neurodegeneration affects specific subtypes of neurons in particular
functional anatomic systems, causing a heterogeneous clinical and pathological
expression. Signal transduction deregulation, alteration of calcium homeostasis
along with quality control systems failing often contribute to, or even directly
underline these neurodegenerative processes. Although their significance is still
debated, protein aggregates or other atypical protein assemblies seem to be
both the common feature and strongly implicated in disorders like
spinocerebellar ataxias (SCAs), Huntington’s, Parkinson’s or Alzheimer’s
disease. The SCAs compose a group of heterogeneous genetic disorders both
clinical and genetically, mainly characterized by progressive degeneration of the
cerebellum. Clinically, the patients show imbalance, progressive gait and limb
ataxia, dysarthria and dysphagia. Missense mutations in the brain-specific
gamma isoform of protein kinase C (PKCγ) are the cause of spinocerebellar
ataxia type 14 (SCA14), and have been shown to be prone to aggregation.
SH-SY5Y cells were used to generate the cellular SCA14 models, and
PKCγ expression was assessed through western-blot, real-time PCR (for
mRNA expression) and immunocytochemistry. In order to study the influence of
PKCγ proteolysis by calpains and macroautophagy activation on PKCγ
aggregation, calpain inhibition was achived through calpastatin co-transfection,
and mTOR inhibition by treatment with rapamycin.
Here, we show the successful establishment and characterization of two
cellular models for SCA14, one transient and another stably expressing both
wild-type and mutant PKCγ. We demonstrate, for the first time, that calpain
inhibition significantly reduces aggregate formation and increases cell survival,
pointing to a role of PKCγ proteolysis in protein turn-over and aggregation. Our
preliminary data also point for a wide role of rapamycin in PKCγ aggregate
clearance, and further discuss the possibility of both these ameliorating effects
being mediated and converge in autophagy activation, as well as the
importance of the C1 regulatory domain in aggregate formation.
Keywords: PKCγ, Aggregation, Calpain, Autophagy
V
Sumário
A neurodegeneração afecta conjuntos particulares de neurónios em
sistemas anatómicos e funcionais específicos, dando origem a uma expressão
clínica e patológica heterogénea. A estes processos, estão muitas vezes
associados ou mesmo subjacentes, fenómenos que envolvem desregulação da
transdução de sinal, alterações na homeostase do cálcio assim como falha dos
sistemas de controlo de qualidade. Embora, o seu papel e importância ainda
sejam muito debatidos, os agregados proteicos e outros conjuntos atípicos de
proteínas, são características comuns e fortemente implicadas em várias
doenças como ataxias espinocerebolosas (SCAs), e doenças de Huntinton,
Parkinson e Alzheimer. As SCAs compreendem um grupo heterogénio de
doenças genéticas tanto do ponto de vista clínico como genético,
characterizadas degeneração progressiva do cerebelo. Clinicamente, os
doentes apresentam desequilíbrio, ataxia progressiva da marcha e dos
membros, disartria e disfagia. Mutações pontuais na isoforma gama da
proteína cinase C (PKCγ), causam ataxia espinocerebolosa do tipo 14
(SCA14), tendo já sido demonstrado que têm a capacidade de agregar.
A linha SH-SY5Y foi utilizada para gerar modelos celulares de SCA14, e
a expressão da PKCγ foi avaliada através de western-blot, PCR em tempo real
(para expressão de mRNA) e imunocitiquímica. Para estudar a influencia da
proteólise da PKCγ pelas calpaínas, e a activação da macroautofagia sobre a
agregação da PKCγ, foram realizadas co-transfecções com calpastatina e o
mTOR foi inibido através do tratamento com rapamicina.
Aqui, mostramos a caracterização de dois modelos celulares para
SCA14, um com expressão transiente e outro com expressão estável de PKCγ
normal e mutada. Pela primeira vez, demonstramos que a inibição das
calpaínas leva a uma redução significativa da formação de agregados,
aumentando a sobrevivência celular, o que aponta para um papel importante
da degradação da PKCγ no turn-over proteico e agregação. Os nossos dados
preliminares também apontam para um efeito alargado da rapamicina sobre a
remoção dos agregados, sendo que vamos mais além, e discutimos a

VI
possibilidade de ambos os efeitos serem mediados, e convergirem, na
activação da autofagia, assim como a importância que o domínio regulador C1
tem, na formação de agregados.
1
1. Introduction
1.1. Neurodegeneration
As a result of an increased life span, neurodegenerative disorders are
the current major contributors to disability and disease, posing as such, a major
concern for both healthcare practitioners and research scientists of the 21st
century [1].
Neurodegeneration affects neuronal activities at different levels. It can
disrupt molecular pathways, synapses, neuronal subpopulations and local
circuits in specific brain regions, as well as higher-order functional anatomic
systems, causing a heterogeneous clinical and pathological expression.
Abnormal network activities may result in a vicious cycle, further impairing the
integrity and functions of neurons and synapses, for example, through aberrant
excitation or inhibition. Among others, excitotoxicity, inflammation and oxidative
stress are some of the mechanisms that may be involved in these diseases.
Progressive neuronal loss is the hallmark of neurodegenerative disorders,
however some neurological impairment may be a reflection of dysfunction
rather than neuronal loss [2].
Here, abnormal protein assemblies seem to play an important role, by
triggering vicious cycles of aberrant neuronal activity, compensatory alterations
in neurotransmitter receptors and related signalling pathways, that eventually
lead to synaptic deficits and disintegration of neural networks, which in turn,
result in neuronal function failure [2].
Another feature of these disorders is the dynamic chronicity, which is
intimately related with the “degeneracy” of the neuronal system. This chronicity
allows the brain to engage in compensatory mechanisms which include, for
example, increasing neuronal activity in the remaining undamaged region or
drawing other brain regions into the network that are otherwise not usually
involved. Nonetheless, over time, these compensatory mechanisms ultimately
fail, and some of them, may even turn out part of the problem by becoming
pathogenic themselves [2].
2
Although their significance is still debated, protein aggregates or other
atypical protein assemblies seem to be both the common feature and strongly
implicated in several neurodegenerative disorders, like spinocerebellar ataxias
(SCAs), Huntington’s, Parkinson’s or Alzheimer’s disease [2,3]. These
disorders, also known as proteinopathies, include various types of aggregates
with different cellular localization, where the proteins can be predominantly
aggregated in the cytosol, in the nucleus, in the endoplasmic reticulum, or be
secreted and accumulate extracellularly [4]. Although, generally, the large
aggregates themselves are not considered toxic, it appears that the capacity to
aggregate correlates with toxicity.
1.2. Spinocerebellar ataxias
The dominantly inherited ataxias, also known as spinocerebellar ataxias
(SCAs), comprise a heterogeneous group of neurodegenerative disorders
mainly characterized by slowly progressive cerebellar degeneration, often
accompanied by changes in the brainstem or other brain regions. Clinically
SCAs show progressive cerebellar ataxia of gait and limbs, associated or not
with ophthalmoplegia, pyramidal and extrapyramidal signs, dementia,
pigmentary retinopathy and peripheral neuropathy [5,6]. Epidemiological data
indicates that the SCAs prevalence varies between 1 and 5/100,000 inhabitants
[6], with age at onset between the third and fifth decade of life, although there
are cases where either earlier or later onset has also been observed [5].
Currently, SCAs can be grouped in three major genetic classes. The first
group includes SCA1-3, SCA6, SCA7, SCA17 and dentatorubropallidoluysian
atrophy (DRPLA), which together with Huntington disease and spinobulbar
muscular atrophy compose the polyQ disorders. They are caused by CAG
repeat expansions that encode a pure repeat of the amino acid glutamine in the
disease protein, that together account for more than 50% of all cases. The
second group – non-coding repeat expansion ataxias – includes SCA8, SCA10
and SCA12 that are due to repeat expansions falling outside of the protein-
3
coding region of the respective disease genes. Finally, the third group
comprises SCAs that instead of being caused by repeat expansions are due to
conventional mutations (missense, nonsense, deletions, insertions, duplications
or splice site mutations) in specific genes. The overall most important common
feature is, perhaps, the pattern of neurodegeneration that is reflected in the
clinical traits, although their distinction heavily relies on the extracerebellar signs
of brain involvement [7].
In this context, understanding the pathogenetic mechanisms underlying
neurodegeneration in spinocerebellar ataxias would help to identify potential
therapeutic targets and ultimately facilitate drug discovery [5].
1.2.1. Spinocerebellar ataxia type 14
Spinocerebellar ataxia type 14 (SCA14), first described in a Japanese
family by Yamashita and colleagues (2000) [8], is an autosomal dominant
neurodegenerative disorder characterized by slowly progressive cerebellar
dysfunction including gait and limb ataxia, dysarthria and abnormal eye
movements, with an age at onset ranging from early to late adulthood [9]. Later,
in 2003, Chen and colleagues associated for the first time mutations in the
gamma isoform of protein kinase C (PKCγ) with dominant non-episodic
cerebellar ataxia [10]. SCA14 is usually compatible with a normal life span,
although affected individuals can become wheelchair-bound later in life [7].
Since PKCγ has a somewhat well characterized normal function, in
integrating signal transduction, abnormalities in these pathways seem to be
central for this pathology.
Although deletion of PKCγ (knock-out) produces apparently normal
viable mice (mild phenotype), behavioral analysis revealed that these animals
have slight ataxia, modest learning and memory impairment [11], along with
some motor incoordination [12] that may relate to defects in the elimination of
multiple climbing fiber innervation of Purkinje cells [13], and even though
synaptic transmission appears to be normal, long-term potentiation (LTP) is
4
impaired [11], and they also show reduced pain sensitivity [14]. In contrast, the
recently described PKCγ H101Y transgenic mouse model, presents a more
severe phenotype when compared to the previous model [15].
Mutant PRKCG gene products are less stable than normal protein,
leading to abnormal activation patterns, altered membrane targeting and
enhanced activity [9,16]. Actually, more than 80% of the disease-causing
mutations that have been previously described are in the regulatory portion of
PKCγ, more precisely in the C1 domain, and furthermore, no truncating
mutations have been found so far, so that it is speculated that the SCA14
phenotype resulted from gain-of-function mechanisms rather than
haploinsufficiency [17]. However, other authors have shown that gain-of-funtion
may only be part of the mechanism and that haploinsufficiency and loss-of-
function mechanisms may also contribute to cell death in SCA14 [18,19].
1.3. The PKC family
The PKC family, a class of highly regulated Ser/Thr protein kinases
typically localized near the cellular membrane, is arising as an important player
for higher-level signal organization control. This family of largely conserved
proteins represents about 2% of the human kinome [20], and not only can they
be recruited to scaffolds along other transducers, but can also control the
behavior of the scaffolded complexes, through the promotion of their
assembly/disassembly or subcellular localization without necessarily being part
of the complex itself and meanwhile be subject to regulation through
recruitment themselves [21,22].
This complex family ranges from a single isoform in budding yeast (S.
cerevisiae) to 5 isoforms in C. elegans and 12 in mammals [20,23].
Due to biochemical properties and sequence homology, PKC isoforms
are divided into four subfamilies: conventional PKCs (also called classical),
novel PKCs, atypical PKCs and PKC-related kinases (PKNs) [23,24].
5
Conventional PKCs (cPKCs) are the most well known and studied group,
comprising the α, βI, βII and γ isoforms. This group is activated through DAG
and phospholipid binding to their C1 domains, that shifts the affinity of this
protein for Ca2+ into its physiological range, thus binding phospholipids to their
C2 domains in a Ca2+-dependent manner [25]. The tumor-promoting phorbol
ester PMA (or TPA) is also a cPKC activator, that eliminates the requirement for
DAG and increases the affinity for Ca2+ [26].
The novel PKCs (nPKCs) group includes the δ, ε, η and θ isoforms that
differ from the previous ones by being Ca2+-insensitive, though they can still be
activated by DAG/phorbol esters and phospholipids.
The atypical PKCs (aPKCs), ε and ι, are both Ca2+ (like the novel) and
DAG/PMA-insensitive [27], although they are instead allosterically activated by
interaction with the partitioning defective 6 (PAR6)-CDC42 complex, which is
involved in determining cell polarity [28].
The last group consists of at least three known isotypes of PKC-related
kinases (PKNs1-3), and similar to aPKCs they are both insensitive to Ca2+ and
DAG/phorbol esters [29], while having an allosteric mode of regulation through
binding of active RhoA-GTPases [30,31].
In addition to these specific inputs, other regulatory processes influence
the function of PKCs. These include the covalent modification (more precisely
phosphorylation) of PKCs and their interaction with specific binding partners,
which can modulate the requirements for allosteric inputs or in some cases
bypass them all together, as seen for some scaffold interactions [21].
The different combinations between the conserved kinase domain and a
series of differentially activated regulatory domains confer a modular nature to
PKC that allows for its action to have spatial and temporal resolution. It also lets
PKC activity to be directed by various inputs, including localized (membrane
limited) second messenger production and interaction with membrane –
anchored small G proteins, scaffolds and other accessory proteins. As a result
the PKC family is centrally involved in the spatial control of signal transduction
in cells [20].
6
Assigning specific functions to several members of this kinase class has
been a challenging task not only because of its sizeable number, but also due
to its large overlapping substrate specificities. Nevertheless, mouse knockout
models have suggested a certain degree of redundancy, even though
increasing evidence proposes individual, non-redundant, although subtle roles
for several of these family members [32].
1.3.1. PKC building blocks
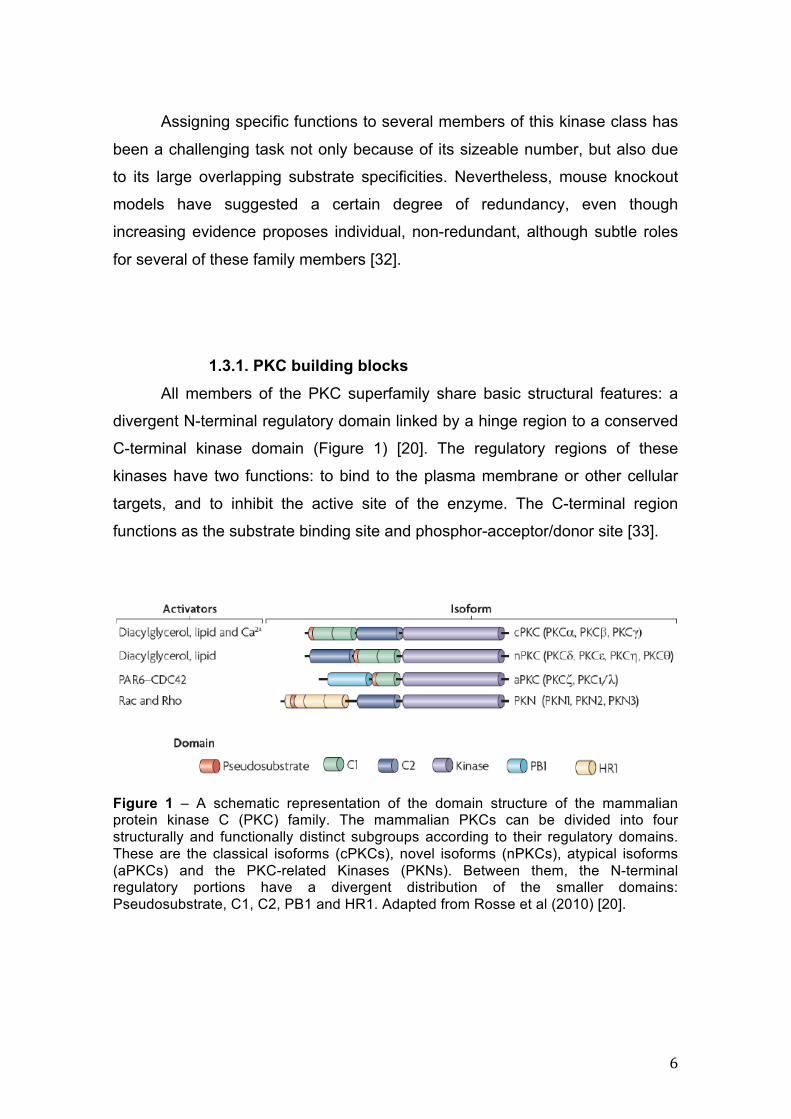
All members of the PKC superfamily share basic structural features: a
divergent N-terminal regulatory domain linked by a hinge region to a conserved
C-terminal kinase domain (Figure 1) [20]. The regulatory regions of these
kinases have two functions: to bind to the plasma membrane or other cellular
targets, and to inhibit the active site of the enzyme. The C-terminal region
functions as the substrate binding site and phosphor-acceptor/donor site [33].
Figure 1 – A schematic representation of the domain structure of the mammalian protein kinase C (PKC) family. The mammalian PKCs can be divided into four structurally and functionally distinct subgroups according to their regulatory domains. These are the classical isoforms (cPKCs), novel isoforms (nPKCs), atypical isoforms (aPKCs) and the PKC-related Kinases (PKNs). Between them, the N-terminal regulatory portions have a divergent distribution of the smaller domains: Pseudosubstrate, C1, C2, PB1 and HR1. Adapted from Rosse et al (2010) [20].
7
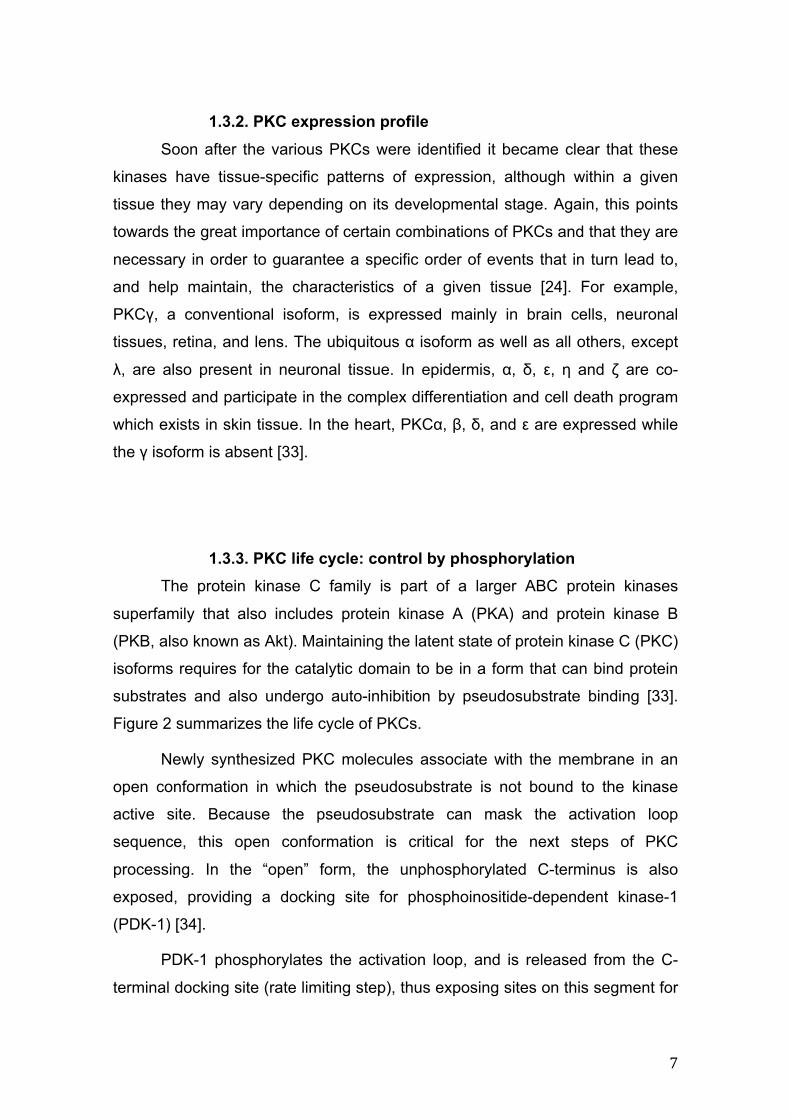
1.3.2. PKC expression profile
Soon after the various PKCs were identified it became clear that these
kinases have tissue-specific patterns of expression, although within a given
tissue they may vary depending on its developmental stage. Again, this points
towards the great importance of certain combinations of PKCs and that they are
necessary in order to guarantee a specific order of events that in turn lead to,
and help maintain, the characteristics of a given tissue [24]. For example,
PKCγ, a conventional isoform, is expressed mainly in brain cells, neuronal
tissues, retina, and lens. The ubiquitous α isoform as well as all others, except
λ, are also present in neuronal tissue. In epidermis, α, δ, ε, η and ζ are co-
expressed and participate in the complex differentiation and cell death program
which exists in skin tissue. In the heart, PKCα, β, δ, and ε are expressed while
the γ isoform is absent [33].
1.3.3. PKC life cycle: control by phosphorylation The protein kinase C family is part of a larger ABC protein kinases
superfamily that also includes protein kinase A (PKA) and protein kinase B
(PKB, also known as Akt). Maintaining the latent state of protein kinase C (PKC)
isoforms requires for the catalytic domain to be in a form that can bind protein
substrates and also undergo auto-inhibition by pseudosubstrate binding [33].
Figure 2 summarizes the life cycle of PKCs.
Newly synthesized PKC molecules associate with the membrane in an
open conformation in which the pseudosubstrate is not bound to the kinase
active site. Because the pseudosubstrate can mask the activation loop
sequence, this open conformation is critical for the next steps of PKC
processing. In the “open” form, the unphosphorylated C-terminus is also
exposed, providing a docking site for phosphoinositide-dependent kinase-1
(PDK-1) [34].
PDK-1 phosphorylates the activation loop, and is released from the C-
terminal docking site (rate limiting step), thus exposing sites on this segment for
8
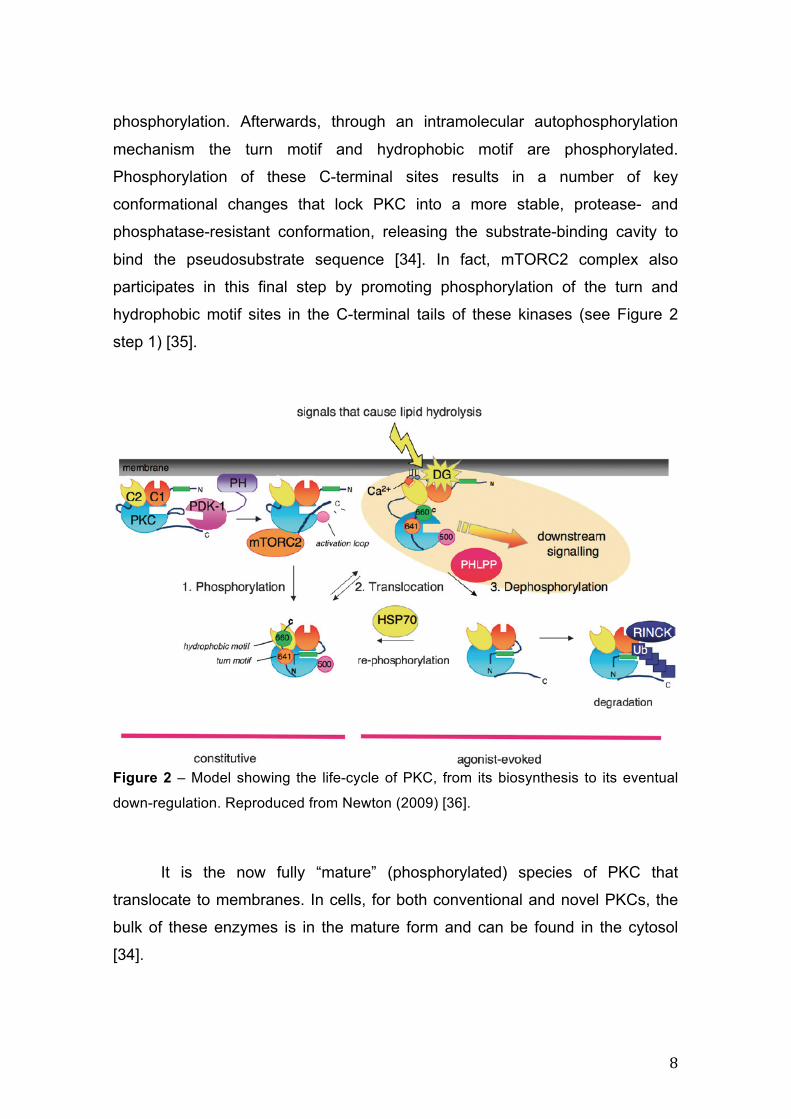
phosphorylation. Afterwards, through an intramolecular autophosphorylation
mechanism the turn motif and hydrophobic motif are phosphorylated.
Phosphorylation of these C-terminal sites results in a number of key
conformational changes that lock PKC into a more stable, protease- and
phosphatase-resistant conformation, releasing the substrate-binding cavity to
bind the pseudosubstrate sequence [34]. In fact, mTORC2 complex also
participates in this final step by promoting phosphorylation of the turn and
hydrophobic motif sites in the C-terminal tails of these kinases (see Figure 2
step 1) [35].
Figure 2 – Model showing the life-cycle of PKC, from its biosynthesis to its eventual
down-regulation. Reproduced from Newton (2009) [36].
It is the now fully “mature” (phosphorylated) species of PKC that
translocate to membranes. In cells, for both conventional and novel PKCs, the
bulk of these enzymes is in the mature form and can be found in the cytosol
[34].
9
PKC is activated when second messengers and/or allosteric effectors
bind to its regulatory domain, usually at the plasma membrane. This disrupts
the docking of the regulatory kinase domain, which displaces the bound
pseudosubstate region from the active site, allowing the activation of PKC (see
step 2) [37].
The active species of PKC are highly sensitive to dephosphorylation, and
are usually found in the detergent-insoluble fraction of cells where they
eventually suffer proteolysis (see step 3). A study has shown that the
dephosphorylated turn motif provides a specific binding site for the molecular
chaperone Hsp70 that prevents the association with the detergent-insoluble cell
fraction. This dephosphorylation-dependent binding of Hsp70 stabilizes PKC
and allows it to become rephosphorylated and cycle back into the pool of
functional PKC [38].
Note that the phosphorylation step is constitutive, and the translocation
and dephosphorylation are agonist-evoked. PKC that is not rescued by Hsp70
accumulates in a detergent-insoluble cell fraction, is ubiquitinated by E3 ligases
such as the recently discovered RINCK and then degraded [36].
1.3.4. PRKCG/PKCγ The human PRKCG gene maps to the 19q13.4 locus, and comprises 18
exons along an approximate length of 25.44 kb [39]. The full-length 3.133 kb
transcript encodes PKCγ, a protein with 697 amino acids mostly expressed in
the cerebellum, hippocampus and cerebral cortex [39]. During rat development,
PKCγ expression is low at birth and progressively increases up to 2-3 weeks (in
contrast to other conventional isoforms) which suggests an important role of
PKCγ in synaptic formation (Figure 3) [40].
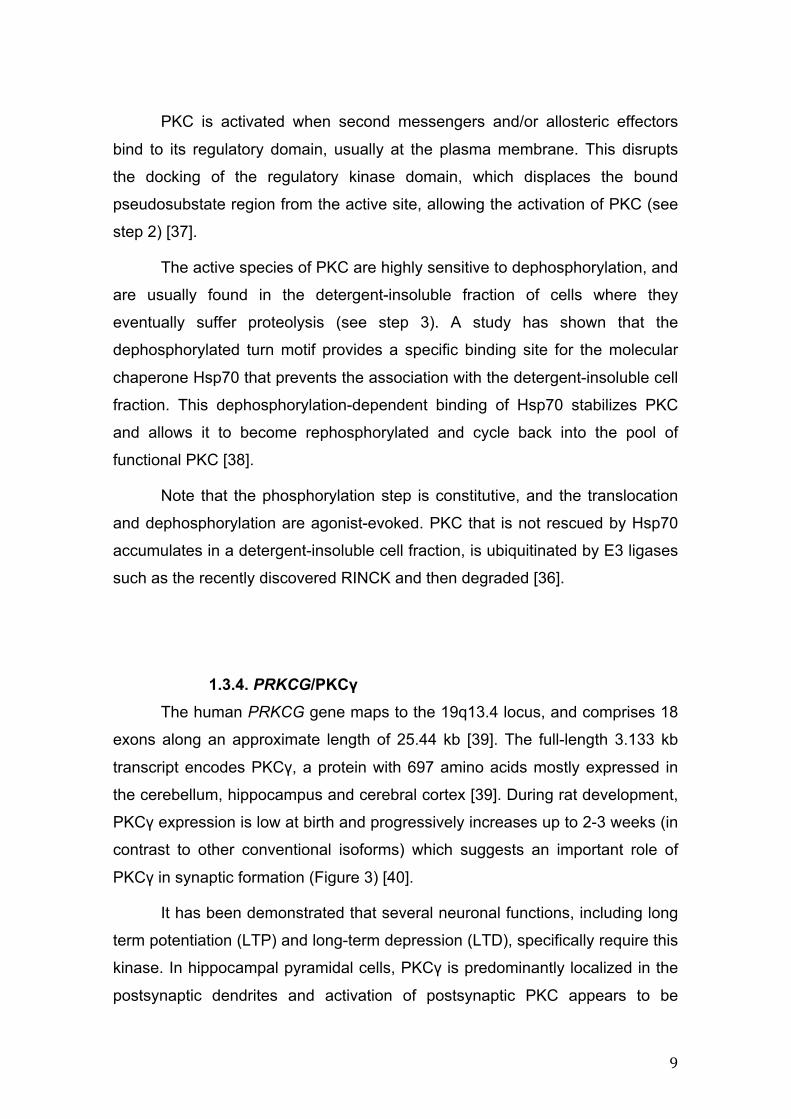
It has been demonstrated that several neuronal functions, including long
term potentiation (LTP) and long-term depression (LTD), specifically require this
kinase. In hippocampal pyramidal cells, PKCγ is predominantly localized in the
postsynaptic dendrites and activation of postsynaptic PKC appears to be
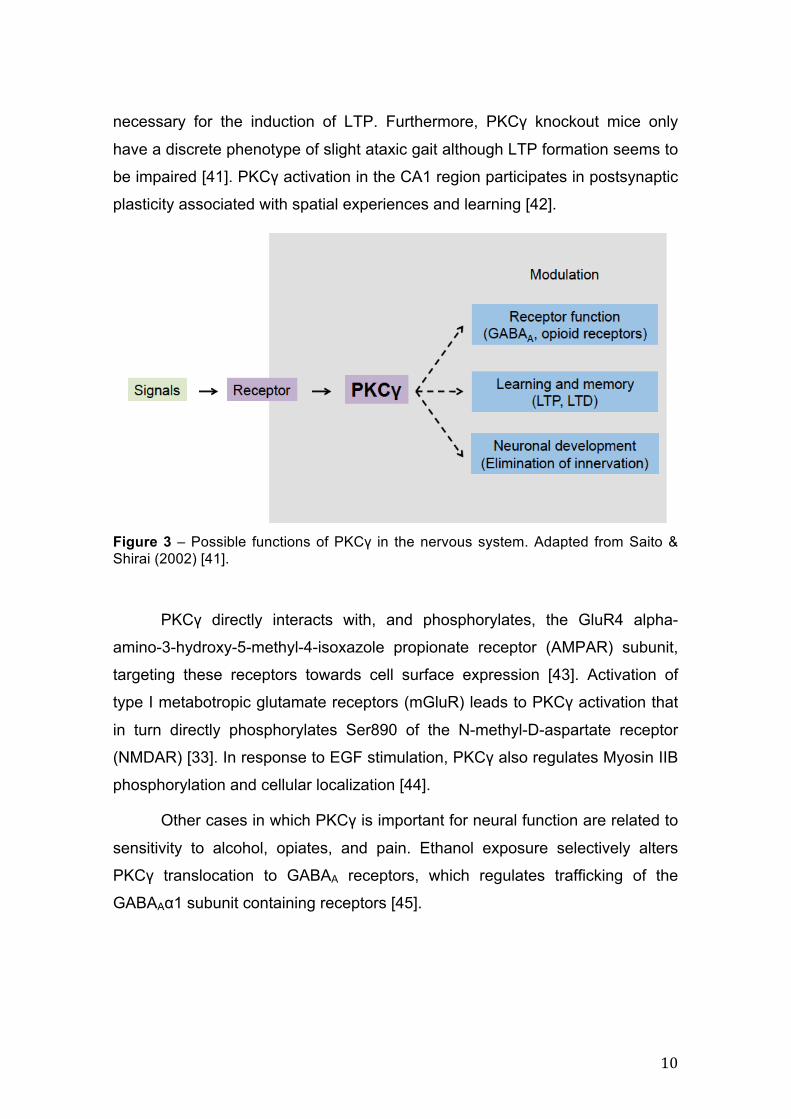
10
necessary for the induction of LTP. Furthermore, PKCγ knockout mice only
have a discrete phenotype of slight ataxic gait although LTP formation seems to
be impaired [41]. PKCγ activation in the CA1 region participates in postsynaptic
plasticity associated with spatial experiences and learning [42].
Figure 3 – Possible functions of PKCγ in the nervous system. Adapted from Saito & Shirai (2002) [41].
PKCγ directly interacts with, and phosphorylates, the GluR4 alpha-
amino-3-hydroxy-5-methyl-4-isoxazole propionate receptor (AMPAR) subunit,
targeting these receptors towards cell surface expression [43]. Activation of
type I metabotropic glutamate receptors (mGluR) leads to PKCγ activation that
in turn directly phosphorylates Ser890 of the N-methyl-D-aspartate receptor
(NMDAR) [33]. In response to EGF stimulation, PKCγ also regulates Myosin IIB
phosphorylation and cellular localization [44].
Other cases in which PKCγ is important for neural function are related to
sensitivity to alcohol, opiates, and pain. Ethanol exposure selectively alters
PKCγ translocation to GABAA receptors, which regulates trafficking of the
GABAAα1 subunit containing receptors [45].
11
1.4. The calpain system
The calpain family comprises a group of calcium-regulated cysteine
proteases that were discovered more than 40 years ago. Since then, they have
been implicated in a wide range of pathologic conditions including
neurodegenerative diseases, although the precise mechanism of calpain-
mediated neuronal injury is still unclear [46].
From the 15 members found in humans (with tissue specific patterns of
expression), only the catalytic subunits 1, 2, 3, 5, and 10, and two small
regulatory subunits are found in the brain [47]. Despite several attempts to
predict a preferential sequence for calpain cleavage it seems that this protease
does not act through primary structure recognition, but instead through
identification of secondary (or tertiary) structure, thereby difficulting substrate
identification by making it unpredictable. A number of different proteins have
been described and a long list of known calpain substrates is extensively
reviewed in Vosler et al (2008) [48].
Calpains function as cytoplasmatic cysteine proteinases, regulatory
enzymes transducing intracellular Ca2+ signals into the controlled proteolysis of
their substrates. Because of the presence of numerous downstream targets in a
variety of signaling pathways, calpains are speculated to play important roles in
cytoskeletal remodeling, cell differentiation, apoptosis, necrosis, embryonic
development, and long-term potentiation in the central nervous system [46]. An
example is the limited proteolytic cleavage of protein kinase C (PKC) into a
permanently active fragment (PKM) [49].
The most abundant and well-characterized brain calpains are the µ and
m isoforms. Both these proteases exist as heterodimers, each with a distinct 78-
80 kDa catalytic subunit and a 29 kDa common regulatory subunit [47].
Both isoforms interact with Ca2+, and in its absence, the catalytic triad is
pulled apart. µ-calpain has a less dramatic separation of the catalytic residues
and one of the calcium-binding regions is more flexible, which probably explains
the primary biochemical distinction made between these two forms, namely with
12
µ-calpain requiring micromolar Ca2+ for activation whereas m-calpain requires
millimolar levels [46,47].
Calpains can be activated by many apoptotic and necrotic stimuli, in
particular, those that alter Ca2+ homeostasis. Furthermore their activation often
lies upstream of caspase activation [50].
In addition to the various protease isoforms, the calpain system includes
a single endogenous inhibitor – calpastatin. In humans, there have been
described various calpastatin isoforms, that result from alternative splicing of a
single gene (CAST) [39].
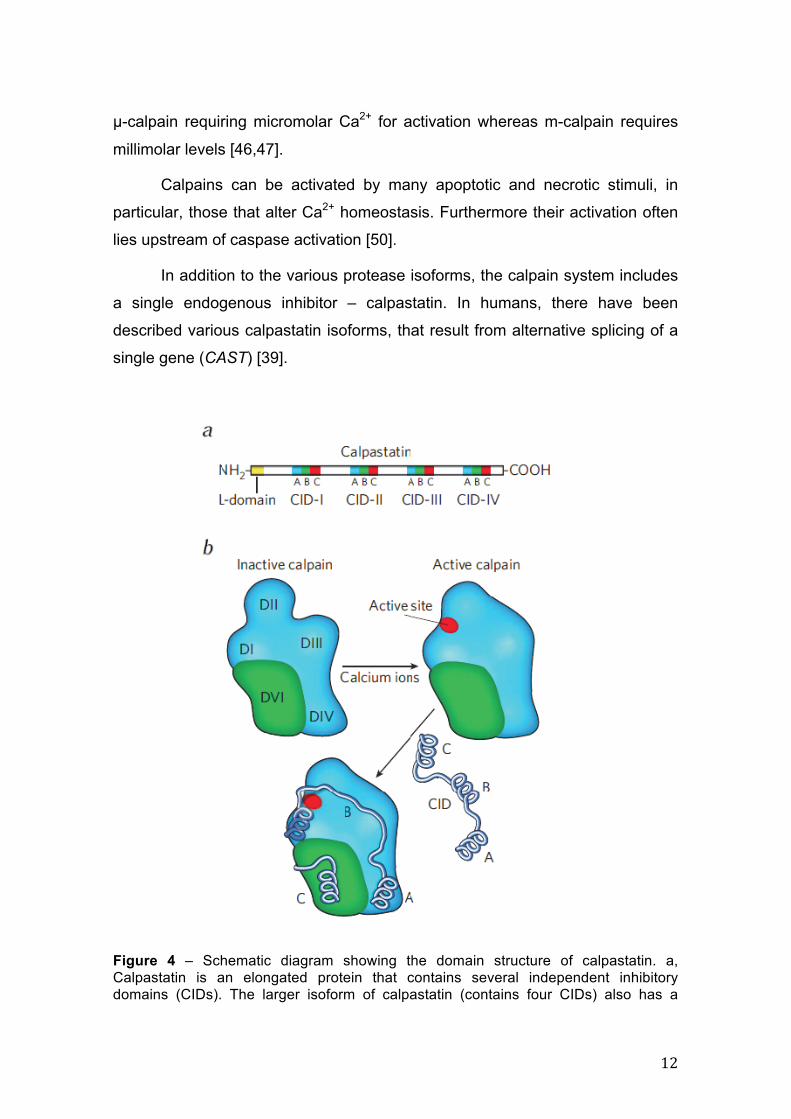
Figure 4 – Schematic diagram showing the domain structure of calpastatin. a, Calpastatin is an elongated protein that contains several independent inhibitory domains (CIDs). The larger isoform of calpastatin (contains four CIDs) also has a
13
terminal L-domain that anchors the protein to cell membranes. Each CID is composed of three regions, A–C, that interact with different calpain domains. b, Calpain crystal structure scheme (m-calpain) in complex with calcium and calpastatin CID domains. Calpain’s four catalytic subunit domains (dI to dIV) are shown in blue, and its regulatory subunit domain dVI is shown in green. When m-calpain binds to calcium, it adopts a compact, active conformation in which dIII moves toward dII, forming the active site (red). The A region of the CID associates with dIV, whereas the C region binds to dVI. The B region wraps around the remaining subunits, blocking the active site, meanwhile looping away from it to avoid being cleaved by the enzyme. Reproduced from Mellgren (2008) [51].
Each calpastatin molecule contains four regions, or calpain inhibitory
domains (CIDs I–IV), that interact with calpains and block their activity (Figure
4a), therefore this repeated domain structure allows calpastatin to
simultaneously inhibit four calpain molecules (one per each CID) [46]. In turn,
each of the CIDs is subdivided into three regions (A, B and C), responsible for
calpain binding [51]. In solution, calpastatin exists in a mostly unraveled
conformation, that allows its four identical domains to bind, in theory, four
calpain molecules [47].
Curiously, calpastatin itself can be a substrate for calpains (which
cleaves in the disordered regions between CIDs), nevertheless, the resulting
proteolytic fragments seem to retain the inhibitory function [48]. However, the
most surprising thing, is that calpastatin – largely disordered on its own – blocks
calpain activity with an unfolded protein portion and despite this risky action, is
fine-tuned to generate a local structural motif (loops away from active cleft) that
protects it from an attack when attached to its calcium-bound substrate (Figure
4b) [52].
1.5. Autophagy
In eukaryotic cells, the two main routes for protein and organelle
clearance are the ubiquitin-proteasome and autophagy-lysosome pathways [3].
The proteasome, comprises a barrel-shaped multi-protein complex that
14
predominantly degrades short-lived nuclear and cytosolic proteins, that also
plays an important role in degrading misfolded proteins in the endoplasmic
reticulum [53].
Substrates such as protein complexes and organelles can be degraded
by lysosomes. This degradation in bulk is largely mediated by macroautophagy,
involving the formation of double-membrane-bounded structures.
Degradation of intracellular components in lysosomes is generally known
as autophagy, and although the first description, by Christian de Duve, occurred
more than 50 years ago, only recently this process has captured the interest of
the scientific community, in particular, concerning its role in neurodegeneration.
Currently we know three different mechanisms for delivery of autophagic cargo
to lysosomes that coexist in the majority of mammalian cells: macroautophagy,
microautophagy and chaperone-mediated autophagy (CMA) [54]. In the context
of this thesis we will focus on macroautophagy and CMA.
1.5.1. Macroautophagy
In macroautophagy, whole regions of the cytosol are sequestered and
delivered to lysosomes for degradation. This cargo sequestration occurs in the
autophagosome, a double membrane vesicle that forms through the elongation
and sealing of a de novo generated membrane. Furthermore, autophagy
studies in yeast, revealed that a series of Atg protein conjugating steps,
remarkably similar to the ubiquitin conjugating system, precede membrane
nucleation and elongation. In fact, this process requires two Atg conjugating
systems and two kinase complexes [55]. In mammals this limiting membrane,
also called phagophore, originates from a tightly controlled series of interactions
between more than 10 different proteins.
In many cellular settings, the first regulatory process involves the de-
repression of the mTOR Ser/Thr kinase (Figure 5, step1), which inhibits
autophagy by phosphorylating autophagy protein-13 (Atg13), leading to the
dissociation of Atg13 from a protein complex containing Atg1 kinase and Atg17,
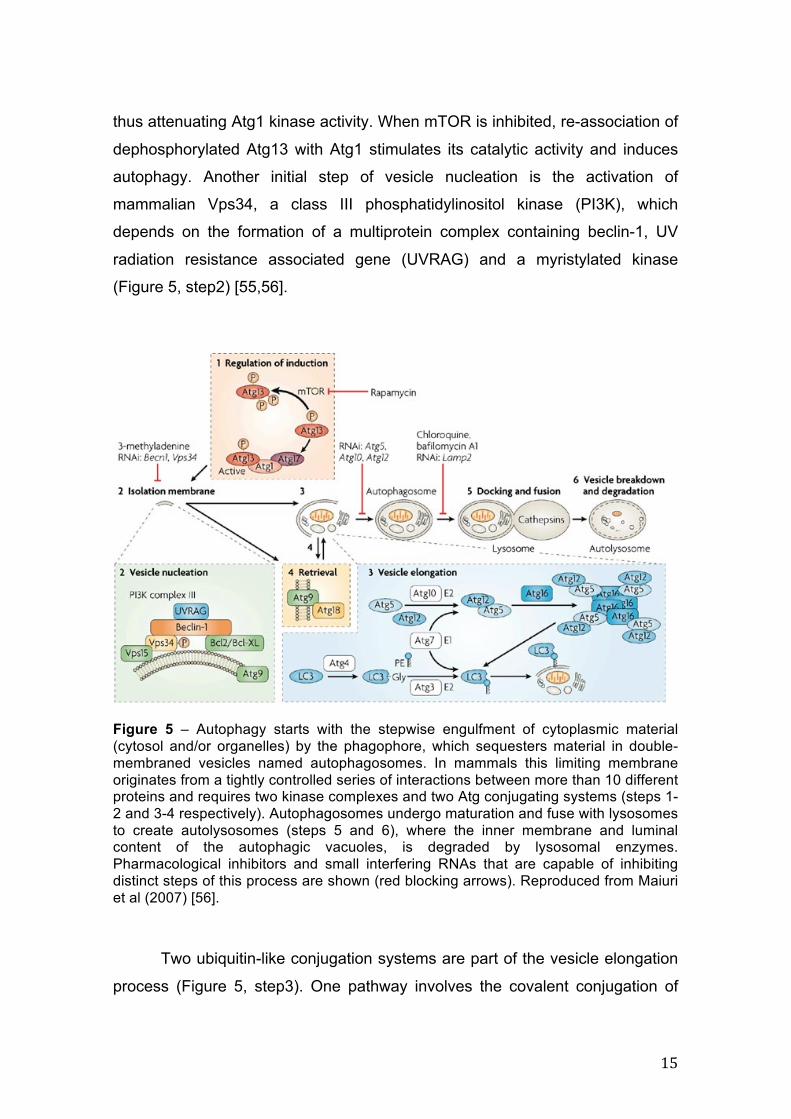
15
thus attenuating Atg1 kinase activity. When mTOR is inhibited, re-association of
dephosphorylated Atg13 with Atg1 stimulates its catalytic activity and induces
autophagy. Another initial step of vesicle nucleation is the activation of
mammalian Vps34, a class III phosphatidylinositol kinase (PI3K), which
depends on the formation of a multiprotein complex containing beclin-1, UV
radiation resistance associated gene (UVRAG) and a myristylated kinase
(Figure 5, step2) [55,56].
Figure 5 – Autophagy starts with the stepwise engulfment of cytoplasmic material (cytosol and/or organelles) by the phagophore, which sequesters material in double-membraned vesicles named autophagosomes. In mammals this limiting membrane originates from a tightly controlled series of interactions between more than 10 different proteins and requires two kinase complexes and two Atg conjugating systems (steps 1-2 and 3-4 respectively). Autophagosomes undergo maturation and fuse with lysosomes to create autolysosomes (steps 5 and 6), where the inner membrane and luminal content of the autophagic vacuoles, is degraded by lysosomal enzymes. Pharmacological inhibitors and small interfering RNAs that are capable of inhibiting distinct steps of this process are shown (red blocking arrows). Reproduced from Maiuri et al (2007) [56].
Two ubiquitin-like conjugation systems are part of the vesicle elongation
process (Figure 5, step3). One pathway involves the covalent conjugation of
16
Atg12 to Atg5, mediated by Atg7 (E1-like enzyme) and Atg10 (E2-like enzyme).
The second pathway involves the conjugation of phosphatidylethanolamine
(PE) to LC3 through sequential action of Atg4 (protease), Atg7 (E1-like enzyme)
and Atg3 (E2-like enzyme) that ultimately leads to conversion of the soluble
LC3 (LC3-I) into the autophagic-vesicle-associated LC3-II. In later stages,
autophagosomes undergo maturation by fusion with lysosomes to create
autolysosomes (Figure 5, steps 5 and 6), where lysosomal enzymes degrade
the inner membrane and luminal content of the autophagic vacuoles [55,56].
In neurons, although elusive, constitutive macroautophagy is a quite
active process that has been shown to be both indispensable and exceptionally
efficient at eliminating autophagosomes and later stage autophagic vacuoles
once they are formed [57].
1.5.2. Chaperone-mediated autophagy In contrast to both macro- and microautophagy, chaperone-mediated
autophagy (CMA) does not require cargo delivery through the formation of
intermediate vesicles, membrane fusion or deformation of any kind. Instead, the
substrates are translocated from the cytosol into the lumen directly across the
lysosomal membrane, a process that is mediated by a translocation protein
complex, which requires protein unfolding. Whereas this pathway cannot
degrade organelles, it is extremely selective for a subset of cytosolic proteins
which are transported one-by-one across the lysosomal membrane for
degradation [58]. The molecular machinery responsible for this process is
organized around three basic important principles: recognition of the substrate
protein, mediated by the targeting signal and the complex of cytosolic
chaperones that recognize it; the translocation complex at the lysosomal
membrane, that binds and unfolds the substrate; and finally, translocation
across the membrane [59].
All CMA substrates contain in their amino acid sequence a pentapeptide
motif biochemically related to KFERQ, known as the CMA-targeting motif,
17
shown to be necessary and sufficient for lysosomal degradation. To date, all the
CMA targeting motifs adhere to the following characteristics: a pentapeptide
flanked in either side by a Q residue and containing a positive residue (R or H),
a negative (D, E), a hydrophobic residue (F, L, I or V) and being the additional
residue positive or hydrophobic but never negative. These residues can
organize in any order inside the sequence as far as the Q is in one of the sides
[58]. It is estimated that 30% of cytosolic proteins have a KFERQ-like motif, and
therefore in theory, might be degraded by CMA [59].
In the cytosol, this pentapeptide is recognized by a group of molecular
chaperones and co-chaperones, of which heat shock cognate protein of 70 kDa
(Hsc70) is an important member. This chaperone, not only binds the KFERQ-
like motif targeting the CMA substrate to the lysosomal membrane, where it can
interact with the CMA receptor, but it also likely facilitates substrate unfolding
which is fundamental for the protein’s translocation into the lysosome. In order
to complete substrate translocation, there is also a requirement for a lumenal
form of hsc70 inside the lysosomes (lys-Hsc70) [60]. In addition, some recent
studies propose that the carboxyl terminus of HSP70-interacting protein (CHIP),
another cytosolic chaperone that contributes to the degradation of cytosolic
proteins by the proteasome, also targets proteins for lysosomal degradation
[61]. Another chaperone present in both sides of the lysosomal membrane is
Hsp90, which is thought to participate in substrate unfolding and translocation
complex stabilization [62].
The lysosome-associated membrane protein type 2A (LAMP-2A) is also
needed for substrate translocation to occur, acting as a substrate receptor in an
initial phase, and later, once it multimerizes, as a translocator complex. In
contrast to Hsc70, which is often in excess in the cytosol, LAMP-2A levels at the
lysosomal membrane are limited and subject of tight regulation, representing
the rate-limiting constituent of CMA. This translocation complex is remarkably
dynamic, undergoing continuous cycles of assembly/disassembly depending on
substrate availability, an action that both Hsc70 and lysosomal lipid
microdomains contribute to [59].
18
CMA is activated to its highest levels under stress conditions (inducible
CMA), such as nutritional stress or starvation, and cellular stresses leading to
protein damage [54]. Indeed, both macroautophagy and CMA often act in a
synchronized or sequential manner. For instance, during starvation,
macroautophagy is the first to be activated, and then, as starvation persists,
cells switch from bulk degradation to CMA, which allows selective targeting of
non-essential proteins for degradation in order to obtain the amino acids
required for the synthesis of essential ones [63,64].
19
2. Objectives The main goal of this work was to gain insights into aggregate formation,
dynamics and clearance in a cellular model for spinocerebellar ataxia type 14.
Specifically, we aimed to (1) generate a model for SCA14 in
neuroblastoma cells; (2) characterize several PKCγ mutants regarding protein
expression, aggregate formation and cell survival; (3) assess the role of PKCγ
proteolysis by calpains in the dynamics of aggregate formation and cytotoxicity;
and finally (4) investigate autophagy’s role in the clearance of PKCγ
aggregates.
20
3. Material and Methods
3.1. DNA constructs
The N-terminal FLAG tagged human calpastatin cDNA (NM_173060.3)
cloned in a pcDNA5 vector was kindly provided by Professor Carlos Duarte. A
pEGFP-C1 vector with the cDNA for the human PKCγ (NM_002739.3),
previously subcloned, was used to generate all mutants.
3.2. Site-directed mutagenesis
Eight PKCγ mutants (Table 1) were generated with the QuickChange
site-directed mutagenesis Kit (Agilent Technologies) as per manufacturer’s
instructions, using standard desalting-purified oligonucleotide primers (IDT), in a
T-Gradient thermocycler (Biometra). In brief, and for each intended mutation,
1,5 µg of plasmid DNA were added to a reaction mix containing 125 ng of each
primer (forward and reverse, see table 1), 10x reaction buffer (to a final
concentration of 10 mM KCl, 10 mM (NH4)2SO4, 20 mM Tris-HCl (pH 8.8), 2 mM
MgSO4 0.1% Triton X-100 and 100 µg/mL BSA), 50 ng (10 mM) of a dNTP mix,
250 U of PfuTurbo DNA polymerase and ddH2O up to a final volume of 50 µL.
In order to amplify the mutant plasmids, all samples were denatured at 95ºC for
30 sec, followed by 18 cycles comprising a cycle of denaturation at 95ºC for 1
min, annealing at 65ºC for 1 min, and then an extension at 68ºC for 25 min. The
amplified product was then incubated with 1000 U of Dnp I at 37ºC for 2 hours
in order to degrade the methylated DNA template (non-mutated).
Afterwards, XL1-Blue Supercompetent Cells (E. coli) (Agilent
Technologies) were transformed by heat shock with 1 µL of Dpn I-treated
sample reaction. Transformed bacteria were plated in selective LB-agar plates
containing 50 µg/mL of kanamycin, and incubated overnight at 37ºC. Fresh
selective liquid LB was inoculated with resistant colonies and incubated
overnight with vigorous shaking, at 37ºC, for plasmid DNA extraction. Individual
mutations were verified by direct sequencing of plasmid cDNA.
21
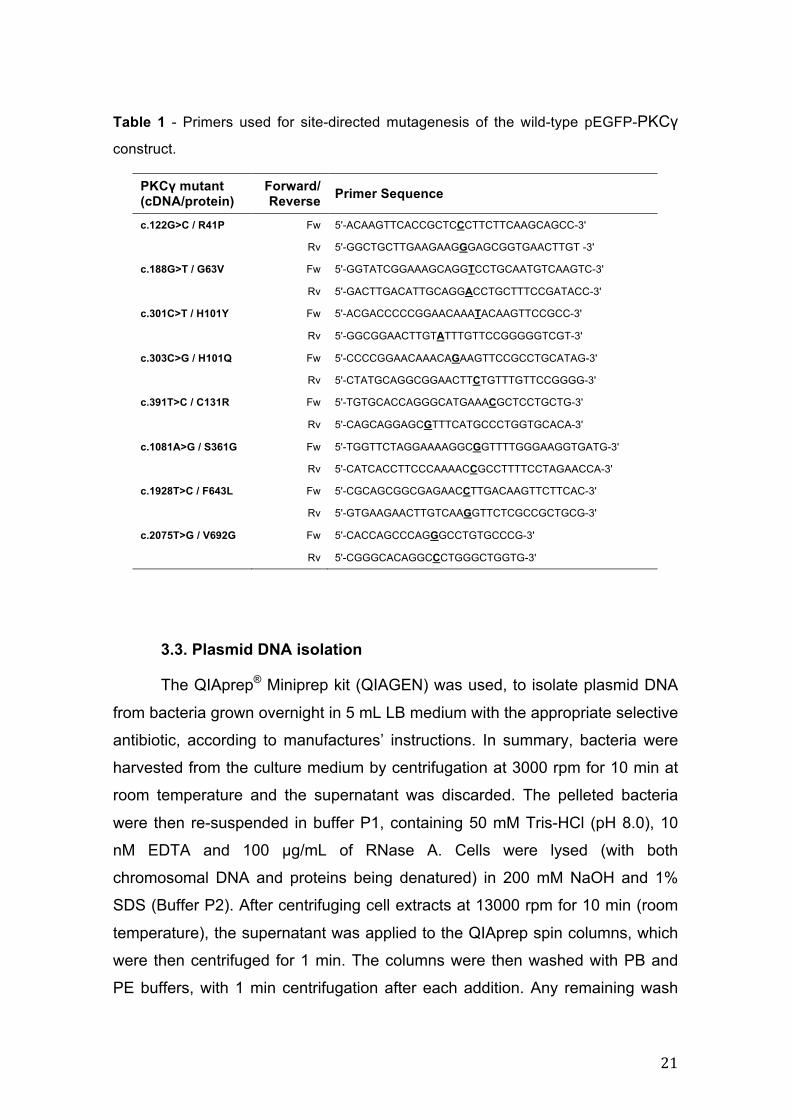
Table 1 - Primers used for site-directed mutagenesis of the wild-type pEGFP-PKCγ
construct.
PKCγ mutant (cDNA/protein)
Forward/Reverse Primer Sequence
c.122G>C / R41P Fw 5'-ACAAGTTCACCGCTCCCTTCTTCAAGCAGCC-3'
Rv 5'-GGCTGCTTGAAGAAGGGAGCGGTGAACTTGT -3'
c.188G>T / G63V Fw 5'-GGTATCGGAAAGCAGGTCCTGCAATGTCAAGTC-3'
Rv 5'-GACTTGACATTGCAGGACCTGCTTTCCGATACC-3'
c.301C>T / H101Y Fw 5'-ACGACCCCCGGAACAAATACAAGTTCCGCC-3'
Rv 5'-GGCGGAACTTGTATTTGTTCCGGGGGTCGT-3'
c.303C>G / H101Q Fw 5'-CCCCGGAACAAACAGAAGTTCCGCCTGCATAG-3'
Rv 5'-CTATGCAGGCGGAACTTCTGTTTGTTCCGGGG-3'
c.391T>C / C131R Fw 5'-TGTGCACCAGGGCATGAAACGCTCCTGCTG-3'
Rv 5'-CAGCAGGAGCGTTTCATGCCCTGGTGCACA-3'
c.1081A>G / S361G Fw 5'-TGGTTCTAGGAAAAGGCGGTTTTGGGAAGGTGATG-3'
Rv 5'-CATCACCTTCCCAAAACCGCCTTTTCCTAGAACCA-3'
c.1928T>C / F643L Fw 5'-CGCAGCGGCGAGAACCTTGACAAGTTCTTCAC-3'
Rv 5'-GTGAAGAACTTGTCAAGGTTCTCGCCGCTGCG-3'
c.2075T>G / V692G Fw 5'-CACCAGCCCAGGGCCTGTGCCCG-3'
Rv 5'-CGGGCACAGGCCCTGGGCTGGTG-3'
3.3. Plasmid DNA isolation
The QIAprep® Miniprep kit (QIAGEN) was used, to isolate plasmid DNA
from bacteria grown overnight in 5 mL LB medium with the appropriate selective
antibiotic, according to manufactures’ instructions. In summary, bacteria were
harvested from the culture medium by centrifugation at 3000 rpm for 10 min at
room temperature and the supernatant was discarded. The pelleted bacteria
were then re-suspended in buffer P1, containing 50 mM Tris-HCl (pH 8.0), 10
nM EDTA and 100 µg/mL of RNase A. Cells were lysed (with both
chromosomal DNA and proteins being denatured) in 200 mM NaOH and 1%
SDS (Buffer P2). After centrifuging cell extracts at 13000 rpm for 10 min (room
temperature), the supernatant was applied to the QIAprep spin columns, which
were then centrifuged for 1 min. The columns were then washed with PB and
PE buffers, with 1 min centrifugation after each addition. Any remaining wash
22
buffer was removed from the columns by one extra centrifugation (1 min). The
spin columns were then incubated with EB (10 mM Tris-Cl, pH8.5) and the
plasmid DNA recovered with a final 1 min centrifugation step. Plasmid DNA was
quantified using NanoDrop 2000 (Thermo Scientific).
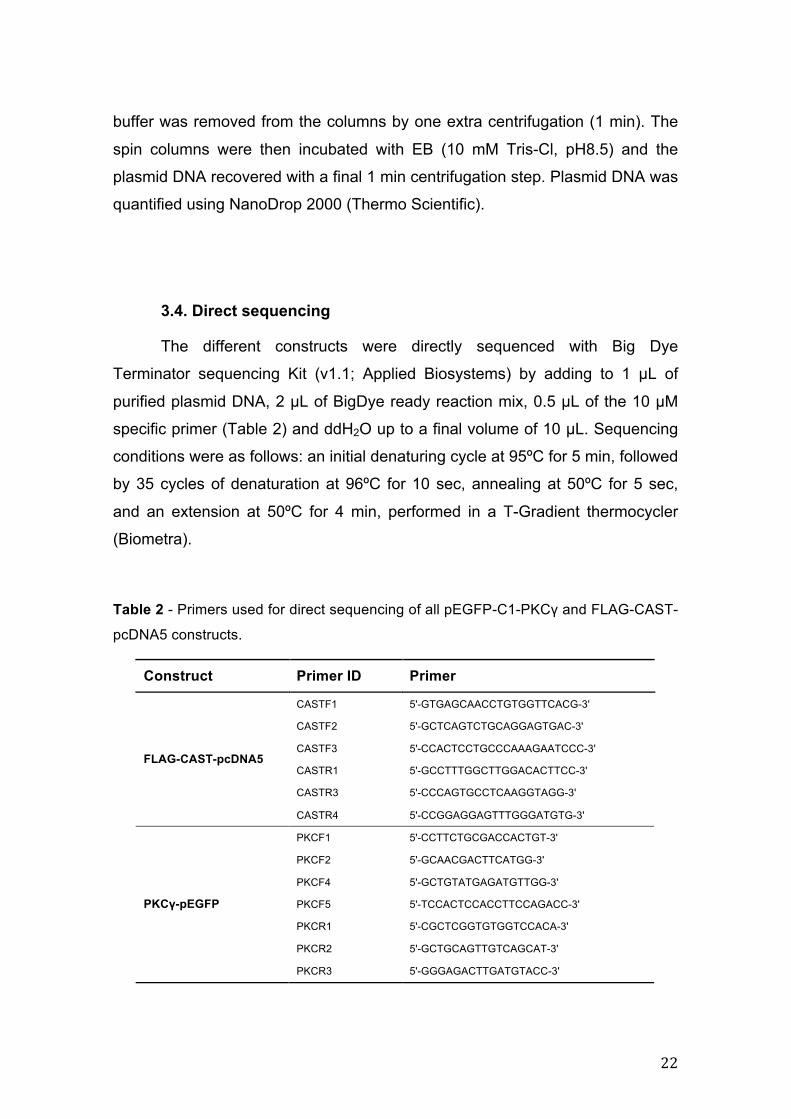
3.4. Direct sequencing
The different constructs were directly sequenced with Big Dye
Terminator sequencing Kit (v1.1; Applied Biosystems) by adding to 1 µL of
purified plasmid DNA, 2 µL of BigDye ready reaction mix, 0.5 µL of the 10 µM
specific primer (Table 2) and ddH2O up to a final volume of 10 µL. Sequencing
conditions were as follows: an initial denaturing cycle at 95ºC for 5 min, followed
by 35 cycles of denaturation at 96ºC for 10 sec, annealing at 50ºC for 5 sec,
and an extension at 50ºC for 4 min, performed in a T-Gradient thermocycler
(Biometra).
Table 2 - Primers used for direct sequencing of all pEGFP-C1-PKCγ and FLAG-CAST-
pcDNA5 constructs.
Construct Primer ID Primer
CASTF1 5'-GTGAGCAACCTGTGGTTCACG-3'
CASTF2 5'-GCTCAGTCTGCAGGAGTGAC-3'
CASTF3 5'-CCACTCCTGCCCAAAGAATCCC-3'
CASTR1 5'-GCCTTTGGCTTGGACACTTCC-3'
CASTR3 5'-CCCAGTGCCTCAAGGTAGG-3'
FLAG-CAST-pcDNA5
CASTR4 5'-CCGGAGGAGTTTGGGATGTG-3'
PKCF1 5'-CCTTCTGCGACCACTGT-3'
PKCF2 5'-GCAACGACTTCATGG-3'
PKCF4 5'-GCTGTATGAGATGTTGG-3'
PKCF5 5'-TCCACTCCACCTTCCAGACC-3'
PKCR1 5'-CGCTCGGTGTGGTCCACA-3'
PKCR2 5'-GCTGCAGTTGTCAGCAT-3'
PKCγ-pEGFP
PKCR3 5'-GGGAGACTTGATGTACC-3'
23
The sequencing product was then purified using DyeEx 96 well plates
(QIAGEN) according to manufactures’ instructions. Briefly, the sequenced
product was filtrated through a gel-like resin consisting of spheres with uniform
pores that allow the dye terminators to diffuse, retaining them in the gel, while
the DNA fragments are excluded and recovered in the flow-through. Finally, the
samples were loaded on an ABI 3130xl Genetic Analyzer (Applied Biosystems).
3.5. Cell culture and transfection
The human neuroblastoma cell line SH-SY5Y (DSMZ) was cultured in a
1:1 Dulbeco’s Modified Eagle Medium (DMEM)/F12 nutrient mixture (Ham)
supplemented with 1% GlutaMAX™ I, 10% FBS and 1% Antibiotic-Antimycotic
(all from Invitrogen) at 37ºC in a humidified 5% CO2 atmosphere.
Cells were grown in 75 cm2 culture flaks (Sarstedt), and kept at a
maximum 90% confluency, by trypsinization and subculturing. All replicas from
a given experiment used cells from the same passage number, which never
exceeded 5 passages.
For subculturing, neuronal cells were detached by incubating them with 2
mL of Trypsin-EDTA (0.25% Trypsin and 1 mM EDTA, Invitrogen) for 5 min at
37ºC, which was neutralized by adding FBS containing medium. The cells were
then re-suspended in fresh supplemented medium and cultured at 5x10⁵
cells/well, in 12-well plates (Nunc). For nitrogen storage, instead of plating cells,
they were aliquoted in DMEM with 10% DMSO.
Cells were transfected either 24h or 48h (coverslips) after plating, using
FuGENE HD (Roche) following manufacturer’s instructions. The optimal ratio
FuGENE:plasmid cDNA was determined as 3:1, and 75 µL of the resulting
complex containing mixture, were used to transfect each condition.
Calpain inhibition was achieved by co-transfection with calpastatin
expression vector. Autophagy activation was accomplished by treatment with
rapamycin. No dosage-response curve fit for determining rapamycin
24
concentration was performed, as it has previously been determined, for the
same cell line, by others [65].
SH-SY5Y stably expressing mutant and wild-type PKCγ were also
prepared. A T25 culture flask was transfected with each construct, as previously
described, and 72h after transfection the culture medium was changed to
culture medium containing 500 µg/mL of G418 (Invitrogen). The culture medium
was renewed as needed and the cultures were maintained for six weeks, after
which, they were subcultured without the selecting agent, and stored.
3.6. RNA extraction
Total RNA was isolated from transfected cells using the TRIzol Reagent
(Invitrogen) as per manufacturer’s recommendations. Briefly, cells were lysed in
500 µL of TRIzol and incubated for 5 min (room temperature), after which 100
µL of chloroform were added, and vigorously mixed with each sample.
Following a 3 min resting period, phases were separated by centrifugation at
12000g, for 15 min (4ºC). The aqueous phase was recovered, and RNA was
precipitated with 250 µL of isopropyl alcohol and pelleted by centrifugation
(12000g, 10 min, 4ºC) after 10 min of room temperature incubation. The
supernatant was discarded and the RNA pellet was washed with 500 µL of 75%
ethanol. Samples were centrifuged again (7500g, 5 min, 4ºC), the RNA pellet
was air dried and re-suspended in DEPC-treated water. Finally, samples were
incubated at 50ºC, for 10 min, to allow solubilization, and stored at -80ºC.
Total RNA quantification was performed using NanoDrop 2000 (Thermo
Scientific) and RNA quality was assessed using QIAxcel (QIAGEN) and the
RNA QC Kit v2.0 (QIAGEN), a gel cartridge for automated RNA capillary
electrophoresis.
25
3.7. Real-Time PCR
The SuperScript III first-strand synthesis system (Invitrogen) was used to
generate total cDNA from 1 µg of total RNA of each sample. The standard
oligo(dT)20 primer was used and manufacturer’s instructions were followed for
the reverse transcriptase reaction.
Real-time PCR was performed to measure PRKCG, CAST, and the
housekeeping gene ACTB mRNA levels in transfected SH-SY5Y cells. The
three genes were amplified with the iQ SYBR Green supermix (Bio-Rad) by
adding to 1 µL of a ten-fold dilution of the cDNA synthesis reaction, 10 µL of
SYBR Green supermix, 0.25 µL of the 10 µM specific primer (Table 3) and
ddH2O up to a final volume of 20 µL. Amplifying conditions were as follows: an
initial denaturing cycle at 95ºC for 3 min, followed by 40 cycles of denaturation
at 94ºC for 30 sec, annealing at 57ºC for 30 sec, and an extension at 72ºC for
30 sec, performed in an iQ5 Real-Time PCR detection system (Bio-Rad). Three
replicas of the same sample per gene analysed we made, and the average Ct
was determined. Data is presented as relative mRNA levels of the gene of
interest normalized to relative levels of ACTB mRNA.
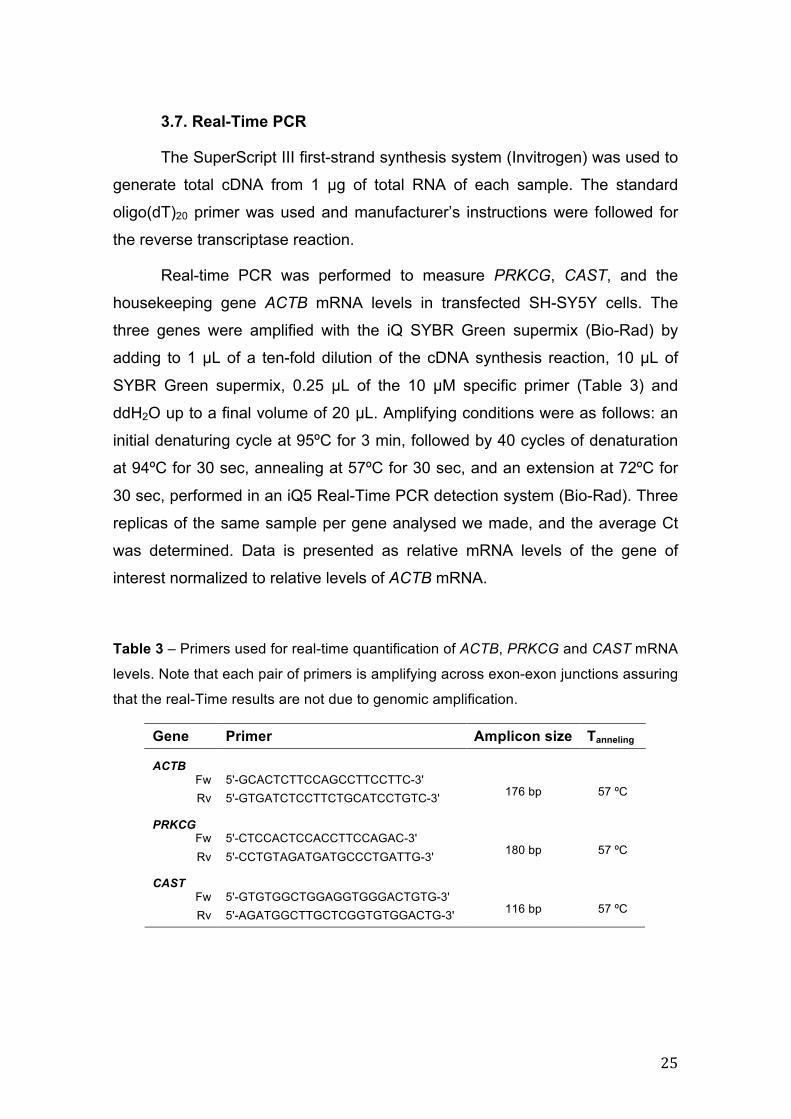
Table 3 – Primers used for real-time quantification of ACTB, PRKCG and CAST mRNA
levels. Note that each pair of primers is amplifying across exon-exon junctions assuring
that the real-Time results are not due to genomic amplification.
Gene Primer Amplicon size Tanneling
ACTB
Fw 5'-GCACTCTTCCAGCCTTCCTTC-3' Rv 5'-GTGATCTCCTTCTGCATCCTGTC-3' 176 bp 57 ºC
PRKCG Fw 5'-CTCCACTCCACCTTCCAGAC-3' Rv 5'-CCTGTAGATGATGCCCTGATTG-3' 180 bp 57 ºC
CAST Fw 5'-GTGTGGCTGGAGGTGGGACTGTG-3' Rv 5'-AGATGGCTTGCTCGGTGTGGACTG-3' 116 bp 57 ºC
26
3.8. Protein extracts
Cells expressing target proteins were collected 24h, 48h and 72h after
transfection. Briefly, cells were washed with warm HBSS (Invitrogen) and
collected, on ice, in 75 µL of RIPA buffer (Sigma) supplemented with a
cOmplete Protease Inhibitor Cocktail (Roche). Samples were sonicated and
then centrifuged for 10 min at 13000 rpm. The soluble fraction was collected
and total protein was measured with the DC Protein Assay (Bio-Rad) according
to manufacturer’s instructions. Working aliquots of each sample were prepared
in Laemmli buffer with 0.7% β-mercaptoethanol and denatured at 100ºC for 10
min.
3.9. Western blotting
The samples were electrophoresed in a polyacrylamide 37.5:1
(Acrylamide/Bis-acrylamide) denaturating gel, at 120 V in a mini-Protean
system (Bio-Rad). The stacking concentration was kept at 4% and the running
resolution varied according to the proteins being probed. The resolved proteins
were afterwards transferred into an Immobilon-P PVDF membrane (Millipore)
using semi-dry blotting at 38 mA, for the first hour, and at 76 mA, during the
second hour, with transfer buffer (48 mM Tris-base, 39 mM glycine, 0.0375%
SDS, 20% methanol). The membranes were blocked in a 3% non-fat powder
milk (PM) PBS-T solution for 1h at 4ºC, and then incubated overnight with,
mouse anti-PKCγ (3:1000) (Transduction laboratories), mouse anti-GFP
(3:1000) (Abcam), mouse anti-FLAG (1:1000) (Sigma), rabbit anti-LC3 (1:1000)
(Cell Signaling) and rabbit anti-TH (1:1000) (Cell Signaling) diluted in 3% PM
(PBS-T). Mouse anti-β-actin (1:10000) (Sigma) was subsequently incubated for
1h at 4ºC.
Secondary, goat anti-mouse (Santa Cruz) and goat anti-rabit
(Calbiochem), horseradish peroxidase-conjugated (HRP) IgGs, diluted 1:10000
27
in 3% PM PBS-T were incubated for 1h at 4ºC. Membranes were washed with
PBS-T in between steps, and finally, their immunoreactivity was visualized,
using the FemtoMax chemiluminescent Western blot kit (Rockland). Band
quantification was performed on the GS-800 calibrated imaging densitometer
(Bio-Rad).
3.10. Immunofluorescence assays
Acid washed 13mm coverslips were washed with 70% ethanol and
rinsed with cell culture grade water. Afterwards, coverslips were incubated for
one hour at 37ºC, with 400 µL of a 0.2 mg/mL Collagen type I solution
(STEMCELL Technologies), and then air dried and washed again with sterile
water. Cells were plated and left to adhere for 48 h, before handling.
After 24h, 48h and 72h of treatment, cells were fixed with 4%
formaldehyde, 4% sucrose in PBS for 20 min and permeabilized with 0.3%
Triton-X100 in PBS for 15 min. Blocking was done with 10% FBS for 30 min at
room temperature. Coverslips were incubated overnight at 4ºC with primary
antibodies, mouse anti-FLAG (Sigma) and rabbit anti-LC3 (Cell Signaling),
diluted 1:1000 in 5% FBS, 0.01% Triton-X100 (PBS). Secondary, goat anti-
mouse and anti-rabbit AlexaFluor 568 conjugated antibodies (Invitrogen),
diluted 1:2000 in 5%FBS, 0.01% Triton-X100 (PBS) were incubated at room
temperature for 40 min. Cells were stained with a 1 µg/mL solution of Hoechst
33342 (Invitrogen) for 5 min. PBS was used to wash cells in-between all steps.
The coverslips were then mounted in 5 µL of ProlongGOLD, allowed to dry and
sealed with nail polish. The results were visualized in a wide-field fluorescence
microscope – Axio Imager Z1 (Carl Zeiss).
28
3.11. Aggregate quantification
Image analysis for aggregate quantification was performed using open
source ImageJ. The 12 bit images were converted to 8 bit and a ten-pixel
background was subtracted to the GFP channel. Afterwards a median filter with
a one-pixel matrix was applied and the default threshold was determined. The
number of particles per cell was analyzed by counting the area of every particle
with 0.01 µm2 and higher, which allowed the exclusion of single pixels.
3.12. Cell viability assay
In order to assess cell viability, the CellTiter-Glo cell viability assay kit
(Promega) was used. This kit is based on the luciferase reaction and directly
correlates cell viability with the total amount of ATP present in each sample.
SH-SY5Y cells were cultured in opaque-walled 96-well plates, at 39,5x10³
cells/well in a total volume of 100 µL, and then transfected as previously
described. After different time periods, an equal volume of CellTiter-Glo reagent
was added to the culture medium present in each well (100 µL) and the plate
contents were mixed on an orbital shaker for 2 min. The plate was allowed to
incubate at room temperature for 10 min and luminescent signal was measured
in a Synergy 2 SL Luminescence Microplate Reader (BioTek).
3.13. Statistical analysis
Cell viability, RNA expression and aggregate quantification data are
expressed as mean ± SEM. Comparison of calpastatin and rapamycin effect on
the studied mutants was done using one-way or two-way ANOVA with a
Bonferroni post-hoc test for multiple comparisons. Number of cells with and
without aggregates was compared between wild-type and mutant cells using
the χ2 test. The mean number of aggregates in wild-type and mutant cells was

29
compared by Student’s unpaired t-test. Differences were considered to be
significant when p<0.05. Statistical analysis was performed using PASW
Statistics 18.
30
4. Results
During this project we have created and characterized cellular models
overexpressing mutant PKCγ with eight different mutations found in patients
with spinocerebellar ataxia type 14. We have selected mutations located in
different PKCγ domains in order to have a broader insight into the effect of the
diverse mutations. We were able to demonstrate the existence of two different
groups of GFP-positive cells showing high and low PKCγ expression. Our data
show that the different studied mutation do not have an impact on cell viability,
although resulted in differences in the number of cells showing PKCγ
aggregates and in the number of aggregates present in each cell. We were also
able to show that inhibition of PKCγ by calpain has as impact both in cell
viability and in aggregate formation, resulting in increased viability and
reduction of aggregate formation in cells with inhibited calpain function.
Similarly, autophagy activation also results in increased cell viability and
reduction of aggregate levels. Moreover, our data allows us to propose that
PKCγ may be a CMA substrate. Finally, during this thesis project we have
created SH-SY5Y transgenic cell lines permanently expressing wild-type and
mutant PKCγ that will allow further exploring the mechanisms involved in
SCA14 pathogenesis.
4.1. PKCγ wild-type and mutant cell line characterization
In order to perform a full characterization of the obtained cell lines, PKCγ
expression was assessed at the protein level through florescence microscopy
and western-blot, and at the RNA level through real-time PCR. The impact of
wild-type and mutant PKCγ expression on cell survival was also assessed as
well as aggregate formation characterization.
31
4.1.1. PKCγ expression in SH-SY5Y cells
Neuroblastoma cells are usually difficult to transfect, nonetheless, we
have optimized the transfection protocol up to an estimated transfection
efficiency of ~95%.
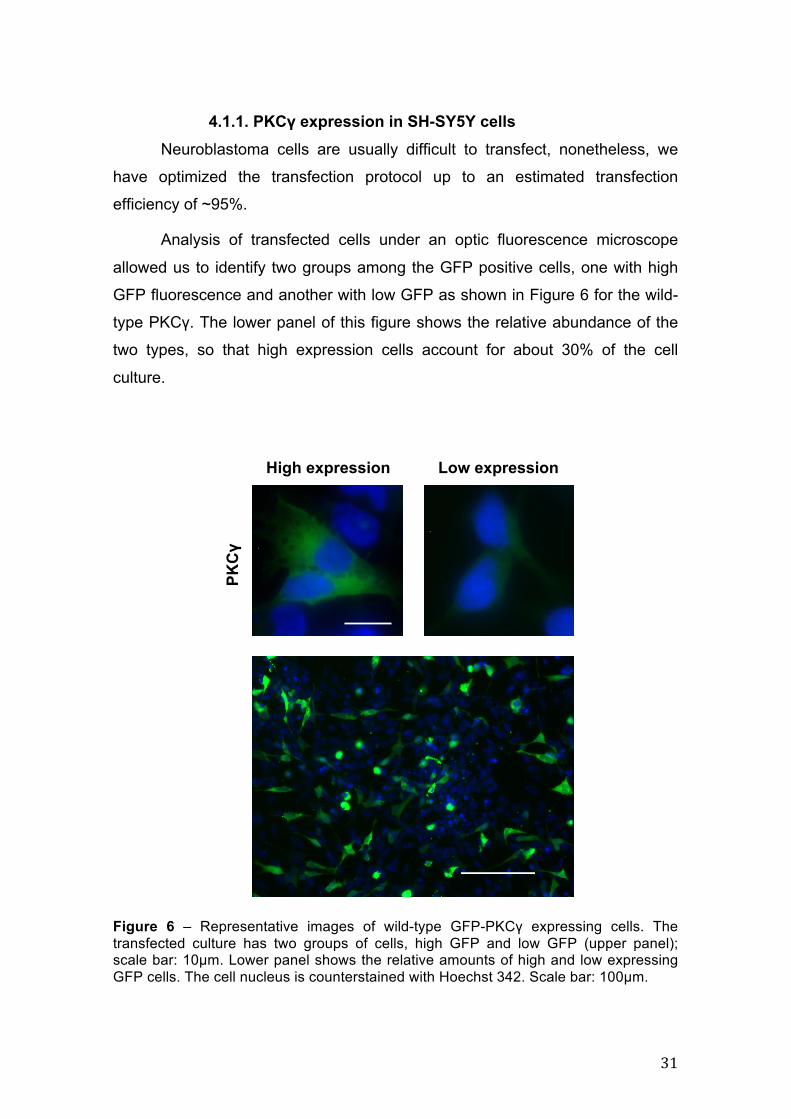
Analysis of transfected cells under an optic fluorescence microscope
allowed us to identify two groups among the GFP positive cells, one with high
GFP fluorescence and another with low GFP as shown in Figure 6 for the wild-
type PKCγ. The lower panel of this figure shows the relative abundance of the
two types, so that high expression cells account for about 30% of the cell
culture.
Figure 6 – Representative images of wild-type GFP-PKCγ expressing cells. The transfected culture has two groups of cells, high GFP and low GFP (upper panel); scale bar: 10µm. Lower panel shows the relative amounts of high and low expressing GFP cells. The cell nucleus is counterstained with Hoechst 342. Scale bar: 100µm.
High expression Low expression
PKC!
32
0
20
40
60
80
100
120
140
PKC!
R41P
G63V
H101Q
H101Y
C131R
S361G
F643L
V692G
!"#$"%
&'(')*
+"
110-
42-
kDa ! WT
PKC"
H101
Q
G63V
H101
Y C1
31R
S361
G F6
43L
V692
G
R41P
#-actin
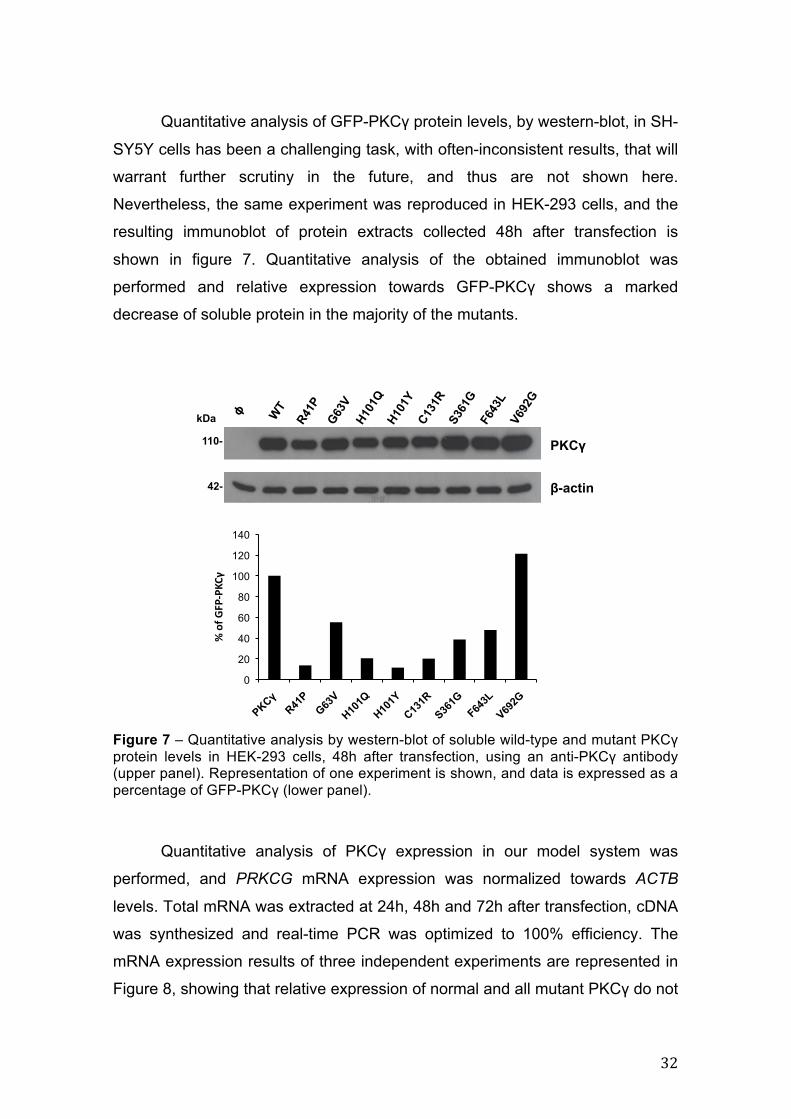
Quantitative analysis of GFP-PKCγ protein levels, by western-blot, in SH-
SY5Y cells has been a challenging task, with often-inconsistent results, that will
warrant further scrutiny in the future, and thus are not shown here.
Nevertheless, the same experiment was reproduced in HEK-293 cells, and the
resulting immunoblot of protein extracts collected 48h after transfection is
shown in figure 7. Quantitative analysis of the obtained immunoblot was
performed and relative expression towards GFP-PKCγ shows a marked
decrease of soluble protein in the majority of the mutants.
Figure 7 – Quantitative analysis by western-blot of soluble wild-type and mutant PKCγ protein levels in HEK-293 cells, 48h after transfection, using an anti-PKCγ antibody (upper panel). Representation of one experiment is shown, and data is expressed as a percentage of GFP-PKCγ (lower panel).
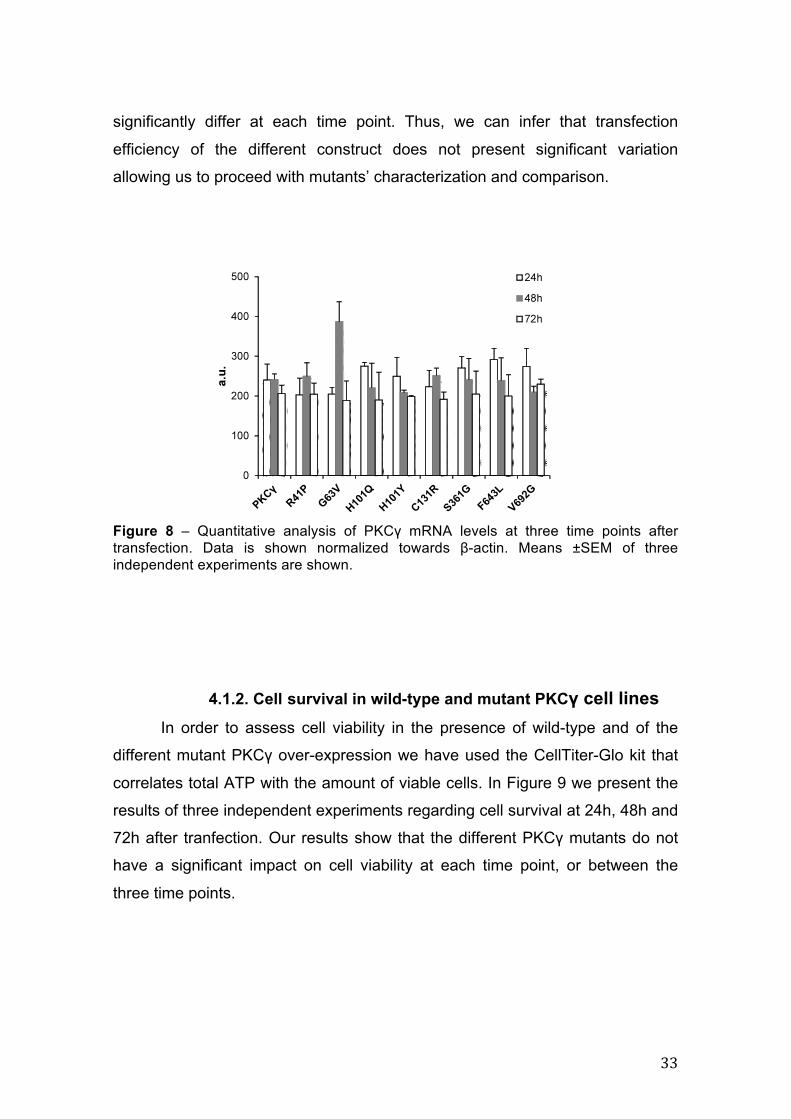
Quantitative analysis of PKCγ expression in our model system was
performed, and PRKCG mRNA expression was normalized towards ACTB
levels. Total mRNA was extracted at 24h, 48h and 72h after transfection, cDNA
was synthesized and real-time PCR was optimized to 100% efficiency. The
mRNA expression results of three independent experiments are represented in
Figure 8, showing that relative expression of normal and all mutant PKCγ do not
33
significantly differ at each time point. Thus, we can infer that transfection
efficiency of the different construct does not present significant variation
allowing us to proceed with mutants’ characterization and comparison.
Figure 8 – Quantitative analysis of PKCγ mRNA levels at three time points after transfection. Data is shown normalized towards β-actin. Means ±SEM of three independent experiments are shown.
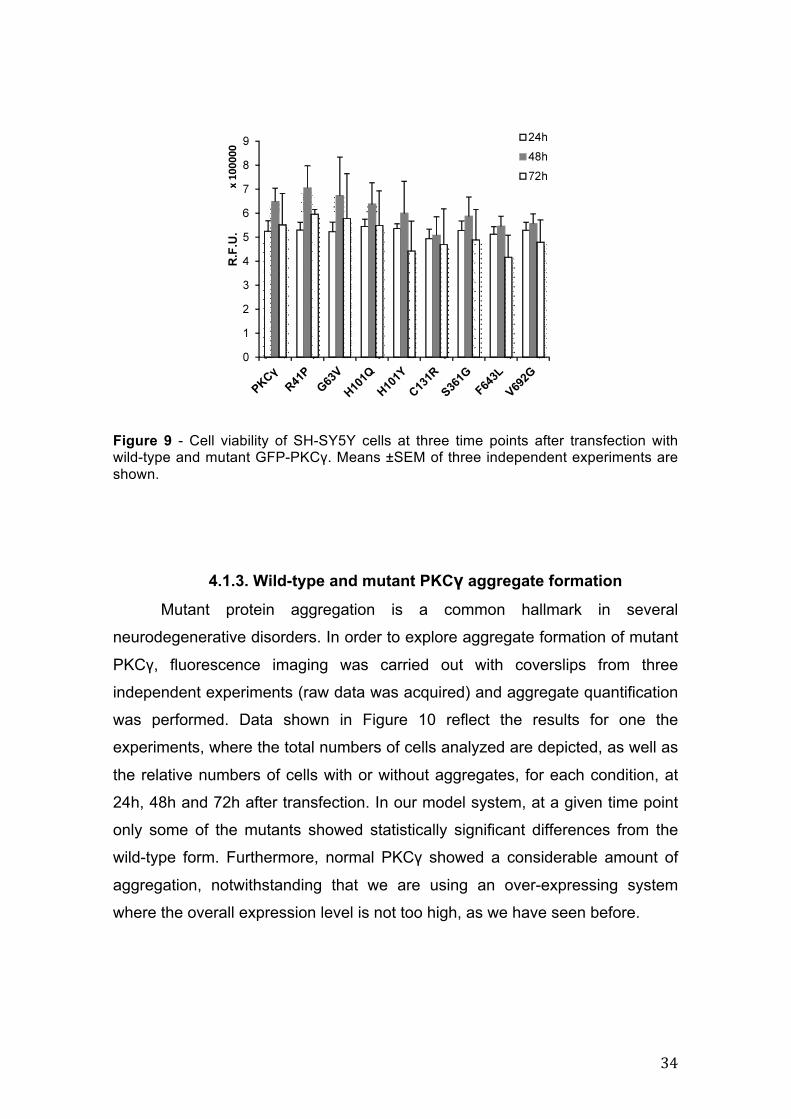
4.1.2. Cell survival in wild-type and mutant PKCγ cell lines In order to assess cell viability in the presence of wild-type and of the
different mutant PKCγ over-expression we have used the CellTiter-Glo kit that
correlates total ATP with the amount of viable cells. In Figure 9 we present the
results of three independent experiments regarding cell survival at 24h, 48h and
72h after tranfection. Our results show that the different PKCγ mutants do not
have a significant impact on cell viability at each time point, or between the
three time points.
34
Figure 9 - Cell viability of SH-SY5Y cells at three time points after transfection with wild-type and mutant GFP-PKCγ. Means ±SEM of three independent experiments are shown.
4.1.3. Wild-type and mutant PKCγ aggregate formation
Mutant protein aggregation is a common hallmark in several
neurodegenerative disorders. In order to explore aggregate formation of mutant
PKCγ, fluorescence imaging was carried out with coverslips from three
independent experiments (raw data was acquired) and aggregate quantification
was performed. Data shown in Figure 10 reflect the results for one the
experiments, where the total numbers of cells analyzed are depicted, as well as
the relative numbers of cells with or without aggregates, for each condition, at
24h, 48h and 72h after transfection. In our model system, at a given time point
only some of the mutants showed statistically significant differences from the
wild-type form. Furthermore, normal PKCγ showed a considerable amount of
aggregation, notwithstanding that we are using an over-expressing system
where the overall expression level is not too high, as we have seen before.
35
A
* **
B
* *
C
* *
*
*
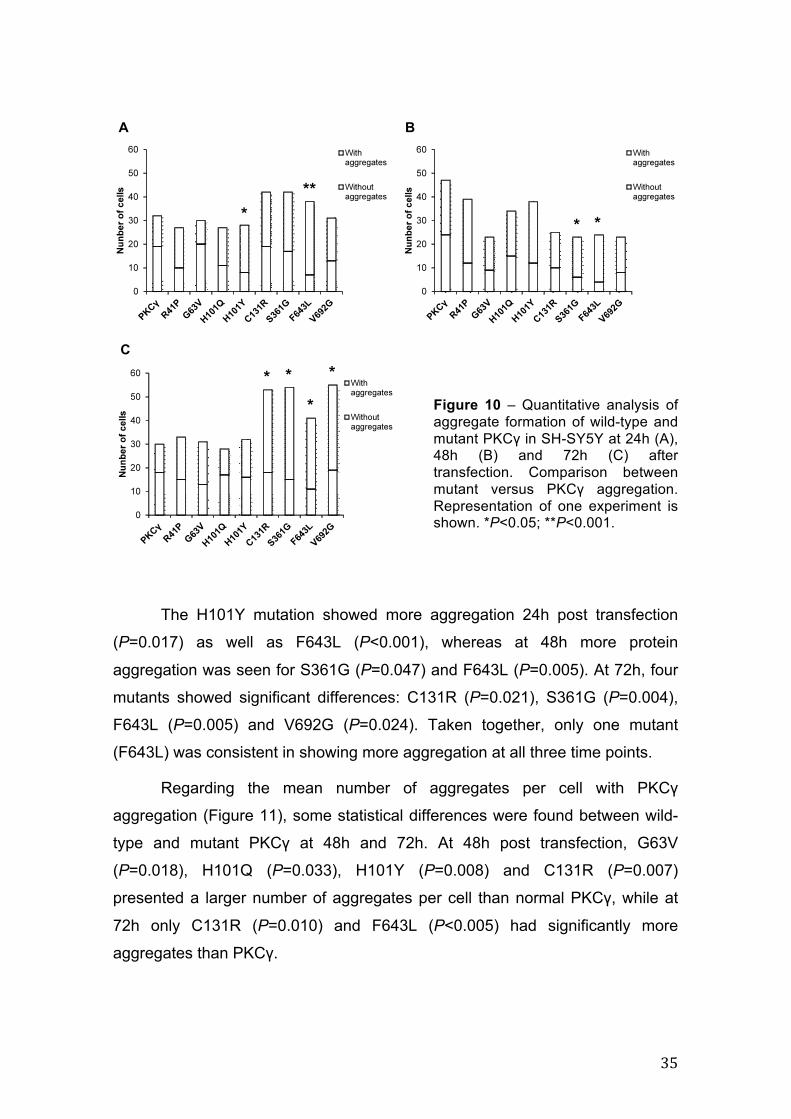
Figure 10 – Quantitative analysis of aggregate formation of wild-type and mutant PKCγ in SH-SY5Y at 24h (A), 48h (B) and 72h (C) after transfection. Comparison between mutant versus PKCγ aggregation. Representation of one experiment is shown. *P<0.05; **P<0.001.
The H101Y mutation showed more aggregation 24h post transfection
(P=0.017) as well as F643L (P<0.001), whereas at 48h more protein
aggregation was seen for S361G (P=0.047) and F643L (P=0.005). At 72h, four
mutants showed significant differences: C131R (P=0.021), S361G (P=0.004),
F643L (P=0.005) and V692G (P=0.024). Taken together, only one mutant
(F643L) was consistent in showing more aggregation at all three time points.
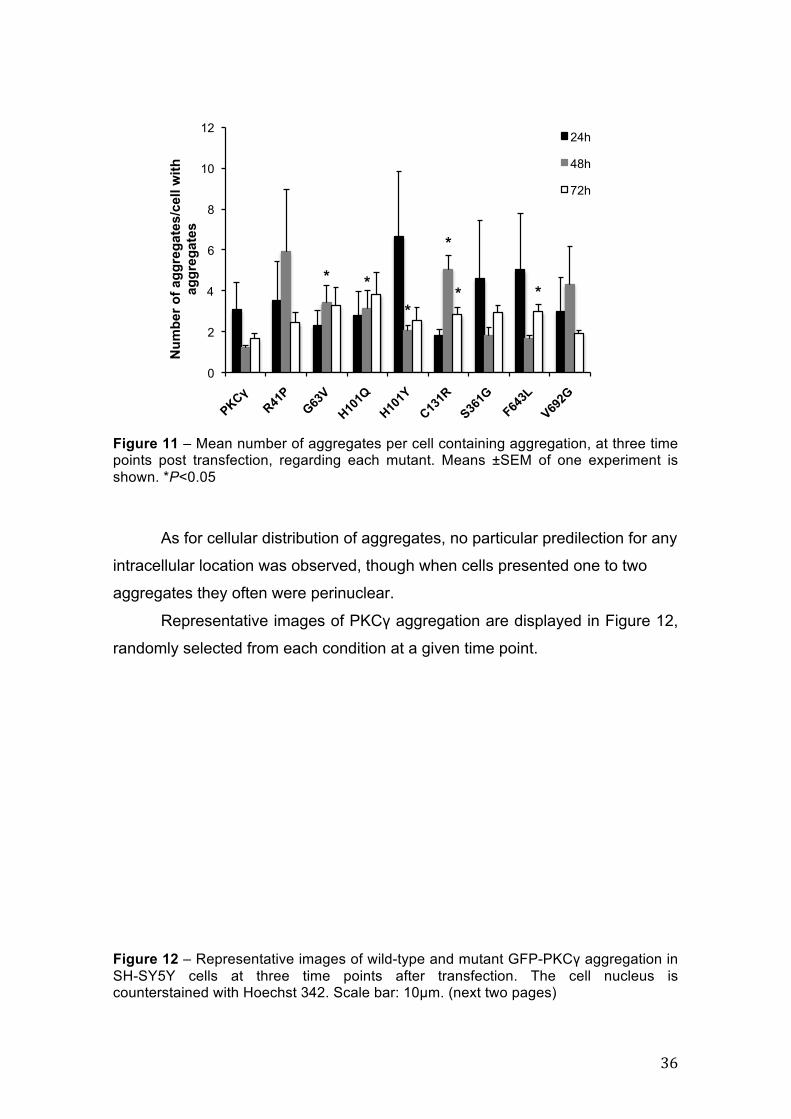
Regarding the mean number of aggregates per cell with PKCγ
aggregation (Figure 11), some statistical differences were found between wild-
type and mutant PKCγ at 48h and 72h. At 48h post transfection, G63V
(P=0.018), H101Q (P=0.033), H101Y (P=0.008) and C131R (P=0.007)
presented a larger number of aggregates per cell than normal PKCγ, while at
72h only C131R (P=0.010) and F643L (P<0.005) had significantly more
aggregates than PKCγ.
36
0
2
4
6
8
10
12
PKC!
R41P
G63V
H101Q
H101Y
C131R
S361G
F643L
V692G
Num
ber o
f agg
rega
tes/
cell
with
ag
greg
ates
24h
48h
72h
* * *
*
* *
Figure 11 – Mean number of aggregates per cell containing aggregation, at three time points post transfection, regarding each mutant. Means ±SEM of one experiment is shown. *P<0.05
As for cellular distribution of aggregates, no particular predilection for any
intracellular location was observed, though when cells presented one to two
aggregates they often were perinuclear.
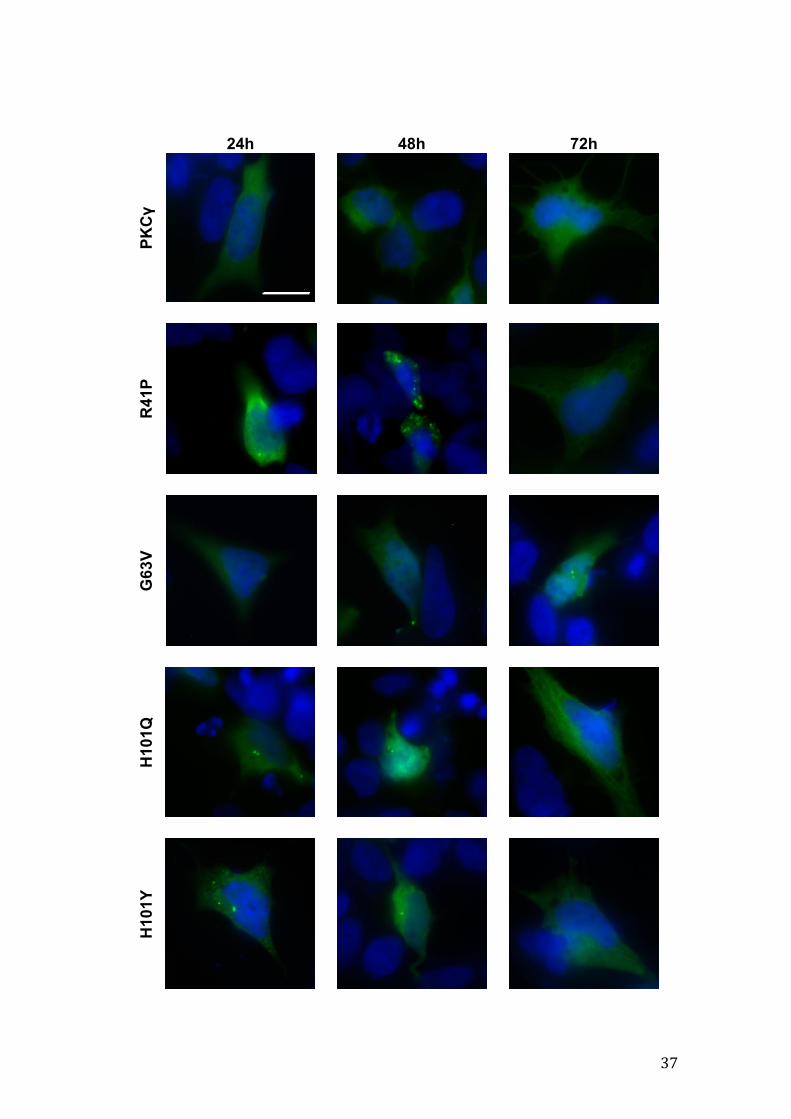
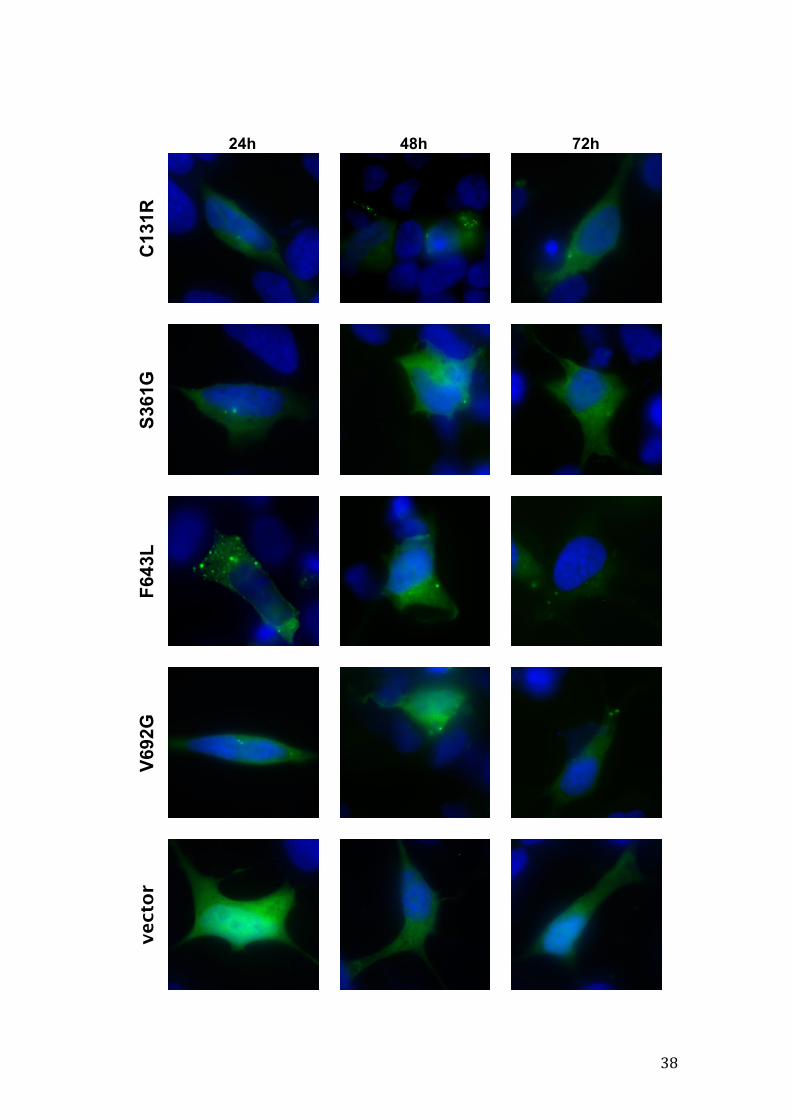
Representative images of PKCγ aggregation are displayed in Figure 12,
randomly selected from each condition at a given time point.
Figure 12 – Representative images of wild-type and mutant GFP-PKCγ aggregation in SH-SY5Y cells at three time points after transfection. The cell nucleus is counterstained with Hoechst 342. Scale bar: 10µm. (next two pages)
37
24h 48h 72h PK
C!
R41
P G
63V
H10
1Q
H10
1Y
38
C13
1R
S361
G
F643
L V6
92G
vector 24h 48h 72h
39
A B
C
4.2. Calpain cleavage: influence on pathogenesis
Calpain-mediated proteolysis has been implicated in some
neurodegenerative disorders. Aiming to assess the role of PKCγ cleavage in
SCA14, we explored the effect of calpain inhibition by calpastatin expression on
cell survival and aggregate formation.
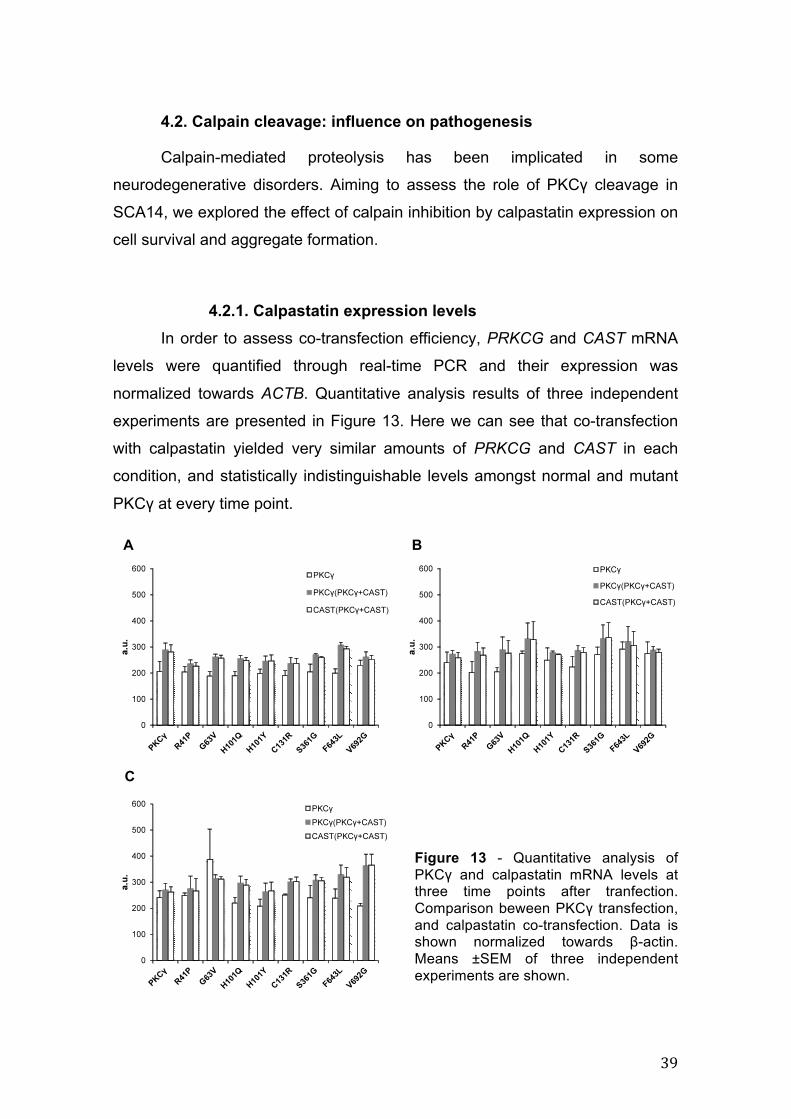
4.2.1. Calpastatin expression levels In order to assess co-transfection efficiency, PRKCG and CAST mRNA
levels were quantified through real-time PCR and their expression was
normalized towards ACTB. Quantitative analysis results of three independent
experiments are presented in Figure 13. Here we can see that co-transfection
with calpastatin yielded very similar amounts of PRKCG and CAST in each
condition, and statistically indistinguishable levels amongst normal and mutant
PKCγ at every time point.
Figure 13 - Quantitative analysis of PKCγ and calpastatin mRNA levels at three time points after tranfection. Comparison beween PKCγ transfection, and calpastatin co-transfection. Data is shown normalized towards β-actin. Means ±SEM of three independent experiments are shown.
40
A B
C
*
**
**
However, comparison with SH-SY5Y cells transfected only with PKCγ
show some statistical differences (not indicated) with a tendency for an increase
of expression levels in the co-transfection case.
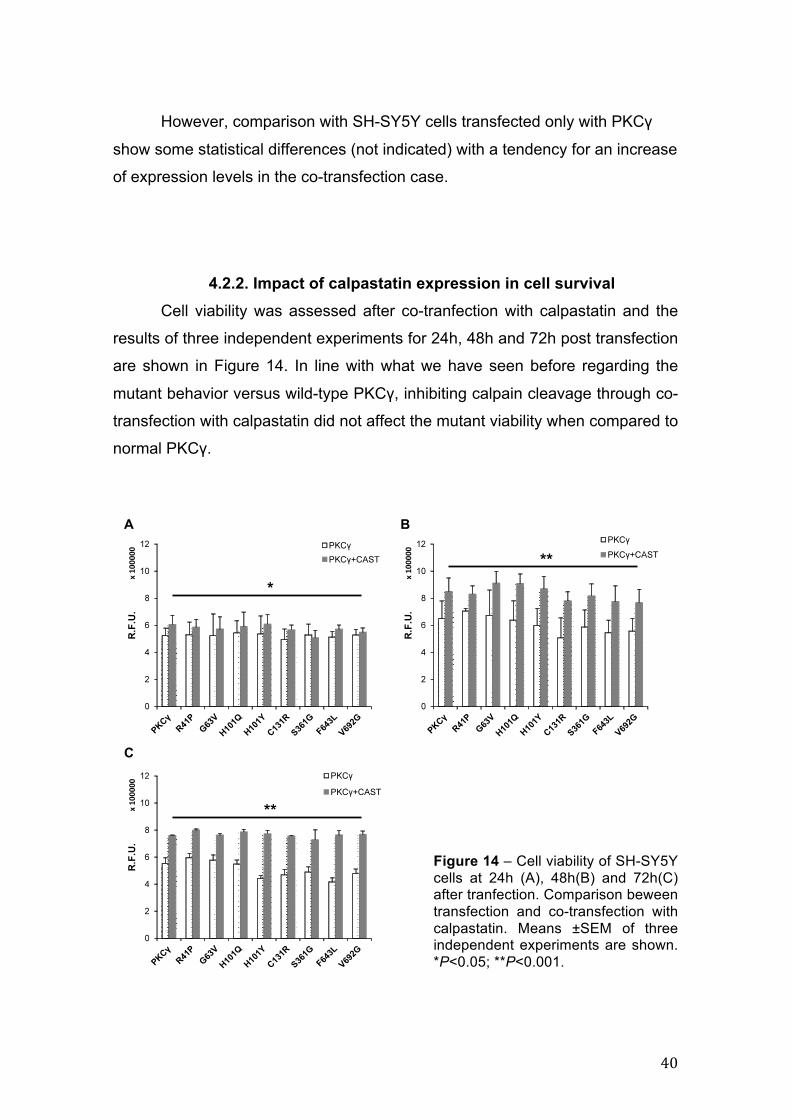
4.2.2. Impact of calpastatin expression in cell survival Cell viability was assessed after co-tranfection with calpastatin and the
results of three independent experiments for 24h, 48h and 72h post transfection
are shown in Figure 14. In line with what we have seen before regarding the
mutant behavior versus wild-type PKCγ, inhibiting calpain cleavage through co-
transfection with calpastatin did not affect the mutant viability when compared to
normal PKCγ.
Figure 14 – Cell viability of SH-SY5Y cells at 24h (A), 48h(B) and 72h(C) after tranfection. Comparison beween transfection and co-transfection with calpastatin. Means ±SEM of three independent experiments are shown. *P<0.05; **P<0.001.
41
A B
C
Nevertheless, significant results were obtained regarding calpain
inhibition in general, with a slight increase in cell viability at 24h post
transfection and a progressive increase in cell viability until 72h. Additionally,
cell viability in the presence of calpastatin is very similar to that of non-
transfected cells at every time point.
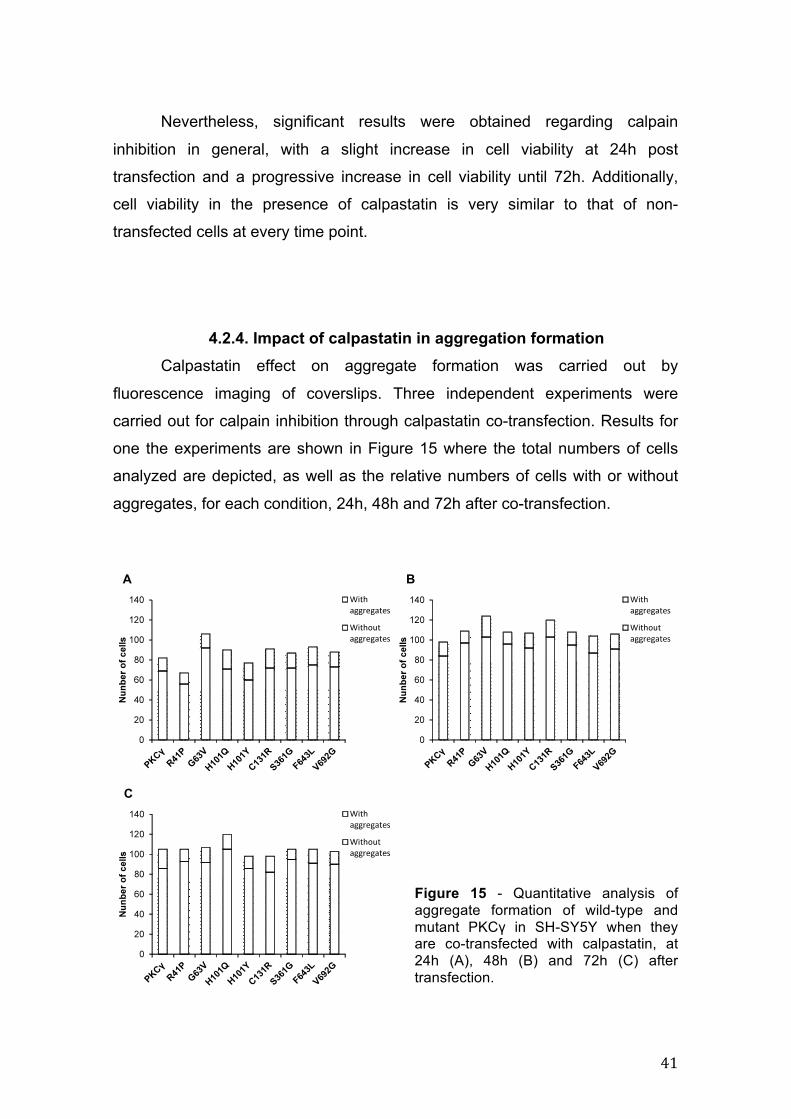
4.2.4. Impact of calpastatin in aggregation formation Calpastatin effect on aggregate formation was carried out by
fluorescence imaging of coverslips. Three independent experiments were
carried out for calpain inhibition through calpastatin co-transfection. Results for
one the experiments are shown in Figure 15 where the total numbers of cells
analyzed are depicted, as well as the relative numbers of cells with or without
aggregates, for each condition, 24h, 48h and 72h after co-transfection.
Figure 15 - Quantitative analysis of aggregate formation of wild-type and mutant PKCγ in SH-SY5Y when they are co-transfected with calpastatin, at 24h (A), 48h (B) and 72h (C) after transfection.
42
0
1
2
3
PKC!
R41P
G63V
H101Q
H101Y
C131R
S361G
F643L
V692G
Num
ber o
f agg
rega
tes/
cell
with
ag
greg
ates
24h
48h
72h
Overall, at any given time point no statistical differences were found,
either amongst wild-type and mutant PKCγ, or between the number of hours
post transfection. Conversely the presence of calpastatin alone was enough to
drastically reduce the percentage of aggregation in all cases, at 24h (P=0.001),
at 48h (P=0.001) and especially at 72h (P<0.001).
Immunocytochemistry was done to probe for calpastatin (FLAG-tagged),
however our protocol is not, yet sufficiently optimized and unspecific binding
was still observed in the control coverslip and thus these data are not
presented.
We also plotted the mean number of aggregates that each cell contained
(Figure 16), which revealed no statistically significant differences either between
mutants or wild-type PKCγ versus mutants at any transfection time. However,
when we compare the data in Figure 11 (from PKCγ transfection alone) to
Figure 16 (calpastatin co-transfection), regarding the mean number of
aggregates per cell, in the majority of the cases there are statistically significant
differences between the presence or absence or calpastatin, at every time point
– for almost all cases in the presence of calpastatin there are less aggregates
per cell.
Figure 16 – Mean number of aggregates per cell containing aggregates, at three time points post co-transfection with calpastatin, regarding each mutant. Means ±SEM of one experiment is shown.
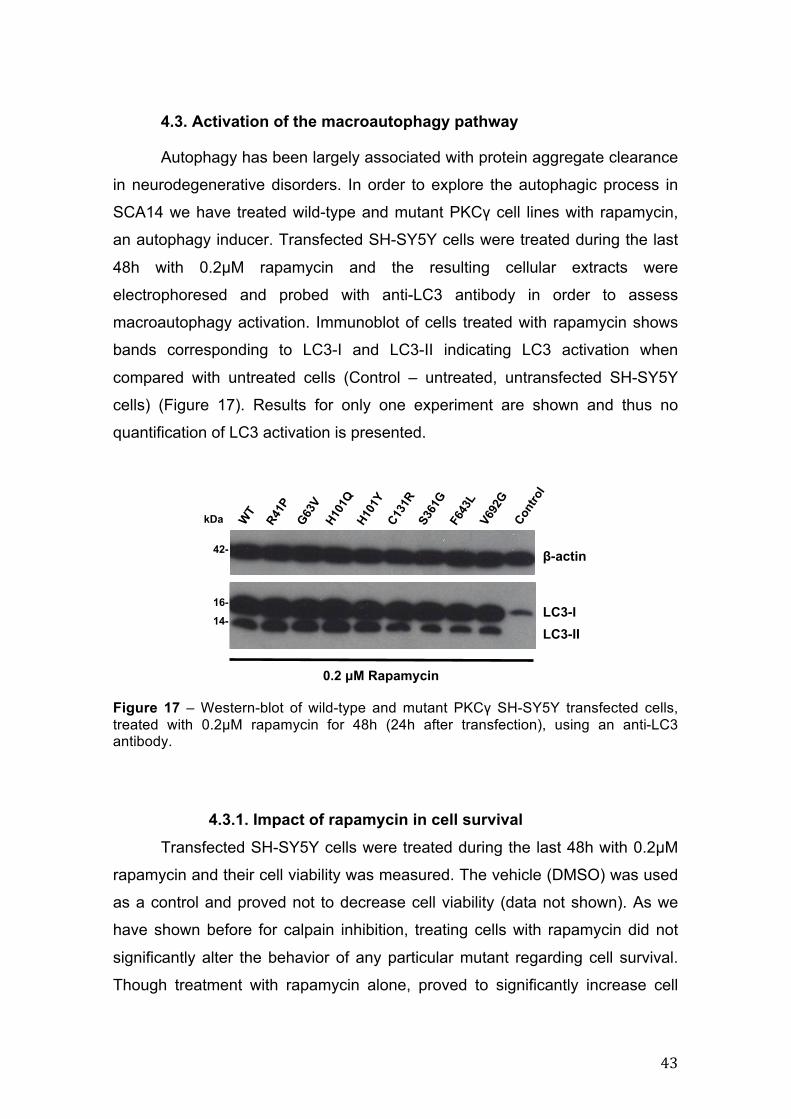
43
WT
H101
Q
G63V
H101
Y C1
31R
S361
G F6
43L
V692
G
R41P
42-
kDa
!-actin
LC3-I LC3-II
16-
14-
0.2 µM Rapamycin
Cont
rol
4.3. Activation of the macroautophagy pathway
Autophagy has been largely associated with protein aggregate clearance
in neurodegenerative disorders. In order to explore the autophagic process in
SCA14 we have treated wild-type and mutant PKCγ cell lines with rapamycin,
an autophagy inducer. Transfected SH-SY5Y cells were treated during the last
48h with 0.2µM rapamycin and the resulting cellular extracts were
electrophoresed and probed with anti-LC3 antibody in order to assess
macroautophagy activation. Immunoblot of cells treated with rapamycin shows
bands corresponding to LC3-I and LC3-II indicating LC3 activation when
compared with untreated cells (Control – untreated, untransfected SH-SY5Y
cells) (Figure 17). Results for only one experiment are shown and thus no
quantification of LC3 activation is presented.
Figure 17 – Western-blot of wild-type and mutant PKCγ SH-SY5Y transfected cells, treated with 0.2µM rapamycin for 48h (24h after transfection), using an anti-LC3 antibody.
4.3.1. Impact of rapamycin in cell survival
Transfected SH-SY5Y cells were treated during the last 48h with 0.2µM
rapamycin and their cell viability was measured. The vehicle (DMSO) was used
as a control and proved not to decrease cell viability (data not shown). As we
have shown before for calpain inhibition, treating cells with rapamycin did not
significantly alter the behavior of any particular mutant regarding cell survival.
Though treatment with rapamycin alone, proved to significantly increase cell
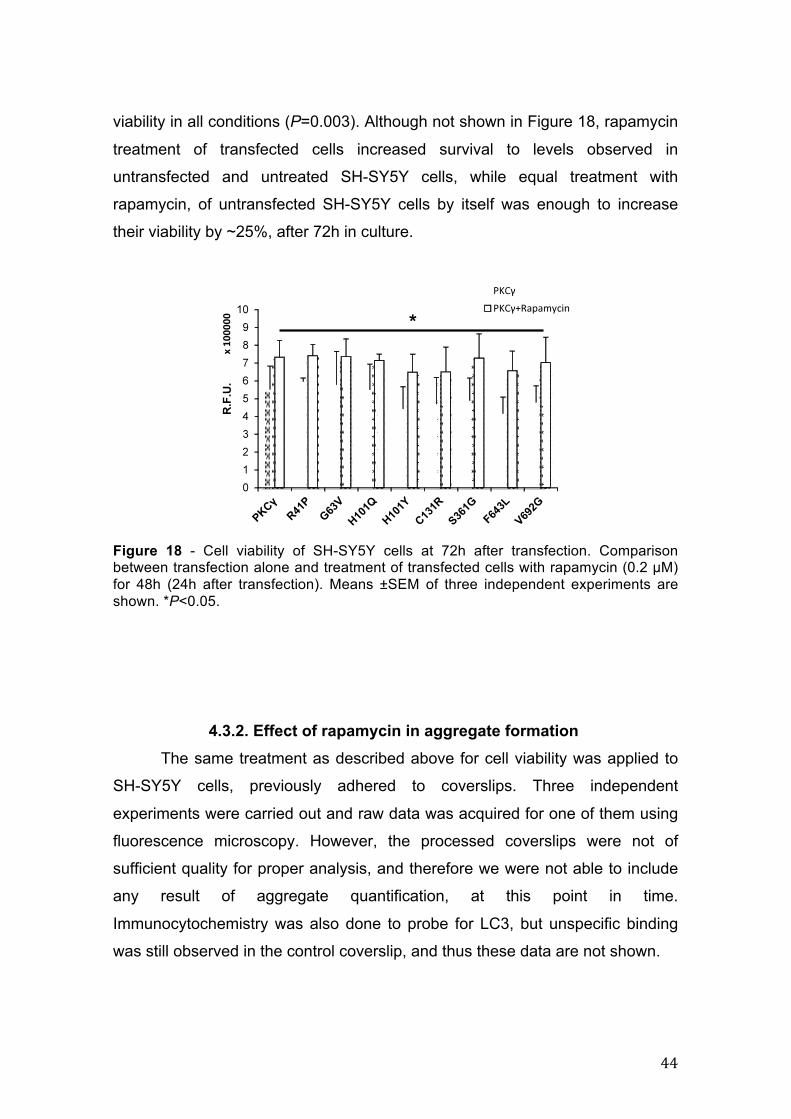
44
*
viability in all conditions (P=0.003). Although not shown in Figure 18, rapamycin
treatment of transfected cells increased survival to levels observed in
untransfected and untreated SH-SY5Y cells, while equal treatment with
rapamycin, of untransfected SH-SY5Y cells by itself was enough to increase
their viability by ~25%, after 72h in culture.
Figure 18 - Cell viability of SH-SY5Y cells at 72h after transfection. Comparison between transfection alone and treatment of transfected cells with rapamycin (0.2 µM) for 48h (24h after transfection). Means ±SEM of three independent experiments are shown. *P<0.05.
4.3.2. Effect of rapamycin in aggregate formation The same treatment as described above for cell viability was applied to
SH-SY5Y cells, previously adhered to coverslips. Three independent
experiments were carried out and raw data was acquired for one of them using
fluorescence microscopy. However, the processed coverslips were not of
sufficient quality for proper analysis, and therefore we were not able to include
any result of aggregate quantification, at this point in time.
Immunocytochemistry was also done to probe for LC3, but unspecific binding
was still observed in the control coverslip, and thus these data are not shown.
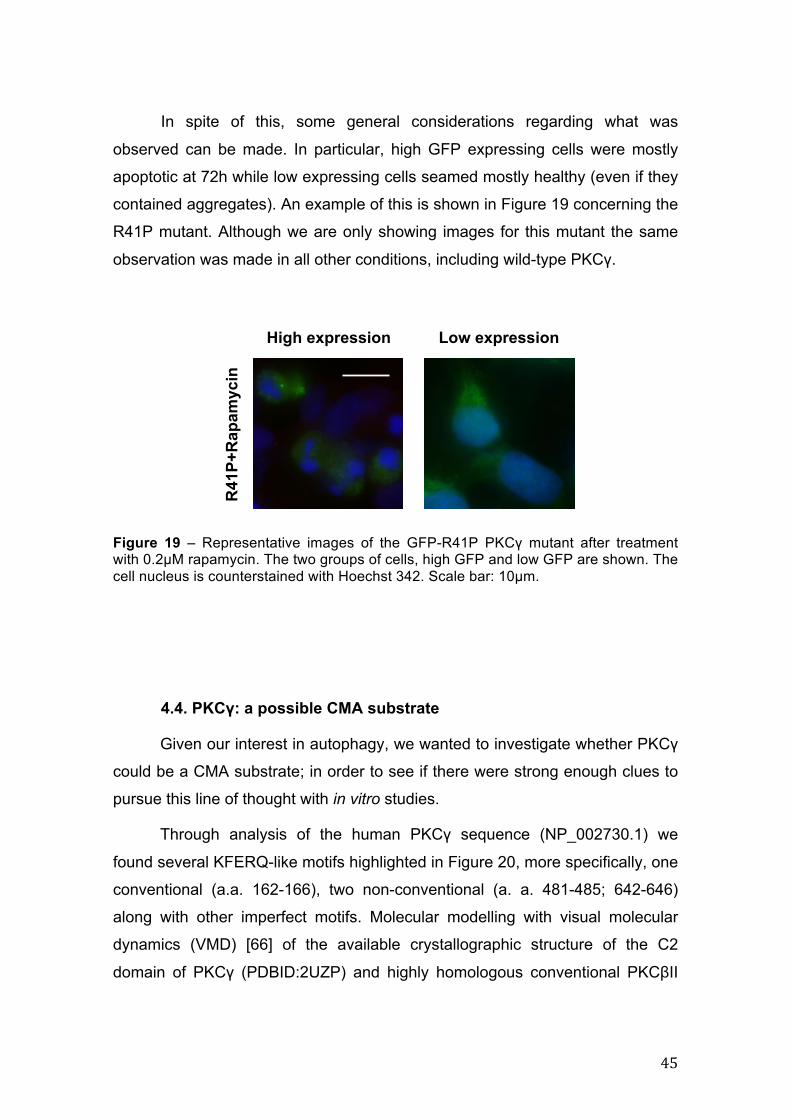
45
High expression Low expression
R41
P+R
apam
ycin
In spite of this, some general considerations regarding what was
observed can be made. In particular, high GFP expressing cells were mostly
apoptotic at 72h while low expressing cells seamed mostly healthy (even if they
contained aggregates). An example of this is shown in Figure 19 concerning the
R41P mutant. Although we are only showing images for this mutant the same
observation was made in all other conditions, including wild-type PKCγ.
Figure 19 – Representative images of the GFP-R41P PKCγ mutant after treatment with 0.2µM rapamycin. The two groups of cells, high GFP and low GFP are shown. The cell nucleus is counterstained with Hoechst 342. Scale bar: 10µm.
4.4. PKCγ: a possible CMA substrate
Given our interest in autophagy, we wanted to investigate whether PKCγ
could be a CMA substrate; in order to see if there were strong enough clues to
pursue this line of thought with in vitro studies.
Through analysis of the human PKCγ sequence (NP_002730.1) we
found several KFERQ-like motifs highlighted in Figure 20, more specifically, one
conventional (a.a. 162-166), two non-conventional (a. a. 481-485; 642-646)
along with other imperfect motifs. Molecular modelling with visual molecular
dynamics (VMD) [66] of the available crystallographic structure of the C2
domain of PKCγ (PDBID:2UZP) and highly homologous conventional PKCβII
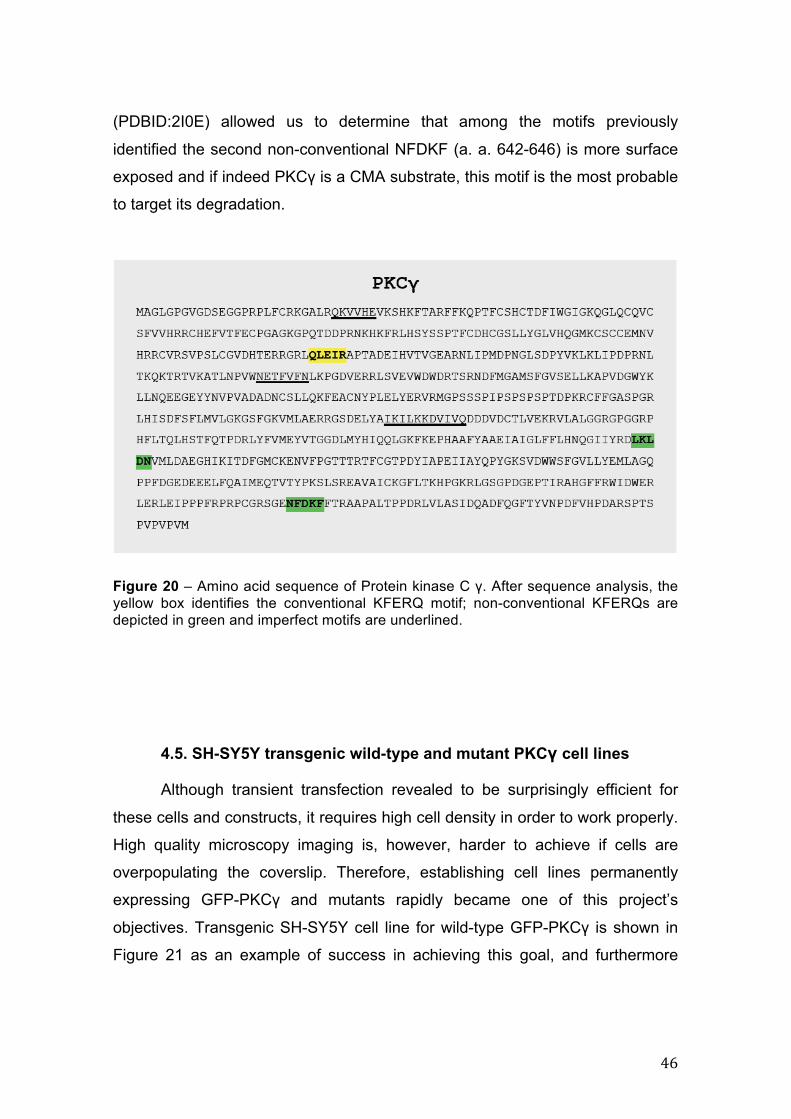
46
(PDBID:2I0E) allowed us to determine that among the motifs previously
identified the second non-conventional NFDKF (a. a. 642-646) is more surface
exposed and if indeed PKCγ is a CMA substrate, this motif is the most probable
to target its degradation.
Figure 20 – Amino acid sequence of Protein kinase C γ. After sequence analysis, the yellow box identifies the conventional KFERQ motif; non-conventional KFERQs are depicted in green and imperfect motifs are underlined.
4.5. SH-SY5Y transgenic wild-type and mutant PKCγ cell lines
Although transient transfection revealed to be surprisingly efficient for
these cells and constructs, it requires high cell density in order to work properly.
High quality microscopy imaging is, however, harder to achieve if cells are
overpopulating the coverslip. Therefore, establishing cell lines permanently
expressing GFP-PKCγ and mutants rapidly became one of this project’s
objectives. Transgenic SH-SY5Y cell line for wild-type GFP-PKCγ is shown in
Figure 21 as an example of success in achieving this goal, and furthermore
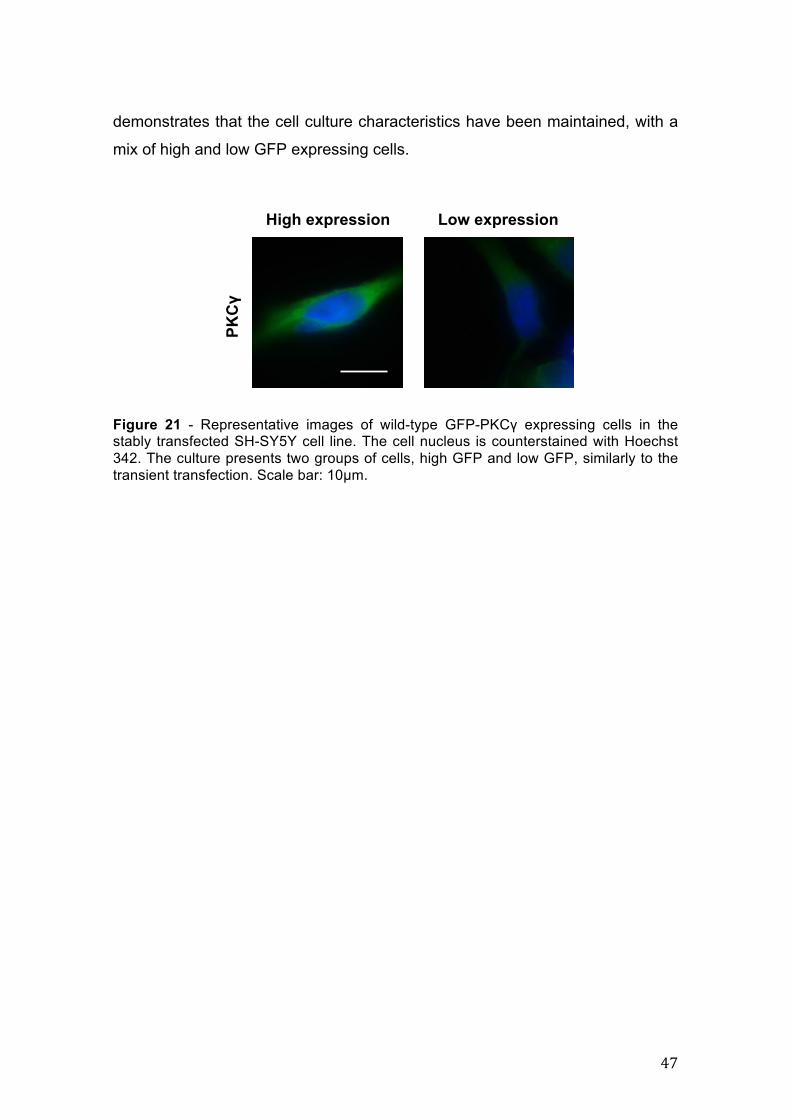
47
High expression Low expression PK
C!
demonstrates that the cell culture characteristics have been maintained, with a
mix of high and low GFP expressing cells.
Figure 21 - Representative images of wild-type GFP-PKCγ expressing cells in the stably transfected SH-SY5Y cell line. The cell nucleus is counterstained with Hoechst 342. The culture presents two groups of cells, high GFP and low GFP, similarly to the transient transfection. Scale bar: 10µm.
48
5. Discussion
5.1. PKC gamma aggregation
Besides the neurodegenerative pattern, the other most notorious
common thread between spinocerebellar ataxias is perhaps the formation of
inclusions or aggregates [67]. Here, we selected eight PKCγ mutants to study,
covering all domains of this protein kinase. Furthermore, since the 101 histidine
is the most recurrently mutated residue in SCA14, we included two substitutions
at this amino acid position [68].
It has been shown that mutations in the PRKCG gene, responsible for
SCA14 and encoding an altered PKCγ, have the ability to form different types of
aggregates. In particular, a group of authors has shown this aggregating feature
in various heterogeneous expression systems: CHO, COS-7, HeLa, HEK-293,
SH-SY5Y and primary Purkinje cells [16,18,19,65,69,70]. According to them,
three major classes of aggregates could be found: dot-like, medium-size and
massive aggregates; however, our expression system in SH-SY5Y cells was
not able to reproduce these findings. Almost all cells presenting aggregates had
dot-like inclusions, and only very few of them bared medium-sized aggregates.
Furthermore, the most striking difference in our findings was the absence of
massive aggregation in the whole amount of raw data acquired regarding
fluorescence imaging (~6000 cells), only one massive aggregate was found in a
cell with the V692G mutant (40 µm2), 24h after transfection. Likewise, Verbeek
and colleagues have not observed massive aggregation when they expressed
wild type or mutant PKCγ in COS-7 and HeLa cells [71].
Against what has been described before [16], the ability of mutant GFP-
PKCγ to form aggregates did not consistently vary from that of wild-type PKCγ,
though all studies involving functional analysis of a considerable number of
mutations did not use neuronal cells [16,19]. In our study, the percentage of
cells/neuroblastomas with wild-type GFP-PKCγ aggregates was higher than the
20% (or less) previously reported for non-neuronal cells [16,19,69], thus, one
could argue that this is due to over expression, but only about 30% of the
transfected cells brightly express GFP-PKCγ. On the other hand, this could also
49
be a reflection of wild-type GFP-PKCγ intrinsic propensity for aggregation.
Native PAGEs of Purkinje cell extract have shown that normal PKCγ-GFP might
occur in dimers and monomers, while mutant forms, form soluble higher order
oligomers [18]. In fact, the well-established PKC life cycle presented in Figure 2,
already hints towards this. After activation (in the open conformation), PKCs are
highly susceptible to phosphatases, and once dephosphorylated, in the
absence HSP70, they easily become insoluble [36].
Like others have seen before, we have two populations of transfected
cells, high and low GFP expressing, and similarly there is a correlation between
expression level and cell death [16]. Cultured cells expressing high levels of
wild-type or mutant PKCγ tend to die more quickly, with apoptotic nuclei, and
low expression cells tend to survive longer.
Conversely, in the cell viability assay, we did not see any differences
between wild-type and mutant PKCγ, or even a tendency for a decrease in cell
viability after 72h of constructs expression. Regarding this, and taking into
account our observations during all cell manipulations, we believe that high
GFP expressing cells are dying quickly mainly before 24h, and low expressing
cells are behaving more closely to healthy cells, even though a considerable
amount bear aggregates. Here, maybe the time frame in which we are looking
at cell survival after construct expression needs to be adjusted either for a
shorter period then 24h as well as longer than 72h.
Overall when comparing our results to that of other groups, we find one
striking difference that could account for the major inconsistencies we observed
- in all other studies the GFP tag was in the PKCγ C-terminal while ours was N-
terminally positioned (Table 4). This, to hold true, could mean that the N-
terminal tag is somehow preventing aggregation, since massive inclusions have
been seen in untagged PKCγ mutants [16]. Furthermore, it could also indicate
that the N-terminal domain is the one primarily responsible for aggregation. In
fact, about 80% of the mutations found in the PRKCG gene are located in the
regulatory portion of PKCγ, specifically in the C1 domain [68]. Surprisingly so,
mutations in the Ca2+ binding, C2 domain of PKCγ have never been found in
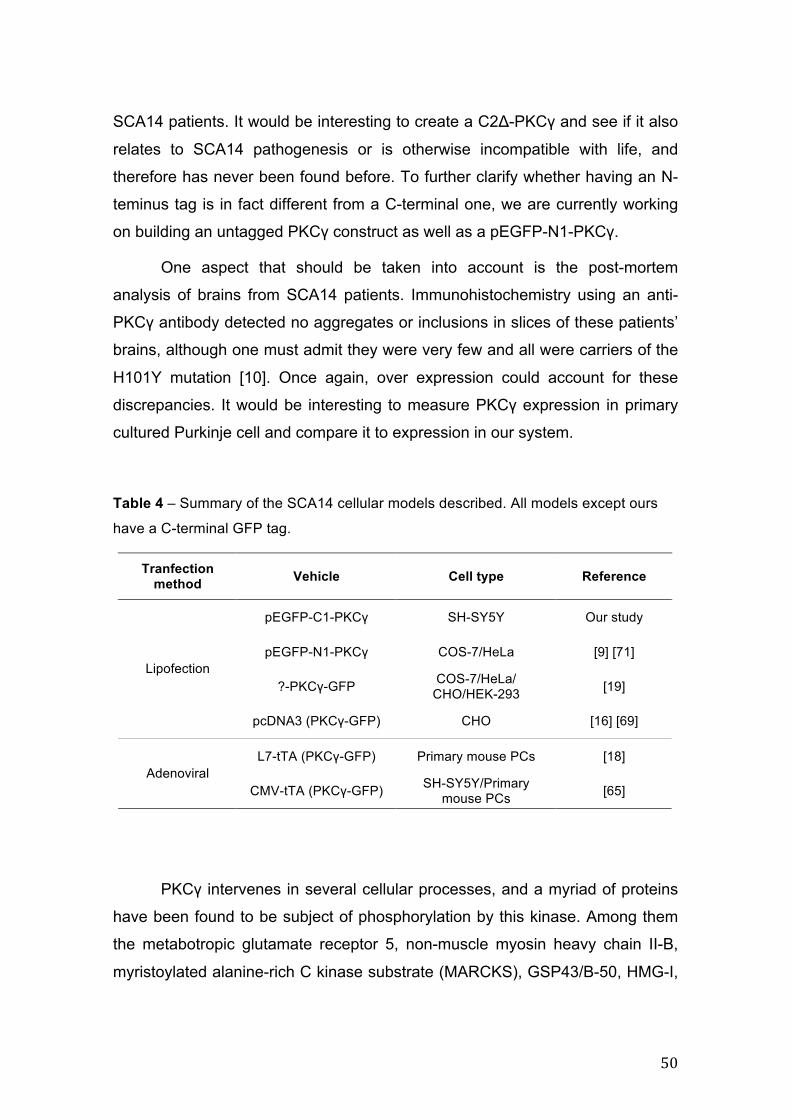
50
SCA14 patients. It would be interesting to create a C2Δ-PKCγ and see if it also
relates to SCA14 pathogenesis or is otherwise incompatible with life, and
therefore has never been found before. To further clarify whether having an N-
teminus tag is in fact different from a C-terminal one, we are currently working
on building an untagged PKCγ construct as well as a pEGFP-N1-PKCγ.
One aspect that should be taken into account is the post-mortem
analysis of brains from SCA14 patients. Immunohistochemistry using an anti-
PKCγ antibody detected no aggregates or inclusions in slices of these patients’
brains, although one must admit they were very few and all were carriers of the
H101Y mutation [10]. Once again, over expression could account for these
discrepancies. It would be interesting to measure PKCγ expression in primary
cultured Purkinje cell and compare it to expression in our system.
Table 4 – Summary of the SCA14 cellular models described. All models except ours
have a C-terminal GFP tag.
Tranfection method Vehicle Cell type Reference
pEGFP-C1-PKCγ SH-SY5Y Our study
pEGFP-N1-PKCγ COS-7/HeLa [9] [71]
?-PKCγ-GFP COS-7/HeLa/ CHO/HEK-293 [19]
Lipofection
pcDNA3 (PKCγ-GFP) CHO [16] [69]
L7-tTA (PKCγ-GFP) Primary mouse PCs [18] Adenoviral
CMV-tTA (PKCγ-GFP) SH-SY5Y/Primary mouse PCs [65]
PKCγ intervenes in several cellular processes, and a myriad of proteins
have been found to be subject of phosphorylation by this kinase. Among them
the metabotropic glutamate receptor 5, non-muscle myosin heavy chain II-B,
myristoylated alanine-rich C kinase substrate (MARCKS), GSP43/B-50, HMG-I,
51
RC3/neurogranin and glycogen synthetase, aprataxin stands out, as it was
found to be a preferential substrate of mutant PKCγ [72]. When mutated,
aprataxin is also the cause of a recessive form of ataxia – ataxia with
oculomotor apraxia type 1 (AOA1). This myriad of interactors (largely unknown
yet) gives rise to the hypothesis that when mutated, PKCγ might favor some
interactions in detriment of others as it happens with ataxin-3, responsible for
Machado-Joseph disease/SCA3 [73]. The differential distribution of key proteins
expressed by individual cells from the same type, may also contribute to the
selective loss of some neurons [74].
Very recently, the efficient generation of human induced neuronal cells
(hiN) from skin fibroblasts was reported [75,76]. The authors were able to
reprogram skin cells into neurons with the correct electrophysiological
properties, and the ability to integrate a neuronal circuitry in vitro and in vivo.
Moreover, they show the successful conversion of skin fibroblasts from
Alzheimer’s patients carrying PSEN mutations into neuronal cells, displaying
characteristics consistent with the brain pathology and remaining literature
about presenilins [75]. The possibility of creating a model system for SCA14, as
well as other neurodegenerative disorders, more closely related to the native
environment of neuronal cells in patients is now much closer, and could be the
answer, given all the controversial results regarding mutant PKCγ.
5.2. Calpain inhibition in SCA14
Calpains are believed to participate in various biological processes,
including integrin-mediated cell migration, cytoskeletal remodeling, cell
differentiation and apoptosis [47]. Also, toxicity by calpain activity has been
associated with a broad number of neurodegenerative diseases, including
Huntinton’s and Parkinson’s, extensively reviewed by Volsler et al (2008) [48].
PKCγ is amongst the long list of calpain substrates already identified, it
possesses two cleavage sites, for either m- or µ-calpains, located at the V3
hinge region – after serine 321 and phenylalanine 338. The V3 hinge connects
the regulatory to the kinase domains; consequently, cleavage at this site gives
52
rise to a permanently active kinase fragment, no longer dependent on Ca2+ and
phospholipid binding [49]. Given this, we wanted to investigate whether
proteolytic cleavage of PKCγ was influencing SCA14 pathogenesis. By
expressing the natural calpain inhibitor, calpastatin, we show that its presence
alone, in a 1:1 ratio to PKCγ, is enough to significantly reduce aggregate
formation and increase cell survival. Unfortunately we were not able to detect
cleavage fragments through western-blot, and therefore we can only infer about
the prevention of PKCγ proteolysis. Calpain involvement in initiating an
apoptotic cascade after an apoptotic stimulus is well documented, and the
outcome we see from calpastatin co-trasfection, could also be due to inhibition
of this ability [77], where, overexpression of PKCγ could represent the apoptotic
stimulus. This ameliorating effect of calpastatin, however, is clearly not acting
by decreasing PKCγ mRNA expression.
Besides calpastatin, several classes of inhibitors, including peptidyl
epoxide, aldehyde, and ketoamide inhibitors, targeting the active site of
calpains have proven effective, however, a major limitation to the researcher is
their lack of specificity among cysteine proteases and other proteolytic enzymes
[78].
Another explanation for the calpastatin effect observed can be put
forward, since calpastatin has also been recently described as an mTOR
independent autophagy inducer. Calpains cleave Atg5, compromising its ability
to participate in the double membrane elongation, and triggering apoptotic cell
death. It has been shown that several drugs acting at various levels in this
pathway (described in detail by Williams et al, 2008) can induce autophagy,
including calpastatin [79]. Presenting, in theory, numerous new ways of
increasing cellular autophagy levels.
Taken together, our data and the recently described calpain role in
autophagy provide novel avenues for further investigation of the impact of
calpain-mediated proteolysis in neurodegeneration.
53
5.3. Autophagy activation and aggregate clearance
In neurons, constitutive autophagy is essential in the maintenance of
cellular homeostasis, and besides being an age-dependent cellular activity, it
has also been found to be impaired in a number of neurodegenerative
conditions [3].
Rapamycin inhibits the activity of mTOR (mammalian target of
rapamycin), a kinase located in the core of two multiprotein complexes,
mTORC1 and mTORC2, that are involved in a myriad of cellular processes,
including protein synthesis, cell growth and proliferation as well as autophagy,
which is induced in the presence of rapamycin. Treatment with this drug has
proven to be beneficial in experimental models of several neurodegenerative
diseases, such as Parkinson’s disease. Moreover, rapamycin is an FDA-
approved drug used as an antibiotic and immunosuppressor, and more
recently, it started to be used in the treatment of cardiovascular diseases, thus
representing a very attractive way of modifying neurodegenerative disease
course [80].
For our SCA14 model, rapamycin treatment significantly increased
survival of cells transfected with wild-type and mutant PKCγ. Nevertheless, the
two types of GFP expressing cells were observed to have different behavior
regarding cell viability in these conditions. High GFP expressing cells
apparently were not rescued after drug treatment during 48h, as they were
mostly apoptotic. For this sub-population, perhaps treatment after 24h of
overexpression was tardy. Low GFP expressing cells were otherwise observed
to behave like healthy cells although many still showed aggregates. Rapamycin
action in our expression system still needs further analysis, in particular
immunoblot quantification of soluble PKCγ and confirmation of autophagy
activation through LC3 quantification.
The newly generated permanently expressing PKCγ cell lines will be
valuable tools for clarifying some of the obtained results and will also allow to
perform live cell imaging to better understand the aggregate formation and cell
death dynamics in our expression system.
54
5.3.1. Protein kinase C gamma as a possible substrate for CMA
A growing body of evidence supports a critical role for protein
degradation machinery in neurodegeneration. CMA abnormalities have been
tightly connected to Parkinson’s disease; in particular α-synuclein stands out
and is perhaps the “golden example” of CMA failure in neurodegeneration [81].
Other diseases have also been linked to CMA, like polyglutamine disorders
(Huntingnton’s and SCA7) and Alzheimer’s (Tau and APP) [82,83,84,85]. This
research bottom-line suggests that mutant proteins either “clog” the lysosomal
pore, interact abnormally with CMA machinery or disrupt the lysosomal
membrane, compromising its and/or other CMA substrates degradation.
Given this preponderant role CMA has gained in the last few years, to try
and assess CMA function in SCA14 would be interesting. Our preliminary
results indicate that PKCγ is a potential CMA substrate worthwhile of further
investigation. Here, the transgenic SH-SY5Y cell lines we now have available
will help us to further explore this subject; starting with the wild-type PKCγ
transgenic for some assays such as serum starvation over 8h, proteasome,
macroautophagy and CMA blockage, while following PKCγ accumulation.
Curiously, the F643L mutant was the one that presented more consistent
results and stood out from the remaining mutants, could it be just a coincidence
that this mutation sits right in the middle of the KFERQ motif we deemed the
most probable to target PKCγ for CMA degradation, even though it does not
abolishes the motif?
Furthermore, very recently a new method for tracking CMA degradation
based on a photoconvertible fluorescent reporter was described, which we plan
to use to assess the putative KFERQs we found, with the added advantage that
the assay has already been validated for SH-SY5Y cells [86].
55
6. Conclusions
The main aims proposed at the beginning of this thesis’ work were
accomplished. A cellular model for spinocerebellar ataxia type 14 was
successfully created, through efficient transient expression of both wild-type
and mutant PKCγ, and validated through mRNA expression and fluorescence
microscopy. Stable expression of these constructs was also achieved, providing
a good platform for future confirmation of the obtained results and to further
explore the mechanisms involved in SCA14 aggregate formation and clearance.
We have demonstrated for the first time that calpain inhibition significantly
reduces aggregate formation and increases cell survival in all experimental
conditions, pointing to a role of PKCγ proteolysis in protein turn-over and
aggregation. We were also able to show that rapamycin treatment also
increased cell viability, including that of mutant PKCγ expressing cells. Our
preliminary data also point for a wide role of rapamycin in aggregate clearance.
The possibility of both these ameliorating effects being mediated and converge
in autophagy activation is discussed, as well as the importance of the C1
regulatory domain for PKCγ aggregation. We also provide evidence that PKCγ
may be a target for CMA degradation.
56
7. Perspectives
In light of our results, it will be important to clarify the influence of the tag
on aggregate formation either regarding its presence, with an untagged
construct, or its relative position to PKCγ, with pEGFP-N1-PKCγ.
SH-SY5Y cells expressing mutant PKCγ, did not show differences from
wild-type in the assay used to infer cell viability, however, cell death was
observed by fluorescence microscopy, and therefore, other methodology will
have to be used in order to clarify mutant PKCγ impact in cell survival.
Live cell imaging of the transgenic cell lines generated will allow the
observation of aggregate formation and dynamics, which will help to adjust the
time-window we are using.
The time frame in which we are taking snapshots of our model system
will most likely have to be expanded, since we want to collect information about
the cells that have already died by 24h of overexpression, as well as follow
aggregation and cell death in low GFP expressing cells beyond 72h.
Concerning calpastatin co-transfection, we would like to see if there are
traces of macroautophagy induction, by quantifying LC3I/II levels through
immunoblotting. Aggregate reduction/clearance through calpain inhibition, will
additionally be confirmed by treatment of transgenic cell lines wild calpeptin, a
cell permeable peptide derived from calpastatin, as well as one of the
pharmacological drugs described by Williams et al (2008) as mTOR
independent autophagy inducers, acting over the camp loop, to confirm or not
the involvement of this pathway.
The experiments with rapamycin will be reproduced in the transgenic cell
lines, in order to obtain clearer results.
The possibility of PKCγ being a CMA substrate will be further explored,
by assessing the ability of each putative KFERQ to target a photoconvertible
reporter for lysosomal degradation. We will also use the transgenic cell lines
follow PKCγ accumulation in particular conditions (starvation, systematic

57
blockage of each degradation system), paying special attention to the F643L
mutant.
We will also further characterize our experimental model by
immunobloting PKCγ levels present in all experimental settings, in both soluble
and insoluble fractions.
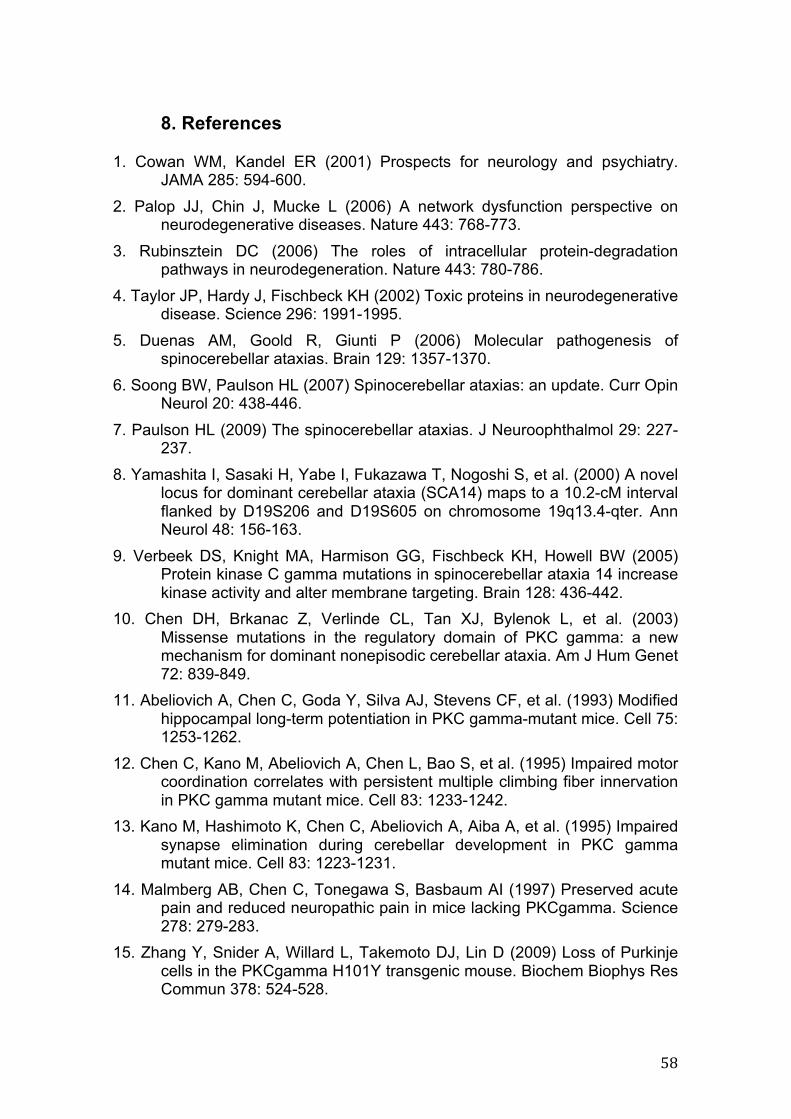
58
8. References
1. Cowan WM, Kandel ER (2001) Prospects for neurology and psychiatry. JAMA 285: 594-600.
2. Palop JJ, Chin J, Mucke L (2006) A network dysfunction perspective on neurodegenerative diseases. Nature 443: 768-773.
3. Rubinsztein DC (2006) The roles of intracellular protein-degradation pathways in neurodegeneration. Nature 443: 780-786.
4. Taylor JP, Hardy J, Fischbeck KH (2002) Toxic proteins in neurodegenerative disease. Science 296: 1991-1995.
5. Duenas AM, Goold R, Giunti P (2006) Molecular pathogenesis of spinocerebellar ataxias. Brain 129: 1357-1370.
6. Soong BW, Paulson HL (2007) Spinocerebellar ataxias: an update. Curr Opin Neurol 20: 438-446.
7. Paulson HL (2009) The spinocerebellar ataxias. J Neuroophthalmol 29: 227-237.
8. Yamashita I, Sasaki H, Yabe I, Fukazawa T, Nogoshi S, et al. (2000) A novel locus for dominant cerebellar ataxia (SCA14) maps to a 10.2-cM interval flanked by D19S206 and D19S605 on chromosome 19q13.4-qter. Ann Neurol 48: 156-163.
9. Verbeek DS, Knight MA, Harmison GG, Fischbeck KH, Howell BW (2005) Protein kinase C gamma mutations in spinocerebellar ataxia 14 increase kinase activity and alter membrane targeting. Brain 128: 436-442.
10. Chen DH, Brkanac Z, Verlinde CL, Tan XJ, Bylenok L, et al. (2003) Missense mutations in the regulatory domain of PKC gamma: a new mechanism for dominant nonepisodic cerebellar ataxia. Am J Hum Genet 72: 839-849.
11. Abeliovich A, Chen C, Goda Y, Silva AJ, Stevens CF, et al. (1993) Modified hippocampal long-term potentiation in PKC gamma-mutant mice. Cell 75: 1253-1262.
12. Chen C, Kano M, Abeliovich A, Chen L, Bao S, et al. (1995) Impaired motor coordination correlates with persistent multiple climbing fiber innervation in PKC gamma mutant mice. Cell 83: 1233-1242.
13. Kano M, Hashimoto K, Chen C, Abeliovich A, Aiba A, et al. (1995) Impaired synapse elimination during cerebellar development in PKC gamma mutant mice. Cell 83: 1223-1231.
14. Malmberg AB, Chen C, Tonegawa S, Basbaum AI (1997) Preserved acute pain and reduced neuropathic pain in mice lacking PKCgamma. Science 278: 279-283.
15. Zhang Y, Snider A, Willard L, Takemoto DJ, Lin D (2009) Loss of Purkinje cells in the PKCgamma H101Y transgenic mouse. Biochem Biophys Res Commun 378: 524-528.
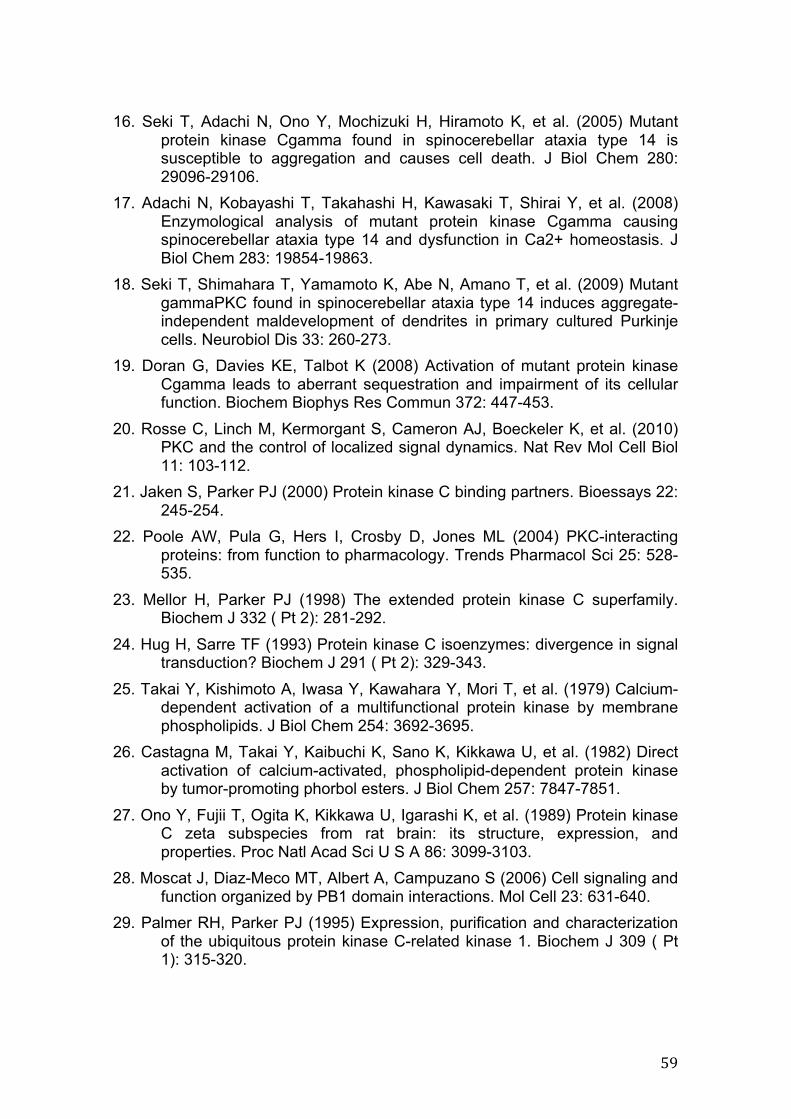
59
16. Seki T, Adachi N, Ono Y, Mochizuki H, Hiramoto K, et al. (2005) Mutant protein kinase Cgamma found in spinocerebellar ataxia type 14 is susceptible to aggregation and causes cell death. J Biol Chem 280: 29096-29106.
17. Adachi N, Kobayashi T, Takahashi H, Kawasaki T, Shirai Y, et al. (2008) Enzymological analysis of mutant protein kinase Cgamma causing spinocerebellar ataxia type 14 and dysfunction in Ca2+ homeostasis. J Biol Chem 283: 19854-19863.
18. Seki T, Shimahara T, Yamamoto K, Abe N, Amano T, et al. (2009) Mutant gammaPKC found in spinocerebellar ataxia type 14 induces aggregate-independent maldevelopment of dendrites in primary cultured Purkinje cells. Neurobiol Dis 33: 260-273.
19. Doran G, Davies KE, Talbot K (2008) Activation of mutant protein kinase Cgamma leads to aberrant sequestration and impairment of its cellular function. Biochem Biophys Res Commun 372: 447-453.
20. Rosse C, Linch M, Kermorgant S, Cameron AJ, Boeckeler K, et al. (2010) PKC and the control of localized signal dynamics. Nat Rev Mol Cell Biol 11: 103-112.
21. Jaken S, Parker PJ (2000) Protein kinase C binding partners. Bioessays 22: 245-254.
22. Poole AW, Pula G, Hers I, Crosby D, Jones ML (2004) PKC-interacting proteins: from function to pharmacology. Trends Pharmacol Sci 25: 528-535.
23. Mellor H, Parker PJ (1998) The extended protein kinase C superfamily. Biochem J 332 ( Pt 2): 281-292.
24. Hug H, Sarre TF (1993) Protein kinase C isoenzymes: divergence in signal transduction? Biochem J 291 ( Pt 2): 329-343.
25. Takai Y, Kishimoto A, Iwasa Y, Kawahara Y, Mori T, et al. (1979) Calcium-dependent activation of a multifunctional protein kinase by membrane phospholipids. J Biol Chem 254: 3692-3695.
26. Castagna M, Takai Y, Kaibuchi K, Sano K, Kikkawa U, et al. (1982) Direct activation of calcium-activated, phospholipid-dependent protein kinase by tumor-promoting phorbol esters. J Biol Chem 257: 7847-7851.
27. Ono Y, Fujii T, Ogita K, Kikkawa U, Igarashi K, et al. (1989) Protein kinase C zeta subspecies from rat brain: its structure, expression, and properties. Proc Natl Acad Sci U S A 86: 3099-3103.
28. Moscat J, Diaz-Meco MT, Albert A, Campuzano S (2006) Cell signaling and function organized by PB1 domain interactions. Mol Cell 23: 631-640.
29. Palmer RH, Parker PJ (1995) Expression, purification and characterization of the ubiquitous protein kinase C-related kinase 1. Biochem J 309 ( Pt 1): 315-320.
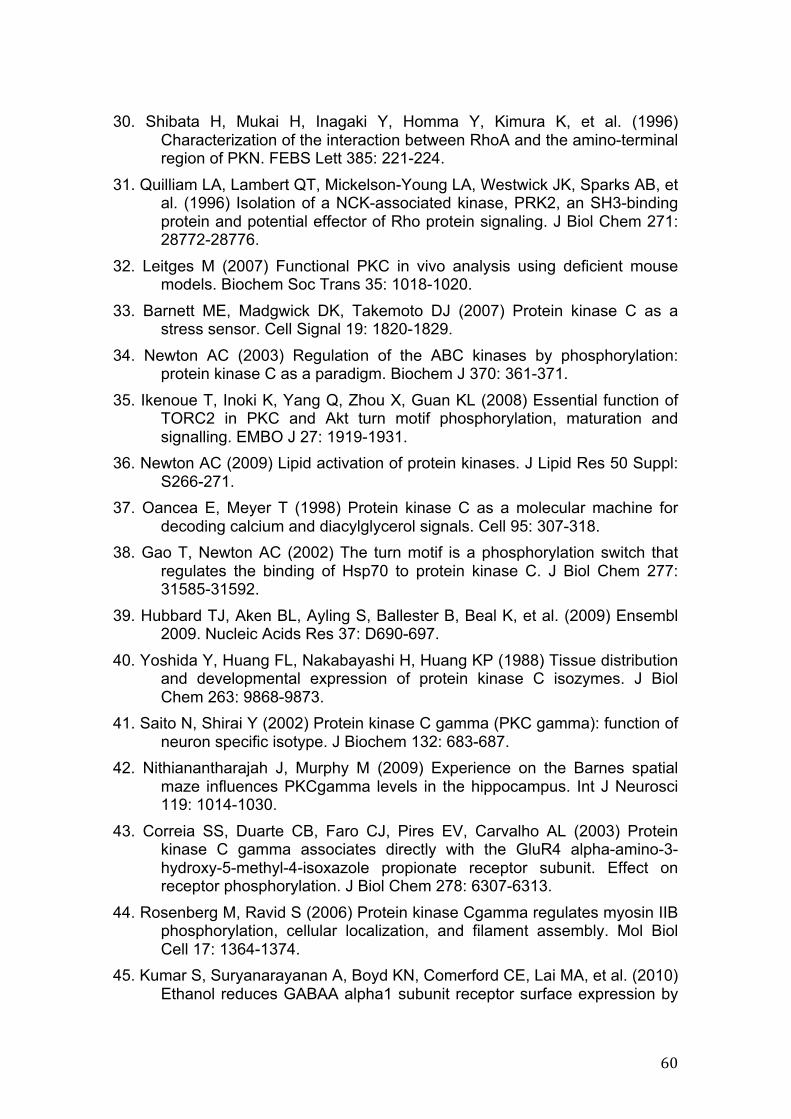
60
30. Shibata H, Mukai H, Inagaki Y, Homma Y, Kimura K, et al. (1996) Characterization of the interaction between RhoA and the amino-terminal region of PKN. FEBS Lett 385: 221-224.
31. Quilliam LA, Lambert QT, Mickelson-Young LA, Westwick JK, Sparks AB, et al. (1996) Isolation of a NCK-associated kinase, PRK2, an SH3-binding protein and potential effector of Rho protein signaling. J Biol Chem 271: 28772-28776.
32. Leitges M (2007) Functional PKC in vivo analysis using deficient mouse models. Biochem Soc Trans 35: 1018-1020.
33. Barnett ME, Madgwick DK, Takemoto DJ (2007) Protein kinase C as a stress sensor. Cell Signal 19: 1820-1829.
34. Newton AC (2003) Regulation of the ABC kinases by phosphorylation: protein kinase C as a paradigm. Biochem J 370: 361-371.
35. Ikenoue T, Inoki K, Yang Q, Zhou X, Guan KL (2008) Essential function of TORC2 in PKC and Akt turn motif phosphorylation, maturation and signalling. EMBO J 27: 1919-1931.
36. Newton AC (2009) Lipid activation of protein kinases. J Lipid Res 50 Suppl: S266-271.
37. Oancea E, Meyer T (1998) Protein kinase C as a molecular machine for decoding calcium and diacylglycerol signals. Cell 95: 307-318.
38. Gao T, Newton AC (2002) The turn motif is a phosphorylation switch that regulates the binding of Hsp70 to protein kinase C. J Biol Chem 277: 31585-31592.
39. Hubbard TJ, Aken BL, Ayling S, Ballester B, Beal K, et al. (2009) Ensembl 2009. Nucleic Acids Res 37: D690-697.
40. Yoshida Y, Huang FL, Nakabayashi H, Huang KP (1988) Tissue distribution and developmental expression of protein kinase C isozymes. J Biol Chem 263: 9868-9873.
41. Saito N, Shirai Y (2002) Protein kinase C gamma (PKC gamma): function of neuron specific isotype. J Biochem 132: 683-687.
42. Nithianantharajah J, Murphy M (2009) Experience on the Barnes spatial maze influences PKCgamma levels in the hippocampus. Int J Neurosci 119: 1014-1030.
43. Correia SS, Duarte CB, Faro CJ, Pires EV, Carvalho AL (2003) Protein kinase C gamma associates directly with the GluR4 alpha-amino-3-hydroxy-5-methyl-4-isoxazole propionate receptor subunit. Effect on receptor phosphorylation. J Biol Chem 278: 6307-6313.
44. Rosenberg M, Ravid S (2006) Protein kinase Cgamma regulates myosin IIB phosphorylation, cellular localization, and filament assembly. Mol Biol Cell 17: 1364-1374.
45. Kumar S, Suryanarayanan A, Boyd KN, Comerford CE, Lai MA, et al. (2010) Ethanol reduces GABAA alpha1 subunit receptor surface expression by
61
a protein kinase Cgamma-dependent mechanism in cultured cerebral cortical neurons. Mol Pharmacol 77: 793-803.
46. Bevers MB, Neumar RW (2008) Mechanistic role of calpains in postischemic neurodegeneration. J Cereb Blood Flow Metab 28: 655-673.
47. Goll DE, Thompson VF, Li H, Wei W, Cong J (2003) The calpain system. Physiol Rev 83: 731-801.
48. Vosler PS, Brennan CS, Chen J (2008) Calpain-mediated signaling mechanisms in neuronal injury and neurodegeneration. Mol Neurobiol 38: 78-100.
49. Kishimoto A, Mikawa K, Hashimoto K, Yasuda I, Tanaka S, et al. (1989) Limited proteolysis of protein kinase C subspecies by calcium-dependent neutral protease (calpain). J Biol Chem 264: 4088-4092.
50. Gafni J, Hermel E, Young JE, Wellington CL, Hayden MR, et al. (2004) Inhibition of calpain cleavage of huntingtin reduces toxicity: accumulation of calpain/caspase fragments in the nucleus. J Biol Chem 279: 20211-20220.
51. Mellgren RL (2008) Structural biology: Enzyme knocked for a loop. Nature 456: 337-338.
52. Moldoveanu T, Gehring K, Green DR (2008) Concerted multi-pronged attack by calpastatin to occlude the catalytic cleft of heterodimeric calpains. Nature 456: 404-408.
53. Finley D (2009) Recognition and processing of ubiquitin-protein conjugates by the proteasome. Annu Rev Biochem 78: 477-513.
54. Cuervo AM (2010) Chaperone-mediated autophagy: selectivity pays off. Trends Endocrinol Metab 21: 142-150.
55. Ohsumi Y, Mizushima N (2004) Two ubiquitin-like conjugation systems essential for autophagy. Semin Cell Dev Biol 15: 231-236.
56. Maiuri MC, Zalckvar E, Kimchi A, Kroemer G (2007) Self-eating and self-killing: crosstalk between autophagy and apoptosis. Nat Rev Mol Cell Biol 8: 741-752.
57. Boland B, Nixon RA (2006) Neuronal macroautophagy: from development to degeneration. Mol Aspects Med 27: 503-519.
58. Dice JF (2007) Chaperone-mediated autophagy. Autophagy 3: 295-299. 59. Orenstein SJ, Cuervo AM (2010) Chaperone-mediated autophagy:
Molecular mechanisms and physiological relevance. Semin Cell Dev Biol.
60. Agarraberes FA, Terlecky SR, Dice JF (1997) An intralysosomal hsp70 is required for a selective pathway of lysosomal protein degradation. J Cell Biol 137: 825-834.
62
61. Shin Y, Klucken J, Patterson C, Hyman BT, McLean PJ (2005) The co-chaperone carboxyl terminus of Hsp70-interacting protein (CHIP) mediates alpha-synuclein degradation decisions between proteasomal and lysosomal pathways. J Biol Chem 280: 23727-23734.
62. Bandyopadhyay U, Kaushik S, Varticovski L, Cuervo AM (2008) The chaperone-mediated autophagy receptor organizes in dynamic protein complexes at the lysosomal membrane. Mol Cell Biol 28: 5747-5763.
63. Fuertes G, Martin De Llano JJ, Villarroya A, Rivett AJ, Knecht E (2003) Changes in the proteolytic activities of proteasomes and lysosomes in human fibroblasts produced by serum withdrawal, amino-acid deprivation and confluent conditions. Biochem J 375: 75-86.
64. Massey AC, Kaushik S, Sovak G, Kiffin R, Cuervo AM (2006) Consequences of the selective blockage of chaperone-mediated autophagy. Proc Natl Acad Sci U S A 103: 5805-5810.
65. Yamamoto K, Seki T, Adachi N, Takahashi T, Tanaka S, et al. (2010) Mutant protein kinase C gamma that causes spinocerebellar ataxia type 14 (SCA14) is selectively degraded by autophagy. Genes Cells 15: 425-438.
66. Humphrey W, Dalke A, Schulten K (1996) VMD: visual molecular dynamics. J Mol Graph 14: 33-38, 27-38.
67. Durr A (2010) Autosomal dominant cerebellar ataxias: polyglutamine expansions and beyond. Lancet Neurol 9: 885-894.
68. Nolte D, Klebe S, Baron R, Deuschl G, Muller U (2007) Codon 101 of PRKCG, a preferential mutation site in SCA14. Mov Disord 22: 1831-1832.
69. Seki T, Takahashi H, Adachi N, Abe N, Shimahara T, et al. (2007) Aggregate formation of mutant protein kinase C gamma found in spinocerebellar ataxia type 14 impairs ubiquitin-proteasome system and induces endoplasmic reticulum stress. Eur J Neurosci 26: 3126-3140.
70. Seki T, Takahashi H, Yamamoto K, Ogawa K, Onji T, et al. (2010) Congo red, an amyloid-inhibiting compound, alleviates various types of cellular dysfunction triggered by mutant protein kinase cgamma that causes spinocerebellar ataxia type 14 (SCA14) by inhibiting oligomerization and aggregation. J Pharmacol Sci 114: 206-216.
71. Verbeek DS, Goedhart J, Bruinsma L, Sinke RJ, Reits EA (2008) PKC gamma mutations in spinocerebellar ataxia type 14 affect C1 domain accessibility and kinase activity leading to aberrant MAPK signaling. J Cell Sci 121: 2339-2349.
72. Asai H, Hirano M, Shimada K, Kiriyama T, Furiya Y, et al. (2009) Protein kinase C gamma, a protein causative for dominant ataxia, negatively regulates nuclear import of recessive-ataxia-related aprataxin. Hum Mol Genet 18: 3533-3543.
63
73. Durcan TM, Kontogiannea M, Thorarinsdottir T, Fallon L, Williams AJ, et al. (2011) The Machado-Joseph disease-associated mutant form of ataxin-3 regulates parkin ubiquitination and stability. Hum Mol Genet 20: 141-154.
74. Double KL, Reyes S, Werry EL, Halliday GM (2010) Selective cell death in neurodegeneration: why are some neurons spared in vulnerable regions? Prog Neurobiol 92: 316-329.
75. Qiang L, Fujita R, Yamashita T, Angulo S, Rhinn H, et al. (2011) Directed conversion of Alzheimer's disease patient skin fibroblasts into functional neurons. Cell 146: 359-371.
76. Pang ZP, Yang N, Vierbuchen T, Ostermeier A, Fuentes DR, et al. (2011) Induction of human neuronal cells by defined transcription factors. Nature.
77. Camins A, Verdaguer E, Folch J, Pallas M (2006) Involvement of calpain activation in neurodegenerative processes. CNS Drug Rev 12: 135-148.
78. Carragher NO (2006) Calpain inhibition: a therapeutic strategy targeting multiple disease states. Curr Pharm Des 12: 615-638.
79. Williams A, Sarkar S, Cuddon P, Ttofi EK, Saiki S, et al. (2008) Novel targets for Huntington's disease in an mTOR-independent autophagy pathway. Nat Chem Biol 4: 295-305.
80. Bove J, Martinez-Vicente M, Vila M (2011) Fighting neurodegeneration with rapamycin: mechanistic insights. Nat Rev Neurosci 12: 437-452.
81. Cuervo AM, Stefanis L, Fredenburg R, Lansbury PT, Sulzer D (2004) Impaired degradation of mutant alpha-synuclein by chaperone-mediated autophagy. Science 305: 1292-1295.
82. Wang Y, Martinez-Vicente M, Kruger U, Kaushik S, Wong E, et al. (2009) Tau fragmentation, aggregation and clearance: the dual role of lysosomal processing. Hum Mol Genet 18: 4153-4170.
83. Park SA, Shaked GM, Bredesen DE, Koo EH (2009) Mechanism of cytotoxicity mediated by the C31 fragment of the amyloid precursor protein. Biochem Biophys Res Commun 388: 450-455.
84. Duncan C, Papanikolaou T, Ellerby LM (2010) Autophagy: polyQ toxic fragment turnover. Autophagy 6: 312-314.
85. Thompson LM, Aiken CT, Kaltenbach LS, Agrawal N, Illes K, et al. (2009) IKK phosphorylates Huntingtin and targets it for degradation by the proteasome and lysosome. J Cell Biol 187: 1083-1099.
86. Koga H, Martinez-Vicente M, Macian F, Verkhusha VV, Cuervo AM (2011) A photoconvertible fluorescent reporter to track chaperone-mediated autophagy. Nat Commun 2: 386.
64
Acknowledgments
To Professor Jorge Sequeiros for allowing me the opportunity of joining
his research group.
An enormous thank you to Isabel Alonso, my supervisor. I am glad you
said yes to an undergradute student back in 2008, for all the support and
mentoring you have given since then. Thank you for believing in my work, even
when I sometimes didn’t.
To Professor Carlos Duarte, for always being available and all the advice
he gave in the course of this thesis.
To Carolina Lemos, many thanks for the friendly shoulder and all the
statistical advice, it wouldn’t be the same without you.
To João Neto, it’s always nice to throw a good joke at the more stressful
moments, thank you for all the support and the lively work environment.
To Sara Morais, my lab partner, thank you for sharing a lot of the
frustrations this last year.
To Miguel Ferreira, the more laid back person I will ever meet, thank you
for all the support.
To the remaining members of UnIGENe thank you for your
companionship.
In addition, to all members of CGPP, Ana Filipa Brandão, Rita Ferreira,
Ana Margarida Lopes, Victor Mendes, Andreia Perdigão e Jorge Pinto-Basto.
Thank you Ana Filipa, Rita and Ana Margarida for always having room for one
more sequencing product, for all the support and companionship; thank you
Victor for all the lively lunches, and for trying to fix my computer even though
you say you don’t touch macs.
Aos meus Pais e Irmã, obrigada por todo o apoio e carinho que sempre
demonstraram. Acima de tudo, obrigada por sempre terem apoiado todas as
decisões, fossem elas quais fossem.