Graphic Communication Flowcharts Pictograms Presenting Data.

102 Indian Journal of Pharmacy Practice, Vol 8, Issue 3, Jul-Sep, 2015
Research Article
www.ijopp.org
Role of Pictograms in Educating Diabetic Patients about Medication use and Life Style Modifications
Veintramuthu Sankar*, Ramya Krishna, Vuyyuru Krishna Reddy, Narmadha Muthu Mahendiran, Sameer Hussain and Rama Parthasarathy
Department of Pharmacy Practice, PSG College of Pharmacy, Coimbatore-641004, India.
ABSTRACTIntroduction: Diabetes mellitus is a chronic disease that occurs when the pancreas is no longer able to make insulin, or when the body cannot make good use of the insulin it produces. It can be controlled using oral hypoglycaemic agents and/or insulin and lifestyle modifications. This study examines the role of pictograms in educating the diabetic patients about proper medication use and lifestyle modifications. It is an open label, observational comparative study. Objectives: To educate diabetic patients about proper medication use and lifestyle modifications using pictograms. To identify whether comprehension of pictogram differs based on gender, age group, level of education and compliance to medications in diabetic patients and to develop a leaflet containing pictograms which convey information about lifestyle modifications and medication use in diabetic patients. Method: A prospective-observational comparative study of 6 months duration was undertaken with 100 participants for Phase-1 (Survey; n=100) to select the best understood pictograms from the 24 pictograms selected. This set was carried out for Phase-2 (one-on-one interview; n=100), which had Guessability and Translucency as its components. Guessability study was carried out in 50 diabetic patients and their response to pictograms was recorded in a 3 point Likert scale. Modifications were made to the pictograms based on the difficulties faced by the patients in understanding the pictograms. These modified pictograms were used for Translucency study and result was obtained using 5 point Likert scale. We use student t-test and Chi-Square test using SPSS 19 to analyze the data. Results: The results of this study show that pictograms are generally well understood by the diabetic patients when the intended meaning of the pictograms are explained and are accompanied with text. The statistically significant p values were obtained only with levels of education in both Guessability (0.040) and Translucency (0.050). The overall Guessability (all pictograms included) was 69.6% and the overall Translucency was 90.9%. Conclusion: The result from this study suggests that pictograms play a vital role in educating patients and can be used as an effective counselling aid in a low-literacy group of people.
Key words: Diabetes, Lifestyle modification, Guessability, Medication Use, Pictograms, Translucency.
Submitted date : 14/06/2015Revised date : 03/08/2015Accepted date : 08/09/2015
DOI: 10.5530/ijopp.8.3.4
Address for correspondence:Dr. Veintramuthu SankarDepartment of Pharmacy Practice, PSG College of Pharmacy, Coimbatore-641004, India.E-mail : [email protected]
INTRODUCTIONDiabetes mellitus is a chronic disorder that occurs when pancreas is no longer able to make insulin, or when the body cannot make good use of the insulin it produces. Insulin is a hormone made by the pancreas that acts like a key to let glucose from the food we eat pass from the blood stream into the cells in the body to produce energy. All carbohydrate foods are broken down into glucose in the blood. Insulin helps glucose get into the cells.Inability to produce insulin or use it effec-tively leads to hyperglycaemia. Over the long-term high glucose levels are associated
with damage to the body and failure of vari-ous organs and tissues.1
According to recent estimates, approxi-mately 285 million people worldwide (6.6%) had diabetes in 2010 and by 2030, 438 mil-lion people (7.8%) of the adult population, is expected to have diabetes. Unlike in the west, where older populations are most affected, the burden of diabetes in Asian countries is disproportionately high in young to middle-aged adults.2-5
It is estimated that the total number of people with diabetes in 2010 to be around 50.8 million in India, rising to 87.0 million

Sankar, et al.: Pictograms in Diabetic Education
Indian Journal of Pharmacy Practice, Vol 8, Issue 3, Jul-Sep, 2015 103
by 2030. According to International Diabetes Federa-tion reports 2012, number of people living with diabe-tes worldwide was estimated to be 371 million and that of India is 50 million.There are three main types of Diabetes:Type 1 diabetes-juvenile-onset diabetes or insulin dependent diabetesType 2 diabetes-non-insulin dependent diabetesGestational diabetes-high blood glucose levels during pregnancyAccording to the new WHO technical report on the prevention of diabetes and its complications, it suggests that a substantial proportion of Type 2 diabetes can be prevented through the promotion of physical activity, healthy eating and the prevention of obesity. As for people with diabetes, their quality of life can be largely preserved, and their risk of long-term complications reduced, through the provision of effective healthcare and education.Diabetes can be effectively controlled by proper use of medication and incorporating healthy lifestyle changes. The progression of disease and complications can result from lack of knowledge about the disease due to low health literacy, improper medication use, and patient’s perception towards the disease condition, unhealthy lifestyle and lack of counseling.6-8 A key step to improve the level of health communica-tion understood by patients and their families is by pro-viding adequate patient counseling material and tools to patients and their families. However, there are a num-ber of barriers that need to be overcome in order to clearly convey counseling messages. Some patients do not understand how to take their medications because they are unable to read the instructions, or in the case of multiple medications, remember them all.9-12 Cur-rently, education information on major drugs and dis-eases available is mainly in text format. To make matters worse, this text is written at a level too high for even the general population to understand. The problems asso-ciated with patient comprehension of medical instruc-tions is difficult even in developed countries with higher levels of literacy,13 and are even more compounded when healthcare providers are faced with illiteracy or differences in language.14-16
These obstacles highlight the importance of accu-rate and effective communication between healthcare providers and patients to ensure comprehension of pharmacotherapy, thereby promoting compliance and ensuring positive patient health outcomes. The use of pictograms can help reduce the risks related to poor patient understanding of health care information and
improve comprehension among patients across all lit-eracy levels and cultures.17-19
The use of pictograms to communicate health informa-tion to people with language barriers or limited health literacy may improve patient understanding and increase the efficiency of treatment of such individuals.Pictograms are descriptive symbols that help to convey information regarding medication and health, and can be incorporated to emphasize key counselling points.20-22
Guessability: It is the ability to make a judgment or estimate of (something) without actual knowledge or enough facts for certainty.Translucency: Translucency refers to the relationship between the pictogram or image and its significance or referent; in other words, it is the degree to which the participant believes that the image represents what it is supposed to portray, after being told the meaning of the pictogram.The purpose of this study is to use pictograms as an effective counselling aid in educating diabetic patients about the proper use of medication and the lifestyle modifications.
METHOD
Study Design
This prospective–observational comparative study was undertaken with 200 volunteers in a teaching hospital of PSG Medical Sciences and Research Institute, Coim-batore. This is a multispecialty 900 bedded tertiary care hospital located in the south region of Tamil Nadu. Per-mission for conducting the study was obtained from the Institutional Human Ethics Committee (IHEC) prior to the commencement. 100 volunteers for Phase I (survey) and 100 diabetic patients for Phase II study from vari-ous wards of the hospital were recruited.
Inclusion criteria
Patients aged over 18 years, on insulin and/or oral hypoglycemic agents (OHA), in-patients diagnosed with diabetes.In survey, the volunteers recruited were asked to select the best understood pictogram. In Phase II, one-on-one interview was carried out with pictograms to evaluate the comprehensiveness of the pictograms. Guessability was carried out in 50 diabetic patients using pictograms without text or explanation selected from Phase I. Translucency was carried out using another 50 diabetic patients with modifications made to the pictograms used in guessability study along with text and explantion.

Sankar, et al.: Pictograms in Diabetic Education
104 Indian Journal of Pharmacy Practice, Vol 8, Issue 3, Jul-Sep, 2015
Measures
The data collection form included the demograph-ics details of the patients, medical history, past and current medications, social habits, diagnosis, level of education, exercise and compliance to medications. The guessability results were assessed with a 3 point visual analog LIKERT scale as incorrect, partially correct and correct, and scored as 0, 1 and 2 respec-tively. The translucency results were assessed with a 5-point visual analog LIKERT scale as strongly dis-agree, disagree, neither, agree and strongly agree, and scored as 0, 1, 2, 3 and 4 respectively.
Statistical analysis
The statistical analysis was done using student t-test and chi square test by SPSS software version 19.
RESULTSThe percentage acceptance for appeal and understanding for the pictograms were assessed in Phase I survey. (Figure 1, 2). The pictograms with greater that 80% comprehen-sion were selected for Phase II study and the other picto-grams with lower acceptance (below 80%) were rejected (Figure 3). The pictograms with greater that 80% compre-hension were selected for Phase II study (Figure 4).
Figure 1: Pictograms in Phase 1 (Survey) Medication use
Figure 2: Life style modifications

Sankar, et al.: Pictograms in Diabetic Education
Indian Journal of Pharmacy Practice, Vol 8, Issue 3, Jul-Sep, 2015 105
Figure 4: Pictograms selected for Phase 2 Guessability study
Figure 3: Rejected pictures in survey
DISCUSSIONA total of 24 pictograms were chosen and Phase I study was carried out. Out of 24 pictograms, 12 were selected for Phase II guessability study (Figure 4). The difficul-ties faced by the patients in guessing the meaning of the pictograms were lack of wordings, lack of clarity, mis-interpretation of pictogram and lack of colored picto-grams. The modifications to the pictograms were made. The pictogram depicting foot care was changed to a colored pictogram; foods to be avoided was included; avoid smoking was replaced with a pictogram showing a man who is smoking with a “no” symbol on it; all the
other pictograms were modified to a better understand-able pictogram.The pictogram developed by this study has effectively communicated information about medication use and lifestyle modifications in diabetic condition, particularly in illiterate group. Because this information is often not adequately discussed with diabetic patients as illiterate patients cannot read the prescriptions, labels, leaflets and thus, cannot remember instructions properly. It is possible that visual depiction by pictograms will stim-ulate greater awareness of proper medication use and lifestyle modifications.

Sankar, et al.: Pictograms in Diabetic Education
106 Indian Journal of Pharmacy Practice, Vol 8, Issue 3, Jul-Sep, 2015
Table 2: Demographic details of Phase II (Guessability):
Demographic data Category No of patients(n=50) Percentage (%)
Gender MaleFemale
2723
5446
Age group 18–35 yrs36–60 yrs
Above 60 yrs
13217
26434
Level of education
IlliterateBasic (up to 8th grade)
Medium (higher secondary)High (Degree/graduate)
22165
443210
Compliance to medications
YesNo
3713
7426
Table 1: Demographic details of Phase I:
Demographic data Category No of participants Percentage (%)
Gender MaleFemale
5347
5347
Age group 18–35 yrs36–60 yrs
Above 60 yrs
117217
117217
Level of education Basic (up to 8th grade)
Medium (higher secondary)High (Degree/graduate)
74053
74053
Primary language EnglishTamil
3268
3268
Table 3: Overall Guessability score percentage
Demographic data Category No of patients
(n=50) Average score Score Percentage (%) p-value
Gender MaleFemale
2723
14.811.2
6451 0.485
Age group 18–35 yrs 36–60 yrs
Above 60 yrs
13217
1212.6514.7
54.557.567
0.291
Level of education
Illiterate Basic (up to 8th grade) Medium (higher
secondary) High (Degree/
graduate)
722165
10.711.215
15.3
49516869
0.040*
Compliance to medications
YesNo
3713
14.712.2
66.7 55.6 0.594
*Correlation is significant at a level of 0.05 (2 tailed).
The proportion of men enrolled in the study was higher than women in the study population (Table 1). The number of illiterates enrolled in the phase II guessability study is more compared to higher secondary and gradu-ate education (Table 2).The results of this study showed that pictograms are generally well understood by the diabetic patients when the intended meaning of the pictograms were explained along with wordings.The overall guessability (all pictograms included) was 69.6% (Table 3). The percentage increase in score was due to the inclusion of text additionally to the picto-
gram. This supports the notion that pictograms are more easily interpreted by the patients when they are accompanied with text and oral explanations.In this study, none of the pictograms were 100% cor-rectly interpreted by patients in Phase I and Phase II initially. But we found that compared to guessability, correct interpretation of pictograms in translucency showed a marked improvement. This finding clearly indicates the need of pictograms along with text.Moreover, the pictograms of lifestyle modifications (59%) have guessability rates higher than that of medication use (25.6%) (Table 4). This shows that the

Sankar, et al.: Pictograms in Diabetic Education
Indian Journal of Pharmacy Practice, Vol 8, Issue 3, Jul-Sep, 2015 107
Table 4: Overall Guesssablity
Pictograms Correct(n) (%)
Partially correct(n) (%)
Incorrect(n) (%)
Lifestyle modificationsFoot care 25 (50%) 16 (32%) 9 (18%)
Food habits 27 (54%) 13 (26%) 0 (0%)
Exercise 39 (78%) 8 (16%) 3 (6%)
Avoid smoking 39 (78%) 3 (6%) 8 (16%)
Avoid alcohol 36 (72%) 7 (14%) 7 (14%)
SMBG(Self Monitoring of Blood Glucose) 11 (22%) 12 (24%) 27 (54%)
Medication useInsulin storage 17 (34%) 17 (34%) 16 (32%)
Rolling Insulin 12 (24%) 20 (40%) 18 (36%)
Insulin injection sites 16 (36%) 9 (18%) 25 (50%)
Angles of Injection 4 (8%) 21 (42%) 25 (50%)
Direction of intake of medicines 13 (26%) 18 (36%) 19 (38%)
people are aware of the lifestyle modifications and are hence well guessed. As shown by studies23 simple pictograms like reduction in weight (88.2%), vomiting (88.2%), headache (94.1%) were easy to understand compared to complex anatomical pictograms like conjunctivitis (35.2%).The percentage guessability for 3 pictograms namely, self monitoring blood glucose (22%), rolling of insu-lin (24%) and angle of injection (8%) was low (Table 4). This shows that the patients are unaware of this information. When the labeled pictograms (Figure 5) are shown the patients (Table 5), they could guess the
meaning of the pictograms better, for self monitoring blood glucose (44%), rolling of insulin (52%) and angle of injection (30%) (Table 6). This can be supported by the study24 where the average recall assessment score was greater in the text with symbol group (M=6.65) as compared to symbol only group (M=6.36).Furthermore, this validates the FIP–WHO statement on labeling, which recommends including written expla-nation with pictograms for their use in medical settings.One concern is that, there is a significant difference (p value is 0.040) in pictogram comprehension between participants with adequate literacy and those with inad-
Figure 5: Pictograms selected for Phase 2 Translucency study

Sankar, et al.: Pictograms in Diabetic Education
108 Indian Journal of Pharmacy Practice, Vol 8, Issue 3, Jul-Sep, 2015
equate literacy (Table 4). Even though we used a small sample, we demonstrated a significant difference. This indicates a strong relationship between literacy and pic-togram comprehension. Although people with adequate literacy understand pictograms better than people with inadequate health literacy, pictograms have been shown to enhance comprehension of information even in low literacy population.In Phase 2 study, both guessability and translucency, male have scored higher than female. But from sta-tistical analysis, there was no significant difference obtained when the scores are correlated to gender (p value is 0.311).In guessability study, patients above the age of 60 yrs were able to guess the picture better (67%) as compared
to the other age group (18–35 yrs–54.5%; 36–60 yrs–57.5%) (Table 4). This can be due to the fact that elderly patients are on long term drug therapy and have better understanding about their disease condition and drugs as compared to the other categories. Whereas in translucency, the younger population (18-35 yrs) could understand better (91%) as compared to 36-60 yrs (89.2%) and above 60 yrs (86.1%) (Table 7). This can be due to the difficulties faced by the elderly people like low level of education, other co-morbidities etc.In both guessability and translucency study, the highly educated patients scored more (69% and 92.8% respec-tively) and the illiterate patients scored the least (49% and 69.3% respectively) (Table 4, 7). There was sta-tistically significant difference when levels of educa-
Table 5: Demographic details of Phase II (Translucency)
Demographic data Category No of patients (n=50) Percentage (%)
Gender MaleFemale
3020
6040
Age group 18–35 yrs36–60 yrs
Above 60 yrs
32324
64648
Level of education
Illiterate Basic (up to 8th grade)
Medium (higher secondary) High (Degree/graduate)
419216
8 38 42 12
Compliance to medications
YesNo
3614
7228
Primary language EnglishTamil
644
1288
Table 6: Overall Translucency
Pictograms Strongly agree(n) (%)
Agree(n) (%)
Neither(n) (%)
Disagree(n) (%)
Strongly Disagree
(n) (%)Lifestyle modifications
Foot care 30 (60%) 16 (26%) 4 (8%) 0 (0%) 0 (0%)
Food habits 27 (54%) 21 (42%) 2 (4%) 0 (0%) 0 (0%)
Exercise 42 (84%) 7 (14%) 1 (2%) 0 (0%) 0 (0%)
Avoid smoking 42 (84%) 8 (16%) 0 (0%) 0 (0%) 0 (0%)
Avoid alcohol 44 (88%) 6 (12%) 0 (0%) 0 (0%) 0 (0%)
SMBG (Self Monitoring of
Blood Glucose) 22 (44%) 20 (40%) 7 (14%) 1(2%) 0 (0%)
Medication useInsulin storage 27 (54%) 19 (38%) 4 (8%) 0 (0%) 0 (0%)
Rolling Insulin 26 (52%) 19 (38%) 5 (10%) 0 (0%) 0 (0%)
Insulin injection sites 35 (70%) 11 (22%) 4 (8%) 0 (0%) 0 (0%)
Angles of Injection 15 (30%) 24 (48%) 11 (22%) 0 (0%) 0 (0%)
Direction of intake of medicines
21 (42%) 18 (36%) 11 (22%) 0 (0%) 0 (0%)

Sankar, et al.: Pictograms in Diabetic Education
Indian Journal of Pharmacy Practice, Vol 8, Issue 3, Jul-Sep, 2015 109
Table 7: Overall Translucency score percentage
Demographic data Category No of patients
(n=50) Average score Score Percentage (%) p-value
Gender MaleFemale
3020
39.2337.8
89.185.9 0.757
Age group 18–35 yrs36–60 yrs
Above 60 yrs
32324
4039.237.9
9189.286.1
0.770
Level of education
Illiterate Basic (up to 8th grade) Medium (higher
secondary) High (Degree/
graduate)
419216
30.539
39.240.8
69.388.689.292.8
0.050*
Compliance YesNo
3614
31.937.28
8985 0.370
Primary language
EnglishTamil
644
41.136.2
92.882.3 0.915
Sankar, et al.: Pictograms in Diabetic Education
110 Indian Journal of Pharmacy Practice, Vol 8, Issue 3, Jul-Sep, 2015
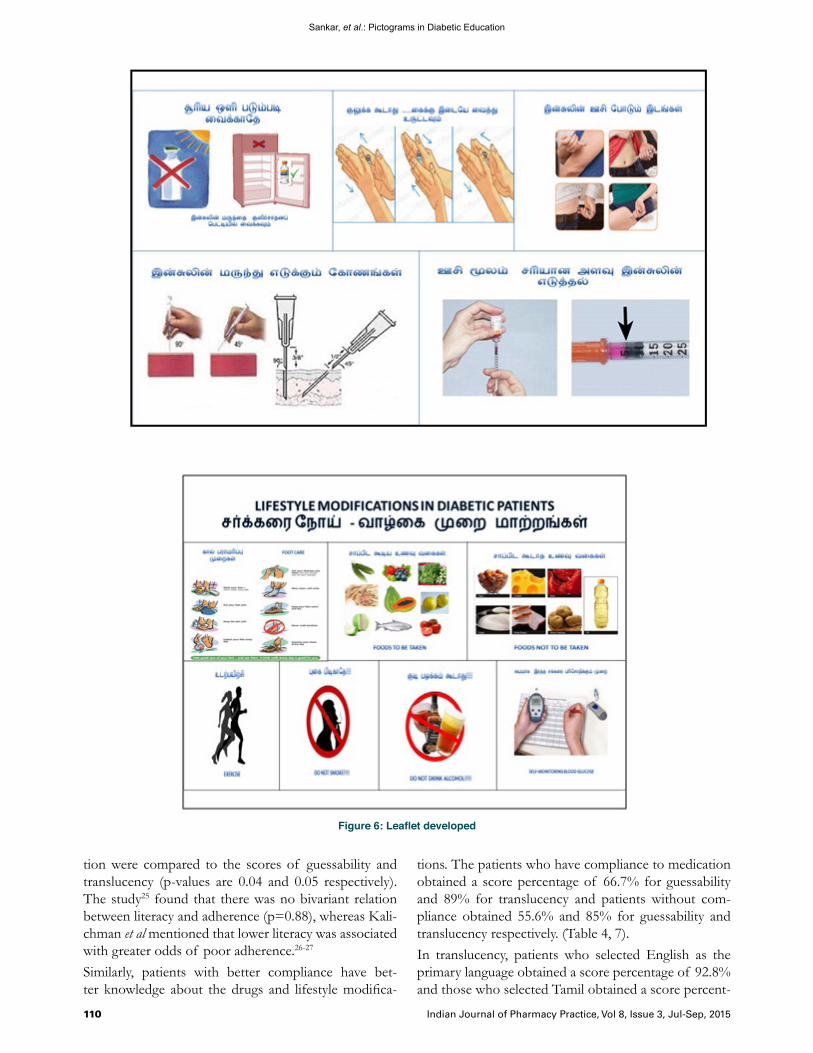
Figure 6: Leaflet developed
tion were compared to the scores of guessability and translucency (p-values are 0.04 and 0.05 respectively). The study25 found that there was no bivariant relation between literacy and adherence (p=0.88), whereas Kali-chman et al mentioned that lower literacy was associated with greater odds of poor adherence.26-27
Similarly, patients with better compliance have bet-ter knowledge about the drugs and lifestyle modifica-
tions. The patients who have compliance to medication obtained a score percentage of 66.7% for guessability and 89% for translucency and patients without com-pliance obtained 55.6% and 85% for guessability and translucency respectively. (Table 4, 7).In translucency, patients who selected English as the primary language obtained a score percentage of 92.8% and those who selected Tamil obtained a score percent-

Sankar, et al.: Pictograms in Diabetic Education
Indian Journal of Pharmacy Practice, Vol 8, Issue 3, Jul-Sep, 2015 111
age of 82.3%. But no statistical significant difference was observed. The overall translucency was 90.9%.
CONCLUSIONThis study concludes that pictograms play a vital role in educating patients and can be used as an effective counseling aid in a low-literacy group of people. More-over, comprehension and recall of information can be improved by using pictograms in addition to written format of information.In a total of 24 pictograms, 12 pictograms were selected for the Phase 2 study. Using these 12 pictograms we have educated the diabetic patients under study about the life-style modifications and medication use effectively.Furthermore, we have developed a (Figure 6) that con-tains the pictograms from translucency, which can be
used as a counseling aid in the Drug Information Cen-tre (DIC) of PSG College of Pharmacy located at PSG Hospital.
ACKNOWLEDGEMENTSThe authors sincerely thank Dr. M. Ramanathan, Principal, PSG College of Pharmacy for his guidance and support. We extend our thanks to Endocrinology department, PSG Hospitals for their kind help during the study. We also thank Dr Regis Vaillancourt, Direc-tor, Children’s Hospital of Eastern Ontario, Ottawa, Canada for providing literatures and guidance dur-ing the study period. Our thanks to all the patients and staff of PSG Institute of Medical Sciences and Research for all their help and cooperation during the study period.
REFERENCES1. Introduction, International Diabetes Federation available at http://www.idf.org/
about-diabetes2. Ajay VS. Prevalence and determinants of diabetes mellitus in the Indian
industrial population. Diabetic medicine 2008 Oct; 25(10): 1187-94.3. Huizinga MM. Addressing the diabetes pandemic: A comprehensive approach.
Indian J Med Res. 2006; 124(5): 481-4.4. Ramachandran A. High prevalence of diabetes in an urban population in south
India. BMJ. 1988; 297(6648): 587-90.5. Ramachandran A. Current Status of Diabetes in India and Need for Novel
Therapeutic Agents. Supplement to Jape 2010 June; 58: 7-9.6. Christopher Sorfleet. Design, Development and evaluation of pictographic
instructions for medications used during humanitarian missions. Cpj/rpc. 2009 March/April; 142(2): 83-8.
7. Andersson CM. A stage model for assessing a community-based diabetes prevention program in Sweden. Health promotion international 2003 Dec; 17(4): 317-27.
8. Centers for Disease Control and Prevention. National Diabetes Fact Sheet, 2011. Atlanta, GA: Centers for Disease Control and Prevention, US Department of Health and Human Services; 2011. http://www.cdc.gov/diabetes/pubs/pdf/ndfs_2011. Pdf. Accessed April 16, 2012.
9. The Diabetes Control and Complications Trial Research Group. The effect of intensive treatment of diabetes on the development and progression of long-term complications in insulin-dependent diabetes mellitus. New England Journal of Medicine 1993; 329(14): 977-86.
10. Centers for Disease Control and Prevention. Natural Experiments for Translation in Diabetes (NEXT-D) Study. Diabetes Public Health Resource Web site. http://www.cdc. gov/diabetes/projects/next-d.htm. Access April 16, 2012.
11. Davis TC. Literacy and misunderstanding prescription drug labels. Ann Intern Med. 2006; 145(12): 887-94.
12. Kripalani S. Development of an illustrated medication schedule as a low-literacy patient education tool. Patient Education and Counselling 2007; 66(3): 368-77.

Sankar, et al.: Pictograms in Diabetic Education
112 Indian Journal of Pharmacy Practice, Vol 8, Issue 3, Jul-Sep, 2015
13. Cho YI, Lee. Effects of health literacy on health status and health service utilization amongst the elderly. Soc Sci Med. 2008; 66(Issue Missing?): 1809-16.
14. DiMatteo MR. Variations in Patients adherence to medical recommendations: a quantitative review of 50 years of research. Med Care 2004; 42(3): 200-9.
15. Hoc AD. Committee on Health Literacy for the American Council on Scientific Affairs, American Medical Association. Health literacy: Report of the council on scientific affairs. JAMA. 1999; 281(6): 552-7.
16. International Standards Organization, Procedures for the development and testing of public Information symbols ISO9186: Geneva, Switzerland; 1989.
17. Dowse R. Medicine labels incorporating pictograms: Do they influence understanding and adherence? Patient Education and Counselling 2005; 58(1): 63-70.
18. Kassam R, Vaillanourt R, Collins JB. Pictographic instructions for medications: Do different cultures interpret them accurately? International Journal of Pharmacy Practice 2004; 12(4): 199-209.
19. Katri Ha¨meen-Anttila. Do pictograms improve children’s understanding of medicine leaflet information? Patient Education and Counseling 2004; 55(3): 371-8. www.elsevier.com/locate/pateducou
20. Sachdev Yadav. Pharmaceutical Pictogram in Rationale Use of Drug and Development of Pharmaceutical Care Services: A Mini Review. International Journal of Research in Pharmaceutical and Biomedical Sciences 2012; 3(1): 215-21.
21. Sorfleet C, Vaillancourt R. Design, development and evaluation of pictographic instructions for medications used during humanitarian missions. Canada Pharmaceutical Journal 2009; 142(2): 83-8.
22. Bachrach R. Using pictographs to enhance recall of spoken medical instructions. Patient Education and Counselling 1998; 35(2): 83-8.
23. Rajesh Radhakrishnan. Design and evaluation of pictograms for communicating information about adverse drug reactions to antiretroviral therapy in Indian human immuno deficiency virus positive patients. Journal of Pharmaceutical and Biomedical Sciences 2012; 16(16): 10.
24. Sean R, King. The Influence of Symbols on the Short-Term Recall of Pharmacy-Generated Prescription Medication Information in a Low Health Literate Sample. Journal of Health Communication 2012; 17(S3): 280-93.
25. Golin CE, Liu H, Hays RD. A prospective study of predictors of adherence to combination antiretroviral medication. Journal of General Internal Medicine 2002; 17(10): 756-65.
26. Kalichman SC, Ramachandran B, Catz S. Adherence to combination antiretroviral therapies in HIV patients of low health literacy. Journal of General Internal Medicine 1999; 14(5): 267-73.
27. Houts PS. Using pictographs to enhance recall of spoken medical instructions. Patient Education and Counselling 1998; 35(2): 83-8.