ROLE OF INVENTORY MANAGEMENT PRACTICES …ijecm.co.uk/wp-content/uploads/2015/05/35107.pdf · out...
32
International Journal of Economics, Commerce and Management United Kingdom Vol. III, Issue 5, May 2015 Licensed under Creative Common Page 1625 http://ijecm.co.uk/ ISSN 2348 0386 ‘ROLE OF INVENTORY MANAGEMENT PRACTICES ON PERFORMANCE OF PRODUCTION DEPARTMENT’ A CASE OF MANUFACTURING FIRMS Raymond Musyoka Munyao College of Human Resource Development, School of Entrepreneurship, Procurement and Management Jomo Kenyatta University of Agriculture and Technology, Kenya [email protected] Vincent Ochieng Omulo College of Human Resource Development, School of Entrepreneurship, Procurement and Management Jomo Kenyatta University of Agriculture and Technology, Kenya [email protected] Mercy Wambui Mwithiga School of Business, Economics and Social Sciences, Taita Taveta University College, Voi, Kenya Bellah Chepkulei School of Business, Economics and Social Sciences, Taita Taveta University College, Voi, Kenya
Transcript of ROLE OF INVENTORY MANAGEMENT PRACTICES …ijecm.co.uk/wp-content/uploads/2015/05/35107.pdf · out...

International Journal of Economics, Commerce and Management United Kingdom Vol. III, Issue 5, May 2015
Licensed under Creative Common Page 1625
http://ijecm.co.uk/ ISSN 2348 0386
‘ ROLE OF INVENTORY MANAGEMENT PRACTICES ON
PERFORMANCE OF PRODUCTION DEPARTMENT’
A CASE OF MANUFACTURING FIRMS
Raymond Musyoka Munyao
College of Human Resource Development,
School of Entrepreneurship, Procurement and Management
Jomo Kenyatta University of Agriculture and Technology, Kenya
Vincent Ochieng Omulo
College of Human Resource Development,
School of Entrepreneurship, Procurement and Management
Jomo Kenyatta University of Agriculture and Technology, Kenya
Mercy Wambui Mwithiga
School of Business, Economics and Social Sciences,
Taita Taveta University College, Voi, Kenya
Bellah Chepkulei
School of Business, Economics and Social Sciences,
Taita Taveta University College, Voi, Kenya

© Raymond, Vincent, Mercy & Bellah
Licensed under Creative Common Page 1626
Abstract
This study aimed at examining the role of inventory management practices in the performance
of the production department. The study sought to find the inventory management techniques
used by manufacturing firms in Mombasa County, established the level of effectiveness of
inventory management practices of manufacturing firms in Mombasa County. It also determined
the level of performance of production departments of manufacturing firms in Mombasa County
and finally determined whether computerized inventory management influences the
performance of the production department. The study adopted the descriptive research design.
The target population was textile, rolling mills and food and beverage manufacturing firms in
Mombasa County. A survey was conducted which adopted stratified random sampling
technique. Out of 150 manufacturing firms, a sample size of 45 manufacturing firms was used.
A questionnaire was used as data collection instrument. One questionnaire was issued to one
respondent at random from each of the forty five manufacturing firms included in the sample.
Reliability of research instruments was tested using Split Half Reliability Test. The study found
out that manufacturing firms used various inventory management techniques such as the action
level methods, just-in-time, periodic review technique, material requirement planning 1 and
economic order quantity. The study found that despite the fact that that MRP 1 was most
effective in contributing to performance of the production department most organizations in the
manufacturing industry used action level methods.
Keywords: Inventory, Inventory Management Practices, Performance of production department,
Manufacturing firms
INTRODUCTION
Inventories are the stocks of raw materials, work in progress, finished goods and supplies held
by a business organization to facilitate operations in the production process (Pandey, 2005).
Inventories can either be assets as well as items held in the ordinary course of business or they
can be goods that will be consumed or used in the production of goods to be sold (Green and
James, 2000). Inventory is considered to have originated from the military‟s need to supply
themselves with arms, ammunition, and rations as they moved from their base to a forward
position (Cachon, and Fisher, 2000). Inventory as a business concept evolved only in the 1950‟s
mainly due to the increasing complexity of supplying one‟s business with materials and slipping
out products in an increasing globalized supply chain and inventory management (Cecil and
Robert, 2006).

International Journal of Economics, Commerce and Management, United Kingdom
Licensed under Creative Common Page 1627
According to Silver, David and Rein, (1998), inventory management is a system concerned with
integration of information, transportation, acquisition, inspection, material handling,
warehousing, packaging and control of supplies and ensuring security of inventory. Inventory
management aims at discovering and maintaining optimal levels of investment in all types of
inventories and maximizing the flow of goods, information and other related resources like
people and energy from the point of origin to the point of final consumption (Peter, 2000).
Historically, inventory management has often been associated with either too much
inventory and too little management or too little inventory and too much management. There
can be severe penalties for excesses in either direction. Inventory problems have proliferated as
technological progress has increased the organization‟s ability to produce goods in greater
quantities faster and with multiple design variations. The public has compounded the problem
by its receptiveness to variations and frequent design changes (Tersine, 2009).
Since the mid1980s, the strategic benefits of inventory management and production
planning and scheduling have become obvious. The business press has highlighted the
success of Japanese, European and North American firms in achieving unparalleled
effectiveness and efficiency in manufacturing and distribution. In recent years, many of the firms
have „raised the bar‟, yet again by coordinating with other firms in their supply chains. For
instance, instead of responding to unknown and variable demand, they share information so
that the variability of the demand they observe is significantly lower (Silver, Pyke and Peterson,
1998).
Silver, Pyke and Peterson (1998) continue arguing that in the United States of America
and other Western Countries, productivity improvement was pursued by reducing the amount of
direct manufacturing labor expended per unit of output. This was a valid strategy because of
high labor content in many manufactured products. In spite of this, the proportion of unit costs
resulting from labor has been steadily decreased in recent years. In fact the ratio of purchased
materials to sales (in dollars) reached 60 percent for US firms in 1985. This implies that
management of raw materials inventories is an area that shows great promise for productivity
improvement. Japanese firms received much-deserved attention in the mid-to-late 1980s
because of their remarkable performance on quality and inventory management. The
tremendous interest in Just-in-Time manufacturing indicates that work-in-progress inventory
management is also an area ripe for improvement.
In traditional settings, inventories of raw material spare parts work in progress,
components and finished goods were kept as a buffer of a possibility of running out of needed
items. However, large buffer inventories consumed valuable resources and generated inventory
costs. Consequently, many companies have changed their approach to production and
© Raymond, Vincent, Mercy & Bellah
Licensed under Creative Common Page 1628
inventory management. Since early 1980s, inventory management which leads to inventory
reduction has become the primary target, as is often the case in just-in-time (JIT) systems
where raw materials and parts are purchased or produced just-in-time to be used at each stage
of the production process. As a result, inventories have been decreasing in many firms (Chen et
al, 2005) although evidence of improved firm performance is mixed (Fullerton et al., 2003;
Cannon, 2008; Kolias et al, 2011).
Nevertheless, most of the studies focus on the American firms in the manufacturing
sector because of the many revolutions in inventory policies in 1970s and 1980s. Chet et al
(2005) observed that the extent of emphasis on inventories among American firms reached the
financial markets where there were rules that would reward firm that controlled inventories and
punish those that did not do so. This is because, during the 1970s, Japanese manufacturing
companies made substantial market share gains in the US markets in a range of industries
including most notably the automobile industry.
In recent years, a number of firms have faced numerous challenges especially in
inventory management or material control, thus affecting the performance of manufacturing
companies. There have been cases of materials overstocking which eventually get expired or
out dated, under stocking, lack of stock-taking, theft of materials by workers and delays in
deliveries of materials into the organizations among others.
It is therefore important for manufacturing firms in Mombasa County to have sound,
effective and well-coordinated inventory management systems because the business
environment is rapidly changing, highly competitive and this drastically affects the performance
of the organization. With the application of proper inventory management techniques, the right
materials will be available at the right time, with the minimum storage costs and investment.
According to Waters (2008), organizations have dramatically changed their views of
stock in the recent years. Historically, they saw stock as a benefit, with high stocks ensuring
maximum service and even giving a measure of wealth. This thinking encouraged organizations
to maximize their stocks and is still the reason why countries keep reserves of gold and why
individuals keep food in the freezer. But with the advent of the twentieth century, it became clear
that these stocks had costs that could be surprisingly high. Then organizations began to view
stocks not as unreserved benefits but as a resource that needs careful control and thus the
need to device ways of minimizing overall costs. More recently, organizations have gone further
in reducing stocks, and they try to work with very low levels. There has been a trend towards
operations that move materials quickly and efficiently through supply chains matching supply to
demand so that stocks are not accumulated. When this works, it gives considerable savings, but

International Journal of Economics, Commerce and Management, United Kingdom
Licensed under Creative Common Page 1629
it is not a realistic option for all operations. Most organizations cannot work properly without
stock and therefore they have to consider its management.
In Kenya, while some manufacturing firms have adopted the modern inventory
management techniques, most of the firms are still lagging behind relying on the traditional
methods despite the many benefits that are generated from the use of modern inventory
management techniques.
Objectives of the study
Main Objective
The broad objective of this research was to establish the role of inventory management on the
performance of the production department.
Specific objectives
(a) To find out inventory management techniques applied by manufacturing
organizations in Mombasa County.
(b) To establish the level of effectiveness of inventory management practices of
manufacturing firms in Mombasa County.
(c) To determine the level of performance of production departments of manufacturing
firms in Mombasa County.
(d) To determine whether computerized inventory management influences the
performance of the production department.
Research Questions
(a) Which inventory management techniques are applied in manufacturing organizations
in Mombasa County?
(b) What is the level of effectiveness of inventory management practices of
manufacturing firms in Mombasa County?
(c) What is the level of performance of production departments of manufacturing firms in
Mombasa County?
(d) Does computerized inventory management influence the performance of the
production department?

© Raymond, Vincent, Mercy & Bellah
Licensed under Creative Common Page 1630
INVENTORY MANAGEMENT TECHNIQUES
Several techniques have been advanced to tackle constraints associated with inventory. These
techniques must be in line with the firm‟s objectives. These techniques include:
Economic Order Quantity (EOQ) Model
The economic order quantity also known as the Wilson EQQ model is a model that defines the
optimal quantity to order that minimizes total variable costs required to order and hold inventory
(Lee, 2002). EOQ refers to the optimal ordering quantity for an item of stock that aids in the
minimization of costs. This inventory management technique assumes that the demand for the
item is known with certainty, the lead time is known and fixed, the receipt of the order occurs in
single instant, quantity discounts are not calculated as part of the model and shortages of
inventory or stock out do not occur. Economic order quantity graphs illustrate the relationship
amongst the ordering costs holding total costs and economic order quantity (Nair, 1995)
Figure 1: Graphical Representation of EOQ
Bennet (1999) says in order to arrive at the economic order quantity, the formula below is used.
Q* = 2CR
H
Where,
Q* indicates the optimal order size
C is cost per order event (net per unit)
R is the monthly demand for the product.
H is the holding cost per unit.

International Journal of Economics, Commerce and Management, United Kingdom
Licensed under Creative Common Page 1631
Just in time (J.I.T)
This is an inventory management method whose goal is to maintain just enough material in just
the right place at just the right time to make first the right amount of the product (Carlson, 2002).
This was pioneered by the Japanese manufacturing firms where inventory is acquired only
when required in business for production process and this aimed at improving the return on
investment of the business by reducing in-process inventory and its associated costs
(Schonsleben, 2000).
In this system, the supplier has the responsibility of delivering the components and part
to the production line “Just in Time” to be assembled. Other names for just in time system is
Zero stock inventory and production (Lazaridis & Dimitrios (2005).
For the just in time method to work successfully the quality of the parts must be very
high because defective materials could up halt the operations of the assembly line, there must
be dependable relationships and smooth co-operation with suppliers, ideally this implies that the
supplier should be located near to the company with dependable transportation available
(Konke, 2003).
Just in time inventory management system helps in reducing inventory costs by avoiding
carriages of excess inventories and mishandling of raw materials. According to Kortz(2003),
Just in time purchasing recognizes high costs associated with holding high inventory level and
as such it has become important in most organizations to order inventory just in time of
production so as to cut costs of holding inventory like storage lighting, heating, security,
insurance and staffing (Dimitrios, P. (2008).
Material Requirement Planning 1
This is a technique of working backwards from the scheduled quantities and need dates for
finished products specified in a master production schedule to determine the requirements for
components needed to meet the master production budget schedule (Cooper, 2003). This
inventory management technique determines what components are needed, how many are
needed, when they are needed and when they should be ordered so that they are likely to be
available when needed (Louis, 1981).
The Action Level Methods of Inventory Management
The basic method of managing stock by quantity is by means of fixing for each commodity stock
levels which are recorded in the stock control system and subsequently used as a means of
indicating when some action is necessary. We have a minimum, ordering, hastening and
maximum stock levels (Harrisson, 2001).
© Raymond, Vincent, Mercy & Bellah
Licensed under Creative Common Page 1632
The minimum stock level is the amount expressed in units below which the stock of any given
commodity should not be allowed to fall. Re-order Level is the amount expressed in units of
issue at which ordering action is indicated in time for the materials to be delivered before stock
falls to a minimum. The hastening stock level is the amount expressed in units of issue at which
it is estimated that the hastening action is necessary to request suppliers to make early delivery.
The Maximum stock level is the amount expressed in units of issue above which the stock
should not be allowed to rise. It helps avoid excess investments in stock, which is very critical
(Harrisson, 2001).
EMPIRICAL REVIEW
In a study done by Kolias (2011), in order to test inventory-performance link using construction
firms listed in Bursa Malaysia, it was found that there is a positive correlation between inventory
turnover and capital intensity as a result of the nature of investments.
A study by Fullerton et al (2003) provides empirical support that manufacturing firms that
implement higher degrees of modern inventory management techniques should outperform
competitors; it was found that a positive relationship exists between firm‟s profitability and the
degree to which waste reducing production practices such as reduced set up times, preventive,
maintenance programs, and uniform workloads are implemented. These findings indicate that
manufacturing enterprises employing modern inventory management techniques are
consistently more profitable than their counterparts.
Another study suggesting a positive relationship between inventory management and
performance was Eroglu and Hofer (2011), which used the Empirical Leanness Indicator (ELI)
as a measurement for inventory management. They argued that inventory leanness is the best
inventory management tool. Lean production considers inventory as a form of waste that should
be minimized and has become synonymous with good inventory management Their study on
USA manufacturing firms covering the period 2003-2008 found that leanness affects profit
margins.
According to Eroglu and Hofer (2011), firms that are leaner than the industry average
generally see positive returns to leanness. They found that the effect of inventory leanness on
firm performance is positive and generally non-linear. Their study also implies that the effect of
inventory leanness is concave which is in line with inventory management theory that there is an
optimal degree of inventory leanness beyond which the marginal effect of leanness on financial
performance becomes negative.
A survey of 351 management accountants by the National Association of Accountants
(NAA) in a cross-section of industries to assess current inventory management practices in the

International Journal of Economics, Commerce and Management, United Kingdom
Licensed under Creative Common Page 1633
U.S indicated that: just-in-time inventory management techniques are increasing in popularity,
as are automated time-phased inventory re-order system. The survey further established that 85
percent of respondents have no plans to change their inventory controls and that actual
business experience is relied upon more than inventory quantitative models. Also, the survey
established that some inventory management practices such as assessing inventory levels and
balancing stock-out costs against expenses related to higher inventory levels are seldom used
in practice (Romano, 2011).
Lazaridis & Dimitrios (2005) highlighted the importance of firms keeping their inventory
at an optimum level by analyzing the relationship between working capital management and
corporate profitability and stressed that its mismanagement will lead to excessive tying up of
capital at the expense of profitable operations. A similar study by Rehman (2006) empirically
established a strong negative relationship between the inventory turnover in days and the
profitability of firms.
Sushma & Phubesh (2007) in their study of 23 Indian Consumer Electronics Industry
firms established that businesses‟ inventory management policies had a role to play in their
profitability performance.
Lazaridis & Dimitrios (2005) in their study of 131 companies listed on the Athens Stock
Exchange showed that mismanagement of inventory will lead to tying up excess capital at the
expense of profitable operations and suggested that managers can create value for their firms
by keeping inventory to an optimum level.
Also, Rajeev (2008) in his study of 91 Indian Machine Tool Enterprises to evaluate the
relationship between inventory management practices and inventory cost established that
effective inventory management practices have a positive impact on the inventory performance
of businesses and also have an eventual effect on the performance of the overall businesses
processes.
Juan & Mertinez (2002) in their study of 8872 small and medium-sized Spanish firms
also demonstrated that managers of firms can create value by reducing the number of days of
inventory. Effective inventory management processes helps increase operational efficiency of
firms; improves customer service; reduces inventory and distribution costs; and enables
businesses track items and their expiration dates consequently balance between availability and
demand (Pandey, 2004).

© Raymond, Vincent, Mercy & Bellah
Licensed under Creative Common Page 1634
Figure 2. Conceptual framework for the study
Independent variables
Dependent variable
The model hypothesizes that
INVENTORY
MANAGEMENT
TECHNIQUES
Economic Order
Quantity
Just-in-Time
Material Requirement
Planning 1
Action Level Methods
Periodic review
technique
Continuous/ perpetual
review technique
EFFECTIVENESS IN
INVENTORY
MAMANAGEMENT
Effective inventory
budgeting
Effective management
of stock levels
Effective Stock-taking
activities
COMPUTERIZED
INVENTORY
MANAGEMENT
Computerized
warehousing
Computerized
inventory records
Radio frequency
identification device
Inventory management
software
Automated
replenishment
Barcoding
PERFORMANCE OF
PRODUCTION DEPARTMENT
Quality
Output per Unit of Time
Optimal production
Production targets
On time delivery

International Journal of Economics, Commerce and Management, United Kingdom
Licensed under Creative Common Page 1635
RESEARCH METHODOLOGY
The study used descriptive research design. Descriptive research design was used because the
study was not only confined to the collection and description of the data but sought to examine
and establish the existence of certain relationships among the variables under study. Survey
method was used in which participants answered questions administered to them through
questionnaires. Survey method was used because it permits the collection of data through
questionnaires administered to a sample and the data collected can be used to suggest
relationships between variables and produce models for these relationships. The method is also
preferred because it facilitates the collection of a considerable amount of data quickly, efficiently
and accurately.
Target Population and Sampling Frame
The target population in the study was rolling mills, food and beverages and textile
manufacturing companies within Mombasa County. One questionnaire was given to each
organization included in the sample to be filled by one respondent drawn either from production,
stores or procurement department.
In this study, the sampling frame consisted of a list of all one hundred and fifty textile,
rolling mills, and food and beverage manufacturing firms in Mombasa County.
Table 1. Target Population
Manufacturing firm Population Percentage
Rolling Mills 10 6.67
Textile 60 40.00
Food and beverages 80 53. 33
Total 150 100
Sampling Technique and Sample Size
The study used stratified random sampling. The target population was divided into strata. The
strata are necessary because the target population is heterogeneous in nature. The strata
consisted of rolling mills, food and beverage firms and textile manufacturing firms. Respondents
were randomly selected from the three strata and each respondent selected was issued with a
questionnaire. Stratified random technique was chosen because it gives each member of the
population an equal chance of being selected and it thus reduces biasness in the selection of
cases to be included in the sample. Since the units selected for inclusion within the sample are
chosen using probabilistic methods, stratified random sampling allows us to make statistical
conclusions from the data collected that will be considered to be valid.
© Raymond, Vincent, Mercy & Bellah
Licensed under Creative Common Page 1636
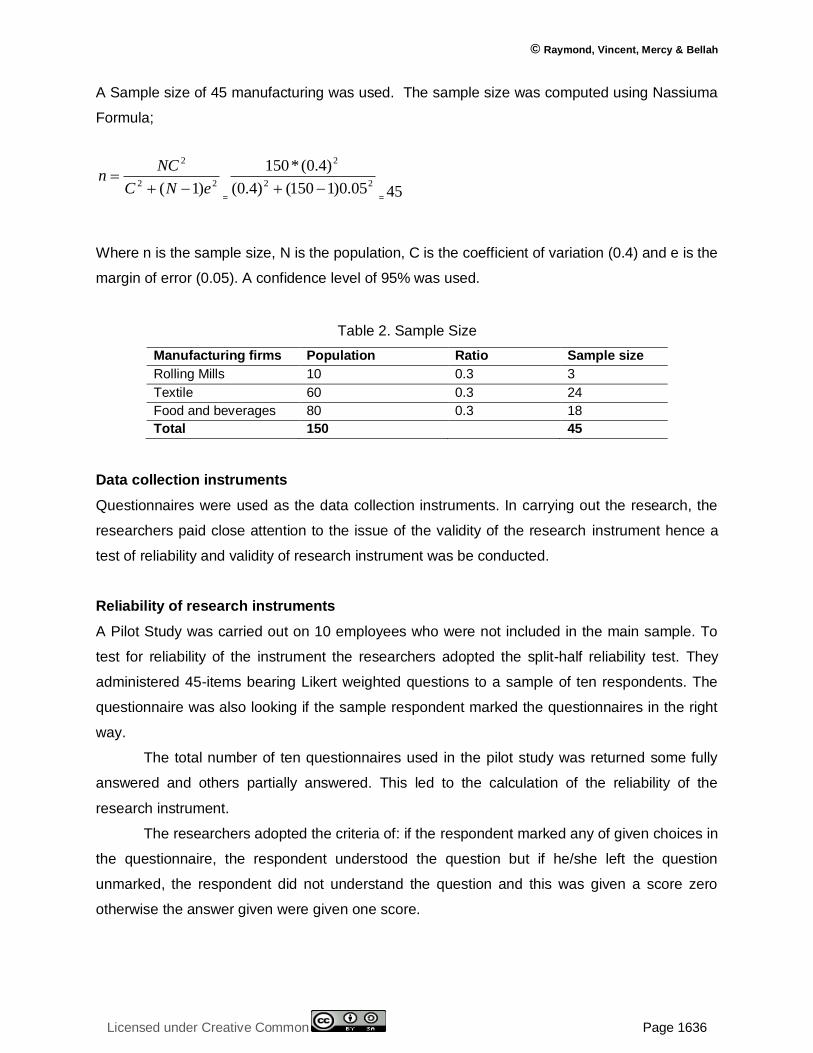
A Sample size of 45 manufacturing was used. The sample size was computed using Nassiuma
Formula;
22
2
)1( eNC
NCn
=
22
2
05.0)1150()4.0(
)4.0(*150
= 45
Where n is the sample size, N is the population, C is the coefficient of variation (0.4) and e is the
margin of error (0.05). A confidence level of 95% was used.
Table 2. Sample Size
Manufacturing firms Population Ratio Sample size
Rolling Mills 10 0.3 3
Textile 60 0.3 24
Food and beverages 80 0.3 18
Total 150 45
Data collection instruments
Questionnaires were used as the data collection instruments. In carrying out the research, the
researchers paid close attention to the issue of the validity of the research instrument hence a
test of reliability and validity of research instrument was be conducted.
Reliability of research instruments
A Pilot Study was carried out on 10 employees who were not included in the main sample. To
test for reliability of the instrument the researchers adopted the split-half reliability test. They
administered 45-items bearing Likert weighted questions to a sample of ten respondents. The
questionnaire was also looking if the sample respondent marked the questionnaires in the right
way.
The total number of ten questionnaires used in the pilot study was returned some fully
answered and others partially answered. This led to the calculation of the reliability of the
research instrument.
The researchers adopted the criteria of: if the respondent marked any of given choices in
the questionnaire, the respondent understood the question but if he/she left the question
unmarked, the respondent did not understand the question and this was given a score zero
otherwise the answer given were given one score.

International Journal of Economics, Commerce and Management, United Kingdom
Licensed under Creative Common Page 1637
To calculate the KR-20, the researcher entered data from the questionnaire in an Excel
Spreadsheet then used the formulae below:
K = the number of items in the questionnaire.
P= proportion of the sample who answered each item correctly. That is the number of question
answered correctly or those that scored one divided by the number of the respondent who
answered the question.
Q= the proportion of the sample who did not answer the item correctly.
In simple P+Q =1
The first value in the formula is K which is the total number of items (question) which was 45.
The next value is . This is the sum of proportion of those who answered item correctly and
those who did not answer the question correct. This value was calculated to be 1.4471 from the
spread sheet.
The other value was variance which was calculated to be 5.92
Equating these variables in the above formulae the solution was:-
=0.78997
≈78.6%
This was an indication that the questionnaires were reliable for the study of the role of inventory
management practices on performance of production department. According to Kathuri & Pals
(1993), items with validity and reliability coefficients of at least 0.7 are accepted.
Response rate
Thirty eight out of the forty five questionnaires issued were returned fully filled with the
remainder being treated as non-response bias. The response rate reflected the view of
Mugenda & Mugenda (2003) who indicated that a response rate of 70% and over is very good
as it gives a representative sample for meaningful generalization and minimizes errors.
Table 3. Response rate
Questionnaire Frequency Percent,%
Returned 38 84.4
Not returned 7 15.6
Total 45 100

© Raymond, Vincent, Mercy & Bellah
Licensed under Creative Common Page 1638
ANALYSIS
Inventory Management Techniques
Respondents were asked to indicate the inventory management technique used in their
organization.
Table 4. Inventory management techniques
Inventory Management Technique Frequency Percent
Economic Order Quantity 6 15.8
Action Level Methods 14 36.8
Just-in-Time 5 13.2
Periodic Review Technique 7 18.4
Material Requirement Planning 1 6 15.8
Total 38 100.0
15.8% said that their organization used economic order quantity, 36.8 % indicated that they
used action level methods, 13.2% used Just-in-time, 18.4% used periodic review technique and
15.8 % used material requirement planning 1. It is evident that action level methods were the
most used.
Inventory management techniques and their contribution
to the performance of production department
Respondents were asked to rate inventory management techniques based on their contribution
to the performance of the production department.
Table 5. contribution of inventory management techniques to
the performance of production department
Inventory
Management
Technique
Poor Fair Good Very Good Excellent Total
Economic Order
Quantity
6 (15.8%) 11 (28.9%) 10(26.3%) 5(13.2%) 6(15.8%) 38(100%)
Action Level Methods 11(28.9%) 9(23.7%) 11(28.9%) 3(7.9%) 4(10.5%) 38(100%)
Just-in-Time 5(13.2%) 6(15.8%) 6(15.8%) 12 (31.6%) 9(23.7%) 38(100%)
Periodic Review
Technique
16(42.1%) 10(26.3%) 7(18.4%) 2 (5.3%) 3 (7.9%) 38(100%)
Material Requirement
Planning 1
2(5.3%) 6(15.8%) 5(13.2%) 8(21.1%) 17(44.7%) 38(100%)
15.8% rated economic order quantity as poor, 28.9% rated it as fair, 6.3 % rated it as good, and
13.2% rated it as very good while 15.8% rated it as excellence. It is evident that most
respondents rated economic order quantity as fair.

International Journal of Economics, Commerce and Management, United Kingdom
Licensed under Creative Common Page 1639
28.9% rated action level methods as poor, 23.7% rated it as fair, 28.9% rated it as good, and
7.9% rated it as very good, while 10.5% rated it as excellent. It is evident that most respondents
rated action level methods as good.
13.2% rated Just in time as poor, 15.8% rated it as fair, 15.8% rated it as good, and
31.6% rated it as very good while 23. 7% rated it as excellent. It is evident that most
respondents rated just-in-time as very good.
142.1% rated periodic review technique as poor, 26.3 % rated it as fair, 18.4% rated it as
good, and 5.3% rated it as very good while 7.9% rated it as excellent. There, it is evident that
most respondents rated periodic review techniques as poor.
5.3% rated material requirement planning as poor, 15.8% rated it as fair 13.2% rated it
as good and 21.1% rated it as very good while 44.7% rated it as excellent. It is evident that most
respondents rated material requirement planning 1 as excellent.
Frequency of occurrence
Respondents were asked to indicate frequency of occurrence of the incidences (Table 6).
Table 6. Frequency of occurrence
Incidence Never Rarely Sometimes Often Very Often Total
Underproduction 1(2.6%) 4 (10.5%) 4(10.5%) 13(34.2%) 16(42.1%) 38(100%)
Overproduction 3(7.9%) 3(7.9%) 6(15.8%) 10(26.3%) 16(42.1%) 38(100%)
Excessive
stocks
0 (0%) 4(10.5%) 5(13.2%) 17 (44.7%) 12(31.6%) 38(100%)
Stock out
situations
4(10.5%) 3(7.9%) 2(5.3%) 15 (39.5%) 14 (36.8%) 38(100%)
Production
Bottlenecks
2(5.3%) 5(13.2%) 7(18.4%) 14(36.8%) 10(26.3%) 38(100%)
Delays in
delivery of raw
materials
4(10.5%) 8(21.1%) 12(31.6%) 7(18.4%) 7(18.4%) 38(100%)
Stock outs of
spare parts for
machines
2(5.3%) 5(13.2%) 2(5.3%) 6(15.8%) 23(60.5%) 38(100%)
2.6% indicated that underproduction never occurred, 10.5% indicated that it rarely occurred,
10.5% indicated that it sometimes occurred, 34.2% indicated that it often occurred while 42.1%
indicated that it occurred very often. It is evident that most respondents indicated that
underproduction occurred very often in their organizations.
7.9% indicated that overproduction never occurred, 7.9% indicated that it rarely
occurred, 15.8% indicated that it sometimes occurred, 26.3% indicated that it often occurs while

© Raymond, Vincent, Mercy & Bellah
Licensed under Creative Common Page 1640
42.15 % indicated that it occurred very often. It is evident that most respondents indicated that
overproduction occurred very often in their organizations.
No respondent indicated that excessive stocks occurred, 10.55 % indicated that it rarely
occurred, 13.2% indicated that it sometimes occurred 44.7% indicated that it often occurred
while 31.6% indicated that it occurred very often. It is evident that most respondents indicated
that excessive stocks occurred often in their organizations.
10.5% indicated that stock out situations never occurred, 7.9% indicated that it rarely
occurred, 5.3% indicated that it sometimes occurred, 39.5% indicated that it often occurred
while 36.8% indicated that it occurred very often. It is evident that most respondents indicated
that stock out situations occurred often in their organizations.
5.3% indicated that production bottlenecks never occurred, 13.2% indicated that it rarely
occurred, 18.4% indicated that they sometimes occurred, 36.8% indicated that they occurred
often while 26.3% indicated that they occurred very often. Most respondents (31.6%) indicated
that delays in delivery of raw materials sometimes occurred.
The extent to which effective inventory management practices
contributes to the frequency of occurrence
Respondents were asked to indicate the extent to which they agreed that ineffective
management practices contributed to the occurrence of the incidences indicated in the table.
Table 7. Contribution of effective inventory management to the frequency of occurrence
Incidence Strongly
Disagree
Disagree Neutral Agree Strongly
agree
Total
Underproduction (5.3%) 4(10.5%) 3(7.9%) 7(18.4%) 22(57.9%) 38(100%)
Overproduction 2(5.3%) 4(10.5%) 4(10.5%) 11(28.9%) 17(44.7%) 38(100%)
Excessive
stocks
5(13.2%) 5(13.2%) 2(5.3%) 8 (21.1%) 18(47.4%) 38(100%)
Stock out
situations
4(10.5%) 5(13.2%) 4(10.5%) 9 (23.7%) 16 (42.1%) 38(100%)
Production
Bottlenecks
4(10.5%) 5(13.2%) 6(15.8%) 8(21.1%) 15(39.5%) 38(100%)
Delays in
delivery of raw
materials
5(13.2%) 2(5.3%) 4(10.5%) 9(23.7%) 18(47.4%) 38(100%)
Stock outs of
spare parts for
machines
2(5.3%) 3(7.9%) 6(15.8%) 13(34.2%) 14(36.8%) 38(100%)

International Journal of Economics, Commerce and Management, United Kingdom
Licensed under Creative Common Page 1641
5.3% strongly agreed that ineffective inventory management practices contributes to
underproduction, 10.5% disagreed that it contributes, 7.9% were neutral, 18.4% agreed while
57.9% strongly agreed. It is evident that most respondents strongly agreed that ineffective
inventory management practices contributed to underproduction.
Most respondents that is 44.7% strongly agreed that ineffective management practices
contributed to overproduction. Most respondents that is 47.4% strongly agreed that ineffective
inventory management contributed to excessive stock.
Most respondents that is 42.1% strongly agreed that ineffective inventory management
contributes to stock out situations. Most respondents that is 39.5% strongly agreed that
ineffective inventory management contributes to stock out situations. Most respondents that is
47.4% strongly agreed that ineffective inventory management contributes to stock out situations.
Most respondents that is 36.8% strongly agreed that ineffective inventory management
contributes to stock out of spare parts for machines.
Organization’s commitment in using effective inventory management techniques
The respondents were asked to indicate to what extent they thought that their organizations
were committed in using effective inventory management techniques.
Table 8. Organization‟s commitment in using effective inventory management techniques
Frequency Percent
Not at all 3 7.9
Slightly 13 34.2
To some extent 9 23.7
Moderately 7 18.4
To great extent 6 15.8
Total 38 100.0
7.9% indicated that their organizations was not at all committed in using effective inventory
management techniques, 34.4% indicated that their organizations were slightly committed,
23.7% indicated that their organizations were to some extent committed while 18.4% indicated
their organizations were moderately committed and 15.8% indicated that their organizations
were to great extent committed.
Frequency in preparation of inventory budget
The respondents were asked to indicate the frequency of preparation of inventory budget in
their organizations.
© Raymond, Vincent, Mercy & Bellah
Licensed under Creative Common Page 1642
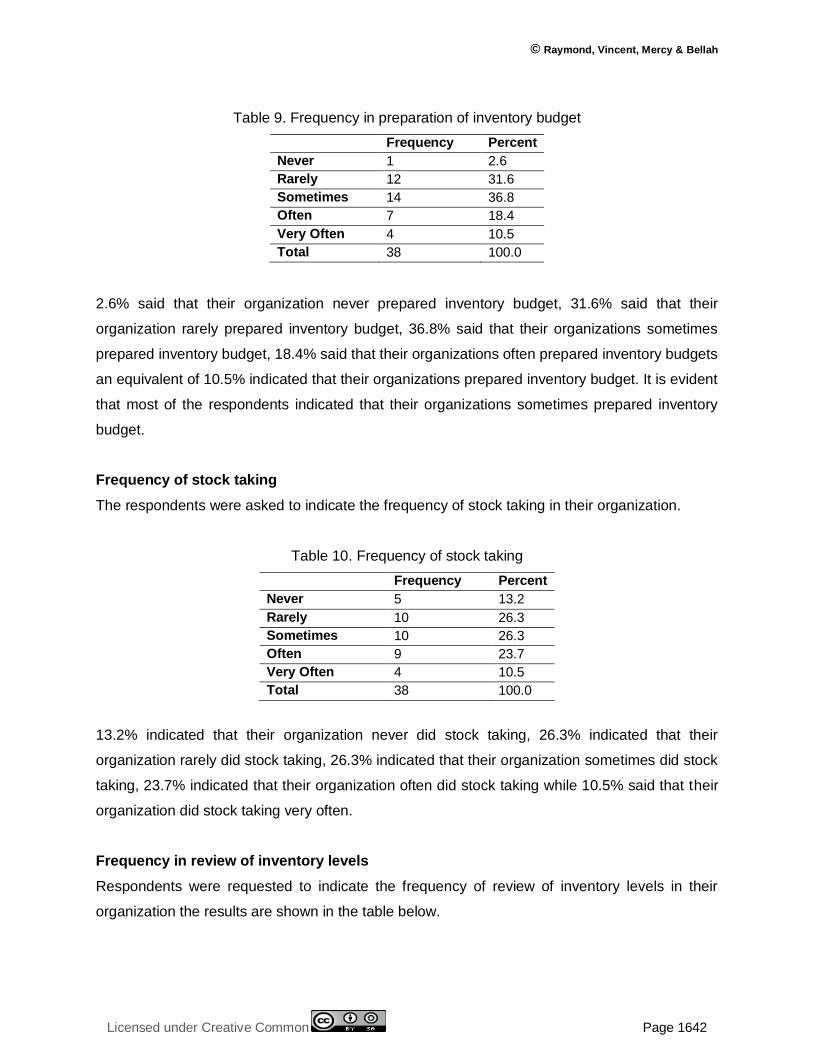
Table 9. Frequency in preparation of inventory budget
Frequency Percent
Never 1 2.6
Rarely 12 31.6
Sometimes 14 36.8
Often 7 18.4
Very Often 4 10.5
Total 38 100.0
2.6% said that their organization never prepared inventory budget, 31.6% said that their
organization rarely prepared inventory budget, 36.8% said that their organizations sometimes
prepared inventory budget, 18.4% said that their organizations often prepared inventory budgets
an equivalent of 10.5% indicated that their organizations prepared inventory budget. It is evident
that most of the respondents indicated that their organizations sometimes prepared inventory
budget.
Frequency of stock taking
The respondents were asked to indicate the frequency of stock taking in their organization.
Table 10. Frequency of stock taking
Frequency Percent
Never 5 13.2
Rarely 10 26.3
Sometimes 10 26.3
Often 9 23.7
Very Often 4 10.5
Total 38 100.0
13.2% indicated that their organization never did stock taking, 26.3% indicated that their
organization rarely did stock taking, 26.3% indicated that their organization sometimes did stock
taking, 23.7% indicated that their organization often did stock taking while 10.5% said that their
organization did stock taking very often.
Frequency in review of inventory levels
Respondents were requested to indicate the frequency of review of inventory levels in their
organization the results are shown in the table below.

International Journal of Economics, Commerce and Management, United Kingdom
Licensed under Creative Common Page 1643
Table 11. Frequency in review of inventory levels
Frequency Percent
Never 3 7.9
Rarely 6 15.8
Sometimes 17 44.7
Often 6 15.8
Very Often 6 15.8
Total 38 100.0
7.9% indicated that their organization never reviewed their inventory levels, 15.8% said that
their organization rarely reviewed their inventory levels. 44.7% indicated that their organizations
sometimes reviewed inventory levels, 15.8% indicated that their organization reviewed their
inventory levels often while 15.8% indicated that their organizations reviewed their inventory
levels very often.
Effectiveness in inventory management practices
Respondents were asked to indicate the level of effectiveness of their organization in the
preparation of inventory budget. The responses are as shown.
Table 12. Effectiveness in inventory management practices
Frequency Percent
Not effective 10 26.3
Least effective 3 7.9
Fairly effective 8 21.1
Effective 9 23.7
Highly effective 8 21.1
Total 38 100.0
26.3% indicated that their organizations were not effective in preparation of inventory budget,
7.9% indicated that they were least effective, 21.1% indicated that they were fairly effective,
23.7% indicated that they were effective while 21.1 % indicated their organizations were highly
effective in preparation of inventory budget.
Level of effectiveness in updating the inventory budget
The respondents were requested to indicate the level of effectiveness of their organization in
updating the inventory budget. The table below shows the responses.

© Raymond, Vincent, Mercy & Bellah
Licensed under Creative Common Page 1644
Table 13. Level of effectiveness in updating the inventory budget
Frequency Percent
Not effective 4 10.5
Least Effective 13 34.2
Fairly effective 10 26.3
Effective 6 15.8
Highly effective 5 13.2
Total 38 100.0
10.5% indicated that their organizations were not effective in updating the inventory
budget,34.2% said that their organizations were least effective, 26.3% indicated that their
organization were fairly effective, 15.8% indicated that their organization were effective while
13.2% indicated that their organizations were highly effective in updating the inventory budget.
Level of effectiveness in the use of computers in inventory budgeting
Respondents were asked to indicate the level of effectiveness of their organizations in the use
of computers in inventory budgeting. The responses were as shown below.
Table 14. Level of effectiveness in the use of computers in inventory budgeting
Frequency Percent
Not effective 16 42.1
Least effective 5 13.2
Fairly effective 11 28.9
Effective 3 7.9
Highly effective 3 7.9
Total 38 100.0
42.1% indicated that their organizations were not effective, 13.2% indicated that their
organization were least effective, 28.9% indicated that their organization were fairly effective,
7.9% indicated that their organizations were effective while 7.9% indicated that their
organizations were highly effective.
Level of effectiveness in inventory levels management practices
Respondents were asked to indicate the level of effectiveness of their organizations in inventory
levels management practices. Below are the responses.

International Journal of Economics, Commerce and Management, United Kingdom
Licensed under Creative Common Page 1645
Table 15. Level of effectiveness in inventory levels management practices
Inventory
level
management
indicators
Not
effective
Least
effective
Fairly
effective
Effective Highly
effective
Total
Establishment
of maximum
and minimum
inventory
levels
4 (10.5%) 3 (7.9%) 7(18.4%) 14(36.8%) 10(26.3%) 38(100%)
Determination
of re-order
level of stock
9(23.7%) 6(15.8%) 11(28.9%) 8(21.1%) 4(10.5%) 38(100%)
Ensuring
availability of
adequate stock
at all time
18(47.4%) 11(28.9%) 4(10.5%) 2 (5.3%) 3(7.9%) 38(100%)
Use of
computers in
monitoring
inventory level
17(44.7%) 5(13.2%) 7(18.4%) 5 (13.2%) 4 (10.5%) 38(100%)
10.5% indicated that their organization were not effective in the establishment of maximum and
minimum inventory levels.7.9% indicated the organizations were least effective, 18.4% indicated
that organizations were fairly effective, 36.8% indicated that their organizations were effective
while 26.3% indicated that the organizations were highly effective. It is evident that most
organizations were effective in the establishment of maximum and minimum inventory levels.
Effectiveness of stock taking practices
Respondents were requested to indicate the level of effectiveness of their organizations in stock
taking practices. Below were the responses.
Table 16. Effectiveness of stock taking practices
Frequency Percent
Not effective 3 7.9
Least effective 4 10.5
Fairly effective 6 15.8
Effective 16 42.1
Highly effective 9 23.7
Total 38 100.0
7.9% said that their organizations were not effective. 10.5% indicated that their organizations
were least effective, 15.8% indicated that the organizations were fairly effective, 42.1%
© Raymond, Vincent, Mercy & Bellah
Licensed under Creative Common Page 1646
indicated that their organizations were effective while 23.7% indicated that their organizations
were highly effective.
Frequency of stock tacking
The respondents were asked to indicate how often stock taking was taken in their organizations.
Below are the responses.
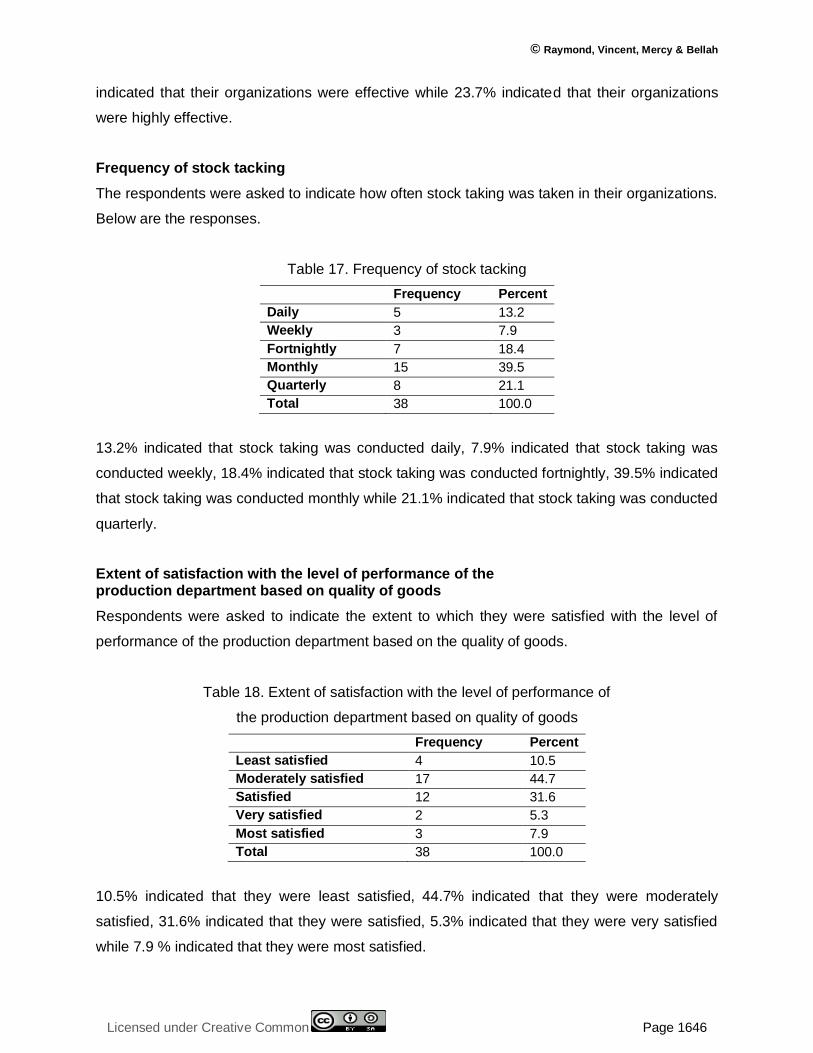
Table 17. Frequency of stock tacking
Frequency Percent
Daily 5 13.2
Weekly 3 7.9
Fortnightly 7 18.4
Monthly 15 39.5
Quarterly 8 21.1
Total 38 100.0
13.2% indicated that stock taking was conducted daily, 7.9% indicated that stock taking was
conducted weekly, 18.4% indicated that stock taking was conducted fortnightly, 39.5% indicated
that stock taking was conducted monthly while 21.1% indicated that stock taking was conducted
quarterly.
Extent of satisfaction with the level of performance of the production department based on quality of goods
Respondents were asked to indicate the extent to which they were satisfied with the level of
performance of the production department based on the quality of goods.
Table 18. Extent of satisfaction with the level of performance of
the production department based on quality of goods
Frequency Percent
Least satisfied 4 10.5
Moderately satisfied 17 44.7
Satisfied 12 31.6
Very satisfied 2 5.3
Most satisfied 3 7.9
Total 38 100.0
10.5% indicated that they were least satisfied, 44.7% indicated that they were moderately
satisfied, 31.6% indicated that they were satisfied, 5.3% indicated that they were very satisfied
while 7.9 % indicated that they were most satisfied.

International Journal of Economics, Commerce and Management, United Kingdom
Licensed under Creative Common Page 1647
Extent of satisfaction with the level of performance of the production department based on optimal production
Respondents were asked to indicate the extent to which they were satisfied with the level of
performance of the production department based on optimal production. The responses are
depicted in the table below.
Table 19. Extent of satisfaction with the level of performance of the
production department based on optimal production
Frequency Percent
Least satisfied 14 36.8
Moderately satisfied 9 23.7
Satisfied 7 18.4
Very satisfied 4 10.5
Most satisfied 4 10.5
Total 38 100.0
36.8% indicated that they were least satisfied, 23.7% indicated that they were moderately
satisfied, 18.4% indicated that they were satisfied, 10.5% indicated that they were very satisfied
while 10.5% respondents indicated that they were most satisfied.
Extent of satisfaction with the level of performance of the production
department based on on-time delivery
Respondents were asked to indicate the extent to which they were satisfied with the level of
performance of the production department based on on-time delivery.
Table 20. Extent of satisfaction with the level of performance of the
production department based on on-time delivery
Frequency Percent
Least satisfied 7 18.4
Moderately satisfied 18 47.4
Satisfied 6 15.8
Very satisfied 2 5.3
Most satisfied 5 13.2
Total 38 100.0
18.4% indicated that they were least satisfied, 47.4% indicated that they were moderately
satisfied, 15.8% indicated that they were satisfied, 5.3% indicated that they were very satisfied
while 13.2% indicated that they were most satisfied.

© Raymond, Vincent, Mercy & Bellah
Licensed under Creative Common Page 1648
Level of performance of production department of manufacturing
firms in Mombasa County
Respondents were asked to indicate the extent to which they were satisfied with the level of
performance of the production department based on achievement of production targets. The
responses are depicted in the table below.
Table 21. Level of performance based on achievement of production targets
Frequency Percent
Least Satisfied 12 31.6
Moderately satisfied 11 28.9
Satisfied 7 18.4
Very satisfied 3 7.9
Most satisfied 5 13.2
Total 38 100.0
31.6% indicated that they were least satisfied, 28.9% indicated that they were moderately
satisfied, 18.4% indicated that they were satisfied, 7.9% indicated that they were very satisfied
while 5 13.2% respondents indicated that they were most satisfied.
Extent of satisfaction with the level of performance of the
production department based on output per unit of time
Respondents were asked to indicate the extent to which they were satisfied with the level of
performance of the production department based on output per unit of time.
Table 22. Extent of satisfaction with the level of performance of the
production department based on output per unit of time
Frequency Percent
Least satisfied 1 2.6
Moderately Satisfied 3 7.9
Satisfied 6 15.8
Very satisfied 9 23.7
Most satisfied 19 50.0
Total 38 100.0
2.6% indicated that they were least satisfied, 7.9% indicated that they were moderately
satisfied, 15.8% indicated that they were satisfied, 23.7% indicated that they were very satisfied
while 50% respondents indicated that they were most satisfied.

International Journal of Economics, Commerce and Management, United Kingdom
Licensed under Creative Common Page 1649
Extent to which application of computerized warehousing
influences production efficiency
Respondents were asked to indicate the extent to which they agreed that application of
computerized warehousing influences production efficiency.
Table 23. Extent to which application of computerized warehousing
influences production efficiency
Frequency Percent
Strongly disagree 1 2.6
Disagree 6 15.8
Neutral 4 10.5
Agree 6 15.8
Strongly agree 21 55.3
Total 38 100.0
2.6% strongly disagreed, 15.8% disagreed, 10.5% were neutral, 15.8% agreed and 55.3%
strongly agreed. It is evident that most respondents strongly agreed that computerized
warehousing influences production efficiency.
Extent to which application of computerized inventory
records influences production efficiency
Respondents were asked to indicate the extent to which they agreed that application of
computerized inventory records influences production efficiency.
Table 24. Extent to which application of computerized inventory records
influences production efficiency
Frequency Percent
Strongly disagree 4 10.5
Disagree 1 2.6
Neutral 5 13.2
Agree 4 10.5
Strongly agree 24 63.2
Total 38 100.0
10.5% strongly disagreed, 12.6% disagreed, 13.2% were neutral, 10.5% agreed while 2 63.2%
strongly agreed. It is evident that most respondents strongly agreed that computerized inventory
records influences production efficiency.

© Raymond, Vincent, Mercy & Bellah
Licensed under Creative Common Page 1650
Extent to which use of bar codes influences production efficiency
Respondents were asked to indicate the extent to which they agreed that application of bar
codes influences production efficiency.
Table 25. Extent to which application of computerized inventory records
influences production efficiency
Frequency Percent
Strongly disagree 2 5.3
Disagree 3 7.9
Neutral 4 10.5
Agree 15 39.5
Strongly agree 14 36.8
Total 38 100.0
Two respondents 5.3% strongly disagreed, 3 respondents 7.9% disagreed, 4 respondents
10.5% were neutral, 15 respondents 39.5% agreed while 14 respondents 36.8% strongly
agreed. It is evident that most respondents agreed that application of bar codes records
influences production efficiency.
Extent to which application of automated replenishment influences production efficiency
Respondents were asked to indicate the extent to which they agreed that application of
automated replenishment influences production efficiency. The responses are shown below.
Table 26. Extent to which application of automated replenishment
influences production efficiency
Frequency Percent
Strongly disagree 3 7.9
Disagree 2 5.3
Neutral 5 13.2
Agree 7 18.4
Strongly agree 21 55.3
Total 38 100.0
7.9% strongly disagreed, 5.3% disagreed, 13.2% were neutral, 18.4% agreed while 55.3%
strongly agreed. It is evident that most respondents agreed that application of bar codes records
influences production efficiency.
International Journal of Economics, Commerce and Management, United Kingdom
Licensed under Creative Common Page 1651
Extent to which application of inventory management software influences production efficiency
Respondents were asked to indicate the extent to which they agreed that application of
inventory management software influences production efficiency.
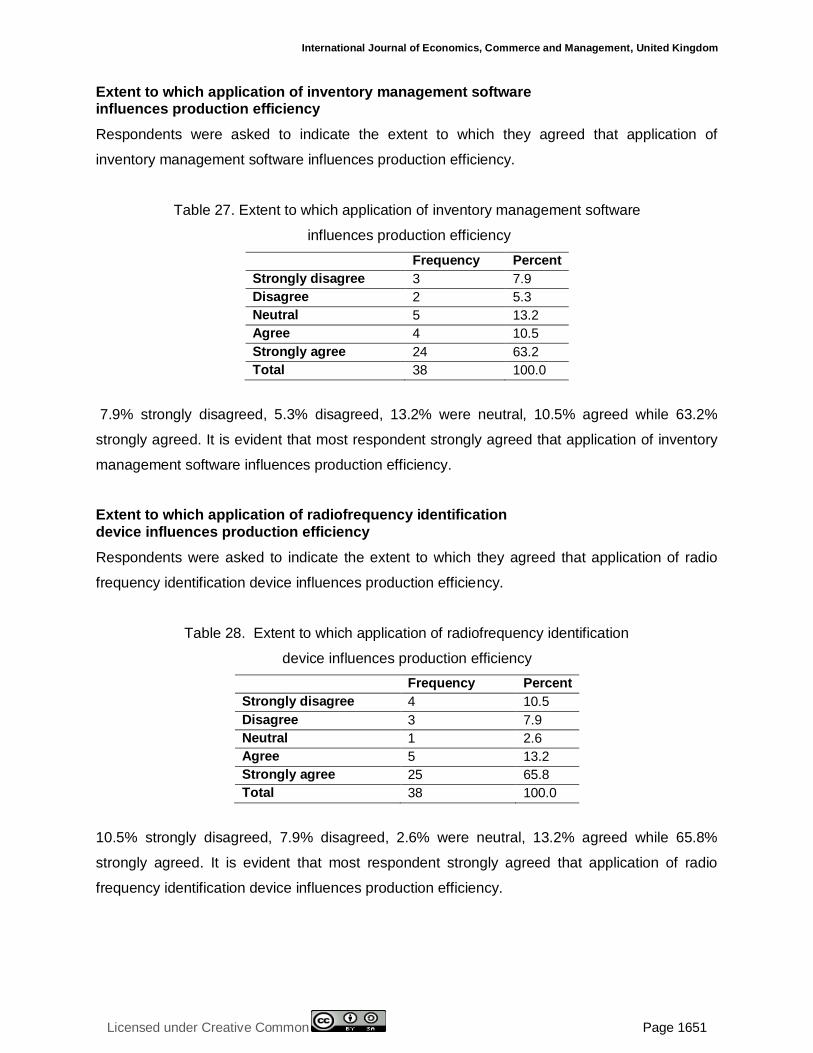
Table 27. Extent to which application of inventory management software
influences production efficiency
Frequency Percent
Strongly disagree 3 7.9
Disagree 2 5.3
Neutral 5 13.2
Agree 4 10.5
Strongly agree 24 63.2
Total 38 100.0
7.9% strongly disagreed, 5.3% disagreed, 13.2% were neutral, 10.5% agreed while 63.2%
strongly agreed. It is evident that most respondent strongly agreed that application of inventory
management software influences production efficiency.
Extent to which application of radiofrequency identification
device influences production efficiency
Respondents were asked to indicate the extent to which they agreed that application of radio
frequency identification device influences production efficiency.
Table 28. Extent to which application of radiofrequency identification
device influences production efficiency
Frequency Percent
Strongly disagree 4 10.5
Disagree 3 7.9
Neutral 1 2.6
Agree 5 13.2
Strongly agree 25 65.8
Total 38 100.0
10.5% strongly disagreed, 7.9% disagreed, 2.6% were neutral, 13.2% agreed while 65.8%
strongly agreed. It is evident that most respondent strongly agreed that application of radio
frequency identification device influences production efficiency.
© Raymond, Vincent, Mercy & Bellah
Licensed under Creative Common Page 1652
Extent to which application of computerized inventory management affects the performance of production department
Respondents were asked to indicate the extent to which they agreed that application of
computerized management affects the performance of production department.
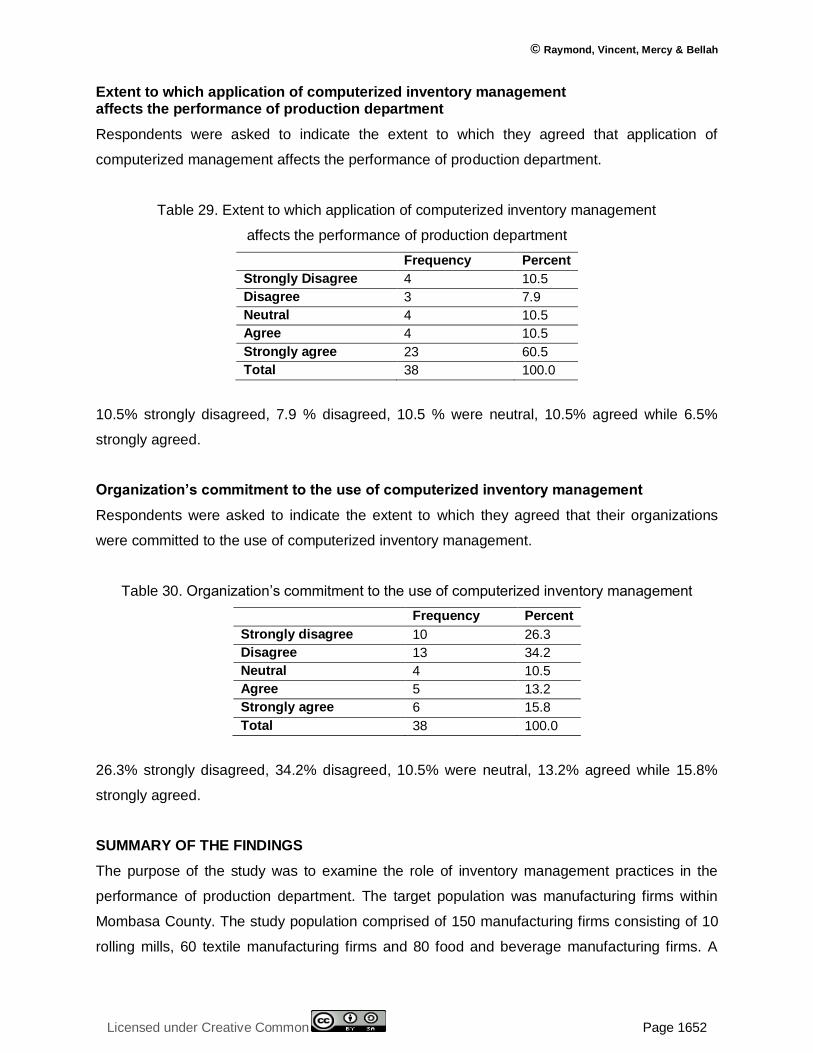
Table 29. Extent to which application of computerized inventory management
affects the performance of production department
Frequency Percent
Strongly Disagree 4 10.5
Disagree 3 7.9
Neutral 4 10.5
Agree 4 10.5
Strongly agree 23 60.5
Total 38 100.0
10.5% strongly disagreed, 7.9 % disagreed, 10.5 % were neutral, 10.5% agreed while 6.5%
strongly agreed.
Organization’s commitment to the use of computerized inventory management
Respondents were asked to indicate the extent to which they agreed that their organizations
were committed to the use of computerized inventory management.
Table 30. Organization‟s commitment to the use of computerized inventory management
Frequency Percent
Strongly disagree 10 26.3
Disagree 13 34.2
Neutral 4 10.5
Agree 5 13.2
Strongly agree 6 15.8
Total 38 100.0
26.3% strongly disagreed, 34.2% disagreed, 10.5% were neutral, 13.2% agreed while 15.8%
strongly agreed.
SUMMARY OF THE FINDINGS
The purpose of the study was to examine the role of inventory management practices in the
performance of production department. The target population was manufacturing firms within
Mombasa County. The study population comprised of 150 manufacturing firms consisting of 10
rolling mills, 60 textile manufacturing firms and 80 food and beverage manufacturing firms. A
International Journal of Economics, Commerce and Management, United Kingdom
Licensed under Creative Common Page 1653
sample of 45 firms comprising of 3 rolling mills, 24 textile manufacturing firms and 18 food and
beverages firms.
The first objective was to find out inventory management techniques applied by
manufacturing organizations in Mombasa County. The general observation concerning
inventory management techniques is that action level methods were the most used inventory
management technique. 14 respondents (36.8%) indicated that their organizations used this
technique. The least used inventory management technique was JIT whereby 5 respondents
(13.2%) used this technique. Concerning the contribution of inventory management to the
performance of production department, most respondents (44.7%) indicated that MRP 1 was
excellent in contributing to the performance of production department. Moreover, most
respondents (42.1%) ranked periodic review technique as poor. It was established incidences of
overproduction, excessive stock, stock out situations and stock out of spare parts of machines
occurred very often. The general observation was that most people strongly agreed that
ineffective inventory management practices contribute to the said incidences.
The second objective of the study was to establish the level of effectiveness of inventory
management practices of manufacturing firms in Mombasa County. The inventory management
practices being examined were inventory budgets preparation, stock tacking practices and
inventory levels management. The overall view was that most organizations were not effective
in preparation of inventory budgets as depicted by 10 respondents (26.3%) who indicated that
the organizations were not effective. Most organizations represented by 34.2 % were least
effective in updating the inventory budget, whereas most organizations representing 42.1%
were not effective in the use of computers in inventory budgeting. Most organizations
representing 42.1% were effective in stock tacking practices. Most organizations representing
47.4% were not effective in ensuring availability of adequate stock at all times.
The third objective was to determine the level of performance of production departments
of manufacturing firms in Mombasa County based on quality of goods, optimal production, on-
time delivery, achievement of production targets and output per unit of time. Most respondents
(44.7%) were moderately satisfied with the performance of the department based on the quality
of goods. Based on optimal production, most respondents (36.85) were least satisfied. Based
on on-time delivery, majority of the respondents (47.4%) were moderately satisfied. Based on
achievement of production targets, majority of the respondents (31.6%) were least satisfied
while based on output per unit of time, majority of the respondents (50%) were most satisfied.
The fourth objective was to determine whether computerized inventory management
influences the performance of production department. Most respondents (55.3%) strongly
agreed that computerized warehousing influences production efficiency. 63.2% strongly agreed

© Raymond, Vincent, Mercy & Bellah
Licensed under Creative Common Page 1654
that computerized inventory records influences production efficiency. Majority of the
respondents (39.5%) agreed that the use of bar codes influences production efficiency. Majority
of the respondents (63.2%) strongly agreed that the use of inventory management software
influences production efficiency.
CONCLUSION
The study established that majority of the respondents either agreed or strongly agreed that the
use of computerized inventory management practices such as Computerized warehousing,
computerized inventory record, bar codes, inventory management software, automated
replenishment and radio-frequency identification device influence production efficiency.
It can also be concluded that ineffective inventory management leads to incidences of
overproduction, underproduction, excessive stocks, stock out of spare parts for machines,
production bottlenecks and delays in delivery of raw materials. The study established that MRP
1 was most effective in contributing to performance of production department despite the fact
that most organizations used action level methods.
FURTHER RESEARCH
The study was conducted in the textile, rolling mills and food and beverage companies. Similar
studies could be replicated in other industries to examine the role of inventory management
practices in the performance of production department. Similar studies can also be carried out
to determine the impact of effective inventory management on organization‟s performance,
challenges in inventory management and also the impact of the use of vendor managed
inventory. Future studies should attempt to achieve a larger sample to determine whether the
results can be generalized.
REFERENCES
Ballou, R. (2001). Basic Business Logistics Transportation Material Management, Physical Distribution, 2
nd Edition, Prentice Hall, New Jersey.
Baggott, J (2005). Cost and Management Accounting, 2nd
Edition, Richard Clay Limited, Bunguy.
Ballou, C.P. (2004). Business Logistics/Supply chain management planning, organizing and controlling the supply chain. 5
th Edition, Volume 6.2001:2.
Bowersox, D.J, Closs, DJ, and Copper, MB. (2002). Supply chain-Logistics Management, International edition, MC Graw Hill, USA.
Carlson, J. G. (2002). Just-in-time approach to system wide efficiency and quality borrows from industrial techniques, Strategies for Healthcare Excellence, 6(2), 9-12.
Cannon, A.R. (2008). Inventory Improvement and Financial Performance, International Journal of Production Economics 115, 581–593.
International Journal of Economics, Commerce and Management, United Kingdom
Licensed under Creative Common Page 1655
Cachon, G.P. and M.L. Fisher (2000). Supply Chain Inventory Management and the Value of Shared Information, Management Science 46, 1032 – 1048
Cecil Bozarth and Robert Handfield, (2006). Introduction to Operations and Supply Chain Management, Prentice-Hall.
Dimitrios, P. (2008). The effect of inventory management on firm performance, International Journal of Productivity and Performance Management, 57 (5)
Eroglu, C. and C. Hofer (2011). Lean, Leaner, Too Lean? The Inventory-Performance Link Revisited, Journal of Operations Management 29, 356–369.
Eroglu, C., Brent, W., and Waller, M. (2011). Consumer driven retail operations, The moderating effect of consumer demand and case pack quantity, International Journal of Physical distribution and logistics management, 41 (5), 420-434
Fullerton R.R., C.S. McWatters and C. Fawson (2003). An Examination of the Relationship between JIT and Financial Performance, Journal of Operations Management 21, 383–404.
Green, James H. (2000). Production and Inventory Control Handbook, 3rd edition, New York, McGraw-Hill.
Harrisson, F. (2001). Supply chain management workbook, Butterworth/ Heinemann, Great Britain.
Horngren, T Charles. (2008). Cost Accounting Management Emphasis, 5th Edition, Prentice Hall, New
Jersey.
Harroson P and Jundern G. (2000). Supply Chain Management, 3rd
Edition, Mac Graw Hill Book Company, Singapore.
Juan, P. G., and Martinez, S. (2002). Effects of working capital management on SME profitability, Journal of Business Finance & Accounting, 30 (3–4), 1-14. Retrieved from http://www.sagepublications
Kolias, G.D., S.P. Dimelis and V.P. Filios (2011). An Empirical Analysis of Inventory Turnover Behavior in the Greek Retail Sector: 2000-2005. International Journal of Production Economics 133(1), 143–153.
Kotabo, K. (2002). Management of Finance Company, Sixth Edition, International Thomson Business Press, London.
Lee, H. L. (2002). Aligning Supply Chain Strategies with Product Uncertainties, California Management Review. 44(3), Spring: 105–119.
Lazaridis, I., and Dimitrios, T. (2005). The relationship between working capital management and profitability of listed companies in the Athens Stock Exchange, Retrieved from http://ssrn.com/ on July 2013.
Nair N.K (2006). Purchasing and Material Management ,1st Edition, Heinemann Educational Publishers
Limited, Oxford.
Nasiurma, D. K. (2000). Survey Sampling: Theory and methods, University of Nairobi, Nairobi, Kenya.
Peter Zachariah (2000). Inventory and Credit Management 1st Edition, Mittall Publication, New Delhi,
India.
Pandey, I. M. (2004). Financial Management 9th (ed), Vikas Publishing House PVT Ltd.
Rajeev, N. (2008). An Evaluation of Inventory Management and Performance in Indian Machine Tool SMEs: An Exploratory Study, 4th IEEE International Conference on Management of Innovation and Technology, 2008. ICMIT 2008, 21-24 Sept. 2008, Bankok, Thailand, pp. 1412-1417.
Rehman, A. (2006). Working Capital Management and Profitability: Case of Pakistani Firms (Unpublished Dissertation), COMSATS Institute of Information Technology (CIIT), Islamabad, Pakistan.
Sushma, V., and Bhupesh, S. (2007). Effect of Working Capital Management Policies on Corporate Performance an Empirical Study, Global Business Review, 8 p.267, Accessed at http://www.gbr.sagepub.com on July 2013.

© Raymond, Vincent, Mercy & Bellah
Licensed under Creative Common Page 1656
Schonsleben, P. (2000). Integral logistics Management, planning & control of comprehensive Business processes, The St-Lucie Press/AIPCS Series.
Silver EA, Pyke DF & Peterson R. (1998). Inventory management and production planning and Scheduling, 3rd Edition, John Wiley & Sons. USA.
Silver, Edward E., David F. Pyke, and Rein Peterson. (1998). Inventory Management, Production Planning, and Scheduling, 3rd edition, New York, John Wiley & Sons.
Sander, L., Matthias, H., and Geoff, W. (2010). The impact of decentralized control on firm- level inventory, Evidence from the automotive industry, International Journal of Physical Distribution & Logistics Management 41 (5) 435-456. Accessed at www.emeraldinsight.com/0960-0035.html
Tersine RJ. (2009). Principles of inventory and material management, 2nd
edition, North Holland.
Waters, D. (2008). Quantitative Methods for Business, 4th Edition, Prentice Hall, England.
Zinn, W. and Liu, P. (2008), A comparison of actual and intended consumer behavior in response to retail stockouts, Journal of Business Logistics, 29 ( 2), 141-59.