Role of Emerging Markets in the Medical Device and Equipment Industry whitepaper slideshare
51
2013 The Role of Emerging Economies in the Global Medical Device and Equipment Markets Perspective from Boston Analytics
-
Upload
kimberlee-luce -
Category
Business
-
view
678 -
download
1
Transcript of Role of Emerging Markets in the Medical Device and Equipment Industry whitepaper slideshare

2013
The Role of Emerging Economies in the Global
Medical Device and Equipment Markets
Perspective from Boston Analytics

Contents
Role Emerging Markets Play in the Global Medical Devices and Equipment Market
Case Study: GE Healthcare India
Appendix
Local Market Opportunity
Cost Effective Manufacturing
Source of Innovation
Introduction to Emerging Economies
Key Takeaways
Case Study: Philips India

Contents
Role Emerging Markets Play in the Global Medical Devices and Equipment Market
Case Study: GE Healthcare Model
Appendix
Local Market Opportunity
Cost Effective Manufacturing
Source of Innovation
Introduction to Emerging Economies
Key Takeaways
About Boston Analytics
Case Study: GE Healthcare India
Appendix
Key Takeaways
Case Study: Philips India

The term ‘emerging markets’ is associated with progress, growth,
and opportunity
3
Emerging markets are nations with social or business activity in the process of rapid growth and
industrialization. Emerging markets are countries that are restructuring their economies along
market-oriented lines and offer a wealth of opportunities in trade, technology transfers, and foreign
direct investment
Definition of Emerging Markets
“Racking my brain, at last I came up with a term that sounded more positive and invigorating:
emerging markets. ‘Third world’ suggested stagnation; ‘emerging markets’ suggested progress,
uplift and dynamism.”, Antoine van Agtmael (A),(1)
Note:
(A) Antoine van Agtmael coined the term ‘Emerging Markets’ in 1981 while launching “Third-World Equity Fund” to invest in developing-countries.
Source:
(1) Ins and outs, Acronyms BRIC out all over, September 18, 2008, Economist.
(2) What Are Emerging Markets?, Chuan Li, University of Iowa.
Characteristics of Emerging Markets(2)
High economic growth
Large population base
Transitional societies that are undertaking domestic economic and political reforms
Regional economic powerhouses

In practice, the definition of emerging economies differs according
to the source
4
FTSE MSCI Economist S&P Dow Jones
Brazil Brazil Brazil Brazil Argentina Philippines
Chile Chile Chile Chile Bahrain Poland
China China China China Brazil Qatar
Colombia Colombia Colombia Czech Republic Bulgaria Romania
Czech Republic Czech Republic Czech Republic Egypt Chile Russia
Egypt Egypt Egypt Hungary China Slovakia
Hungary Hungary Hong Kong India Colombia South Africa
India India Hungary Indonesia Czech Republic Sri Lanka
Indonesia Indonesia India Malaysia Egypt Thailand
Malaysia Malaysia Indonesia Mexico Estonia Turkey
Mexico Mexico Malaysia Morocco Hungary UAE
Morocco Morocco Mexico Peru India
Pakistan Peru Morocco Philippines Indonesia
Peru Philippines Peru Poland Jordan
Philippines Poland Philippines Russia Kuwait
Poland Russia Poland South Africa Latvia
Russia South Africa Russia Taiwan Lithuania
South Africa South Korea Saudi Arabia Thailand Malaysia
Taiwan Taiwan Singapore Turkey Mauritius
Thailand Thailand South Africa Mexico
Turkey Turkey South Korea Morocco
UAE Taiwan Oman
Thailand Pakistan
Turkey Peru
Common Key
Emerging
Economies
Brazil
Chile
China
Czech Republic
Egypt
Hungary
India
Indonesia
Malaysia
Mexico
Morocco
Peru
Philippines
Poland
Russia
South Africa
Thailand
Turkey
List of Emerging Economies
Emerging
economies which
are common across
the sources have
been shortlisted as
“Key Emerging
Economies” for the
purpose of this study
18
BRIC Economies

5
Emerging economies or markets are growing economic powerhouses with a
large consumer base who currently represent very little in GDP per capita
Population
(in M) 2010
Demographic Dynamics of Different Countries
1,008
3,761
2,045
Advanced
Markets(A)
Key Emerging
Markets(B)
Other Markets(C)
Growth in Real GDP (%)(D)GDP PPP(E) 2012
($ T, Current Prices) 2007‒12 2012‒17
42
31
11
2 3
6 6
5 5
GDP Per Capita
PPP ($, Current Prices)
40,814
8,016
5,171
Notes:
(A) Includes 34 countries out of 35 countries listed as ‘Advanced’ (excluding Czech Republic) as per IMF based on multiple parameters such as per-capita income level, export
diversification, degree of integration into the global financial system, human development index , etc. It includes the USA and Canada in North America, most nations in Western
Europe, Japan, Australia, New Zealand, etc.
(B) Set of 18 countries common across the lists of Emerging Markets identified as Key Emerging Markets in previous slide
(C) 137 countries including other emerging markets and the rest of the world
(D) Real GDP in local currency
(E) PPP = Purchasing Power Parity
Source:
(1) IMF World Economic Outlook Database, October 2013

Contents
Role Emerging Markets Play in the Global Medical Devices and Equipment Market
Local Market Opportunity
Cost Effective Manufacturing
Source of Innovation
Introduction to Emerging Economies
Case Study: GE Healthcare Model
Appendix
Key Takeaways
About Boston Analytics
Case Study: GE Healthcare India
Appendix
Key Takeaways
Case Study: Philips India
7
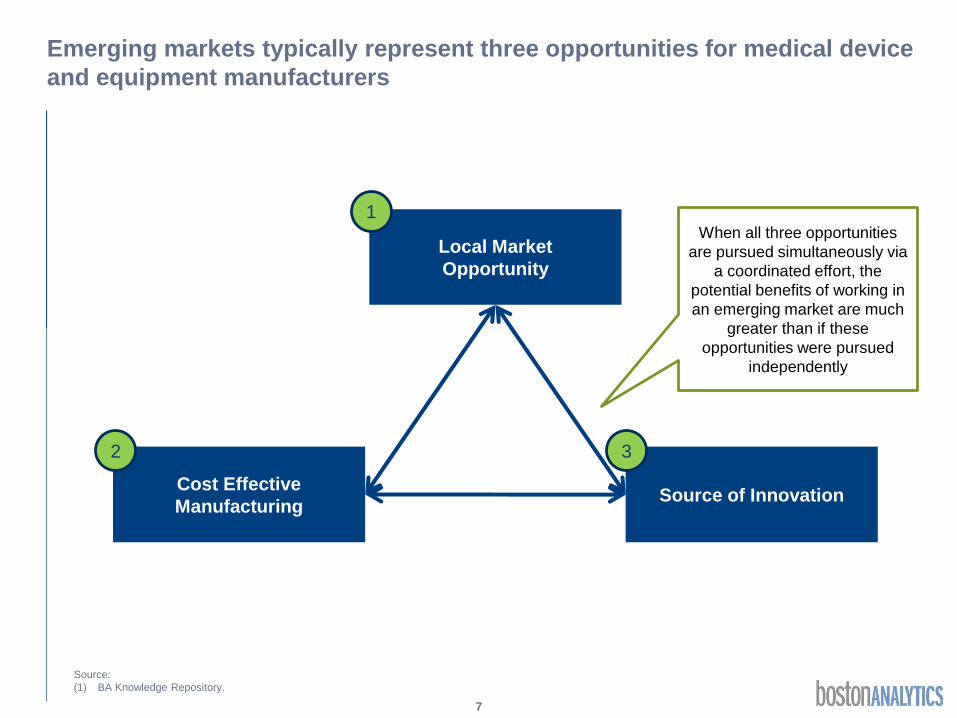
Emerging markets typically represent three opportunities for medical device
and equipment manufacturers
Local Market
Opportunity
1
Cost Effective
Manufacturing
2
Source of Innovation
3
When all three opportunities
are pursued simultaneously via
a coordinated effort, the
potential benefits of working in
an emerging market are much
greater than if these
opportunities were pursued
independently
Source:
(1) BA Knowledge Repository.

8
In order to pursue these opportunities, a set of fundamental questions must
be answered however
Key Questions:
1. Which companies have established R&D
centers in emerging markets and why?
2. What are the benefits?
3. What are the key drivers of an increased
focus on R&D in emerging markets?
4. What trends exist, if any?
Key Questions:
1. What are the specific local market
opportunities?
2. What is the future demand for
medical devices and equipment
versus today?
3. What are the demand drivers and
how volatile are they?
4. What are the key challenges?
Key Questions:
1. What % of the top players’
manufacturing bases are in emerging
markets?
2. In which countries and why?
3. What are the key drivers shaping the
continued move to manufacturing in
emerging countries?
4. What trends exist, if any?
Local Market Opportunity
Cost Effective
ManufacturingSource of Innovation
1
2 3
Source:
(1) BA Knowledge Repository.

Contents
Role Emerging Markets Play in the Global Medical Devices and Equipment Market
Local Market Opportunity
Cost Effective Manufacturing
Source of Innovation
Introduction to Emerging Economies
Case Study: GE Healthcare Model
Appendix
Key Takeaways
About Boston Analytics
Case Study: GE Healthcare India
Appendix
Key Takeaways
Case Study: Philips India

The share of the global medical device and equipment industry
which resides in key emerging markets is currently small
10
203
33
10
Market Size
Others
Key Emerging Economies
Advanced Economies
$ 246 B
13%
83%
4%
Global Medical Devices and Equipment
Market in 2010(1)
Share of Countries in Global Medical Devices and Equipment
Market (2010)(1)
China23%
Russia18%
Brazil11%
Mexico8%
India7%
Others33%
100% = $ 33 B
US47%
Japan12%
Germany10%
France4%
UK4%
Others23%
100% = $ 203 B
BRIC countries
together constitute
59% of the total
market in key
emerging
economies
Source:
(1) Medical Devices Market Analysis, 2010, Espicom Business Intelligence.
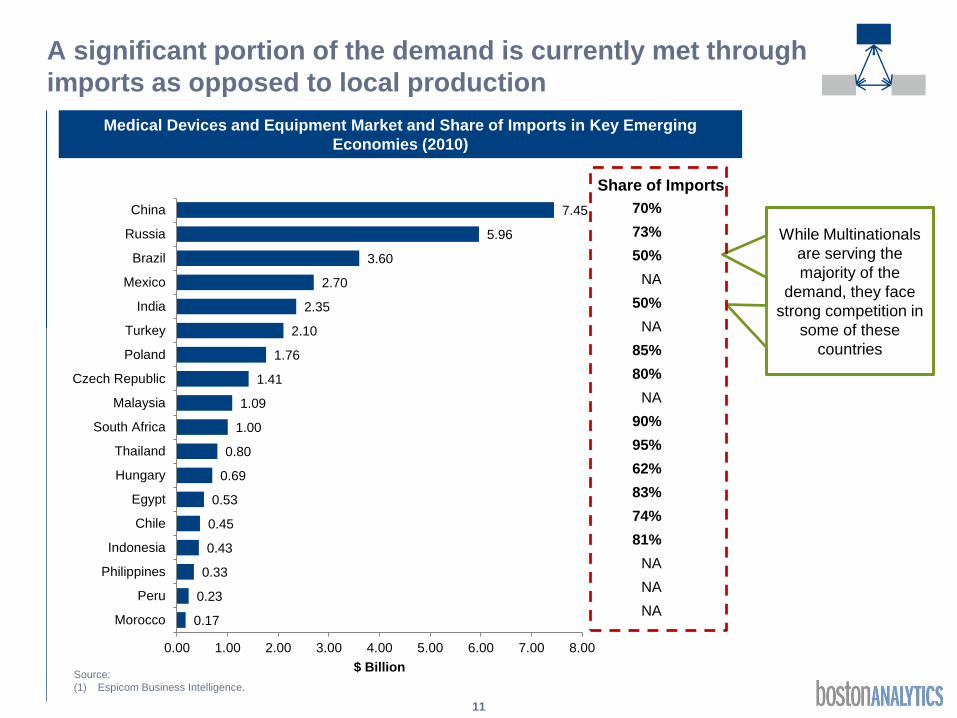
A significant portion of the demand is currently met through
imports as opposed to local production
11
Medical Devices and Equipment Market and Share of Imports in Key Emerging
Economies (2010)
7.45
5.96
3.60
2.70
2.35
2.10
1.76
1.41
1.09
1.00
0.80
0.69
0.53
0.45
0.43
0.33
0.23
0.17
0.00 1.00 2.00 3.00 4.00 5.00 6.00 7.00 8.00
China
Russia
Brazil
Mexico
India
Turkey
Poland
Czech Republic
Malaysia
South Africa
Thailand
Hungary
Egypt
Chile
Indonesia
Philippines
Peru
Morocco
$ Billion
Share of Imports
70%
73%
50%
NA
50%
NA
85%
80%
NA
90%
95%
62%
83%
74%
81%
NA
NA
NA
Source:
(1) Espicom Business Intelligence.
While Multinationals
are serving the
majority of the
demand, they face
strong competition in
some of these
countries

Compared to advanced economies, the market is considerably
under penetrated when per capita spend is considered
12
94.9
23.919.5
8.8 8.5 8.2 7.4 6.0 5.43.6 2.7 2.4 2.1
0.0
10.0
20.0
30.0
40.0
50.0
60.0
70.0
80.0
90.0
100.0
USA Japan Germany France UK Italy China Russia Canada Brazil Mexico India Turkey
$ B
illio
n
Population 2010
(M)(2)
Per Capita
Market ($)
310
306
127
188
82
239
63
140
62
137
60
136
1,341
6
140
42
34
158
193
19
109
25
1,216
2
71
29
Medical Devices and Equipment Market by Country (2010)(1)
Source:
(1) Espicom Business Intelligence.
(2) IMF World Economic Outlook Database, 2010.
Advanced Economies
Key Emerging Economies

Although small in size, the market in key emerging economies
is expected to grow faster than advanced economies
13
YoY Growth in Medical Devices and Equipment Market by Countries
(2010–2015)(1)
16%
14%
10%
9%
9%
8%
7%
6%
9%
6%
6%
5%
4%
3%
4%
0% 5% 10% 15% 20%
India
China
Malaysia
Thailand
Egypt
Philippines
South Africa
Brazil
Key Emerging Markets
Sweden
Denmark
Finland
UK
US
Advanced Countries
Key E
me
rgin
g E
co
no
mie
sA
dva
nc
ed
Ec
on
om
ies
Key Points
The growing demand is driven by:
1. Large and growing patient
population
2. Increasing investment in
healthcare infrastructure
3. Increase in healthcare
insurance penetration
Source:
(1) Espicom Business Intelligence.

Large and growing patient population
14
DriverTrends
Key Points
Note:
(A) AE = Advanced Economies.
(B) KEE = Key Emerging Economies.
.
Large and
Growing
Patient
Population
AE(A) KEE(B)
50 86 167 209
264 55
101
233
301
438
-
100
200
300
400
500
600
700
800
1950 1975 2000 2010 2020
Millio
n
Advanced Key Emerging
65+ Population in Different Countries
Source:
(1) IMF World Economic Outlook Database, 2010.
(2) World Health Statistics 2010, WHO.
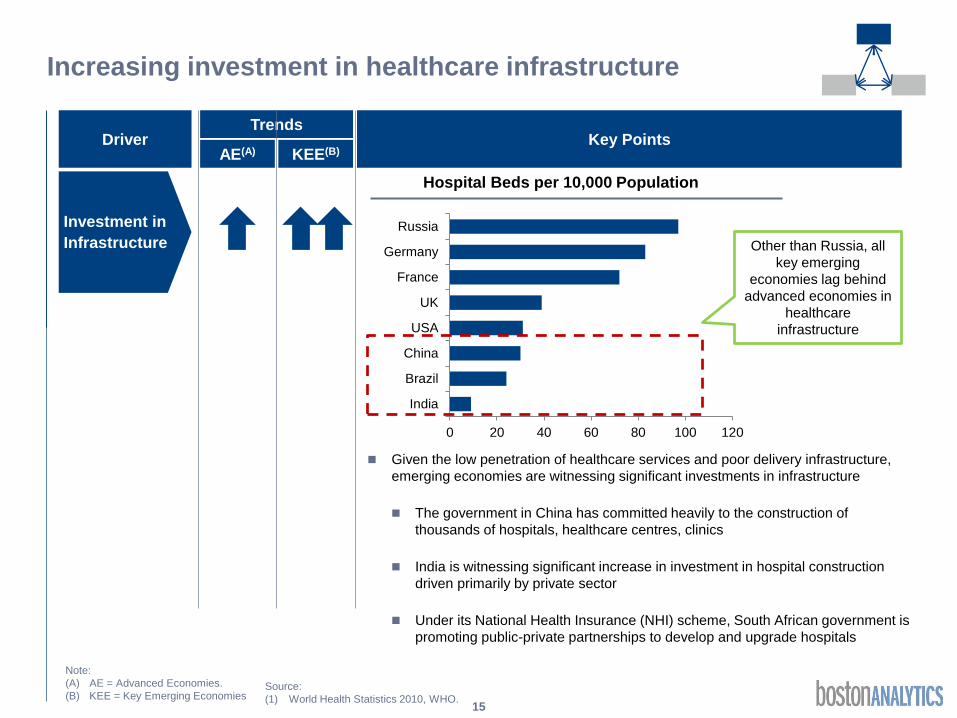
Increasing investment in healthcare infrastructure
15
DriverTrends
Key Points
Investment in
Infrastructure
AE(A) KEE(B)
0 20 40 60 80 100 120
India
Brazil
China
USA
UK
France
Germany
Russia
Hospital Beds per 10,000 Population
Other than Russia, all
key emerging
economies lag behind
advanced economies in
healthcare
infrastructure
Given the low penetration of healthcare services and poor delivery infrastructure,
emerging economies are witnessing significant investments in infrastructure
The government in China has committed heavily to the construction of
thousands of hospitals, healthcare centres, clinics
India is witnessing significant increase in investment in hospital construction
driven primarily by private sector
Under its National Health Insurance (NHI) scheme, South African government is
promoting public-private partnerships to develop and upgrade hospitals
Note:
(A) AE = Advanced Economies.
(B) KEE = Key Emerging EconomiesSource:
(1) World Health Statistics 2010, WHO.

Increase in healthcare insurance penetration
16
DriverTrends
Key Points
Increase in
Healthcare
Insurance
Penetration
AE(A) KEE(B)
Country 2000 2007Growth in
Share
Brazil 33.9% 39.4% 2.2%
China 1.0% 7.1% 32.3%
France 61.6% 63.9% 0.5%
Germany 40.8% 40.1% (0.2%)
India 1.0% 2.1% 11.2%
Japan 1.7% 13.7% 34.7%
Russia 8.1% 9.6% 2.5%
UK 15.6% 6.9% (11.0%)
USA 60.3% 63.5% 0.7%
Rising cost of healthcare and increased number of private payors has
increased healthcare insurance in emerging markets
Share of Private Insurance within total Private Healthcare Expenditures
Note:
(A) AE = Advanced Economies.
(B) KEE = Key Emerging Economies.
Source:`
(1) World Health Statistics 2010, WHO.

Contents
Role Emerging Markets Play in the Global Medical Devices and Equipment Market
Local Market Opportunity
Cost Effective Manufacturing
Source of Innovation
Introduction to Emerging Economies
Case Study: GE Healthcare Model
Appendix
Key Takeaways
About Boston Analytics
Case Study: GE Healthcare India
Appendix
Key Takeaways
Case Study: Philips India

The medical device and equipment market is highly consolidated
with 30 players constituting 80% of the global market
18
S.No CompanyMedical Device and Equipment
Sales 2009 ($ B)
Share in Global
MarketCumulative Share
1 Johnson & Johnson 23.6 9.59% 9.59%
2 Siemens Healthcare 17.4 7.07% 16.67%
3 GE Healthcare 16.0 6.50% 23.17%
4 Medtronic 14.6 5.93% 29.11%
5 Baxter International 12.6 5.12% 34.23%
6 Philips Healthcare 11.2 4.55% 38.78%
7 Abbott Laboratories 8.4 3.41% 42.20%
8 Boston Scientific 8.2 3.33% 45.53%
9 Covidien 7.8 3.17% 48.70%
10 Becton Dickinson 7.2 2.93% 51.63%
11 Stryker 6.7 2.72% 54.35%
12 B. Braun 5.8 2.36% 56.71%
13 St. Jude Medical 4.7 1.91% 58.62%
14 Cardinal Health 4.6 1.87% 60.49%
15 3M Healthcare 4.3 1.75% 62.24%
16 Zimmer 4.1 1.67% 63.90%
17 Olympus Medical 4.0 1.63% 65.53%
18 Hospira 3.9 1.59% 67.11%
19 Smith & Nephew 3.8 1.54% 68.66%
20 Toshiba 3.7 1.50% 70.16%
21 Synthes 3.4 1.38% 71.54%
22 Beckman Coulter 3.3 1.34% 72.89%
23 Danaher 3.1 1.26% 74.15%
24 Terumo 3.1 1.26% 75.41%
25 Alcon 3.0 1.22% 76.63%
26 Fresenius Medical 2.9 1.18% 77.80%
27 Biomet 2.5 1.02% 78.82%
28 CR Bard 2.5 1.02% 79.84%
29 Dentsply International 2.2 0.89% 80.73%
30 Varian Medical 2.2 0.89% 81.63%
Others 45.2 18.37% 100.00%
Total 246 100.00%
81.63%
Source:
(1) Medical Products Publishing, Rodman Publishing.

Role of key emerging markets in the manufacturing of key players
is limited to a few countries and sites
19
Production Facilities of Global Medical Devices and Equipment Companies
201
33
18
Production Facilities
Others
Key Emerging Economies
Advanced Economies
252 Facilities
China, 15
Mexico, 5
India, 5
Brazil, 4
Malaysia, 2
Others, 2
100% = 33 Facilities
US, 118
Germany, 28
Ireland, 10
Switzerland, 7
Canada, 6 Others, 32
100% = 201 Facilities
China and Mexico are
the primary
manufacturing hubs
among the key
emerging economies
13%
80%
7%
Source:
(1) Websites and Reports of Top Medical Devices and
Equipment Manufacturers.
(2) BA Analysis.
Note:
(A) Data is for 18 (constituting 46% of the world market) of the top 30
medical devices manufacturers. Please refer to Appendix for details.

China and Mexico are the only two emerging economies among the
top 15 exporters of medical devices
20
Country TypeTotal
Exports
Share in Global
Exports
USA Advanced 37.01 22.99%
Germany Advanced 21.69 13.47%
Netherlands Advanced 10.86 6.74%
France Advanced 9.10 5.65%
Switzerland Advanced 8.73 5.42%
Belgium Advanced 8.51 5.28%
Ireland Advanced 8.10 5.03%
China Key Emerging 7.66 4.76%
Japan Advanced 6.39 3.97%
Mexico Key Emerging 5.70 3.54%
UK Advanced 5.53 3.43%
Italy Advanced 3.25 2.02%
Singapore Advanced 3.07 1.91%
Denmark Advanced 2.49 1.54%
Sweden Advanced 2.48 1.54%
Share of Countries in Global Medical Devices and Equipment
Exports ($ B)
Exports of Medical Devices and Equipment
from Key Emerging Economies
7,664
5,704
793
791
750
582
523
401
289
248
183
112
103
88
38
12
10
3
- 2,000 4,000 6,000 8,000 10,000
China
Mexico
Malaysia
Czech Republic
Poland
India
Thailand
Brazil
Hungary
Indonesia
Turkey
Russia
Philippines
South Africa
Egypt
Chile
Morocco
Peru
$ Million
China and Mexico
together constitute
73% of the medical
devices and
equipment exports
from key emerging
economies
Source:
(1) Trade by Commodity Statistics 2001-2010, International Trade Centre.

The major share of medical device and equipment exports from
China however are low value consumables
21
3,294
1,424
968
950
590
340
98
-
1,000
2,000
3,000
4,000
5,000
6,000
7,000
8,000
9,000
2010
$ M
illi
on
Exports of Medical Devices and Equipment from China by Category
Nearly 50% of China’s
exports are consumables
While foreign players are
increasingly establishing
facilities in China, the share
of high value technology
exports is expected to go
up in future
Source:
(1) Trade by Commodity Statistics 2001-2010, International Trade Centre.
7,664
Consumables
Therapeutic Equipment
Diagnostic Equipment
Dressings
Medical ImplantsFurnitureBreathing Appliances
Key Points

Manufacturing models are expected to change, particularly in
Brazil, China and India
22
0% 20% 40% 60% 80% 100%
SE Asia
Eastern Europe
Russia
Brazil
India
China
Which option best describes your current
manufacturing operations model in each
country/region?
Make in country (region) for sale in country
Make in country (region) for export
Make in country (region) for both local sale and export
No manufacturing presence in country (region)
Source:
(1) PRTM Medical Device Supply Chain Priorities in Emerging Markets Survey, April 2011.
Note:
(A) Please refer to Appendix for details.
0% 20% 40% 60% 80%
SE Asia
Eastern Europe
Russia
Brazil
India
China
If you are planning to change models, which
manufacturing models are you considering?
Make in country (region) for sale in country
Make in country (region) for export
Make in country (region) for both local sale and export
No manufacturing presence in country (region)

Baxter and GE Healthcare have the largest number of
manufacturing facilities in key emerging economies
23
Manufacturing Facilities By Market Type
7
25
37
7
10
17
6
28
34
3
18
23
2
11
14
8
109
127
Key Emerging Markets
Advanced Markets
Total Facilities
Number of Manufacturing Facilities
Baxter International GE Healthcare Fresenius Medical Medtronic CR Bard Others
252
201
33
Source:
(1) Websites and Reports of Top Medical Devices and
Equipment Manufacturers.
(2) BA Analysis.
Note:
(A) Data is for 18 out of the top 30 medical devices and equipment
manufacturers. Please refer to Appendix for details.
Ratio KEM/AM 0.28 0.70 0.21 0.17 0.18

Low cost of manufacturing and access to local markets are
the major drivers for manufacturing offshore
24
Driver DetailsPreferred Destination
Destination Trend
Upcoming/other
Destination
Proximity to
Home
Markets
Lower delivery costs
Reduced working capital
(inventory)
Shorter time to market
Proximity to sources of technical
support
Greater
Access to
Local Markets
Access to local healthcare
market in host country
Mexico
Lower
Manufacturing
Cost
Particularly in case of low-tech
product manufacturing
Mexico
Vietnam
India China
Government
Incentives
China
India
Brazil
Imp.
Government subsidies for local
manufacturing, e.g., “Made-in-
China” subsidies China
High Medium LowSource:
(1) BA Analysis.
Cost of manufacturing
in China has gone up
significantly in the past
few years due to rising
labor cost,
appreciation in Yuan,
increase in freight cost

Contents
Role Emerging Markets Play in the Global Medical Devices and Equipment Market
Local Market Opportunity
Cost Effective Manufacturing
Source of Innovation
Introduction to Emerging Economies
Case Study: GE Healthcare Model
Appendix
Key Takeaways
About Boston Analytics
Case Study: GE Healthcare India
Appendix
Key Takeaways
Case Study: Philips India

Engineering R&D (ER&D) spend in global medical device and
equipment industry has grown at a CAGR of 4% in recent years
26
Automotive, 19%
Pharma, 16%
Medical Devices, 2%
Aerospace, 8%
Consumer Electronics, 8%
Telecom, 8%
Semiconductor, 6%
Computer Systems, 4%
Chemicals, 4%
Technology, 4%
Industrial, 4%
Utilities, 3%Others, 14%
100% = $ 746 B
Engineering Spend by Sector (2004)
15
18
0
2
4
6
8
10
12
14
16
18
20
2004 2009
$ B
illi
on
Growth in Global Medical Devices and
Equipment ER&D (2004–2009)
Source:
(1) Nasscom-Booz Allen Hamilton Research on ER&D Offshoring.
CAGR
4%

Role of key emerging markets in the R&D strategies of key players
is also limited to few countries
27
Locations of R&D Facilities of Global Medical Devices Companies
75
21
7
R&D Facilities
Others
Key Emerging Economies
Advanced Economies
103 Facilities
India, 8
China, 5
Brazil, 2
Mexico, 1
Other, 5
100% = 21 Facilities
100% = 75 Facilities
India and China are the
R&D hubs among the
key emerging
economies
USA, 12
Canada, 6
France, 5
Germany, 5
Australia, 4
Others, 43
Source:
(1) Websites and Reports of Top Medical Devices and Equipment Manufacturers.
(2) BA Analysis.
Note:
(A) Data is for 14 (constituting 57% of the world market) out of the top 30
medical devices and equipment manufacturers. Please refer to
Appendix for details.
20%
73%
7%

Siemens has the greatest number of R&D investments in key
emerging markets
28
Share of Global Medical Devices and Equipment Players in R&D Facilities
6
20
28
3
9
13
3
6
11
3
2
5
6
38
46
Key Emerging Countries
Advanced Countries
Total
Number of countries with R&D Presence
Siemens Johnson & Johnson Medtronic GE Healthcare Others
103
75
21
Source:
(1) Websites and Reports of Top Medical Devices and Equipment Manufacturers.
(2) BA Analysis.
Note:
(A) Data is for 14 out of the top 30 medical devices and equipment
manufacturers. Please refer to Appendix for details.
Ratio KEM/AM 0.30 .33 0.5 1.5 NA

29
Gathering local insights is one of the primary reasons for setting
up R&D facilities in developing markets
Key Point Reason
Local
insights
Access to local knowledge, innovations, and perspectives
which could help foster new ideas for both the local and
global markets
Government
incentives
Tax savings and other incentives which encourage the
establishment of a local R&D center
Reasons Stated by Companies
Access to
research
universities
Opportunities to collaborate with local interested universities
and sophisticated suppliers of the region
Faster
response
time
Proximity to local market as well as manufacturing facilities
could help increase response time
Large
talent pool
Access to large highly skilled workforces in some countries
Lower cost
operations
Opportunity to reduce costs through lower cost operations
and lower cost labor force
Source:
(1) BA Research

Contents
Role Emerging Markets Play in the Global Medical Devices and Equipment Market
Local Market Opportunity
Cost Effective Manufacturing
Source of Innovation
Introduction to Emerging Economies
Case Study: GE Healthcare Model
Appendix
Key Takeaways
About Boston Analytics
Case Study: GE Healthcare India
Appendix
Key Takeaways
Case Study: Philips India

31
Philips’ major growth thrust and expansion in the last two decades
is an example of growing importance of emerging markets
Local Market
Opportunity
1
Cost Effective
Manufacturing
2
Source of Innovation
3
Source:
(1) BA Knowledge Repository.

Manufacturing
Innovation
Market
Opportunity
Philips started expanding its presence in Indian healthcare market
in 1990s while has been present in the market since 1930s
32
Type of Presence
Approach to
India Market
Timeline and
Events
1930–1990
Export Strategy
- Sell Global
Products
Philips Electrical
Co. Pvt. Ltd. is
established and
starts sales
operation in
1930
Philips maintains
limited presence
in the medical
equipment
market in India
Philips organizes its
businesses into three
core areas - consumer
electronics, healthcare
and lighting
Philips India makes
acquisitions of two Indian
medical devices
companies
Alpha X-Ray
Technologies -
(September 2008)
Meditronics Healthcare
- (November 2008)
The acquisitions are done
by Philips to access
critical technology to
develop value-segment
products
Localize and
Become Cost
Effective
2000–2010 2010–Future
Philips India plans to make
India a global production hub
for medical equipment
Company is investing to
upgrade the acquired
manufacturing facilities and
increase their capacity
Company opened a new
manufacturing site in Pune
focused on diagnostic and
interventional imaging
systems to serve smaller
hospitals with limited
budgets in India (and later
global markets who similar
characteristics
More acquisitions to further
strengthen value-segment
portfolio
Philips establishes
“Philips Software
Centre” (renamed
Philips Innovation
Campus) in India for
developing next
generation solutions in
health and well being
Innovate, Learn
and Adapt to
Local Condition
1990–2000
Source:
(1) Philips Investor Presentations.
(2) BA Research
Expand and
Supply Globally

Philips India Healthcare has shown rapid growth after
acquisition of Alpha X-Ray Technologies and Meditronics
33
54.2
66.0 69.2
85.0
119.7
0.0
20.0
40.0
60.0
80.0
100.0
120.0
140.0
2006 2007 2008 2009 2010
US
D M
illi
on
(*)
Growth in Philips’ India Healthcare Revenues Key Points
Key Drivers
Indian economy resilient to the
global financial meltdown
Stronger distribution channels and
product portfolio with the acquired
companies in Cardiovascular and
X-Ray “value” spaces
Population growth and unmet
healthcare needs
Source:
(1) BA Research
Note: (*) Figures converted from Rupee to USD at rate: 1USD = 51.76 Rupee
CAGR: 22%

Philips is in the process of fully integrating the acquired firms
34
Philips Healthcare Manufacturing Strategy In India
Established
Ownership
Objective
Product
Manufactured
Current Focus
Source:
(1) BA research
Alpha X-Ray
Technologies Pvt.
Ltd.
1989
100% acquired by
Philips India Ltd.
Cardiovascular and
X-ray imaging
solutions
Products mainly cater
to Indian firms, but
has designed its
products keeping
international market
in mind
Meditronics
Healthcare Pvt. Ltd.
1979
100% acquired by
Philips India Ltd.
Clinically-proven economy segment products
Diagnostic and
interventional X-ray
equipment
Meditronics sells
products in India and
internationally with
sales presence in 52
countries
Acquired September, 2008 November, 2008
4
3
1
Production Locations
Others
Key Emerging Economies
Advanced Economies
Production
Locations(A): 8
China, 1
India, 1
Brazil, 1
3 Locations
Philips Development
and Manufacturing
Center
2012
100% by Philips India
Ltd.
Manufacture value
segment products for
local and export
market
Cardiovascular and
X-ray equipments
Smaller Indian
hospitals at first, then
expand to other
emerging markets
and finally developed
nations for entry level
diagnostics upgrade
Not Applicable
Note:
(A) Countries.

Significant portion of research efforts at Philips Innovation
Centre in India is dedicated to healthcare sector
35
Philips Innovation Campus - PIC (Initially Philips Software Centre)
5
2
Research Facilities
Key Emerging Economies
Advanced Economies
Total 7
Facilities
Source:
(1) BA research
Established 1996
Total Strength
(2010)
1,198 scientists, researchers, and engineers
About 500 professionals dedicated to healthcare
Objective Works closely with product development teams to deliver end-to-end
solutions that meet the emerging needs in India
Key Areas of
Research
Cardiology: Early disease detection and developing connected
equipment
Perinatal care: Improvement in care of babies and mothers before,
during, and after delivery. Solutions for the Neonatal Intensive Care
Unit (NICU)
Oncology/women’s health: Solutions for cervical cancer, colposcopy
Future
Strategy /
Projects
Launch of “value” products in the area of pre-natal care
2010
Developments
In 2010, PIC received ISO 13485 certificate for hardware medical
components and software development (competence in healthcare
product development), and the ISO 20000 certification for global
support
China, 1
India, 1
2 Facilities

Contents
Role Emerging Markets Play in the Global Medical Devices and Equipment Market
Local Market Opportunity
Cost Effective Manufacturing
Source of Innovation
Introduction to Emerging Economies
Case Study: GE Healthcare Model
Appendix
Key Takeaways
About Boston Analytics
Case Study: GE Healthcare India
Appendix
Key Takeaways
Case Study: Philips India

37
GE Healthcare is an example of a firm who has embraced all three
opportunities which India represents
Local Market
Opportunity
1
Cost Effective
Manufacturing
2
Source of Innovation
3
Source:
(1) BA Knowledge Repository.

GE Healthcare’s presence in India has evolved overtime
from an opportunistic player to a committed partner
38
Type of Presence
Market
Opportunity
Manufacturing
Innovation
1902–1960s
No Presence
Approach to
India Market
Timeline and
Events
GE Worldwide
in India
No presence in
Healthcare
1960s–1990
Export
Strategy -
Sell Global
Product
Starts
exporting
equipment to
India
Focus on
high-end
premium
products
(developed for
advanced
economies)
Low
penetration
due to lack of
affordability
Open research
centre in India
Starts
developing and
manufacturing
products suited
to local needs
in India
India is made a
separate
geographical
division (A)
Focus on Localization &
Reverse Innovation
2000–2010 Future
Develop
products in
countries such
as India and
China and
distribute them
globally
Come out with
an India
product in
each of
product
categories
over the next 3
years
Start JV with
WIPRO to
distribute
localized
products
Failing to do
so cost
effectively,
starts
focusing on
making
products for
world market
Emergent Local to Global
Strategy. Learn and Adapt
1990–1995
Start JV with
BEL to
develop non-
critical parts
Gradually
starts
procuring
high-end parts
previously
developed in
US
1995–2000
Source:
(1) GE Investor Presentations.
(2) Billions of Entrepreneurs, Tarun Khanna.
To-date, GE has
developed 14
products in India for
India
Note:
(A) Geographic regions include: US, Europe, Latin
America, India, China, Asia-Pacific, ME and Africa

GE Healthcare’s revenue in India has grown by double digits
over the last 10 years and is expected to reach $ 1B in 2015
39
80
180
400
1,000
-
200
400
600
800
1,000
1,200
2000 2006 2011 2015
$ M
illi
on
Growth in GE Healthcare India Revenues
14% 17% 26%
% figure refers to CAGR
Key Points
Key Drivers
Strong economy and increasing
spend on healthcare
Growth of Public-Private
partnership opportunities in India
Population growth and unmet
healthcare needs
Positioning of GE Healthcare
Value product strategy
Localization
In-house financing solutions
Source:
(1) GE Investor Presentations.
CAGR

Currently, GE Healthcare has three plants in India developing
products both for local market and exports
40
GE Healthcare Manufacturing Strategy In India
Established
Wipro GE
HealthcareGE BE Pvt Ltd
Datex Ohmeda
India
1991 1997 2003
Ownership JV JV GE Healthcare
Objective
Manufacture
products that meet
Indian price points
Produce
components for
export to other
countries
Become leader in
anesthesia
machines
10
9
Production Facilities
Key Emerging Economies
Advanced Economies
Total 19
Facilities
China, 5
India, 3
Brazil, 1
9
Facilities
Product
Manufactured
Ultrasound
equipment,
Cardiology products
X-ray tubes, CT
systems, HV tanks
and detector
modules
Anesthesia
machines, Patient
monitoring systems
Current Focus
Manufactures high
end equipment for
India and ROW
Manufactures
medium to low end
equipment for India
and ROW
NA
Source:
(1) http://www.gehealthcare.com/company/pressroom/releases/pr_release_10322.html.
(2) http://www.expresshealthcare.in/201004/market11.shtml.
1 2 3

GE Healthcare is developing products both for local and
international market in its India based innovation centre
41
John F. Welch Technology Centre, Bangalore
2
3
Production Facilities
Key Emerging Economies
Advanced Economies
Total 5
Facilities
China, 1
India, 1
Brazil, 1
3 Facilities
The Healthcare Global Technology Operations Centre
Established Year 2000
Total Strength 4,000 scientists, researchers, and engineers
Objective
Develop value products relevant to Indian healthcare workers and
institutions
To establish a research arm in South Asia
Key Areas of
Research
Molecular imaging and diagnostics, capacitive micro-machined
ultrasound transducers (cMUTs), volume CT, next generation MRI
(massively parallel MR, 7 Tesla Imaging Systems), advanced
navigation technologies for interventional X-ray applications, X-ray,
time of flight positron emission tomography, and computational
biology & biostatistics
Current
Strategy
Exploit opportunities in emerging markets such as India
Pioneer the “value segments” in advanced economies
Actively pursue reverse innovation i.e. developing products in
emerging countries and distributing them globally
Source:
(1) http://www.geostrategypartners.com/GE%20Heathcare%20BOP%20Article.pdf.
(2) http://pharmabiz.com/PrintArticle.aspx?aid=70768&sid=1
GE spends an average of $50
million every year on R&D for
healthcare solutions in India
Innovation is focused on cost,
quality and accessibility

GE Healthcare has developed several innovative products in India
for both local and international markets
42
Made in India for India
Market
Made in India for India
and Global Market
Made in India for
Global Market
$ 500 (compared to imported
ECGs at $ 2,500)Price
Target Market
Year of Launch
$ 800 (compared to imported
ECGs at $ 2,500)
NA
Rural India where 75% of
population resides and does not
have access to health clinics or
electricity
Rural population in emerging
markets who cannot afford
expensive health care
Small clinics and hospitals in US
Created new applications for
accident sites and operation
theaters
2009 2008 2009
Designed to meet local
conditions. Battery operated,
weigh less than 1 KG and runs
even in hot and dusty conditions
Designed in India for India, but
being exported to China as well
over 100 additional countries. Is
easy to use and is battery
operated
An improved version of MAC 400.
Developed in India in 2007, but
eventually manufactured in China
MAC i MAC 400 MAC 800
Localization Reverse InnovationStrategy
Product
Requires minimal
training; analysis costs
less than $.20 per unit,
can be operated and
maintained using local
supply chain
Source:
(1) http://pharmabiz.com/PrintArticle.aspx?aid=70768&sid=1

GE Healthcare has developed several innovative products in India
both for both local and international markets (Contd.)
43
Made in India for India
and Other Markets
Made in India for
South Asian Markets
$ 1,000 (compared to $ 10,000 for
similar imported equipment)Price
Target Market
Year of Launch
$ 1,250 (compared to $ 3,000 for similar
imported equipment)
The product was mainly targeted for Tier
I Hospitals and clinics in India and other
countries
90-95% of the X-ray systems used in India
are analog units. TEJAS is a revolutionary
product to mark the entry of digital X-ray
system in India
Late 1990s 2008
Product
A portable and compact ultrasound
imaging system
A digital X-ray system
Reverse Innovation
TEJAS DR-FLOGIQ 100
Strategy
2013, GE will
release a CT
system for
40% of the
cost

Contents
Role Emerging Markets Play in the Global Medical Devices and Equipment Market
Local Market Opportunity
Cost Effective Manufacturing
Source of Innovation
Introduction to Emerging Economies
Case Study: GE Healthcare Model
Appendix
Key Takeaways
About Boston Analytics
Case Study: GE Healthcare India
Appendix
Key Takeaways
Case Study: Philips India

Key Takeaways
45
Emerging markets typically represent three opportunities for medical device and equipment
manufacturers:
1. Local Market Opportunity:
Emerging markets represent a relatively small, but rapidly growing market opportunity
driven by three factors unlikely to change, i.e., a growing patient population, increase
investment in healthcare infrastructure and increased healthcare insurance penetration
2. Cost Effective Manufacturing:
While China and Mexico have historically been the main centers of manufacturing, India
and Brazil are increasingly becoming cited as places for investment. Local manufacturing
cannot only help reduce costs, but also provide greater access to local markets
3. Source of Innovation:
Manufacturers have begun to view emerging markets as a source of innovative new
product ideas that are not only better suited to local markets, but could potentially serve
the global market as well
GE Healthcare’s strategy in India is an inspiring story to watch as it commits to making India one of its
primary focal areas for growth and pursues each of the above three opportunities simultaneously via a
coordinated strategy

Contents
Role Emerging Markets Play in the Global Medical Devices and Equipment Market
Local Market Opportunity
Cost Effective Manufacturing
Source of Innovation
Introduction to Emerging Economies
Case Study: GE Healthcare Model
Appendix
Key Takeaways
About Boston Analytics
Case Study: GE Healthcare India
Appendix
Key Takeaways
Case Study: Philips India

Manufacturing facilities of top medical devices and equipment
manufacturers
47
Company Revenues ($ B)Share in World
Market
Manufacturing Facilities
Advanced Economies
Key Emerging
EconomiesOthers Total
3M Healthcare 4.3 1.7% 3 0 0 3
Abbott Laboratories 8.4 3.4% 17 1 18
Alcon 3 1.2% 2 0 0 2
B. Braun 5.8 2.4% 1 0 0 1
Baxter International 12.6 5.1% 25 7 5 37
Biomet 2.5 1.0% 1 1 0 2
Boston Scientific 8.2 3.3% 6 2 8
Covidien 7.8 3.2% 1 1
CR Bard 2.5 1.0% 11 2 1 14
Dentsply International 2.2 0.9% 24 1 2 27
Fresenius Medical 2.9 1.2% 28 6 34
GE Healthcare 16 6.5% 10 7 17
Hospira 3.9 1.6% 12 1 2 15
Medtronic 14.6 5.9% 18 3 2 23
St Jude Medical 4.7 1.9% 9 1 1 11
Stryker 6.7 2.7% 19 1 1 21
Varian 2.2 0.9% 4 1 0 5
Zimmer 4.1 1.7% 10 2 1 13
Total 112.4 45.7% 201 33 18 252
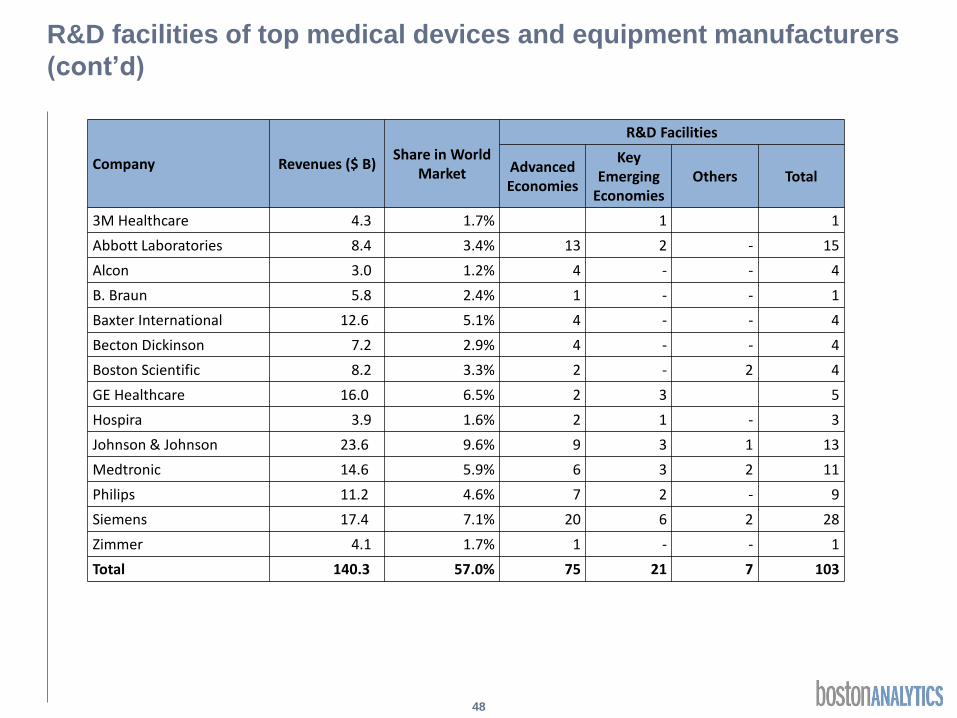
R&D facilities of top medical devices and equipment manufacturers
(cont’d)
48
Company Revenues ($ B)Share in World
Market
R&D Facilities
Advanced Economies
Key Emerging
EconomiesOthers Total
3M Healthcare 4.3 1.7% 1 1
Abbott Laboratories 8.4 3.4% 13 2 - 15
Alcon 3.0 1.2% 4 - - 4
B. Braun 5.8 2.4% 1 - - 1
Baxter International 12.6 5.1% 4 - - 4
Becton Dickinson 7.2 2.9% 4 - - 4
Boston Scientific 8.2 3.3% 2 - 2 4
GE Healthcare 16.0 6.5% 2 3 5
Hospira 3.9 1.6% 2 1 - 3
Johnson & Johnson 23.6 9.6% 9 3 1 13
Medtronic 14.6 5.9% 6 3 2 11
Philips 11.2 4.6% 7 2 - 9
Siemens 17.4 7.1% 20 6 2 28
Zimmer 4.1 1.7% 1 - - 1
Total 140.3 57.0% 75 21 7 103

PRTM Medical Devices Survey
49
Particular Details
Organizer Medical Device Supply Chain Council, an informal network of senior industry executives from
leading medical devices and equipment manufacturers
Survey Agency PRTM, a leading global consulting firm
Survey
Respondents
Supply chain and operations executives from leading medical devices and equipment
manufacturers

For more information contact:
Name: Kimberlee Luce
Title: Senior Vice President
E-mail: [email protected]
Website: www.bostonanalytics.com