Www roku com support- Call Roku Customer Service Toll Free (855)856-2653
UNITED STATESSECURITIES AND EXCHANGE COMMISSION
Washington, D.C. 20549
Form 8-K
CURRENT REPORTPursuant to Section 13 or 15(d) of the Securities Exchange Act of 1934
Date of Report (Date of earliest event reported): November 3, 2021
ROKU, INC.(Exact name of Registrant as Specified in Its Charter)
Delaware 001-38211 26-2087865(State or Other Jurisdiction
of Incorporation) (Commission File Number)
(IRS Employer
Identification No.)
1155 Coleman AveSan Jose, California
95110
(Address of Principal Executive Offices) (Zip Code)
(408) 556-9040(Registrant’s Telephone Number, Including Area Code)
Not Applicable(Former Name or Former Address, if Changed Since Last Report)
Check the appropriate box below if the Form 8-K filing is intended to simultaneously satisfy the filing obligation of the registrant under any of the followingprovisions (see General Instructions A.2. below):
☐ Written communications pursuant to Rule 425 under the Securities Act (17 CFR 230.425)
☐ Soliciting material pursuant to Rule 14a-12 under the Exchange Act (17 CFR 240.14a-12)
☐ Pre-commencement communications pursuant to Rule 14d-2(b) under the Exchange Act (17 CFR 240.14d-2(b))
☐ Pre-commencement communications pursuant to Rule 13e-4(c) under the Exchange Act (17 CFR 240.13e-4(c))
Securities registered pursuant to Section 12(b) of the Act:
Title of Each Class:
Trading Symbol(s): Name of Exchange on Which Registered:
Class A Common Stock, $0.0001 par value “ROKU” The Nasdaq Global Select Market
Indicate by check mark whether the registrant is an emerging growth company as defined in Rule 405 of the Securities Act of 1933 (§230.405 of this chapter) orRule 12b-2 of the Securities Exchange Act of 1934 (§240.12b-2 of this chapter).
Emerging growth company ☐
If an emerging growth company, indicate by check mark if the registrant has elected not to use the extended transition period for complying with any new orrevised financial accounting standards provided pursuant to Section 13(a) of the Exchange Act. ☐
Item 2.02 Results of Operations and Financial Condition.
On November 3, 2021, Roku, Inc. (the “Company”) announced its financial results for the quarter ended September 30, 2021. The Company’s ShareholderLetter, which is attached hereto as Exhibit 99.1, is incorporated herein by reference.
The information in this report shall not be treated as “filed” for purposes of Section 18 of the Securities Exchange Act of 1934, nor shall it be deemedincorporated by reference into any registration statement or other document pursuant to the Securities Act of 1933 or the Securities Exchange Act of 1934, exceptas expressly stated by specific reference in such filing.
Item 9.01 Financial Statements and Exhibits.
(d) Exhibits. ExhibitNumber
Description
99.1* Shareholder Letter dated November 3, 2021
104 Cover Page Interactive Data File (embedded within the Inline XBRL document)
* This exhibit is intended to be furnished and shall not be deemed “filed” for purposes of the Securities and Exchange Act of 1934.

SIGNATURE
Pursuant to the requirements of the Securities Exchange Act of 1934, the Registrant has duly caused this report to be signed on its behalf by the undersignedhereunto duly authorized. Roku, Inc. Dated: November 3, 2021 By: /s/ Steve Louden Steve Louden Chief Financial Officer
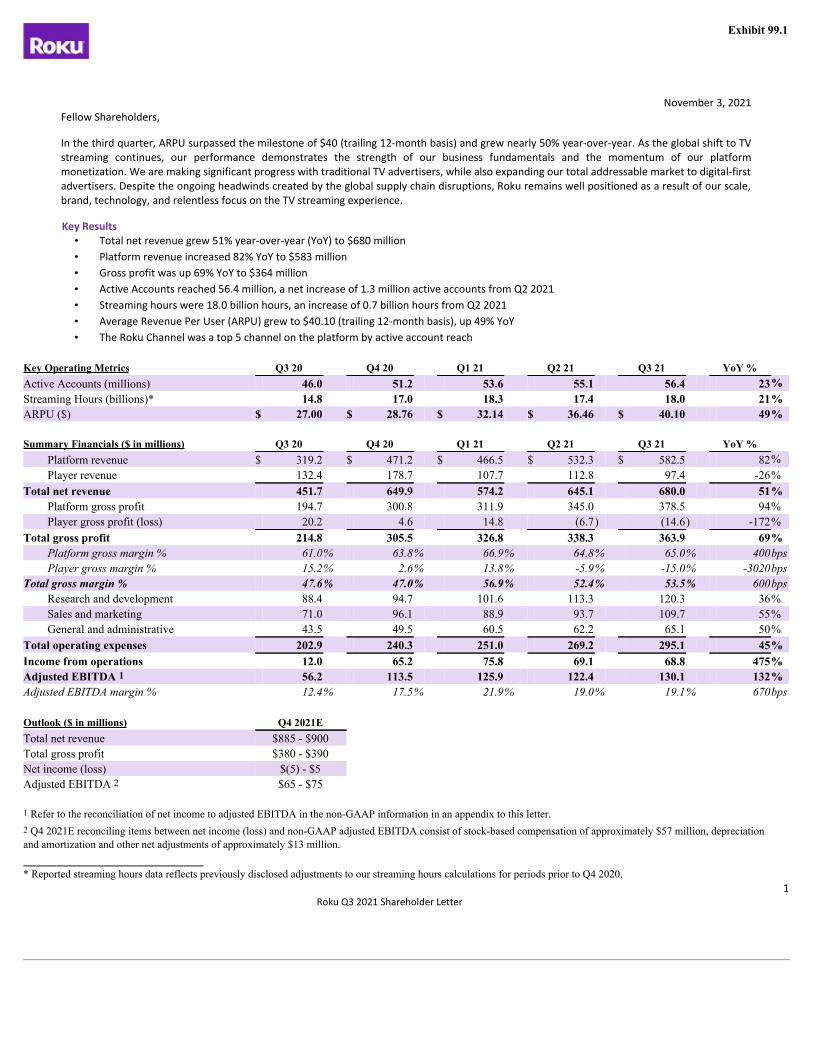
Exhibit 99.1
November 3, 2021Fellow Shareholders,
In the third quarter, ARPU surpassed the milestone of $40 (trailing 12-month basis) and grew nearly 50% year-over-year. As the global shift to TVstreaming continues, our performance demonstrates the strength of our business fundamentals and the momentum of our platformmonetization. We are making significant progress with traditional TV advertisers, while also expanding our total addressable market to digital-firstadvertisers. Despite the ongoing headwinds created by the global supply chain disruptions, Roku remains well positioned as a result of our scale,brand, technology, and relentless focus on the TV streaming experience.
Key Results • Total net revenue grew 51% year-over-year (YoY) to $680 million • Platform revenue increased 82% YoY to $583 million • Gross profit was up 69% YoY to $364 million • Active Accounts reached 56.4 million, a net increase of 1.3 million active accounts from Q2 2021 • Streaming hours were 18.0 billion hours, an increase of 0.7 billion hours from Q2 2021 • Average Revenue Per User (ARPU) grew to $40.10 (trailing 12-month basis), up 49% YoY • The Roku Channel was a top 5 channel on the platform by active account reach
Key Operating Metrics Q3 20 Q4 20 Q1 21 Q2 21 Q3 21 YoY % Active Accounts (millions) 46.0 51.2 53.6 55.1 56.4 23%Streaming Hours (billions)* 14.8 17.0 18.3 17.4 18.0 21%ARPU ($) $ 27.00 $ 28.76 $ 32.14 $ 36.46 $ 40.10 49% Summary Financials ($ in millions) Q3 20 Q4 20 Q1 21 Q2 21 Q3 21 YoY %
Platform revenue $ 319.2 $ 471.2 $ 466.5 $ 532.3 $ 582.5 82%Player revenue 132.4 178.7 107.7 112.8 97.4 -26%
Total net revenue 451.7 649.9 574.2 645.1 680.0 51%Platform gross profit 194.7 300.8 311.9 345.0 378.5 94%Player gross profit (loss) 20.2 4.6 14.8 (6.7) (14.6) -172%
Total gross profit 214.8 305.5 326.8 338.3 363.9 69%Platform gross margin % 61.0% 63.8% 66.9% 64.8% 65.0% 400bpsPlayer gross margin % 15.2% 2.6% 13.8% -5.9% -15.0% -3020bps
Total gross margin % 47.6% 47.0% 56.9% 52.4% 53.5% 600bpsResearch and development 88.4 94.7 101.6 113.3 120.3 36%Sales and marketing 71.0 96.1 88.9 93.7 109.7 55%General and administrative 43.5 49.5 60.5 62.2 65.1 50%
Total operating expenses 202.9 240.3 251.0 269.2 295.1 45%Income from operations 12.0 65.2 75.8 69.1 68.8 475%Adjusted EBITDA 1 56.2 113.5 125.9 122.4 130.1 132%Adjusted EBITDA margin % 12.4% 17.5% 21.9% 19.0% 19.1% 670bps Outlook ($ in millions) Q4 2021E Total net revenue $885 - $900 Total gross profit $380 - $390 Net income (loss) $(5) - $5 Adjusted EBITDA 2 $65 - $75 1 Refer to the reconciliation of net income to adjusted EBITDA in the non-GAAP information in an appendix to this letter. 2 Q4 2021E reconciling items between net income (loss) and non-GAAP adjusted EBITDA consist of stock-based compensation of approximately $57 million, depreciationand amortization and other net adjustments of approximately $13 million.
___________________________* Reported streaming hours data reflects previously disclosed adjustments to our streaming hours calculations for periods prior to Q4 2020.
Roku Q3 2021 Shareholder Letter1
Account Growth
We grew active accounts by 1.3 million, ending the third quarter with 56.4 million, which was driven by sales of our streaming players and RokuTV™ models. We believe that the slowdown in active account growth rate this quarter was, in large part, attributable to global supply chaindisruptions that have impacted the U.S. TV market. Specifically, overall U.S. TV sales in Q3 fell below pre-COVID 2019 levels. Some of our Roku TVOEM partners were hit particularly hard with inventory challenges, which negatively impacted their unit sales figures and market share in Q3.
While Roku player unit sales were down year-over-year in Q3 2021 (following the extraordinary demand spike we saw in Q3 2020), unit saleswere above pre-COVID Q3 2019 levels. Our player unit costs were impacted by the supply chain disruptions. However, we chose to insulate ourconsumers from these increased costs to prioritize account growth, resulting in Player gross margin decreasing to -15%. We view this Player grossmargin erosion as temporary, and we continue to take action to maximize our manufacturing flexibility, including active sourcing strategies andadapting our software and re-designing for more readily available chips and components.
Roku’s streaming hours in Q3 totaled 18.0 billion, a 21% increase year-over-year. Streaming hours per active account per day were 3.5 hours,consistent with Q2 2021 and slightly higher than Q3 2019. According to Nielsen, we continue to outperform the viewing hour growth rates ofboth traditional TV and other TV streaming platforms.
Product Launches
We continue to enhance the appeal of our devices with hardware innovation and in Q3 we launched the all-new Roku® Streaming Stick® 4K andthe Roku Streaming Stick 4K+, which includes the Roku Voice Remote Pro, Dolby Vision® and HDR10+. The Roku Streaming Stick 4K and 4K+received Editor’s Choice awards from four different media outlets including Tom’s Guide, TechHive, Reviewed.com and Android Authority, whileearlier this year, the Roku Express 4K+ maintained our 12-year CNET Editors’ Choice award streak. In October, we launched a new brandcampaign which supports these new products as we enter the holiday season.
We also announced Roku OS 10.5, our updated operating system that powers our streaming devices and our partners’ Roku TV models. Roku OS10.5 delivers multiple new features, including one-click access to The Roku Channel’s Live TV guide directly from the home screen, an expandednumber of channels that support voice commands, new surround sound configurations, private listening made even better for wirelessheadphones, and new “Save List” capabilities in the Roku mobile app.
We continue to expand internationally, recently launching streaming players and the Roku platform in Germany, now with more than 2,000channels including apps from top local and global partners. We announced a brand-new lineup of SEMP TCL Roku TV models for Brazil and willbring TCL Roku TV models to the country this year. Building on this momentum, we will expand our TV footprint in Latin America to Chile andPeru with Roku TV models later this year.
Roku Q3 2021 Shareholder Letter2
Platform Monetization
In Q3 — even with tough year-over-year comparisons — we grew Platform revenue 82% year-over-year to $583 million, reflecting significantcontributions from both content distribution and advertising activities. Despite some macro challenges that impacted advertising partners incertain industries, ARPU surpassed the milestone of $40 (trailing 12-month basis), an increase of nearly 50% year-over-year.
Content Distribution
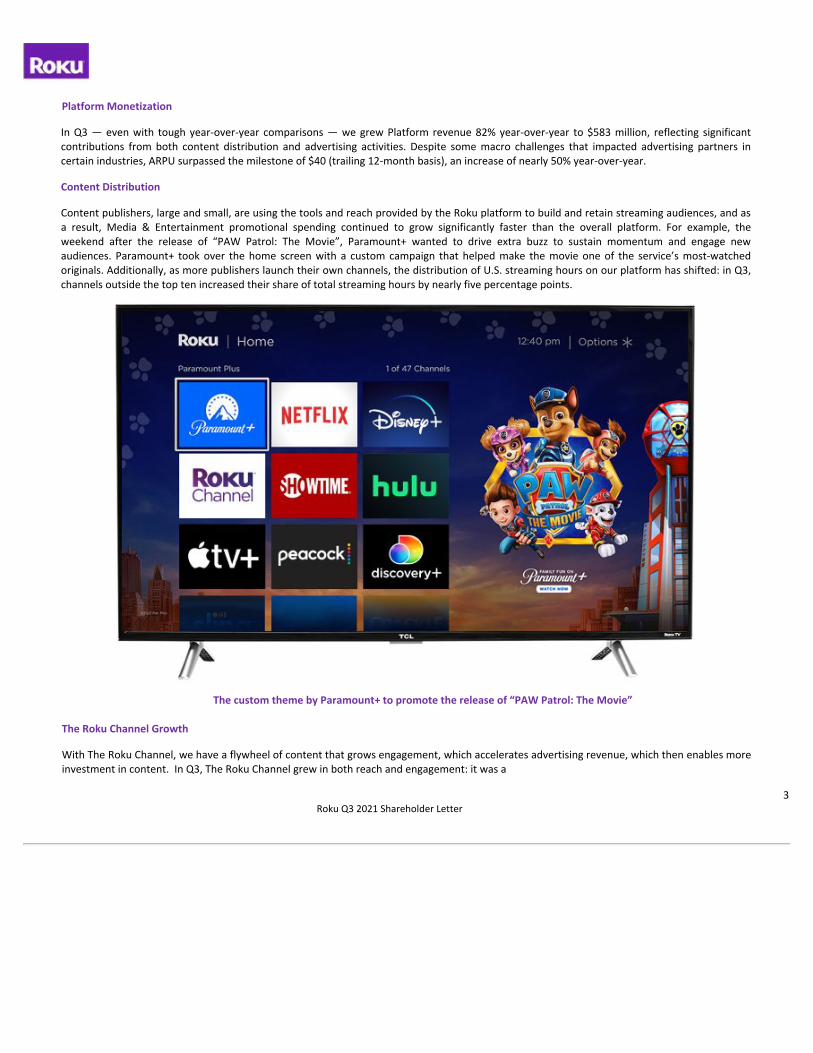
Content publishers, large and small, are using the tools and reach provided by the Roku platform to build and retain streaming audiences, and asa result, Media & Entertainment promotional spending continued to grow significantly faster than the overall platform. For example, theweekend after the release of “PAW Patrol: The Movie”, Paramount+ wanted to drive extra buzz to sustain momentum and engage newaudiences. Paramount+ took over the home screen with a custom campaign that helped make the movie one of the service’s most-watchedoriginals. Additionally, as more publishers launch their own channels, the distribution of U.S. streaming hours on our platform has shifted: in Q3,channels outside the top ten increased their share of total streaming hours by nearly five percentage points.
The custom theme by Paramount+ to promote the release of “PAW Patrol: The Movie” The Roku Channel Growth
With The Roku Channel, we have a flywheel of content that grows engagement, which accelerates advertising revenue, which then enables moreinvestment in content. In Q3, The Roku Channel grew in both reach and engagement: it was a
Roku Q3 2021 Shareholder Letter3
top five channel on the platform by active account reach, and streaming hours more than doubled year-over-year. This growth was fueled in partby the continued expansion of our content strategy, including:
•Licensed content from more than 200 content partners
•Added 17 linear channels, expanding our linear lineup to morethan 200 channels
•Grew our popular Kids & Family programming content
•Announced our first Roku Original feature-length film, ‘Zoey’s
Extraordinary Christmas'
•Premiered 23 new Roku Original titles
We acquired This Old House in March, and it is a good demonstration of The Roku Channel flywheel. By combining our first-party viewer insightswith our recommendation capabilities, we grew streaming hours of This Old House on The Roku Channel by nearly 50% since our acquisition.With significantly increased engagement and subsequent advertising revenue to reinvest, we added 13 new episodes to the upcoming seasons ofboth This Old House and Ask This Old House and launched two new This Old House streaming channels.
With The Roku Channel, we are able to provide advertisers with creative new ways to go beyond the traditional 30-second ad spot and reachconsumers who spend time primarily in ad-free, subscription environments. “Roku Recommends” is a 15-minute weekly entertainment programthat recommends films and TV shows to viewers. “Roku Recommends” has been sponsored by brands such as Walmart, and the show has been atop-10 video-on-demand television series on The Roku Channel since its debut in June.
Ad Business Strength
Since day one, we’ve been building Roku not just for TV streaming but also for TV streaming advertising. Roku is a primary beneficiary asadvertisers follow viewers who are moving to TV streaming from traditional pay TV. According to Nielsen, in Q3 ratings for adults 18-49 ontraditional TV fell 19% year-over-year, creating supply shortages and increasing ad prices. As a result, the top 10 cable TV advertisers doubledspend on the Roku platform year-over-year. Total monetized video ad impressions nearly doubled year-over-year, driven by strong clientacquisition and retention.
Building on this success with traditional TV advertisers, we are also expanding our total addressable market (TAM) to direct-to-consumer andsmall/medium businesses (SMBs) that currently spend primarily on digital and social media platforms. Our scale and first-party data aredifferentiators with these advertisers. OneView®, our ad buying platform built for TV streaming, enables cross-screen targeting, measurement,and optimization of campaigns on TV streaming, desktop, and mobile. For example, Lovevery, a DTC brand, used OneView to reach potentialpurchasers of products for infants and toddlers. The cross-screen campaign drove a 72% lift in website visits, 105% lift in subscriptions, and 170%lift in purchases. Spending by smaller advertisers (those outside the Ad Age top 200) continued to significantly outpace the overall growth inspending on Roku, and once again TV streaming impressions delivered through OneView more than doubled year-over-year in Q3.
We are also building new advertiser products for SMBs to access the OneView platform. In Q3, we announced a new tool that will allow Shopifymerchants to easily build, buy, and measure TV streaming advertising campaigns on the Roku platform. Interest in the capability has been strong,with our beta partnership goals filled in just one day.
Roku Q3 2021 Shareholder Letter4
Outlook
Looking ahead, our business fundamentals remain strong but we are mindful that the challenges created by the global supply chain disruptionswill likely continue into 2022. These headwinds may have a broad impact on the holiday season in terms of consumer confidence, product pricingand availability, and advertising spend levels.
While the pandemic has had different impacts on different parts of our business, the secular shift to streaming remains intact. Our Q4 outlook isfor strong growth with total net revenue of $893 million at the midpoint (up 37% year-over-year), and total gross profit of $385 million at themidpoint (up 26% year-over-year).
We continue to see a large opportunity ahead of us and are investing in headcount, product development, and sales & marketing to drive futuregrowth. We anticipate these investments will increase operating expenses on a sequential basis and as a result, we expect Q4 adjusted EBITDA tobe $70 million at the midpoint in Q4.
Conclusion
Roku was founded based on the belief that all TV and all TV advertising will be streamed. The global shift to TV streaming remains intact. Ourplatform monetization was strong, even with the outperformance in the prior Q3, and we further expanded our advertising TAM with digitalmarketers and SMBs. We have a relentless focus on building the best TV streaming platform that benefits audiences, content publishers, andadvertisers, and we remain well positioned for the long term.
Thank you for your support and Happy Streaming™!
Anthony Wood, Founder and CEO; and Steve Louden, CFO
Roku Q3 2021 Shareholder Letter5
The Company will host a webcast of its conference call to discuss Q3 2021 results at 2 p.m. Pacific Time / 5 p.m. Eastern Time on November 3, 2021.Participants may access the live webcast in listen-only mode on the Roku investor relations website at roku.com/investor. An archived webcast of theconference call will also be available at roku.com/investor after the call.
About Roku, Inc.Roku pioneered streaming to the TV. We connect users to the streaming content they love, enable content publishers to build and monetize large audiences,and provide advertisers with unique capabilities to engage consumers. Roku streaming players and TV-related audio devices are available in the U.S. and inselect countries through direct retail sales and licensing arrangements with service operators. Roku TV™ models are available in the U.S. and in selectcountries through licensing arrangements with TV brands. Roku is headquartered in San Jose, Calif. U.S.A.
Roku, the Roku logo and other trade names, trademarks or service marks of Roku appearing in this shareholder letter are the property of Roku. Trade names,trademarks and service marks of other companies appearing in this shareholder letter are the property of their respective holders.
Investor RelationsConrad [email protected]
MediaKim Sampson
Use of Non-GAAP MeasuresIn addition to financial information prepared in accordance with generally accepted accounting principles in the United States (GAAP), this shareholder letterincludes certain non-GAAP financial measures. These non-GAAP measures include Adjusted EBITDA. In order for our investors to be better able to compareour current results with those of previous periods, we have included a reconciliation of GAAP to non-GAAP financial measures in the tables at the end of thisletter. The Adjusted EBITDA reconciliation adjusts the related GAAP financial measures to exclude other income (expense), net, stock-based compensationexpense, depreciation and amortization, and income tax (benefit)/expense where applicable. We believe these non-GAAP financial measures are useful as asupplement in evaluating our ongoing operational performance and enhancing an overall understanding of our past financial performance. However, thesenon-GAAP financial measures have limitations, and should not be considered in isolation or as a substitute for our GAAP financial information.
Forward-Looking StatementsThis shareholder letter contains “forward-looking” statements that are based on our beliefs and assumptions and on information currently available to us.Forward-looking statements include all statements that are not historical facts and can be identified by terms such as “anticipate,” “believe,” “continue,”“could,” “design,” “estimate,” “expect,” “may,” “seek,” “should,” “will,” “would” or similar expressions and the negatives of those terms. Forward-lookingstatements involve known and unknown risks, uncertainties and other factors that may cause our actual results, performance or achievements to bematerially different from any future results, performance or achievements expressed or implied by the forward-looking statements. Forward-lookingstatements represent our beliefs and assumptions only as of the date of this letter. These statements include those related to the continuing shift ofaudiences, content, and advertisers to TV streaming; the benefits of our technology and platform to our long-term growth; the resolution of global supplychain disruptions, tight component supply conditions and shipping constraints; actions taken to maximize manufacturing flexibility to minimize player costand gross margin erosion; our user experience; our ability to innovate, build and launch new products and services; our international expansion, includingRoku TV models into Chile and Peru; the performance, growth and monetization of, and content available on, The Roku Channel; advertisers moving theirbudgets to streaming; the expansion of our TAM to direct-to-consumer and SMBs that primarily advertise on digital and social media platforms; the benefitsand features of the OneView platform; our competitive advantages; the impact of the COVID-19 pandemic and varying rates of recovery around the world onour business and the industries we operate in; our financial outlook for the fourth quarter and full year 2021; our investments; and our overall businesstrajectory. Except as required by law, we assume no obligation to update these forward-looking statements publicly, or to update the reasons actual resultscould differ materially from those anticipated in the forward-looking statements, even if new information becomes available in the future. Furtherinformation on factors that could cause actual results to differ materially from the results anticipated by our forward-looking statements is included in thereports we have filed with the Securities and Exchange Commission, including our Annual Report on Form 10-K and our Quarterly Reports on Form 10-Q. Allinformation provided in this shareholder letter and in the attached tables is as of November 3, 2021, and we undertake no duty to update this informationunless required by law.
Roku Q3 2021 Shareholder Letter6
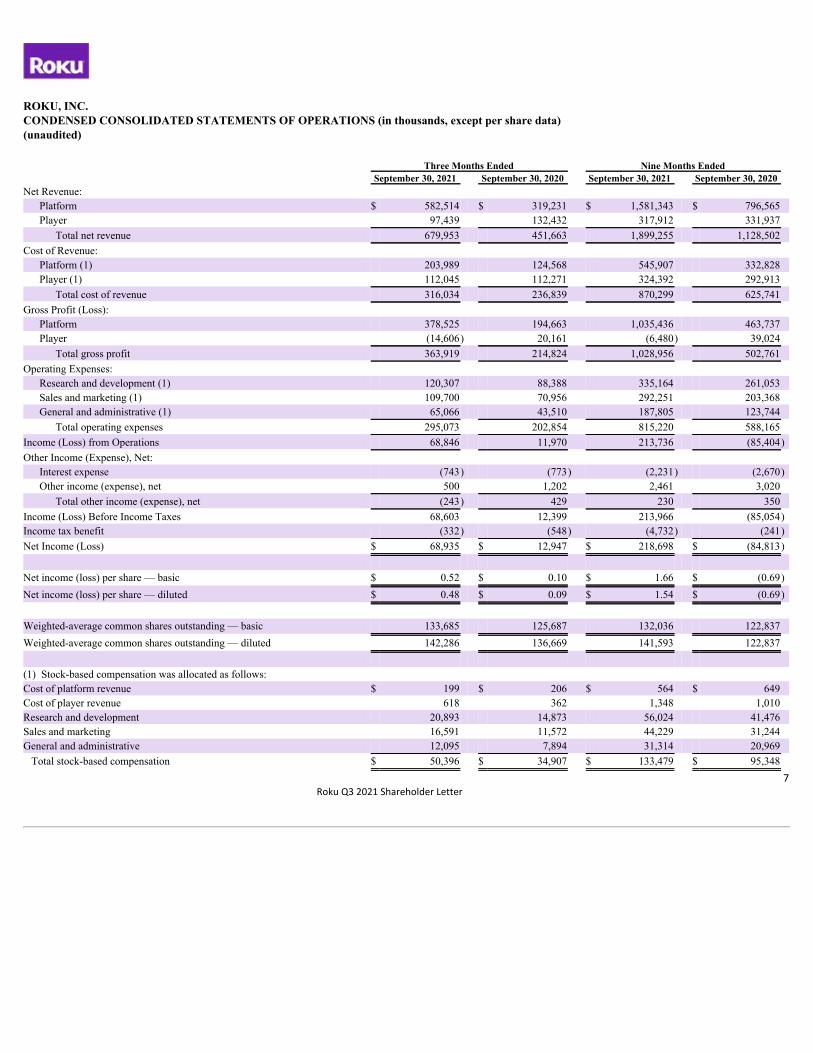
ROKU, INC.CONDENSED CONSOLIDATED STATEMENTS OF OPERATIONS (in thousands, except per share data)(unaudited)
Three Months Ended Nine Months Ended September 30, 2021 September 30, 2020 September 30, 2021 September 30, 2020
Net Revenue: Platform $ 582,514 $ 319,231 $ 1,581,343 $ 796,565 Player 97,439 132,432 317,912 331,937
Total net revenue 679,953 451,663 1,899,255 1,128,502 Cost of Revenue:
Platform (1) 203,989 124,568 545,907 332,828 Player (1) 112,045 112,271 324,392 292,913
Total cost of revenue 316,034 236,839 870,299 625,741 Gross Profit (Loss):
Platform 378,525 194,663 1,035,436 463,737 Player (14,606) 20,161 (6,480) 39,024
Total gross profit 363,919 214,824 1,028,956 502,761 Operating Expenses:
Research and development (1) 120,307 88,388 335,164 261,053 Sales and marketing (1) 109,700 70,956 292,251 203,368 General and administrative (1) 65,066 43,510 187,805 123,744
Total operating expenses 295,073 202,854 815,220 588,165 Income (Loss) from Operations 68,846 11,970 213,736 (85,404)Other Income (Expense), Net:
Interest expense (743) (773) (2,231) (2,670)Other income (expense), net 500 1,202 2,461 3,020
Total other income (expense), net (243) 429 230 350 Income (Loss) Before Income Taxes 68,603 12,399 213,966 (85,054)Income tax benefit (332) (548) (4,732) (241)Net Income (Loss) $ 68,935 $ 12,947 $ 218,698 $ (84,813) Net income (loss) per share — basic $ 0.52 $ 0.10 $ 1.66 $ (0.69)Net income (loss) per share — diluted $ 0.48 $ 0.09 $ 1.54 $ (0.69) Weighted-average common shares outstanding — basic 133,685 125,687 132,036 122,837 Weighted-average common shares outstanding — diluted 142,286 136,669 141,593 122,837 (1) Stock-based compensation was allocated as follows: Cost of platform revenue $ 199 $ 206 $ 564 $ 649 Cost of player revenue 618 362 1,348 1,010 Research and development 20,893 14,873 56,024 41,476 Sales and marketing 16,591 11,572 44,229 31,244 General and administrative 12,095 7,894 31,314 20,969 Total stock-based compensation $ 50,396 $ 34,907 $ 133,479 $ 95,348
Roku Q3 2021 Shareholder Letter7
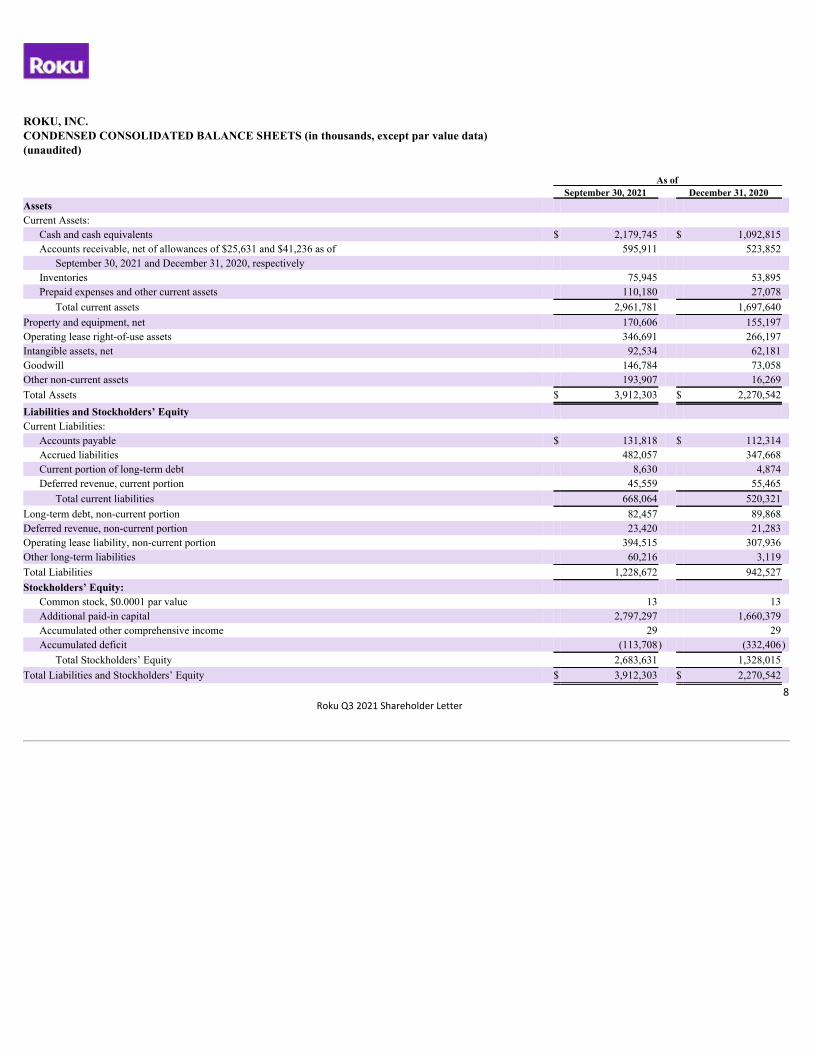
ROKU, INC.CONDENSED CONSOLIDATED BALANCE SHEETS (in thousands, except par value data)(unaudited)
As of September 30, 2021 December 31, 2020
Assets Current Assets:
Cash and cash equivalents $ 2,179,745 $ 1,092,815 Accounts receivable, net of allowances of $25,631 and $41,236 as of 595,911 523,852
September 30, 2021 and December 31, 2020, respectively Inventories 75,945 53,895 Prepaid expenses and other current assets 110,180 27,078
Total current assets 2,961,781 1,697,640 Property and equipment, net 170,606 155,197 Operating lease right-of-use assets 346,691 266,197 Intangible assets, net 92,534 62,181 Goodwill 146,784 73,058 Other non-current assets 193,907 16,269 Total Assets $ 3,912,303 $ 2,270,542 Liabilities and Stockholders’ Equity Current Liabilities:
Accounts payable $ 131,818 $ 112,314 Accrued liabilities 482,057 347,668 Current portion of long-term debt 8,630 4,874 Deferred revenue, current portion 45,559 55,465
Total current liabilities 668,064 520,321 Long-term debt, non-current portion 82,457 89,868 Deferred revenue, non-current portion 23,420 21,283 Operating lease liability, non-current portion 394,515 307,936 Other long-term liabilities 60,216 3,119 Total Liabilities 1,228,672 942,527 Stockholders’ Equity:
Common stock, $0.0001 par value 13 13 Additional paid-in capital 2,797,297 1,660,379 Accumulated other comprehensive income 29 29 Accumulated deficit (113,708) (332,406)
Total Stockholders’ Equity 2,683,631 1,328,015 Total Liabilities and Stockholders’ Equity $ 3,912,303 $ 2,270,542
Roku Q3 2021 Shareholder Letter8
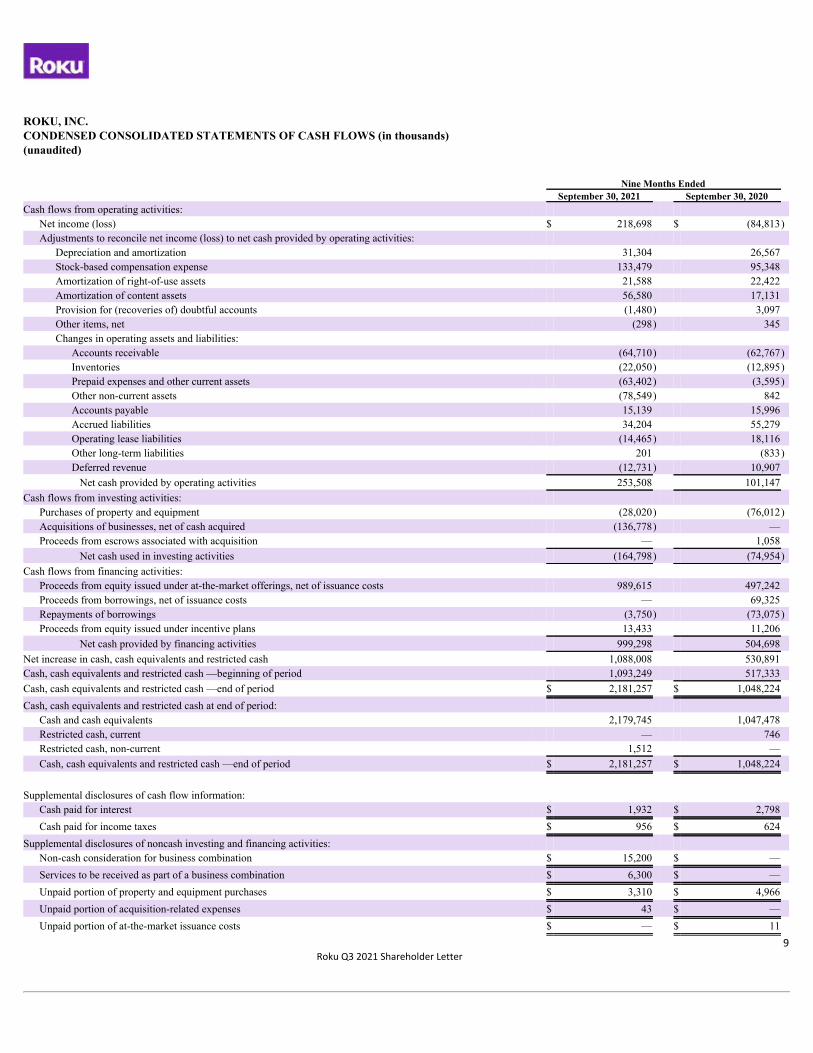
ROKU, INC.CONDENSED CONSOLIDATED STATEMENTS OF CASH FLOWS (in thousands)(unaudited)
Nine Months Ended September 30, 2021 September 30, 2020
Cash flows from operating activities: Net income (loss) $ 218,698 $ (84,813)Adjustments to reconcile net income (loss) to net cash provided by operating activities:
Depreciation and amortization 31,304 26,567 Stock-based compensation expense 133,479 95,348 Amortization of right-of-use assets 21,588 22,422 Amortization of content assets 56,580 17,131 Provision for (recoveries of) doubtful accounts (1,480) 3,097 Other items, net (298) 345 Changes in operating assets and liabilities:
Accounts receivable (64,710) (62,767)Inventories (22,050) (12,895)Prepaid expenses and other current assets (63,402) (3,595)Other non-current assets (78,549) 842 Accounts payable 15,139 15,996 Accrued liabilities 34,204 55,279 Operating lease liabilities (14,465) 18,116 Other long-term liabilities 201 (833)Deferred revenue (12,731) 10,907 Net cash provided by operating activities 253,508 101,147
Cash flows from investing activities: Purchases of property and equipment (28,020) (76,012)Acquisitions of businesses, net of cash acquired (136,778) — Proceeds from escrows associated with acquisition — 1,058
Net cash used in investing activities (164,798) (74,954)Cash flows from financing activities:
Proceeds from equity issued under at-the-market offerings, net of issuance costs 989,615 497,242 Proceeds from borrowings, net of issuance costs — 69,325 Repayments of borrowings (3,750) (73,075)Proceeds from equity issued under incentive plans 13,433 11,206
Net cash provided by financing activities 999,298 504,698 Net increase in cash, cash equivalents and restricted cash 1,088,008 530,891 Cash, cash equivalents and restricted cash —beginning of period 1,093,249 517,333 Cash, cash equivalents and restricted cash —end of period $ 2,181,257 $ 1,048,224 Cash, cash equivalents and restricted cash at end of period:
Cash and cash equivalents 2,179,745 1,047,478 Restricted cash, current — 746 Restricted cash, non-current 1,512 — Cash, cash equivalents and restricted cash —end of period $ 2,181,257 $ 1,048,224
Supplemental disclosures of cash flow information: Cash paid for interest $ 1,932 $ 2,798 Cash paid for income taxes $ 956 $ 624
Supplemental disclosures of noncash investing and financing activities: Non-cash consideration for business combination $ 15,200 $ — Services to be received as part of a business combination $ 6,300 $ — Unpaid portion of property and equipment purchases $ 3,310 $ 4,966 Unpaid portion of acquisition-related expenses $ 43 $ — Unpaid portion of at-the-market issuance costs $ — $ 11
Roku Q3 2021 Shareholder Letter9
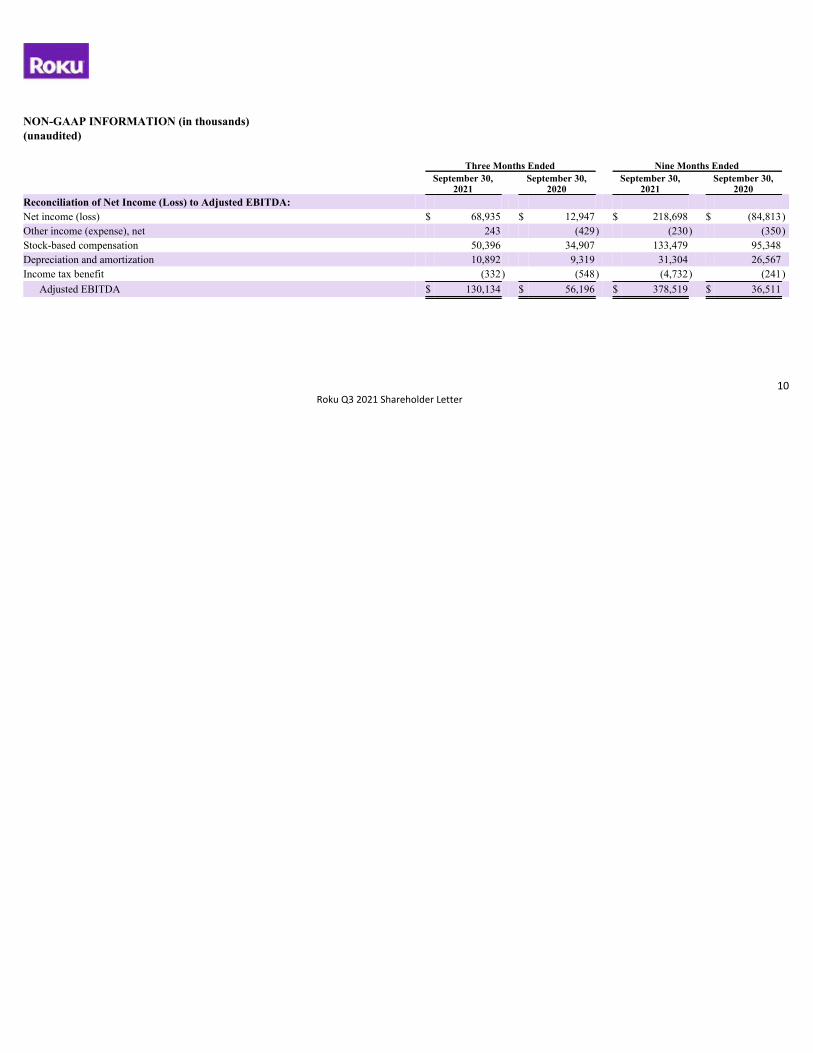
NON-GAAP INFORMATION (in thousands)(unaudited) Three Months Ended Nine Months Ended
September 30,
2021 September 30,
2020 September 30,
2021 September 30,
2020 Reconciliation of Net Income (Loss) to Adjusted EBITDA: Net income (loss) $ 68,935 $ 12,947 $ 218,698 $ (84,813)Other income (expense), net 243 (429) (230) (350)Stock-based compensation 50,396 34,907 133,479 95,348 Depreciation and amortization 10,892 9,319 31,304 26,567 Income tax benefit (332) (548) (4,732) (241)
Adjusted EBITDA $ 130,134 $ 56,196 $ 378,519 $ 36,511
Quarterly streaming hours published vs. revised streaming hours (billions) 0b 2b 4b 6b 8b 10b 12b 14b 2017 q1 2017 q2 2017 q3 2017 q4 2018 q1 2018 q2 2018 q3 2018 q4 2019 q1 2019 q2 2019 q3 2019 q4 2020 q1 published streaming hours revised streaming hours
Roku Q3 2021 Shareholder Letter10