Roger Falconer and Chris Binnie - Sustainable Severn Forum 2017
23
Tidal Energy Opportunities in the Bristol Channel and Severn Estuary Roger Falconer 1 and Chris Binnie 2 1 Hydro-environmental Research Centre, Cardiff University 2 Independent Water Consultant 1
-
Upload
sustainable-severn -
Category
Environment
-
view
142 -
download
1
Transcript of Roger Falconer and Chris Binnie - Sustainable Severn Forum 2017

Tidal Energy Opportunities in the
Bristol Channel and Severn Estuary
Roger Falconer1 and Chris Binnie2
1Hydro-environmental Research Centre, Cardiff University
2Independent Water Consultant
1

2
Key details:
• Completed in 1966
• 24 x 5.5m dia. bulb
turbines & 6 sluices
• Turbine trials ebb-
only (+ pumping)
• Generate 0.54TWh/y
• Energy cost €20/MWh
cheapest in EU
• No baseline studies
prior to construction
La Rance Tidal Barrage Scheme

3
Swansea Bay Lagoon - Current DesignKey details:
• Wall 9.7km long
• Area 11.6km2
• 16 x 7.3m diam bulb
turbines & 8 sluices
• Turbines: two-way +
pumping HW & LW
• Generate 0.54TWh/y
• Potential for large
wakes and eddies

4
Swansea Lagoon - Current Predictions
0
EBB
FLD
Turbining
0
LW
HW
Sluicing

5
Annapolis Barrage - Sluice Gate Wake
Wake from 2 Sluices and 1 x 20 MW turbine

LEGE ND
Order limits
X:\JO
BS
\3513_S
WA
NS
EA
\7C
AD
\DR
AW
ING
S\D
CO
P
LA
NS
\PL
AN
NIN
G
PLA
NS
\351
3_P
L_0
01_
MA
ST
ER
PL
AN
_K
EY
_P
LA
N.D
WG
Sources Ordnance Survey
This drawing may contain: Ordnance Survey material by permission of Ordnance Survey on behalf of the Controller of Her Majesty's Stationery Office © Crown Copyright 2013. All rights reserved. Reference number 0100031673 OS
Open data / © Natural England / © DEFRA / © DECC / © English Heritage. Contains Ordnance Survey data © Crown copyright and database right 2013 I Aerial Photography
REFER TO DRAWING NUMBER 3513/PL/002.3Plan 3of6
REFER TO DRAWING NUMBER 3513/PL/002.1Plan 1of6
REFER TO DRAWING NUMBER 3513/PL/002.4Plan 4of6
REFER TO DRAWING NUMBER 3513/PL/002.6Plan 6of6
REFER TO DRAWING NUMBER 3513/PL/002.2Plan 2of6
T: 01865 887050
No
rth
SCALE@A0 1:10,000
STATUS Planning
REV . DESCRIPTION APP. DA TE
DOC REF NO: 2.4.1
No dimensions are to be scaled from this drawing.
All dimensions are to be checked on site.
Area measurements for indicative purposes only.
© LDA Design Consulting LLP. Quality Assured to BS EN ISO 9001 : 2008
PR OJ EC T TI TLE
TIDAL LAGOON SWANSEA BAY PROJECT
D R A W I N G T I T L E
Masterplan Key Plan
DATE 06.02.2014 DRAWN JH
CHECKED LJ
APPROVED AK
ISSUED BY Oxford
DWG. NO 3513_PL_001
10.5
9.5
5.2
1.0
0.0
5.5
4.5
0.2
Highest Astronomical Tide (HAT)
Mean High Water Springs (MHWS)
Mean Sea Level (MSL)
-4.0 Mean Low Water Springs (MLWS)
-5.0 Lowest Astronomical Tide (LAT)
10.0
9.0
N/A
1.5
5.0
4.0
N/A
-3.5
Highest Astronomical Tide (HAT)
Mean High Water Springs (MHWS)
Mean Sea Level (MSL)
Mean Low Water Springs (MLWS)
Tidal bar - Outside of the lagoon (NTS)
0.5 -4.5 Lowest Astronomical Tide (LAT)
Tidal bar - Inside of the lagoon (NTS)
Chart
Datum
(m)
Ordnance
Datum
(m)
Chart
Datum
(m)
Ordnance
Datum
(m)
Turbine location: Option B
REFER TO DRAWING NUMBER 3513/PL/002.5Plan 5of6
Turbine location: Option A (refer to inset for option B)
Swansea Bay - Design Modification 1

7
Swansea Bay - Design Modification 1
Revert turbine/sluice location to Option B - submitted to DCO
Wake would be parallel to, and away from, dredged channel

8
Swansea Bay - Design Modification 2
Focusing turbines and sluice gates leads to high wake/jet effects
Flow through turbines emptying 2 Olympic swimming pools/sec
https://www.ice.org.uk/ICEDevelopmentWebPortal/media/.../6-Ioan-Jenkins.pdf

9
Wider distribution of turbines & sluices leads to weaker eddies
0
Original Modified
Swansea Bay - Design Modification 2
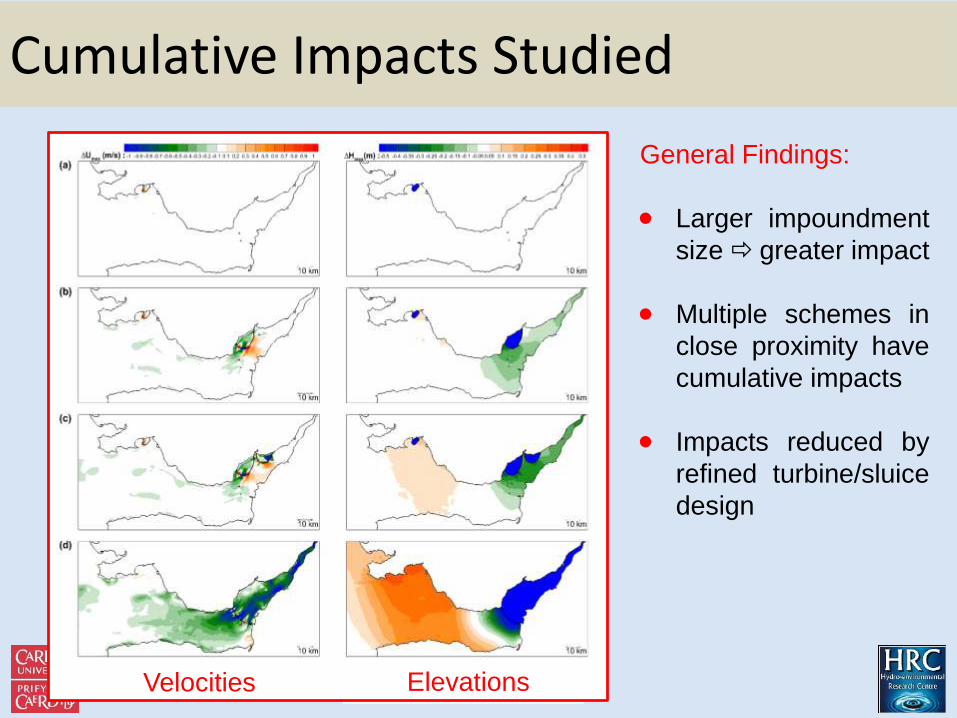
General Findings:
Larger impoundment
size greater impact
Multiple schemes in
close proximity have
cumulative impacts
Impacts reduced by
refined turbine/sluice
design
10
Cumulative Impacts Studied
Velocities Elevations
0
Velocities Elevations

11
Tidal Lagoon - Barrage Interactions
Various Barrage lines (STPG & Atkins) and Lagoons (Cardiff
& Swansea) considered, with interactions studied:
Note: Figures do not include effects of pumping
Results show Barrage would reduce Cardiff output 60% and Cardiff would reduce Barrage output 13%
Run Barrage/Lagoon Annual Energy*
Alone (TWh/yr)
Annual Energy*Combined
1 Severn (HRC) 19.82 17.184
2 Severn (Atkins) 19.77 17.141 (est)
3 Cardiff Lagoon 4.680 1.783
4 Swansea Lagoon 0.586 0.531

Sustainable Severn Forum27th April 2017
Energy opportunity for the estuary
Updating the Severn barrage
By
Prof Chris BinnieMA, DIC, HonDEng, FREng, FICE, FCIWEM
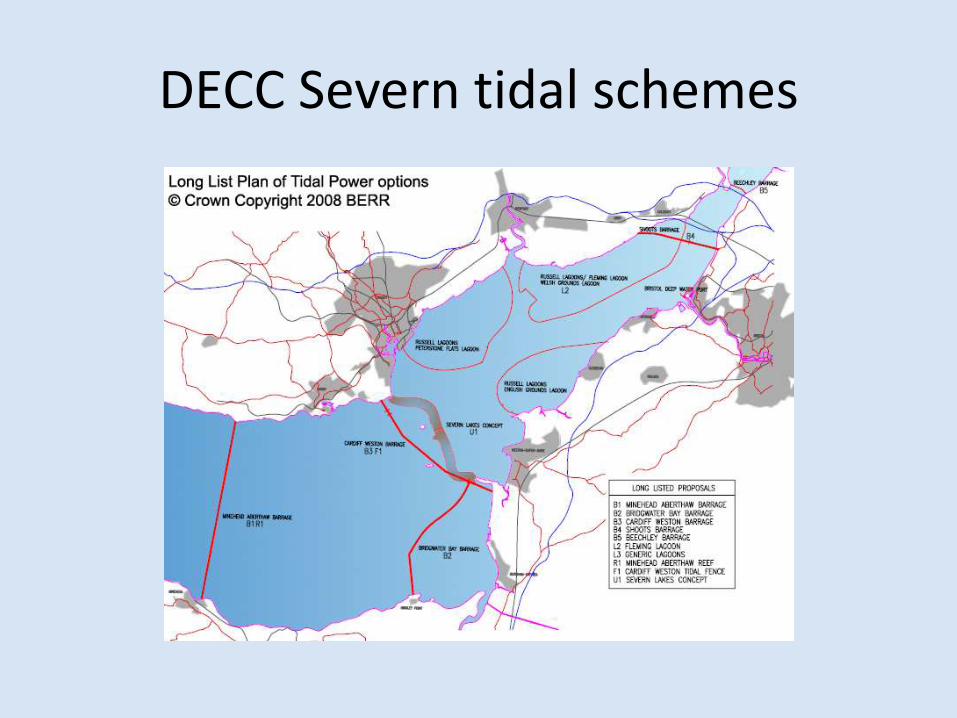
DECC Severn tidal schemes

DECC ebb only generation.
Level of water inside impoundment
Option 1: Generate over ebb tide only

Conclusions of the DECC studyfrom the Executive Summary
• Half of the schemes, including the Cardiff lagoon, were judged to be unviable and were not included in the more detailed consideration.
• The Welsh Grounds lagoon, (Newport lagoon), is no longer considered feasible.
• The Cardiff-Weston, Severn, barrage, 15.6 TWh/y, offers the best value for money.
• Combinations of smaller schemes do not offer cost or energy yield advantages over a single larger scheme between Cardiff and Weston.

Reasons the Severn barrage was not supported.
• Enormous loss of inter-tidal habitat, 118-163 km2
• Birds. Reduction in SPA feeding ground, significant negative effect on 30 species
• Land Drainage. area affected 372km2
• Fish mortality, SAC, possible local extinction of shad and salmon.
• Navigation, • delays to ships transiting the barrage
• BPC planned Deep Sea Container Terminal

Improvements to turbines and operationachieved by TLP, Andritz and GE.
• Ebb/flood generation• Improved basin water levels and generation output
• Pumping• Basin water levels become near normal
• Triple Regulation• Improvement in energy generation
• Non-synchronous generators• Reduced fish mortality
• Smoother passageway• Reduced shear so greatly improved shad mortality

Severn Barrage on the Atkins line

Tidal curve with ebb/flood generation with pumping.

Statistics of the revised barrage
• Energy increased from 15.6 TWh/y to 20.5 TWh/y
• Low water at the barrage increased from 0.34m CD to 0.39m CD, an increase of 0.05m.
• High water at the barrage reduced from 13.84m CD to 13.40m CD, a reduction of 0.44m.
• Mean water level marginally reduced.

Revised impact
• Loss of SAC inter-tidal habitat considerably reduced.
• Loss of bird feeding ground considerably reduced.
• Drainage issue eliminated.
• Fish impact considerably reduced.
• Navigation. Two new container terminals at Liverpool and London Gateway. BPC DSCT postponed.

Comparison of Cardiff and Updated Severn barrage
• Cardiff and Newport lagoons about 8 TWh/y
• Severn barrage about 20 TWh/y.
• Loss of national energy source of about 10 TWh/y
• Severn barrage impact much reduced but still more navigation and fish impact than lagoons.
• Before proceeding, independently update the comparison?

• Welcome Hendry Review and support for Swansea Bay Lagoon as “Pathfinder Project”.
• Swansea Lagoon needs to be successful and would suggest further consideration of two design aspects.
• DECC 2010 Severn Barrage had high impact.
• Tidal energy parameters now much improved.
• Lagoon and barrage impact much reduced.
• Need for independent updated comparison?
Concluding Remarks