ROFITABLE S TRADING -...
844
Transcript of ROFITABLE S TRADING -...


PROFITABLEDAYANDSWINGTRADING

The Wiley Trading seriesfeaturesbooksbytraderswhohave survived the market’sever changing temperamentand have prospered—someby reinventing systems,others by getting back tobasics. Whether a novicetrader, professional, orsomewhere in-between, thesebookswillprovidetheadviceand strategies needed toprosper today and well intothe future. For more on this

series, visit our Web site atwww.WileyTrading.com.Founded in 1807, John
Wiley & Sons is the oldestindependent publishingcompanyintheUnitedStates.With offices in NorthAmerica, Europe, Australia,and Asia, Wiley is globallycommitted to developing andmarketingprintandelectronicproductsand services forourcustomers’ professional and

personal knowledge andunderstanding.

PROFITABLEDAYANDSWINGTRADING
UsingPrice/Volume

SurgesandPatternRecognitiontoCatchBigMovesintheStockMarket
HarryBoxer


Copyright©2014byHarryBoxer.Allrightsreserved.PublishedbyJohnWiley&Sons,Inc.,Hoboken,NewJersey.PublishedsimultaneouslyinCanada.ChartsbyWordenBrothers,Inc.havebeenusedwithpermission.Copyright©1997-2014WordenBrothers,Inc.Allrightsreserved.

Nopartofthispublicationmaybereproduced,storedinaretrievalsystem,ortransmittedinanyformorbyanymeans,electronic,mechanical,photocopying,recording,scanning,orotherwise,exceptaspermittedunderSection107or108ofthe1976UnitedStatesCopyrightAct,withouteitherthepriorwrittenpermissionofthePublisher,orauthorizationthrough

paymentoftheappropriateper-copyfeetotheCopyrightClearanceCenter,Inc.,222RosewoodDrive,Danvers,MA01923,(978)750-8400,fax(978)646-8600,orontheWebatwww.copyright.com.RequeststothePublisherforpermissionshouldbeaddressedtothePermissionsDepartment,JohnWiley&Sons,Inc.,111RiverStreet,Hoboken,NJ07030,(201)748-6011,fax(201)748-

6008,oronlineatwww.wiley.com/go/permissionsLimitofLiability/DisclaimerofWarranty:Whilethepublisherandauthorhaveusedtheirbesteffortsinpreparingthisbook,theymakenorepresentationsorwarrantieswithrespecttotheaccuracyorcompletenessofthecontentsofthisbookandspecificallydisclaimanyimpliedwarrantiesof

merchantabilityorfitnessforaparticularpurpose.Nowarrantymaybecreatedorextendedbysalesrepresentativesorwrittensalesmaterials.Theadviceandstrategiescontainedhereinmaynotbesuitableforyoursituation.Youshouldconsultwithaprofessionalwhereappropriate.Neitherthepublishernorauthorshallbeliableforanylossofprofitoranyothercommercial

damages,includingbutnotlimitedtospecial,incidental,consequential,orotherdamages.Forgeneralinformationonourotherproductsandservicesorfortechnicalsupport,pleasecontactourCustomerCareDepartmentwithintheUnitedStatesat(800)762-2974,outsidetheUnitedStatesat(317)572-3993orfax(317)572-4002.

Wileypublishesinavarietyofprintandelectronicformatsandbyprint-on-demand.Somematerialincludedwithstandardprintversionsofthisbookmaynotbeincludedine-booksorinprint-on-demand.IfthisbookreferstomediasuchasaCDorDVDthatisnotincludedintheversionyoupurchased,youmaydownloadthismaterialathttp://booksupport.wiley.com.

FormoreinformationaboutWileyproducts,visitwww.wiley.com.LibraryofCongressCataloging-in-PublicationData:ISBN978-1-118-71487-4(Hardcover)ISBN978-1-118-71473-7(ePDF)ISBN978-1-118-71489-8(ePub)

ThisbookisdedicatedtomylifelongfriendGaryFishman,whopassedawaysuddenlyinApril2012.HeandIlearned
themarketsandtechnicalanalysistogetherfromthe
timewewereteenagersuntilhispassing.Weshared
somewhatparallelinvestmentpathswritinginvestmentcolumnsinourrespective
collegenewspapersandthenprofessionallyinourearly
yearsofemploymentinWall

Street.GaryandIhadplannedtowritethisbooktogether,andsincehehad
justrecentlyretired,theideaseemedtogivehimasparkof
excitement.Icounthimamongmybestfriendsinlife
andmisshimdearly.

CONTENTS
Preface
Acknowledgments
AbouttheAuthor

Chapter1:MyJourneyasaTrader
Chapter2:PreparingfortheTradingSession
AnalyzingPatternsfromPreviousTradingDay

MyMorningRoutineWhattoLookFor
Chapter3:AnalyzingEarlyTrendDevelopment
DevelopingaDisciplined,

Organized,FocusedApproachMonitoringtheEarlyPrice/VolumeActionCloselyWordenBrothersVolumeBuzz

IndicatorCreatingaFocusList
Chapter4:MyFavoriteDay-TradingPatterns
TheIntradayRisingParallelChannelwith

HighRelativeVolumeTheBestDay-TradePatternTheLow-Volume“Ebb”
Chapter5:UsingMovingAverages
Moving

AverageCrossoverSignals
Chapter6:DrawingTrendLinesandWhyThey’reCriticalinAnalyzingtheTrend
ChannelsandAngles

SupportandResistanceLinesReviewingandAdjustingLines
Chapter7:SettingTargetsandPriceObjectives

DeterminingExitPointsUsingFibonacciandElliottWaveCycleAnalysisTheoryInterpretationSeriesofWaveCategories

Chapter8:WhatKindofTraderAreYou?
WheretoSetTargets
Chapter9:DeterminingandSettingStops
SettingStopsWhere

ImportantPriceSupportLevelsAreViolatedSettingStopsunderKeyTrend-LineViolationsSettingStopsUsingKey

MovingAverageViolations
Chapter10:TechnicalDivergencesandLossofMomentum
PriceTrendAngleDivergences

UnderlyingTechnicalsDivergingfromPriceBalanceofPowerMoneyStreamOn-BalanceVolumeandDivergences

Conclusions
Chapter11:TheInterpretationandUseofStochasticOscillators
IntroductionCalculationandInterpretation

Fast,Slow,orFullOverbought/OversoldBullishandBearishDivergencesBullishandBearishSetupsConclusions

Chapter12:MovingAverageConvergence/Divergence
MACDFormulaInterpretationSignal-LineCrossoversZeroorCenter-Line
CrossoversFalseSignalsDivergencesandLossofMomentumConclusions
Chapter13:BollingerBands
Interpretation
Signal:WBottomsSignal:MTopsSignal:WalkingtheBandsConclusions
Chapter14:PositionSizingandMoney

ManagementPositionSizingTheStop-LossasaMoneyManagementToolRaisingandAdjustingStopsasPriceProgresses

TheTrailingStopMethod
Chapter15:SwingTrading
Chapter16:RulesandGuidelinestoBetterTrading
Chapter17:38Steps

toBecomingaSuccessfulTrader
AbouttheVideo
Index

PREFACE
For most of my nearly 50-year trading career I havebeen told or asked manytimes to put it all down onpaperandwriteabookonmy

knowledge, tradingexperiences, and personalmethodsoftechnicalanalysis.I just wasn’t ready ormotivatedtodosountilnow.Likely, this has at leastpartiallydevelopedasaresultof doing many online livewebinars and personaltrainingseminars forWordenBrothers, aswell as speakingat many traders’ expos andmoney shows over the pastdecadeorso.

I’ve also come to see andfeel that I truly enjoy theteaching aspect of technicalanalysis. Educating tradersand investors on my site,thetechtrader.com,affordsmethat opportunity each andevery trading day. Theinteraction with mysubscribers, positivecomments, and testimonials Ihave received over the yearshave not only beenappreciated but very

gratifying as well. This, too,hasaddedtomydesiretogetthisbookwritten.Formanyyears Ihesitated
towritethisbookbecausebynature I am not a patientpersonorpersonalitytypeforthe most part. That’s prettytypical of Sagittarians.However, I now believe thatagehasmellowedmeenoughand increased my desire towrite this book as an

educational tool to assisttraders of all types inenhancing their knowledgebaseandtradingskills.I live and breathe charts
and technical analysis andhave read most of thegenerally accepted importantbooksonthesubjectovertheyears. I can speak for hoursand days on the subject andoften find when my hour tospeak has ended I’ve barely

scratched thesurfaceofwhatIwanted to cover.Thisbookis meant to complete thatpresentationinmoredepth.If you are a trader who
hungers for more in-depthknowledge of technicalanalysis, especially as itrelatestomethodsofdayandswingtrading,thisbookisforyou! However, traders withlonger-termhorizonswillalsofind great benefit, as the

conceptandrulesinthisbookapplyonalltimeframes.I truly believe that no
matter what level of tradingexperience you have, afterreading thisbook,you’ll findyou have likely enhancedyour skill set and become anevenmoreefficientand,mostimportant, more profitabletrader.

ACKNOWLEDGMENTS
I want to acknowledgeseveral people who werelargely responsible for myprogress and successes overthepast50years.First,Hank

Greenstein was responsibleforintroducingmetochartingand technical analysis. Myformer brother-in-law,Stephen Feldman, was anearly supporter of mine andcocreatedourinvestmentclubin our late teens; he greatlyincreased my interest ininvestments and technicalanalysis. Joel Bernstein wasoneofmyearlymentors andsupporters, who encouragedme to have a career inWall

Street. Harris Shapiro, overthe past 20 years or so, hasgreatlyassistedandsupportedme. Harris is responsible forrecommending me andintroducingmetomycurrentpartner in our web site. Iremainclosefriendswithhimand collaborate daily oninvestment ideas. I oweHarris a lot for his continualconfidence inme to thisday.Finally, but certainly notleast, I thank my wife,

Denise,anddaughters,TaylorandRylee,forputtingupwithmy many days and hoursaway from them, traveling tospeaking engagements andfocusing daily on my chartanalysisandwebsite.

ABOUTTHEAUTHOR
HarryBoxer hasmore than45 years of Wall Streetinvestment and technicalanalysisexperience,including

8 years on Wall Street aschief technical analyst withthree brokerage firms. Hewon the 1995 and 1996worldwide Internet stock-market trading contest, “TheTechnical AnalysisChallenge,” sponsored byAmericanInvest.com. Boxeris widely syndicated and afeatured guest on manyfinancial programs and sites,including CNBC,CBSMarketWatch,

Forbes.com, DecisionPoint,and many more. In addition,he conducts nationwidetraining seminars on hismethods for WordenBrothers. He is currentlycofounderandchiefwriterofThe Technical Trader(www.thetechtrader.com), areal-time diary of his tradingideas and market analysis,and is also a technicalconsultant to many WallStreet hedge funds and large

institutionaltraders.

CHAPTER1
MyJourneyasaTrader

When I was in my earlyteens, I became intrigued bythe stock market, how andwhy it moved, and how Icould possibly analyze orgauge those movements tobenefit financially. I wasconstantly scouring thenewspapers forunusualstockmovements using closingprices and wondered howcould I use that informationin an organized manner for

profitableinvesting.My big ahamoment came
acoupleofyearslaterwhenImetacrankyoldstockbrokernamed Hank Greenstein.During the summers in theearly 1960s, my parentsrented a bungalow in abungalow colony atGreenwood Lake in upstateNew York (quite typical ofmany Jewish families duringthat period). Hank was a

neighborinthatcolony,andIhad several conversationswith him about the marketandinvestingafterIheardhewas a stockbroker. One dayafterHank and I talked for awhile about investing, hesaid, “Young man, you arevery bright and inquisitiveand tuned in to themarket inaway Ihavenever seen inayoungman.”He then said tome,“Comeovertomyplace.Iwanttoshowyousomething

related to investing I thinkyou’ll be very interested in.”Hank proceeded to showmesomethinghecreatedbyhandcalledstockchartsongraphicchart paper. He literallywould add a vertical line orbar to the graph each dayshowing the high, low, andlast closing price. That wascertainly a painstakingprocess, indeed, requiringpatience for the patterns todevelopoveraperiodoftime

until they became usefulenough to trade on. Keep inmindthiswas20yearsbeforethe first IBM PC hit themarket and the subsequentarrivalofchartingsoftware!Tosaytheleast,Iwasvery
excited! Had I found the“Holy Grail” for stockinvesting and trading?? Mythoughts ran to how I coulduse this method for myself,andIaskedHankhowIcould

learn more about this. Hesuggested I read TechnicalAnalysis of Stock Trends byRobert Edwards and JohnMaGee (now widelyconsidered the “bible” oftechnicalanalysis).Based on the charts Hank
had created by hand, herecommended three stocks tome in 1962 (shortly after themarkethadtankedduringtheCubanMissileCrisis). Those

three stocks were Chrysler(nearlybankruptearlier),nowaround$4;U.S.Steel,around$18;andSperryRand(makerof the first large mainframecomputer UNIVAC), around$13. I decided to invest mysummerearningsof$3,000(alot at that time) in all three,andtherestishistory!Sperryran to over $40, U.S. Steelover $80, andChryslermorethan10-foldover$40!Wow,I certainly was hooked for

life!!When I was back in New
Jersey at home late thatsummer I acquired the bookand immersedmyself in it. Iwas fascinated and totallyengaged.Asamatterof fact,I thenread itagain.Over theyears, I have read it six orseven times as a refresher—just to make sure I wasn’tgetting into bad technicalhabits or overusing certain

technical formations becauseI was “comfortable” withthem.Afterhighschool,Istarted
an investmentclubcalled the“Mutual Growth Fund ofNew Jersey” along with mybest friend at the time (GaryFishman), my sister’sboyfriend (later husband),Steve Feldman, and his bestfriend,NeilPrupus,whowasa finance major, both in

school at Rutgers Universityin New Jersey. We tookapproximately $4,000 dollarsand later added quite a fewmore of our friends andassociates. Over the nextcouple of years usingprimarily technical analysis,we built the club’s assets tonearly $120,000 on aninvestmentofjust30,000!At that time I also started
aninvestmentscolumninmy

college newspaper atFairleigh DickinsonUniversity called “TheTraders Corner.” By doingthat column I was able towrite downmy thoughts andmarket ideas, which helpedme hone my technicalanalysis and trading skills aswell.During college I often
found myself at a broker’soffice sitting in front of the

big electronic tape thatscrolled across the topof theroom in front where manyseasoned (and older) traderscongregated.Theyconsideredme a young whippersnapperuntil they saw how well myideas worked and becamecurious how I came up withmypicks.Theywereamazedatmyknowledgeandfeelfortrading,aswellasmyfearlessapproach.An examplewas atrade I made on then market

darling Syntex (the firstcompany to develop a birthcontrolpill).Isawitrunfrom$190 to $250 in just a dayafter it had run earlier in theweek from$150. Idecided itwasoverboughtandshorteditnear the high and within acouple of days covered itunder $200 for a quick 50-pointgain!!Iquicklybecametheir friend (as you canimagine!)andbecamepartofthetrader’sgangattheoffice.

That’s where I met JoelBernstein, assistant managerand also a technical analysisadvocate. When he saw thedepth of my technical skills,he introduced me to thebranch manager, BillSomekh, who asked me if Iwould be interested in acareerasastockbrokerafterIgraduated from college,which I was thrilled about.However, he wanted me toget some brokerage

experiencefirstandsuggestedI find a position with asmaller Nasdaq firmwhere Imight build my book ofclientsandthencometoworkat his office, which Iproceeded to do. I found abroker training position at asmall firm called CarltonCambridge in Fort Lee,NewJersey, and worked there forabout two years or so beforemoving to Bill and Joel’sfirm,WeisVoisin&Cannon.

Later on, Imoved toNewYorkCityandtookapositionwith Pressman, Frohlich &Frost to be at the heart ofWall Street. They quicklywere impressed with mytechnical knowledge andsuggested I write a weeklytechnicalletterforthebrokersat the firm called “TheTraders Corner.” Soundfamiliar?Myexperiencetherewas immense. I got to seehowthe“Street”worksclose

up and interfaced withmanybig traders and fundmanagers who loved mytechnical skill set. It was themid-1970s, and volume onWall Street was still quitepaltrycomparedtocurrentorrecentlevels.Asayoungmanwith very little experience asa broker and low volumelevels on Wall Street,commissions were hard tocomeby,andIwasnotbeingcompensated for my weekly

newsletter,otherthanalargercommission percentage take.Then came the Nixon bearmarket in 1974, and mostbrokers suffered bigcommissiondropsandlossofincome. I witnessed severalbrokers’ career demise anddepartures and eventuallydecidedtoleaveWallStreetadisappointedyoungman.During the following 20
years I continued to trade

actively and hone mytechnical analysis skill setwhile employed in theexecutivesearchbusinessandexcelledinthatfieldaswell.Icontinued to readeverybookon technical analysis I couldgetmyhandson.Ieventuallydecided tomake themove toCalifornia and started myownexecutiverecruitingfirm(now the largest in LosAngeles). However, my lovefor trading and technical

analysis was rekindled withthe advent of personalcomputers andcharting/trading softwareprograms that just keptgettingbetterandbetter.In1993IfoundTC2000or
TCNET (by WordenBrothers) and have beenusing it ever since. Ieventually began doingwebinars and then trainingseminars for the Worden

seminar training series. Forme it’s clearly the bestcharting software on themarket and continues toevolve with more and morefeatures and programs atevery new release. I highlyrecommendit.
■■■In 1995, with the Internet
becoming more and morepopular and expandingrapidly, I found a trading

contestcalled“TheTechnicalAnalysis Challenge” andentereditforkicks(noprizeswere awarded, especiallyduringtheinternet’sinfancy).Iastounded thefounder,NeilHughes, with a winningpercentage of 135 that year,and he encouraged me toenter again in 1996, which Ididandwonagain!Thatyearmy gains were 148 percent.Neil asked me to fly up toSeattle, where he lived, to

discuss starting a technicalweb site, which I agreed to!We named it—what else?—TheTradersCorner!We hadsome success with buildingsubscribers, but during theearly development of theInternet, it was very difficultto get people to pay foranything. Most curioussurfers were trying to getsomethingforfreeandnotyetconvinced the Internet wasanything more than an

information-for-free tool!After about 18 months, Idecided the effort I wasputting into itwasnotgivingme the financial returns Iwanted, so I decided todiscontinuetheservice.By 1999 the Internet and
the stock market werebecoming popular and veryactive places, and thedevelopment of the Internetwith faster servers and the

advent of computerized andonline trading, Ibelieve,wasachiefreasonfortheboominthe markets, especiallyNasdaq.At that time, a friend of
mine from my prior WallStreet days, Harris Shapiro(nowaclosefriendofmine),recommended me to anexecutive he knew at a fast-growing Internet investmentsservices site called America-

Invest. com. Its parent NewYork Stock Exchange–listedGlobalNet was America-Invest.com International,which had similar sitesunique to many countries.The editor of America-Invest.com was RichardHefter,whowasaskedtocalland interview me for apossible spot on their site todo a technical analysissection. When I arrived attheirofficesinSantaMonica,

California, in 1999, Richardand I had a casualconversationaboutwhatImyknowledge was and what Icould bring to the table. Hefinished our talk by askingme my technical opinion ofYahoo!’s chart. I believe itwasabout$240ashareatthattime. After reviewing andanalyzing the patterns andtechnicals,Iprojectedatargetover $400over the next fourto six months, and he was

astounded—he evenchuckled! When Yahoo!reached $400 in just a fewweeks, Rich called me tooffer me a position, which Iagreedto,butonlyonapart-timebasis.Iwasstillengagedin my executive searchprofession and doing verywell. He agreed and wedecided tocallmysectionofthe site “The TechnicalTrader.”

Asmost of you know thattimewas not long before thegreat bull market top andimplosion in March 2000,which caused the collapse ofmany Internet companies,including GlobalNet andAmerica-Invest.com.When itallcameapartRichardHeftercalledmewithanastoundingfact.He said thatmy sectionofthesitehadmorepagehitsthan all the others sectionscombined!He suggested that

we should get together andform a new site of our own,which officially started inJuly 2001. And that’s howour current sitethetechtrader.comgotstarted.In the past 12 years of
trading, our site has evolvedfrom short and intermediatetradingandstockpickstodayand swing trading for themostpart.Thiswasaresultofmypattern recognition skills,

noticing that those patternsform similarly in all timeframes and may be usedintraday, as well, forsuccessful day and swingtrading using 1-, 5-, and 15-minute charts in conjunctionwiththedailypatterns.Our site has had dramatic
growth in thepast fewyears,especially when we added atrading chat room andintroduced intraday live

analyticalvideosthatmonitortheprogressofchartpatternswe are trading (I’m told avery instructive learningprocess for my subscribers).We also do nightly summaryvideosandSaturdaymorningweekly webinars as well, aspartofourcurrentservice.I have found over the
several decades I’ve beenactivelytradingthattechnicalanalysis is a long-term

learning process.Unfortunately, many of thebest traders I know had tolearn from making mistakesearlier in their tradingcareers!Thekeytotradingistorevieweverytradeafterit’scompleted to see whydecisions were made, whatresulted,andwhatlessonscanbe learned from those trades.Only then can you reallybenefit and learn from yourowneducationalprocess.Use

it!Iamastoundedhowmanytraders do not do this andcontinue to make the samemistakes over and over,eventually blowingthemselves out of themarketwith amajor percent of theircapital wiped out. Thepurpose of this book is toteach traders not only aboutmy technical analysis skillsand how to use them forprofitable trading, but alsohowonemustbedisciplined,
using rules and stops toprotect trading capital, at alltimes. The challenge is toalways preserve your capitalwith protection so you cantradeanotherday!
CHAPTER2
PreparingfortheTradingSession

The trading day does notjustbeginattheopeningbell.Askanysuccessfultraderandyou’ll discover he has aroutine leading up to thetrading day that is nearly asimportant as what goes onduring set trading hours.Preparation is the key tomany things in life, andtrading is no exception. Inthis chapter, we’ll coverpremarket preparation and

analysis, which includes areviewoftheclosingpatternsfrom the prior session and alook at the premarket newsandresultingpriceaction.

■ AnalyzingPatterns fromPreviousTradingDayProper premarket preparationalways starts with analyzingtheclosingpatternsofinterestfrom the prior session forpossible strong “setups” for

the next day trade. Thisshouldbedoneafterthecloseofthepriorsession(orduringthat evening) before the nextsession begins. My strongsuggestionisthatyoudoyourworkwhen it’s fresh in yourmindandprepareyourwatchlists before the next day,when you should bemonitoring premarket newsand price action for possibletrading candidates. In anycase,youarelookingforkey

bullish price action withrelativelyhighervolume thannormal, hopefully on asignificant price volumesurgethroughakeytechnicalresistance or support level orzone. You should be on thelookout for followingbullish/bearish consolidationsor orderly retracementpatterns such as flags,wedges, coils, pennants, andsoon.

The preceding patternshave distinctly differentformations, although coils,pennants,andwedgesmayatfirst appear similar, and alleventually will move towardanapexornarrowingofpricepattern until the lines meet.Coils usually are narrower atthestartandthenpricemovesinasmallerdecreasingrange.Pennants, although verysimilar to coils, are usuallysmaller and tighter and

shorter in time. Wedges canand usually do start with awiderprice rangeandappearmore symmetrical ortriangular than coils beforealso narrowing toward theapex. Bull flags are moreorderlyandtendtoremainina parallel pattern, ideallymoving in a lateral directionor with a slightly upward ordownwardmicrotrend.These patterns may be

precursors or setups for thenextmoveorextensionoftheprior move, otherwise calleda possible new wave or legup. Stocks that have thosecharacteristics should be puton a “trading watch list” or“focus list,” so they can beclosely monitored forpossible trades the nextsessionandgoingforward.(See three examples of
pennants, coils, and flags in

one intraday session trend,resultinginadditionaluplegsinFigures2.1through2.3.)
FIGURE2.158.com(WUBA)
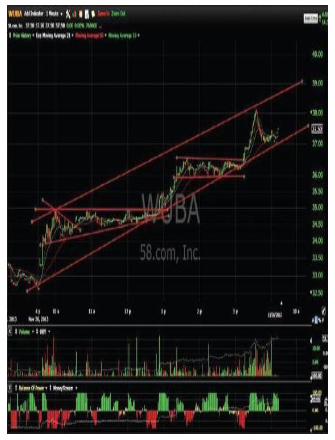

FIGURE2.2ZhoneTechnologies(ZHNE)


FIGURE2.3FoundationMedicine(FMI)


As you can see in Figure2.1, WUBA displayed anopening gap on a 2-minutechart,whichwasfollowedbyan early mini bull pennantformation. That thenelongated into a 3-hour bullcoil. The pattern then breaksoutandlateronresultsina2-hourbullflagthatalsobreaksout,extendingthesessionrunto near the close for a verynicedaytradeofnearly$3.50

ormorethan10percent.Figure 2.2, on a 1-minute
chart,showsastrongintradaymove by ZHNE: first theopening price volume surgegap, followedbya largebullwedge. Later during thesession a bull flag and twobullcoilcontinuationpatternsdeveloped and wereprecursorstothecontinuationof the intraday trend and upchannelextensiontotheclose

resulting in nearly a $1 gainormorethana20percentdaytrade!In Figure 2.3, Foundation
Medicine (FMI), we seeseveral early mini bullconsolidations (coils,pennants,andflags)followedby a strong spike surge to amidday top. Then a lateafternoon 3-hour bull coilforms.Thepatternresultedinnearlya20percentgainfrom

the breakout of the firstmorningminicoil.These patterns may be
precursors or set ups for thenextmoveorextensionoftheprior move, otherwise calleda possible new wave or legup. I’ve foundover theyearsthat stocks tend to move insteps or waves and that veryoften important moves occurin five waves (three up, twodown or sideways

consolidations) and any timeframe, as well! Obviously,the opposite will often occurin important down moves.We’ll cover this subject inmoredepthinalaterchapter,but Figure 2.4 shows someexamples of five-waveintradaymoves.In Figure 2.4 the VISN
chartshowsanexampleofanintraday five-wave move upon a 1-minute chart,

displaying a second andfourth wave bull wedge/coiltype consolidationformations. The five-waveadvance was completed bymidday and resulted in anearly 25 percent move injustabouttwohours!
FIGURE2.4VisionChinaMedia(VISN)


In Figure 2.5, Mellanox(MLNX), we also see adistinct five-wave advancewith an early bull coil, twoflags, and a mini wedgeduring the course of theintraday move, but the fifthwaveisabitmorecomplexinthat it displays five waveswithin the fifth wave beforecompleting theadvance foranearly10percentgaininlessthanthreehours.

FIGURE2.5Mellanox(MLNX)


■MyMorningRoutineOneofthefirstthingsIdoischeck the index futures andforeign markets to gauge ifthe general market pressureshereand/orabroadwillbeupordown.Thismayadjustmythinking somewhat onwhether I’ll be looking toscalptradesforquickhit-and-

run profits or attempt longermultihourorsession-longdaytrades to “milk the trend”during an especially bullishsession.Additional day-trade
premarket information thatmay affect individual issuescan be gleaned from newssources like bloomberg.com,marketwatch.com,seekingalpha.com and mypersonalfavoritemarketnews

source, briefing.com, just toname a few. I spend an hourorso in thepremarketperiodearly each morning poringovermanyofmysources forinformationornewsthatmaybeaffectingstocksormarketsdomesticor international. I’llpost all of the pertinentinformation I’ve deemedimportant for the trading dayto my trading site(thetechtrader.com) for mysubscribers to digest or

disseminate In addition, Icheckpremarketpricepercentandvolumepercentgainersatnasdaq.com and onbriefing.com to see what’smoving before the marketsevenopenfor regular tradingandalsopost thatdata tomytradingroom.Preopening key news
affecting price and causingopening gaps should be paidclose attention to and
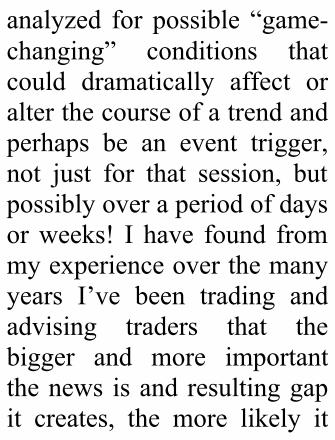
analyzed for possible “game-changing” conditions thatcould dramatically affect oralterthecourseofatrendandperhaps be an event trigger,not just for that session, butpossiblyoveraperiodofdaysorweeks! I have found frommyexperienceoverthemanyyears I’ve been trading andadvising traders that thebigger and more importantthenews isandresultinggapit creates, the more likely it

can trigger significant pricemovement for even monthsand years! These significantnews events often representkey turning points and ordirectionalthrusts.Also in the premarket
periodseachsession,lookforpercent change leaders inprice and relative volume.Thesecanbecluestowhethera post gap trend or risingintraday channel may form.

Bymonitoringtheearlypriceand relative volume actionand resulting chart patternformations thatdevelopearlyon in the day you will bebetterable todeterminewhatstocks may be strong day-trading candidates forstarters.Finally, about 40 minutes
before the market opens, Iconduct a premarket “talk”via a webinar with my

traders, thepurposeofwhichis to analyze premarkettrading 1-minute chartpatterns and volume tonarrowourearlywatchlisttoa“focuslist”of8to10stocksor so that are likely to havethe best potential to trade inthefollowingsession.Of course, in the first few
minutes of trading I usuallydiscover additional stocksmoving sharply higher and

possibly breaking out acrosskey levels after they’veopenedthatwerenotapparentinpremarket.Iwilloftenaddseveral of these to the focuslist and perhaps evenrecommend some of them as“buyalerts”veryearly in thenewsession.

■ What toLookForWhen viewing or analyzingthe chart patterns, it isimportant to check forprevious resistance andsupportatpriorlowsorhighs(depending on whether youare looking for longs orshorts). Moving averages,especially 10-, 21-, and 50-

dayperiodsandkeytrendandchannellines,needtobepaidattentiontoaswellsincetheynormally also represent keylevels. By watching forimportant breakouts acrossthese points on the charts,you will be able to spotpotential trade candidates forthe following session orsessions andmore accuratelybe able to make priceprojections and set targetsyoucanuseandrelyonwhen

trading.Taking the time to
carefully review and analyzethe prior days’ and weeks’patterns and underlyingtechnicals, as well aspreopeningmarketactionandrelated news, for the currentsession is extremelyimportant in determiningwhat stocks to have on your“watch or focus lists” and iscritical toyourpotentialday-

tradingsuccess.Thebestdaytraders I’ve known over themanyyears I’vebeen tradingstocks “plan their work andworktheirplan.”
CHAPTER3
AnalyzingEarlyTrendDevelopment

It is my strong opinion thatthe vast majority of intradayday-tradable patterns areinitiated at or very close tothe opening of trading andthat the close analysis of thefirst 15 to 30 minutes ofpattern and related volumedevelopment is key torecognizingwhat stocksmaybe excellent day trades or atleast strong early scalp playpossibilities. Also, an early

indicator to pay closeattention to is WordenBrothersVolumeBuzz.We’llalso lookat theneed toearlyoncreateafocuslist.

■DevelopingaDisciplined,Organized,FocusedApproachFirst and foremost, none ofwhatyoumaylearnfromthisbookwilldoyoumuchgoodunless you are able to

maintain a disciplined,organized, and focusedapproachtobeabletobenefitfinancially from what youhaveabsorbed.Overthemorethan 45 years I’ve beentradingandespeciallysinceIstarted thetechtrader.com in2001, I’ve noticed that mytrading skills and moresuccessful trading recordhave been greatly enhancedsince I evolved my tradingstyleintoamorefocusedand

disciplined approach. Thiswas necessary due to themany subscribers to myservice that rely on me foraccurate technical advice.Because of this, I’ve beenabletoofferamoreattractiveandeffectiveservice.It’s my observation,
especially since I started mytrading advice site,thetechtrader.com, that themost successful traders

appear to be the mostorganizedandfocusedamongmy many subscribers. Inaddition,mostofthemappeartohavemanyyearsoftradingexperience behind them andhave learned the necessity ofdiscipline and focus, perhapsthehardwaythroughtrialanderror. There’s nothing likeexperience to instillconfidenceinwhatyouknowanddo.

After I’ve done my priorday and premarket reviewsand analyses, I feel veryprepared and quite confidentinmyability tocreateaveryuseable focus list that canbeused for successfully tradingthecurrentmarketsession.

■ Monitoringthe EarlyPrice/VolumeActionCloselyIn the very early action I’msearching for important gapsofat least4 to5percent andpreferablymuchmore! Earlyanalysis of opening price

gapswithvolume(somethingI’ve coined the price/volumesurge)andhowthatrelatestothe previous trend, as tooverhead resistance and therecent technical trend is amust. The opening gap pricewill alsooften act as supportforthesessionand,whetheritholds that level early on inthedayornot,ismostoftenakey indetermining if a stockwill then start a tradableintraday uptrend or channel

forthesessionandbea“highprobability” trade for at leastthat day. Usually, if theopening gap price is quicklybrokenasina“popanddrop”scenario, it is most often afairly reliable indicator indetermining that theremainderofthesessionmaybe difficult for that stock atbest and if it needs to beexited quickly or avoidedaltogether.

If a stock does gapsignificantly and then holdsthat level, usually thedevelopment of an intradayuptrend will become evidentin the first 20 to 30 minutesof trading. Many successfultraders I’ve known orobserved over the years willnotanticipate,butratherwaitfor that trend to begin todevelop before committingfunds or adding morepositions.Othersmaychoose

towait for that first pullbackor early consolidation I referto as the “BoxerWedge” (orcoil, pennant, flag, etc.). It’sthatfirstconsolidationpattern(no matter what you chooseto call it) that comes onlower-volume “ebb”(indicating an abatement ofsellers)andtheholdofgaporother significant key support(or resistance if you are daytradingitshort).

■ WordenBrothersVolume BuzzIndicatorOne ofmy favorite technicalindicators that I feel is veryimportant in increasing yourability to spot the earlymovers is Worden Brothers

proprietarytechnicalindicatorcalled “Volume Buzz.” Itclearly indicates at any pointin time during the session,minute by minute, what thepercentage of volume tradedisatthatmomentinanystockcompared to the averageprevious volume traded atthatpointintimehistorically.VolumeBuzzisbasedonthe100-period simple movingaverage of volume over theprevious 100 days. I don’t

believe anyone else to datehas developed such a usefultechnical tool. It’s extremelyvaluable in determiningwhere strong early money isflowing during any onesession. Obviously, veryvaluable in helping one spotstocks that may be possibleday trenders! I highlyrecommend traders accessTCNET or TC2000 software(the charting softwarepackage is supplied for free).

This program has been ratedamong the top three chartingsoftware programs for thepast10years!Figure3.1 showsa sample
of the Volume Buzz leadersforaday.Thelistissortedbythe percentage increase involume for that sessionversustheprior90days(bothfor advancers and decliners).During the session, thecontinuously updating list is

constantlybeingsortedbythepercentage increase for thattime of day versus theaverage for that time of dayoverthepast90days!
FIGURE3.1VolumeBuzzLeaders


■ Creating aFocusListAfter spending the earlymorning premarket periodclosely checking premarketpriceandvolumemovementsand analyzing patterns, youshouldnarrowyourwatchlistof potential stocks you areinterestedindowntoa“focuslist” of a dozen or so “likely

tradepossibilities.”Iwill createa focus listof
candidatesI’vefoundfordaytrades, highlighting them onTC2000 by flagging them.This listwillbeveryflexibleand I’ll usually be addingnew members to that list asearly market price/volumeaction uncovers early trendsthat may not have beenapparentinpremarketactivityor I’lldeletepremarketpicks

thatquicklyfailor fadefromearly strongly bullish actionorfailtodeliverdesiredpricemovementresultsearlyon.Theobviouskeytobeinga
successful day or short-termtrader isyourability to“pickthe winners” out of a list ofpotentials. In some respects,this is the most difficult andcritical task for traders. Onewaytodothatistoavoidthepitfallsofmanytradersinthe

early session period byeliminating fromconsideration certain lower-priced (under $3–type stocksthat may be too thinoutstanding float–wise(unlesstheearlyprice/volumesurge is spectacular in termsof percentage above normalin the 5,000 to 10,000percent–plus rangeorbetter).Even then, attentionmust bepaid to key support andresistance early on, as many

lower-priced, thinner floatstocks will more frequently“pop and drop,” “gap andcrap,” or just fade slowlylower over the course of thetrading session (especially inthe juniorbiotechorChinesestocksector,I’vefound).It’s usually best to pick
more tradable liquid stocksthat are experiencing the bigprice/volume surges andbreaking out, perhaps

indicating better market“sponsorship.” Institutionsand/or institutional or high-volume traders most oftenwill shy away from stocksunder$5,andmanywillevenavoidissuesunder$10!Also, depending on the
newsornewssources,tradersneedtodetermineifanynewsis possibly a key trend-determining factor or “gamechanger”thatmightreversea

trendordramaticallyenhanceone.Once you are armed with
thepropertechnicaltoolsandhave done your homework(created your “plan”), youwill have a much higherprobabilityforsuccessfulandprofitabletrading!

CHAPTER4
MyFavoriteDay-TradingPatterns

In this chapter, I’ll reviewmy favorite day-tradingpatterns and give chartexamples throughout.Asyoutrade more, you’ll quicklydevelop “favorites,” too—theymightlooklikethese,ortheymightbedifferent.Keeptracksoyoucan revisit themover the course of yourtrading.

■ TheIntradayRising ParallelChannel withHigh RelativeVolumeDuring the course ofmy 45-plus years’ trading

experience, I’ve noticedmany patterns that developduring a single session, buttheonethatappearstobethebest is the intraday risingchannel. This usually startswith anopeninggaporpricethrust and ideallymoves intoan early bull consolidationending with a low-volume,narrow range beforeextendinginarisingchannel.

■ The BestDay-TradePatternAnintradayrisingchannelupallows for staying in a daytradetomilkthetrendforthelongest possible time frameintraday, resulting in thelargest possible session-longprofitableday-tradegain. It’s

close to a parallel risingintraday channel trend thatideallystaysinthepatternallsession at approximately a45-degree angle of ascentwithoutviolatingkeyintradaychannel and/or intradaymoving average and pricesupport during the entiresession.Itistrulyamazingtome that the vast majority ofintraday rising channelsextend upward at or near a45-degree angle during the

session.I’veobservedthisfordecades. This also applies tolonger time frames such asdaily chart patterns, as well.Simply said, the “best day-trade pattern” you can find!(Figures 4.1 and 4.2 areexamples of the intradayrisingchannelpattern.)
FIGURE4.1ZhoneTechnologies(ZHNE)


FIGURE4.2XPOLogistics(XPO)


InFigure4.1,ZHNEstartsthetradingsessionwithagapand run on the 1-minutechart. Then settles into anearly bull wedgeconsolidation on lowervolume. When aprice/volume surge occursbreakingoutof theearlybullwedge, anuptrendchannel isset in motion that maintainsits angle of ascent for theremainder of the session

without breaking the channelor any intraday support level—the day trader’s dreampattern, in my humbleopinion! That’s because itenables the trader to stay inthe trade for the wholesession,ridingtheupchannelpatternalldayforabouta20percent day-trade gain afterthe initial pattern breakoutoccurredaround10:30.InFigure4.2,youwill see

that XPO also starts thesession with a gap, run andfirst consolidation bull coil.During the course of thesession, it also maintains itsangleofascent,formingthreecoils and a flag during theday,butnotviolatingasinglesupportlevelallsession.Thispattern once again enabledthe day trade to “stay in thetrend”allday,finishingatthehigh of the day, going awayfor about an 18 percent day-

trade gain in 4.5 hoursfollowing thebreakoutof thefirstbullcoilaround11:30.

■ The Low-Volume“Ebb”Most often, the previouslymentioned trend channelwillbe started with either anopening gap “price/volumethrust” or a fast start out ofthe gate on strong relativevolume. As discussed in thepreceding chapter, anexcellent gauge of relative

volume is Worden Brothers’“VolumeBuzz,”aproprietaryindicator that measures thepercentage of volume tradedat any point in the sessioncompared to its historicalvolume.Thisindicatorallowsonetoseeearlyoninthefirstpartofanytradingdaywhichstocks are moving sharplyandmovingwithhighrelativehistorical intraday volume.It’s a terrificwayofgaugingstrong, historically relative

money flow early in thesession and draws yourattention to candidates forpossible day trades to add toyour watch list, at the veryleast.Volume during the
formation of these earlyconsolidation patterns shouldbedwindlingtoalow-volume“ebb” to be ideal. Near theend of the developingintraday 1-minute bull

patterns, very often the pricenarrows greatly, as doesvolume,usuallydwindling toanearsessionlowonseveral1-minute bars. Low volumemaybe a signal of a balanceof energy between the bullsand bears, as they withdrawwaiting for the nextmomentum thrust to takeplace before entering newpositionsorperhapsaddingtoexisting ones.This often is aprecursor to an imminent

move and needs to bewatched closely for aprice/volumesurgetoendthepatternandpotentiallyextendthe previous move in thedirectionoftheintradaypriorongoing trend. (Examples ofintraday low-volume ebbsresulting in extension movesare shown in Figure 4.3 and4.4.)
FIGURE4.3Aetrium,Inc.(ATRM)
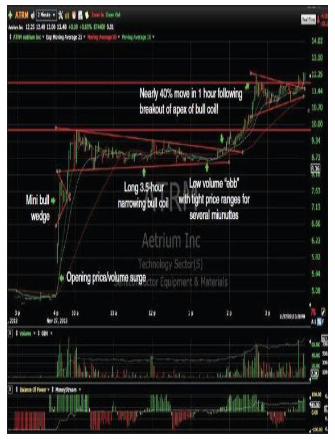

FIGURE4.4RegadoBiosciences(RGDO)


Figure4.3showsATRMinan explosive opening runfrom5.75 to 9.75 in the first30 minutes of trading. Thiswas followed by a 3.5-hourconsolidation bull coil thatnarrowed dramatically onboth price and volume to an“ebb.” Another explosivemove resulted when the coilbroke out accompanied by asharp pickup in volume,resulting in an additional

nearly 40 percent move injustanhour!Figure 4.4 shows RGDO
havingtheusualopeninggapI look for, followed by threeconsecutive bullconsolidation formationsintraday, each culminating ina low volume and price ebb.After the first bull coil wasbroken, it surged from near5.55 to near 8.40 during thecourse of the session,

resulting in a potential 50percent gain from the firstbullpennantbreakoutpoint!Normally, the first early
move is then followed by apullback/retest or bullishconsolidation pattern thatholds at or near the openinggap price on the test and/orformsanearlybullpatternasvolume recedes, indicating adwindling of selling volumeor“low-volumeebb”asIlike

to call it. To be ideal, theseearly bull formations shouldhappen with lower volumeand most often are found inthe form of a bull coil,pennant, flag, wedge, orfallingwedge.Once the early
consolidation pattern hassuccessfullyheldsupportandiscompletedbyabreakoutofthe formation with aprice/volumesurge that takes

out the first spike high, theprobability percentage of anuptrending channel andresulting successful trade isgreatly increased. Usually inthe first 20 to 30minutes ofthesession,we’llbegintoseethat up channel begin toformulate. Many traders willeitherwait for that “takeout”to occur or anticipate thebreakout move when strongvolume accompanies theprice surge after apparent

support has held the pricepullback or consolidation onloweringvolume.It is usually advisable to
notoverlycommit funds toastock still consolidating orretesting until theconfirmation of a breakouthas taken place. If you dodecidethattheactionappearsquitebullishandyouwant to“anticipate” a forthcomingmove in order to have a

position in it, perhaps asmaller position may beinitiated. Later, additional orfull positions may be addedwhen the breakoutconfirmation takes place, butonlywithatightstopinplacebelow the pattern lows, incase the pattern does fail.This stop is a trader’s mustandwillactasprotectionatasmallprice.As the intraday rising

channel begins to developand extend, traders shouldcontinuously be monitoringthat development, keeping inmind where overheadresistancefrompreviouslowsor highs might be. Whenlooking at the 1-minuteintraday charts for day-trading purposes, it’s alwaysbesttorefertothe5-and15-minutepatternstogetabetteridea ofwhere those previouslevels are likely to create

meaningful resistance orsupport.One rule of thumb is that
“previous support, whenbroken, becomes resistance;andpreviousresistance,whenbroken,becomessupport”—averyimportantrulethatIfindmany inexperienced tradersarenotascognizantof.Theseintraday support/resistancepoints are key levels for theintradaychanneltraderstobe

aware of, as they have theability to “change the trend”or propel it in the oppositedirectionintradayifviolated.Probably the most
important of the patterns topay close attention to is thatrising channel bottoms line,asabreakof itcanmeantheintraday uptrend could beending or reversing. In myopinion, one of the moredifficult parts of technical
analysis intraday is knowingwhereandhowtodrawthoselines and how to adjust thelines when the angles ofascentchange,soastostayinthe trend without gettingstoppedout.That takesyearsof experience and “gut feel.”I’ll cover that in a laterchapter.In trading these intraday
rising channels, it isimportant to use stops below
significant intraday levels toprotect the gains you havefrom earlier in the session,should the channel crack orkey support be violated.Many traders like to usetrailing stops as the channelextendshigher,butIprefertoexamine where key intradaysupportmaybe.Thisisoftennear where price, movingaverages, and rising channelline support lines intersectorare in juxtaposition to each

other. A stop below thoselevels will most oftenproperly protect day-tradepositions from furtherdamage.

CHAPTER5
UsingMovingAverages

I have found over themanyyears I’ve been trading thatthe 10-, 21-, and 50-periodmoving averages work beston shorter to intermediatetime frames, and I even usethem on the 1-minuteintraday charts I day tradewith, because I find them tobe just as useful intradaywhen day trading. Thecrossover of those movingaverages can be a very

powerful indicator of trendreversal.Just as previous high and
lows can act as support orresistance, so do the variousmoving averages, and I payclose attention to them aswellduring the intradayday-tradesession.I used to use 40-day
moving averages on dailycharts and found them to bequite accurate over the years

but switched back to 50-daymoving averages because somany institutionalclientsandtrader friends of mine did. Ifindthatthe50givesyoujustthe buffer you need to avoidthetoo-tightstop-losstrigger.Inadditiontotheotherkey
support/resistance levelsonachart, the dotted-linemovingaverages I use are just asimportant in my tradingexperience to determine

whetheratrendmaycontinueor reverse, especially whentheyintersectorjuxtapositionat the same or nearly thesamepoint on a chart of anytimeframe!Ihavefoundoverthe many years I’ve beentradingandadvisinginvestorsand institutions that aviolation of a key movingaverage,suchasthe50-dayinparticular, on heavy volumeon the daily chart very oftencan signal a trend reversal,

especially because so manylarge investors/traders followthatonereligiously.It is truly amazing how
many historically highpercentage gainers in stronguptrends and rising channelsover a period of months andeven years have adheredclosely to their 50-daymoving averages. Anexamination of the chartpatterns of the biggest

winners of the past centurywill show that they wereexcellent buys when theyretraced near and/orsuccessfully tested their 50-daymovingaverages.This iswheremanyinstitutionalfundmanagers entered newpositionsoraddedtoexistingpositions.Figure 5.1 displays the
daily chart of MU, showingthatitstartedamajoradvance

in November 2012 near $5.Over the course of thefollowing year, it channeledup at a 45-degree angle,reaching nearly $24 for anearly350percentmoveinayear.Onitswayup,ithadatleast four important tests andideal entry points near itsrising50-daymovingaverageandheldthereeachtime,thenextendeditsrun.
FIGURE5.1Micron

Technology(MU)


In Figure 5.2, you’ll seethat JKS started a strong runon its daily chart in April2012 near $4. In just sevenmonths, it moved sharplyhigher on a 45-degree angletogetnear$35byNovemberfor a more than an eightfoldincrease! Along the way, itretested the 50-day movingaverage successfully threetimes for excellent entrypoints.

FIGURE5.2JinkoSolar(JKS)


Figure5.3showsPstartinga strong run in November2012 near $7 and steadilyadvancing in a 45-degreeangle for 12 months.Eventually, it reached nearly$32 for more than a 350percent gain, as well. Alongtheway,itsuccessfullytestedits50-daymovingaveragesixtimesforterrificentrypoints.
FIGURE5.3PandoraMedia(P)

Many professional traderswho use Elliott Wave orFibonacci analysis usemoving averages morecloselyalignedtosomeoftherules of those methods. InFibonacci,wavesoccurat8-,21-, and 55-day, -week, andso on time periods, prettydarnclosetothe10-,21-,and50-period moving averages Iuse and recommend. Thisactually confirms and adds

credence to those numbers,especially for shorter-termtrading. We’ll coverFibonacci and Elliott Waveanalysisinalaterchapter.For the nonprofessional, it
is highly recommended that10-, 21-, and 50-daymovingaverages are added to yourcharts.Mynearly50yearsofexperience and closemonitoring of thousands ofstocks over those years has

shown me that the“nonprofessional” everydaydayandshort-termtradercangreatly increase profitpotential and add topercentage gains by addingand using these movingaverages.Theyareextremelyimportant in helping todetermine trenddirectionandwill greatly enhance thetrader’s buy/sell decision-makingprocess.

■ MovingAverageCrossoverSignalsOne key technical trendreversal signal for manytraders and a personalfavoriteofmineoccurswhenthe various moving averages

crossovereachotheraspriceappears to be changingdirection. Because they areconstructed on different timeframes,theywill“crossover”when a strong pricedirectional thrust or reversalistakingplace.I have discovered over the
years thatveryoften the firstpullback in price after thecrossover occurs can be anexcellent entry point,
especially for swing tradersor longer-term core positionplays. Inmany instances, thebestpossiblepointofentryisat the beginning of a majortrendreversal.Ifatrendhasbeenmoving
up or down in a close toparallelchannelandsuddenlyreverses with substantialrelevant volume breaking thechannel support/resistance,watch for a following first

pullback at or near thosemoving averages, whichshould act as additionalsupport. If they have turneddirection and are crossingover, indicating a possibletrendchange, thenapullbackto retest that zone will oftenresult in an excellent entrypoint.InFigure5.4,youwill see
the impressivemove in 2013for ADEP on a daily basis

chart.Itbeganastrongsurgein late September with aprice/volume thrust and withthe 10-, 21-, and 50-daymoving averages crossingover to theupside.Thestockinitiated its run at that point,takingitfrom3.50to10.78injust seven weeks, with thebase breakout buy signalcomingnear4.50.Frommid-October to mid-December itaddedtoitsgainsbyreaching12.50, a gain of nearly 200

percentinjust90days.
FIGURE5.4AdeptTechnologies(ADEP)


Figure5.5shows thatafterbasing bullishly for nearly ayear on its daily chart,ARWRsurgedandbrokeoutin mid-July near 2.50 as itsmovingaveragesalsocrossedover. That initiated a majornew uptrend channelinterruptedonlybyasecond-wave bull wedge, with thethird wave eventuallyreaching 8.88 by mid-October,anearly250percent

gaininjust90days.
FIGURE5.5ArrowheadResearch(ARWR)


In Figure 5.6, RMTI’sdaily chart experienced aprice/volume surgebreakaway gap in mid-July2013, with its movingaverages crossing over. Thatwasfollowedbya four-weeknarrowingbullwedge,whichthen popped and explodedfrom near 5 to 13 in justseven weeks. But it wasn’tdone yet! After another six-week bull wedge–type

consolidation, RMTI againsurged and reached 15.67 bylate November for a gainfrom the moving averagecrossover signal of over 200percent.
FIGURE5.6RockwellMedical(RMTI)

As an example of howmoving average crossoversignals work in eitherdirection, Figure 5.7 showsVTR having a downsidereversal occurring in May2013. After a strong five-wavemove ended, it sharplyreversed with a 20-pointdownside plunge from 84 to64 as its moving averagescrossedover to thedownsidein mid-July. What followed
was a .382 Fibonacciretracement bear wedgeformation that failed right atthe retest of those movingaverages and resulted inanother sharp leg downtakingitfromover72tonear58.50.Aftera2.5-monthbearflag formed, it againplungedfromnear 68 to near 55 in afifth-wavedecline.Theentireprocess from 84 to 55 tookaboutsixmonths.

FIGURE5.7Ventas(VTR)


Finally, Figure 5.8 showsanother bearish example ofdownside moving averagecrossovers occurring on theRNFchart inFebruary2013,after a major five-waveadvance had completed inlate January, which took thestockfrom16 to49 theprioryear. An initial downsideprice/volume trust occurred,crackingtheupchannel.RNFthen attempted a rally back

but formedabear.That rallyalso failed near the movingaverage crossover point,whichinitiatedadeclinefromabout 41.50 to near 18 overthenexteightmonths.
FIGURE5.8RentechNitrogenPartners(RNF)


When used in conjunctionwith the other technicalindicators I’ve discussed orwilldiscuss,youwillseehowpowerfuladirectionalchangeindicator moving averagecrossovers can be. Some ofthose other technicalindicatorsincludetrendlines,support/resistance lines,stochastics, moving averageconvergence/divergence(MACD), Bollinger Bands,

andsoon.I have found on my day-
trading site(thetechtrader.com)thatthesemoving averages can becritical for intradayentry/exitpointson the1-minutechartsas well, especially inconjunction with those otherindicators I previouslymentioned, such as trendlines, support/resistance, andchannel tops and bottoms, as

well as the bullishcontinuation patterns: flags,wedges, coils, pennants, andsoon.Although moving average
crossoverson1-minutechartsusuallyoccurveryquicklyattheoutsetofanintradaytrendthrust,theyappeartobemorevaluable as support for theongoingintradayrisingtrend,particularly on the first earlypullback that successfully

holds those averages.(Examplesofmovingaveragecrossovers on 1-minuteintraday charts are shown inFigures5.9and5.10.)
FIGURE5.9DaqoNewEnergy(DQ)


FIGURE5.10SolarCity(SCTY)


Figure 5.9 shows aparticularly strong intradaysession took place on DQ inlateSeptember2013.Afteraninitialthrustfromunder20tonear 22, the stock set up anearlymini bull flag that heldthemovingaveragesthathadthrusted and crossed over.The breakout of that flag setoff a sharp up channel thatreached near $35, neverviolating an intraday support

level and resulting in a hugegain of 13 points or over 60percentinjust3.5hours.Figure 5.10 shows another
example of a strong intradaymovethatwastriggeredafteraholdorretestoftheintradaymoving averages followingan initial breakaway gapthrust.Thisisthepatternthatdeveloped on SCTY in mid-May 2013. After its initialpop, it then formed a mini

bull flag, which broke outafter the first hour of tradingnear38andadvancedsteadilythroughoutthesessionuntilitreached near 46.50 in theafternoon, a gain of 8.50 ornearly 33 percent in a fewhours.

CHAPTER6
DrawingTrendLinesandWhy

They’reCriticalinAnalyzingtheTrend
Since my early years oftrading, I have been activelydrawing trend lines. I am avery visual person, and

drawing lines that determinethe trend, trend angles,channels, support/resistance,and so on has greatlyenhanced my ability toquickly see when animportant move may betaking place. Trend lineseliminate guessing, and youreyes are immediately drawnto those levels that may beveryimportanttodeterminingkey breaks or trend directionchanges and possible buy or

sellactiontriggers.It’s been my experience
that most important trendlines should remain on thechart for weeks, months, oreven years (especially ifmajor significant peaks ortroughs have beendetermined). It’s trulyamazing to me how often aprice will approach a longagomajor high or low (even10to15yearsagoor longer)

andbouncenearthoselevels.This fact can be used bytraders to help determinebuy/sell or scale-in/outstrategies. This may also beeffective for day and short-term trends, as well. Keyintraday and swing-tradetrend breaks, againaccompanied by big volume,will often be shorter-time-frametrendchangers.The length of time a trend

line has been in force is alsoanimportantfact toconsider.Themorepoints thatconnecton a trend line on any timeframeandthelongerthatlineis,themorevaliditbecomes.A break of that line can becritical. That’s why I payspecial attention to anylonger-term ormultiple-pointtrend line that is suddenlybroken, especially with aheavyvolumethrust.Whenakey price/volume thrust does

takeplace,itcanoftensignalatrendchangemaybetakingplace.Subscribers to my trading
service (thetechtrader.com)areoftenamazedwhenalineappears on a chart above orbelow the shorter-termintraday 1- or 5-minutecharts.Theyquestionwhyit’sthereandareastoundedwhenthe price of a stock on ashorter time frame

approaches a key level on adailyorweeklychartonly tobackawayfromresistanceorbounceoffsupportnearthoselinesonashortertimeframe,even on 1-minute intradaypatterns. By keeping moresignificant longer-term trendlines on the chart, you willhave added indicators as topossible resistanceorsupporton the longer time frame,which often will determinekey exit/entry levels for

shorter-termtraders.

■ ChannelsandAnglesOver the nearly 50 years oftechnical trading and relatedtrend-line drawing I’ve beeninvolved with, I’ve noticedthat the normal or regularbullishupchannel(orbearishdown channel) often movesin parallel channel lineformations and at

approximately 45-degreeangles.Thisfactalonecanbeveryhelpfultodetermineifatrend is moving at a regularpaceorgettingwayaheadofitself or lagging (especiallyonashorter-termtimeframe).This also can be very usefulin determining whether toexitallorpartialpositionsasthe trendmay be getting toooverbought or losingmomentum and possibly ripefor a pullback retrace or at

least a time-consumingconsolidation.In my mind, the major
usefulness of analyzingparallel up or down channelsis the possible determinationofwhenastockmaysoonbenear or at a point where thesharprunuptoachanneltopor spike down to a channelbottomcanresultinatleastafollowing time-consumingconsolidationthatcanlastfor

days,weeks,orevenmonths.Time-consumingpullback/retraces or lengthyconsolidations are not onlyinvestment momentumkillers, but contribute toanxiousness and oftenmistakes in the decision-making process. Remember,intrading,timeismoney,andexiting a full or partialposition at the right timecanenable the resourceful traderto better time exits and

entries. With this tradingprofit in hand, traders canlook for new tradingcandidateswith better timingandentrypointstobestutilizeor diversify trading capital. Irecommend that each traderdetermine what level ofpatience he or she can orwantstoexercise.Yourstrategywilllikelybe
determinedbythetimeframeyou have in mind after you

decide what time frame oftrading best suits yourpersonality and investmentgoals.To best determine the
proper angle and how/whereto draw trend lines, it iscritical to continuouslymonitorandadjusttheanglesofascentordecent.Theearlyangle of ascent or decent isvery often not the angle astock will take on its

intermediate or even longer-termtrenddirectionand,asaresult, changing the channelangles to conform to recentprice movement will greatlyassist traders in determiningthe channel top resistancepoints as well as channelbottomsupportlevels.Over my many years of
technicalanalysisexperience,andasaresultofasuggestionbyTomDemarkinoneofhis

booksontechnicalanalysis,Ihave determined that theinitial thrust a stock takes islikely not the angle it willeventually settle into. Byconnecting the first pullbacklowandsubsequentlows,youwill likely be better able todeterminewhatangleastockmay be taking on anintermediate or longer-termtime frame. When youconnectthesubsequentswingorintermediatehighs,aswell,

you’ll be amazed howparallel the channel mostoftenis!InFigure6.1,youwill see
thatGENTexplodedoutofafive-month base on its dailychartinlateJuly2013,withabreakaway gap on heavyvolume. That was followedby more upside progressioninterrupted by two mini bullwedges and a bull flag. Theangle of ascent was steady

and exceeded a very strong45 to50%angle inaparallelrising channel. The movecontinued for five monthswithoutevenbreakingits21-day moving average until itreached near $60 or morethana300percentgain!
FIGURE6.1Gentium(GENT)


Figure 6.2 shows thatPandora (P) started its majorascent near $7 in November2012 and moved steadilyhigher in a parallel risingchannelwithanear45-degreeangle. It also held its 50-daymoving average in theprocess about a half-dozentimes, until it reached justunder$32in12monthsforamore than 300 percent gain.Notice the various bull

wedges and flags along theway,aswell!
FIGURE6.2PandoraMedia(P)


Figure 6.3 shows GTNpopping out of a 16-monthbasing pattern in earlyJanuary 2013, with a pricevolumesurgeacross$2.50.Itthen quickly doubled to near$5 before consolidating in asix-week bull coil. That wasfollowed by another run tonear$7.50,resultinginabullwedge formation. The 45-degree rising channelcontinued into December

2013reaching justunder$14foragainofover400percentin less than a year, neverbreaking support! (Figures6.4 through 6.7 show risingchannel patterns on intraday1-minutecharts.)
FIGURE6.3GreyTelevision(GTN)


FIGURE6.4AFOP1-Minute


FIGURE6.5AMCC1-Minute

FIGURE6.6BITA1-Minute


FIGURE6.7STML1-min


Figure 6.8 and 6.9 showexamples of both rising anddecliningchannelpatternsondailycharts.
FIGURE6.8RNF2-Day


FIGURE6.9STML1-minute


■ Support andResistanceLinesMany of my subscribers andfollowers,aswellasguestsatmy seminars and conventiontalks, have commented thatthey were amazed at how,where, and why I draw mylines.SinceI’mabigbeliever

in prior support andresistanceasbeingvalidevenyears later, I will leave thelinesonmychartsformonthsand even years, as pricewilloften test or retest thoselevels when stocks changedirection and begin newtrends. It is truly amazinghow often the lines I drewmanymonthsoryearsearlierwill create formidableresistanceorsupporttoanewtrend, and I strongly suggest

that traders draw and usethese lines as targets andpossiblestopsaswell!Whenassessingthevolume
activityatornearapriorpeakor valley on a chart thatbecame amajor or importanthigh or low, it’s veryimportant to consider howheavy volume was at thatpoint to determine whetherthat level or zone might bemore or less formidable or

difficult for a stock to breakthrough.Ihavefoundthattheheavieravolumeclusterwasat a particular peak or valleyonachartpatterninthepast,the more likely that areacouldbemoredifficulttogetthrough, at least on the firstattempt for sure. It shouldalso be noted that the closerin time those highs or lowsmightbe, themore importantthe resistance or support islikely to be. It makes sense

that recent volume action ismore critical than action thattook place months or yearsprior because over a longerperiod of time investors willhavepossiblyexited someofthose positions and thevolume levels at those highsand lows may not beanywhere near as formidableas one might think.Regardless, those levelsknown to traders as priorhighsandlowswillstillactas
important chart points, atleast psychologically, andcloseattentionshouldbepaidtothem.Prior resistance highs and
supportlows,whenoccurringnear the same levels, shouldbe connected by drawinglines across those peaks andvalleys.ThatisCharting101.Charts with lines drawn atthose levels tend to havethose levels jump out at you

visually as reminders thatthose levels need to bemonitoredcloselywhenpriceapproaches them.Apauseorcountermovement or a movethrough those support andresistance levels, especiallywith high relative volume,may be signaling for adirectional change orconfirming a prior trendcontinuation.Figures 6.10, 6.11, and

6.12 are examples of keyintraday support/resistancelines.
FIGURE6.10RGDO1-min


FIGURE6.11KONG1-min


FIGURE6.12XPO1-min


■ Reviewingand AdjustingLinesOne of the more importantactionstotakewhenchartingis the continuous monitoringof price action and theresulting need to change oralter the support, resistance,and trend-line angles

(especially on intraday daytrading using 1- or 5-minutecharts!)Thisneedstobedonein order to gauge the properandmore important levels atwhichactionmayneed tobetaken. I have found that byconstantly alteringmyanglesand levels, my trading targetaccuracy and resultingpercentage of profitabletrades has immenselyincreasedovertheyears.Youneed to let themarket action

on a particular stock dictatewhereandatwhatangles thelinesshouldbedrawn,Ithinkmost of the readers of thisbook will greatly benefit bythe use and constant alteringof the lines they have drawnand highly recommend theactiveuseofthem.A general rule of thumb
when drawing and observingtrend lines is that an anglethataccelerates toofarabove

(or below) an approximate45-degree normal or regularangle in a rising (or falling)trend will becomeoverbought/oversold and ripefor profit taking. This willoccurbecausefastsharprisesor quick deep plunges at toosteep an angle most oftencannotbemaintainedforverylong before profit taking (orbargain hunting/shortcovering in the case of adowntrend) results in a

pullback retest at the veryleast. Too far too fast is mymotto when trading,especiallyinthefifthwaveofan advance or decline. I’llexpand on that morespecifically when we coverexitstrategiesinChapter7.

CHAPTER7
SettingTargetsandPriceObjectives

Therearemanymethodsfordetermining where and howtosettargetsandobjectivesintrading, and in this chapteryou will find several of myfavoritesthatyouwillwanttohaveknowledgeofinordertobe prepared to moreaccuratelydefineyourtradingobjectives.Someof themostpopular and, I find, quiteaccurate technical priceforecast tools are the

measuredmove,ElliottWaveanalysis,pricecycleanalysis,andFibonaccimeasurements.These historically provenmethods of analysis, whenlearned and added to yourtradingskillset,willgiveyoua terrific advantage overother, less knowledgeabletraders.

■ DeterminingExitPointsNo matter what your timeframe is, it’s extremelyimportant to know “when tosell.” Trading is certainlydifficult enough withoutknowingwhentosellorhowto set price objectives,especiallywhen intraday daytrading, but just as important

on all time frames with alltrading objectives in mind.There are several methodstraders have historicallytended to use, includingpercent gain targets orpercent loss stops, priceprojections based onfundamental values such asprice earnings ratios, and soon. However, I have foundover my nearly 50 years oftrading experience that usingmy technical analytical

methods of determining exitpoints or sell objectivesworksverywellfortheactivetrader.Determininghoworwhere
tosettargetsevenbeforeyouenteranorderisnotonlykeyin enhancing tradingprofitably, but also a majorfactor in gaining confidencein your trading ability. Besure to write down yourtargets when you have

determinedwheretosetthem.Then enter your exit or sellpoints immediately after yougetconfirmationofyourtradeentry.

UsingtheMeasuredMoveMethodDuring my 50-plus years oftrading experience, I havefound that stocks tend tomove in similar “measuredmove” increments. That is,thelengthofthepriorlegofamove can often be a gooddetermining factor as towhere the next move or upleg may find important orserious resistance and a

resulting probable good exitpoint, especially for the dayor short-term trader who isnotinterestedinwaitingoutapullback or consolidation,even if it turns out to bebullish in appearance orconstruction, simply becausetimeismoneyandfundsmaybebestusedelsewhereduringthis consolidation, resting, orretestingperiod.The completion of a

similar measured move iseven more reliable when itcoincides with otherimportantresistancelevelsonthe charts, such as previousoverhead resistance at earlierhighs, declining movingaverages, or channel bottomsand tops. However, in anycase, it’s very important touse the proper chart scalingmethods. (Figure 7.1 and 7.2are examples of measuredmovesondailycharts.)

FIGURE7.1AnikaTherapeutics(ANIK)


FIGURE7.2HimaxTechnologies(HIMX)


Figure 7.1 shows thatANIK began a move on itsdailychartinApril2013near12.25 and approximatelythreemonthslaterspikedtoanear-term top at 27.80 tocomplete a move of about15.50 points. It thenconsolidated in a coil-typepattern forabout twomonthsbefore beginning its next legup. Adding the 15.50-pointinitialmove to the beginning

of the next leg near 23.25,you have a target of 38.76.Two-and-a-half months laterANIK tagged 38.68, nearlyanexactmeasuredmoveforagainofnearly65percent!Figure 7.2 shows HIMX’s
daily chart displaying threemovesofapproximatesimilarmeasured move point lengthduring 2013. The firstexplosivemovestartedwithaprice/volume surge in

February2013fora5.19gaininlessthan90days.Thenextleg began three months laternear 5.57 and advanced to11.49injustfiveweeksforagain of 5.92. Finally, a thirdup leg began in earlyNovember near 8.13 and ranto 13.77 by late December,loggingagainof5.64pointsinaboutsixweeks!

TheFifth-WaveExitMethodforDayTradingDuringmynearly50yearsoftrading experience, I’vefound that incorporating afive-wave target method andexecutinganexiton the fifthwave very often is an idealpoint to at least partially, ifnot totally, eliminate yourday-trade position. My

experiencealsoshows this tobe especially accurate if it’saccompanied by strongvolume. My analysis ofthousands of intraday daytrades indicates that stockstend to move in five waves,after which a deeperpullback/retrace or moreextensive consolidation veryoftentakesplace.Often, the fifth wave can
be an intraday exhaustion

wave, especially if it occursbefore midsession. At thatpointastockwillhave likelymoved up sharply orsubstantially and may havegotten a bit ahead of itself,prompting profit taking byday traders (Figures 7.3 and7.4 are examples of intradayfive-wave moves and exitpoints).
FIGURE7.3GreyTelevision(GTN)


FIGURE7.4MellanoxTechnologies(MLNX)


GTNstartsthesessionwitha big gap to just under $10andsurgestonear10.65forasharpfirstupwave.Asecondwaveconsolidationbullcoil–typepatterndevelops.Thisisfollowedbythethirdlegfrom10.45 to 10.90, followed bywave 4 consolidation bullmini wedge, and finally afifth wave thrust to 11.20 tocomplete the five-wavemorningadvance.Noticethat

thestock thenpullsbackandmovesnarrowlysidewaysfortherestofthesession.MLNX also starts the day
with a solid gap up and runsfromabout36.25 to37.50 tocomplete the first leg, thenconsolidates in a 45-minuteearly micro bull coil beforeembarking on the wave 3advance to near 39.25. Afterthat, the fourth-waveconsolidation flag forms and

results in a five-micro-wavefifth leg to near 40.75 tocompletethefive-wavemovenear midday. Notice that it,too, thenmovessidewaysfortherestofthesession.

UsingLogarithmicorPercentScalingSince I have always highlyrecommended the use oflogarithmic or percentagescaling when trading (asopposed to arithmeticscaling),itshouldbeeasiertodetermine those exits points.It’s been my experience thatbecause of the adjusted logvalues, point values can andshould then be used to

determine targets. Afterdetermining those levels,youcan then better decide whereto enter a sell order at thedetermined possible exitpoints.On a logarithmic scale
chart, the vertical spacingbetween two pointscorrespondstothepercentagechange between thosenumbers.Thus,onalogscalechart, the vertical distance

between 10 and 20 (a 100percent increase) is the sameas the vertical distancebetween50and100.Becausethese charts show percentagerelationships, logarithmicscaling is also called“percentage” scaling. It isalsocalled“semi-log”scalingbecauseonlyoneof the axes(the vertical one) is scaledlogarithmically (Figures 7.5and 7.6 show the contrast ordifferencesoflogarithmicand

arithmeticcharts,examplesofsamechart,sametimeframe).
FIGURE7.5CSIQDaily101212to121512AnalogChart


FIGURE7.6CSIQDaily101212to121512LogarithmicChart


■ UsingFibonacci andElliott WaveCycleAnalysisI have foundover the courseof the past 20 years inparticular that adding ElliottWave andFibonacci analysisto my arsenal of analytical

tools has greatly enhancedmy successful tradingprofitability percentage.These analytical methods,when used in conjunctionwith standard technicalanalysis, can be verypowerful and should also beadded to your personaltradingtoolkit.They say a “little
knowledgeisdangerous,”andcertainly not having a firm

grasp of these tools inparticular can lead toconfusion since they usuallyoffer different what-ifscenarios. However, whenusedinconjunctionwithyourother technical tools andabilities, they can onlyenhance your total skill setand likely result in bettertradingsuccesses.

FibonacciAnalysisFibonacci retracement is avery popular tool amongtechnical tradersandisbasedonthekeynumbersidentifiedby mathematician LeonardoFibonacci in the thirteenthcentury. However,Fibonacci’s sequence ofnumbers is not as importantas the mathematicalrelationships, expressed asratios, between the numbers

in the series. In technicalanalysis, Fibonacciretracement is created bytaking two extreme points(usually a major peak andtrough) on a stock chart anddividing the vertical distancebythekeyFibonacciratiosof23.6percent,38.2percent,50percent,61.8percent,and100percent.Oncetheselevelsareidentified,horizontallinesaredrawn and used to identifypossible support and

resistance levels. Before wecan understand why theseratios were chosen, we needtohaveabetterunderstandingof the Fibonacci numberseries.TheFibonacci sequenceof
numbersisasfollows:0,1,1,2,3,5,8,13,21,34,55,89,144,andsoon.Each term inthis sequence is simply thesum of the two precedingtermsandsequencecontinues

infinitely. One of theremarkable characteristics ofthis numerical sequence isthat each number isapproximately 1.618 timesgreater than the precedingnumber. This commonrelationship between everynumber in the series is thefoundation of the commonratios used in retracementstudies.ThekeyFibonacci ratioof

61.8percent—alsoreferredtoas the “golden ratio” or the“golden mean”—is found bydividing one number in theseries by the number thatfollows it.Forexample:8/13=0.6153,and55/89=0.6179.The 38.2 percent ratio is
found by dividing onenumber in the series by thenumber that is found twoplaces to the right. Forexample: 55/144 = 0.3819.

The 23.6 percent ratio isfound by dividing onenumber in the series by thenumberthatisthreeplacestotheright.Forexample:8/34=0.2352.For reasons that are
unclear, these ratios seem toplay an important role in thestockmarket, just as they doinnature,andcanbeused todetermine critical points thatcause an asset’s price to

reverse. The direction of theprior trend is likely tocontinueoncethepriceoftheasset has retraced to one oftheratioslistedearlier.In addition to the
previously described ratios,many traders also like usingthe 50 percent and 78.6percentlevels.The50percentretracementlevelisnotreallya Fibonacci ratio, but it isused because of the

overwhelming tendency foran asset to continue in acertain direction once itcompletes a 50 percentretracement.There is not any strictly
rational reason why stockprices should behave asFibonacci analysis predicts.While it is true that thegolden ratio appearsfrequentlyinnature,thisdoesnotinanywayimplythatwe
shouldexpectittoplayaroleinfinancialmarkets.Afterall,rabbit population growth hasvery little to do with stockprices.However, it would be a
mistake to dismiss Fibonaccimethods as uselesssuperstition. The fact is thatthere are many active sharetraders who use Fibonacciretracements and extensionstoguidetheirtradingstrategy.

If enough traders use andactonFibonaccianalysis,themethodwillwork, regardlessofwhetherithasanyrationalbasis(eventhoughitdoes).Inthe short term at least, evenill-foundedtheoriescanmovemarkets. Regardless ofwhether Fibonacci explainedinanywaywill influencethemarket, the use of thisanalysis by many tradersleads to an overall self-fulfilling prophecy in stock

prices. Phenomena like theseare not uncommon inmarkets, and in fact, marketpsychology is a major focusof study in the field ofbehavioraleconomics.Inessence,whileFibonacci
retracements and extensionsmay not have any real basisfrom a strict financialanalysisperspective, theyarea useful tool for predictingthe behavior ofmany traders

operating in the market. Forthis reason, Fibonaccianalysis can be an effectivepart of an overall tradingstrategy.The key is to develop an
understanding of how othertraders are applyingFibonacci analysis. Targetselection is also important. Ifpast price movements of astock appear to conform toFibonacci predictions, then it

is likely that traders usingFibonacci analysis are activein the trading of thatparticularstock.This in turn improves the
odds that Fibonacci analysiswillbeeffectiveinpredictingthe futuremovements of thatstock. Applied with athorough understanding ofhow and where other tradersare using it, Fibonacciretracements and extensions

canbesolidtoolinincreasingtraders’oddsandaccuracy!

ElliottWaveCycleAnalysisRalph Nelson Elliottdeveloped the Elliott WaveTheory in the late 1920s bydiscovering that stockmarkets,thoughttobehaveina somewhat chaotic manner,in fact traded in repetitivecycles.Elliott discovered that
these market cycles resultedfrom investors’ reactions to

outside influences orpredominant psychology ofthe masses at the time. Hefound that the upward anddownwardswingsofthemasspsychology always showedup in the same repetitivepatterns, which were thendivided further into patternshetermedwaves.Elliott’s theory is
somewhat based on theDowtheory in that stock prices

move in waves. Because ofthe “fractal” nature ofmarkets,however,Elliottwasable to break down andanalyzetheminmuchgreaterdetail. Fractals aremathematical structures,which on an ever-smallerscale infinitely repeatthemselves.Elliottdiscoveredthat stock-trading patternswere structured in the sameway.

MarketPredictionsBasedonWavePatternsElliott made detailed stockmarket predictions based onunique characteristics hediscovered in the wavepatterns.An impulsivewave,which goes with the maintrend, always shows fivewaves in its pattern. On asmaller scale, within each of

the impulsive waves, fivewavescanagainbefound.Inthissmallerpattern, thesamepattern repeats itself adinfinitum.Theseever-smallerpatterns are labeled asdifferentwavedegrees in theElliott Wave Principle. Onlymuch later did scientistsrecognizefractals.In the financial markets,
we know that “every actioncreatesanequalandopposite

reaction” as a pricemovement up or down mustbe followed by a contrarymovement. Price action isdivided into trends andcorrections or sidewaysmovements.Trends show themaindirectionofpriceswhilecorrections move against thetrend. Elliott labeled theseimpulsive and correctivewaves.

■ TheoryInterpretationThe Elliott Wave Theory isinterpretedasfollows:
■ Every action isfollowedbyareaction.■ Five waves move inthedirectionofthemaintrend followed by threecorrective waves (a 5-3move).
■A5-3movecompletesacycle.■ This 5-3 move thenbecomes twosubdivisions of the nexthigher5-3wave.■ The underlying 5-3patternremainsconstant,though the time span ofeachmayvary.
Let’s have a look at thefollowing chart made up ofeightwaves(fiveupandthree

down)labeled1,2,3,4,5,A,B,andC.In Figure 7.7 you can see
that the three waves in thedirection of the trend areimpulses,sothesewavesalsohavefivewaveswithinthem.Figures7.8and7.9showthatthe waves against the trendare corrections and arecomposedofthreewaves.
FIGURE7.7ThreeWavesinTrendDirection

FIGURE7.8ThreeWavesagainstTrendDirection1

FIGURE7.9ThreeWavesagainstTrendDirection2

The corrective waveformation in Figure 7.10shows that normally it hasthree distinct price

movements—two in thedirection of the maincorrection(AandC)andoneagainstit(B).Waves2and4in Figures 7.8 and 7.9 arecorrections. These waveshave the structure seen inFigure7.10.
FIGURE7.10A&CImpulseWaves

Note that waves A and Cmove in the direction of theshorter-term trend, and

therefore are impulsive andcomposed of five waves,which are shown in Figure7.10.An impulse-wave
formation, followed by acorrective wave, form anElliott Wave degreeconsisting of trends andcountertrends. Although thepatterns pictured are bullish,the same applies for bearmarketswherethemaintrend

isdown.

■ Series ofWaveCategoriesThe Elliott Wave Theoryassigns a series of categoriesto the waves from largest tosmallest.Theyare:
■Grandsupercycle■Supercycle■Cycle

■Primary■Intermediate■Minor■Minute■Minuette■Subminuette
To use the theory ineveryday trading, the traderdeterminesthemainwave,orsupercycle, goes long, andthen sells or shorts theposition as the pattern runsoutofsteamandareversalis

imminent.

CHAPTER8
WhatKindofTraderAreYou?
In my opinion,predetermining exit points isa critical skill to learn andneeds to be knownbeforehand and enteredshortly after you havereceivedconfirmationofyourentryexecution.Bydoingthisimmediately (and keepingthat sell order active), youwill create a disciplinedapproach to exiting at least apartial position and enhance

your probability of aprofitable trade. We havealready discussed severalmethods used to determinewhere and when to considerexiting partial or full tradingorlongercorepositions.Theyinclude the fifth-wave exits,as well as measured moveexits,Fibonacciretracements,andElliottWaveprojections.However, let’s start this
chapter with a determination

ofwhatkindoftraderyouarebefore we can discuss exitmethods, as they differsomewhatdependingon timeframe parameters. Decidingyourtimeframecomfortlevelwillhelpdetermineyourexitpoints.Day trading takes much
moredisciplinethanswingorlonger-term trading becauseyou do not have as much“wiggle room” or flexibility,

since the goal is to be back“in cash” by the end of thetrading session. You willneed to be much moreprotective of your capital toavoid sharp intradaypullbacks or breaks of keyintraday support so as to beable to tradeanotherday!Asaresult,tighter,moredefinedrulesofexitareneeded.Tighter protection may,
and often does, result in day

traders’ exiting positionswhen they least expect anexecution to occur, and canandwillresultinsmalllosses.I want to emphasize thatsmaller, quicker losses arepart of the day-trading gamebut can and do usually getquickly compensated for bythesolidanddisciplinedday-trade runner position thatresults in big-percentage daytradetowipeoutanysmallerlosses that a tighter-

disciplined trader mayexperience.Wediscussedthemeasured
move in a prior chapter, andI’vefoundovertheyearsthatby measuring the priorintraday move and adding itto the most recent low, onecan project a possible day-trade or scalp exit point,which, more often than onewouldexpect, turnsout tobea terrific point to at least

partially exit a position. It isworthrepeatingherethat“thepriorlegofamovecanoftenbe a good determining factoras towherethenextmoveorup legmay find importantorserious resistance and aresulting probable good exitpoint, especially for the dayor short-term trader who isnotinterestedinwaitingoutapullback or consolidation.”It’sagoodpoint tobeawareof!
IalsotouchedonFibonacciand Elliott Wave analysis asmethods for determiningtargets.Itdoes,however,takea much more detailedknowledge of thosedisciplines tobesuccessful. Irecommend that you read upon those theories andmethods of price forecastingand learn them well beforeyoutrytoincorporatetheminyour everyday trading toolbox. Without solid

understanding and extensiveexperience using them, Iwouldavoidrelyingonthem,as“a littleknowledgecanbedangerous.” If, however,whatyouareseeingbasedonthose disciplines is inagreement with your othertechnical analysis skill sets,then you have a higherprobability of correctlyforecasting key levels to beaware of and possibly takeactionbyenteringexitorders

withyourbroker.Forstarters,pleaserefer to
myearliercommentsonthosemethods in the precedingchapter to gain at least arudimentary knowledge ofwhattheyareabout,andthendo some extensive readingfrom amore detailed source.There are many booksavailableonthosesubjects.Oneofthemostfrustrating
and annoying day-trading

mistakes for traders is whenthey are trading a stronglytrending intraday pattern andinvariably exit their positionway too early.Watching thestock move substantiallyhigher can be extremelyfrustrating. Inorder toassurethat a trader “stay in theposition” to “milk theintraday trend,” I havedeveloped a three-tiertargetedapproach.

Obviously, you will needto determine first if yourintention is to scalp the tradeordaytradeitandexitlateinthe session and go to cashovernight (which Iwholeheartedly recommend).Sometimesadecisionismadeto scalp a trade, only to findoneself in a very stronglytrending stock with hugevolume. This is obviously agood thing and a pleasantsurprise, but the trader needs

to be vigilant and flexible inhis or her approach.Obviously,byswitchingyourobjective, you will eitherextendyourprofitsorquicklygivethemback.ThisiswhyIhighly recommend not onlysettingstopsbutbeingalerttopossibly having to raise orlower them depending onprice/volumeaction.Havingsaid this, Iwant to
show you my most favored

exiting methods to protectprofits and at the same timegive you the flexibility to atleastpartiallystayinsomeofthepositionslonger.
■WheretoSetTargetsAfter you have done yourscans, examined premarketmovements,andreviewedthevarious individual technicalindicators, as well asreviewed potential support,resistance, moving averages,andtrendlines,youshouldbeready to set targets. I always

recommendusinga three-tierapproach to setting targets. Ilike to exit at least a quarterto half of the position whentier 1 is achieved. That willensure at least a solid partialprofitable trade.When tier 2is achieved, another portionofthepositioncanandshouldbe exited. When and if thethirdtierisreached(whichonagoodportionoftradesisnotachieved), you will have adefinite choice to exit or

tightenyourstop.Inanycase,if you are day trading, theobjective is to be out of thetrade by the end of thesession.Noexceptions!Other methods of
determining target/exit pointsinclude the previouslymentioned measured moves,Elliott Wave extensions,and/or Fibonacci levels aswell.Whenthesemethodsareused together with standard
technical analysis methods,increasedaccuracywilllikelybeachieved.My most successful day
trades have occurred when Iwas able to at least partially“stay in the trend.” Traderstend to want to exit tradeswith profits, and that’sobviously the main purposeof trading—to “makemoney.” Certainly, thediscipline needed to continue

in a positionwhen the profityou have is tempting to takeis a skill most want to haveandstrivetolearn.Youcan’talways go on gut feel,althoughtheveryexperiencedtrader with many years oftrading under his or her belthaslikely,toacertainextent,learnedthisfromyearsofhit-and-miss tradingandperhapslarge drawdowns in theirportfolio.

I must admit that I andmany successful traders Ihave known have gonethrough scary and frustratingdown periods, likely becausemany of us were not asdisciplined as we are now.One of the purposes of thisbookistohaveyougleanthisknowledgewithout having tospend years learning it thehardway.Premarket, when I do my

technical analysis of a chartpattern I’m consideringtrading or recommending tomy subscribers, I firstexamine the 1-minuteintraday pattern for bullishsetups, or if the stock isgapping due to importantnews, I look out further timeframe–wise, perhaps 5 or 15minutes, to see what actionoccurred during the last fewsessions that could be a keysupport or resistance zone. I

will always at least look atthedailypatternstoseeifanylevels jump out at me asbeing important, which maynot have been obvious on ashorter time frame. Thiswillaid me in determining mythree-tier targets for my daytrade.Prior support, resistance,
trend lines, and movingaveragesshouldbetakenintoconsiderationandvolumethat

may have occurred at thoselevels should also beconsidered, as it will likelyaddtothoselevels’beingkeyones.Once you have considered
thepatternsandtechnicalsonthose time frames, you willbemoreprepared toestimatelevels or tiers and be able toset intelligent and morereliabletargetswhereyoucanscale out of your day-trade

positions.In conjunction with my
chapteronhowtodrawtrendlines, if you have previouslyused my trend-line drawingmethods, you may havealready drawn lines at someof those support/resistancelevels.Thiswillassistyouinmore easily determiningwhere some of those exitpointsmaybe.Itshouldmakethe jobofdeterminingwhere

to set these targets andresulting exit points a loteasier and more obvious,especially when you’ve usedthemforawhile,havegottenused to drawing them, and,most important, leaving themonthechartuntilitisdeemedno longer necessary orrelevant.

CHAPTER9
DeterminingandSettingStops

Trading is treacherous anddifficult at best withoutprotective stops, and likelyeventual financial suicidewithoutusingthem.Themostimperative rule of trading ispreservationofcapitalsoyouwill be able to trade anotherday. Once your capitalposition is draineddramatically or lost entirely,you are financially, if notmentally,done.Thestop-loss,

when logically applied, willnormally prevent the big,disastrous loss. The mostimportant task, other thanstock selection and thedetermination of your targetsand exit points, is where tosetyourprotectivestop-loss.Whenseekingwheretoset
keystoplevels,Ihavealwaysrecommended looking forimportant chart points oftechnical support/resistance

from previous highs andlows,short-andintermediate-term trend lines, andmovingaverage levels. When morethanoneofthosepricepointscoincide at or near the samelevels,itaddscredencetoandvalidates the chosen exitstrategies and should add toyour confidence level insettingthosetargets/stops.During the intraday rising
channel or trend, it is

recommended thatyourstopsbeadjustedorraisedtoreflectthe various new intradaysupport levels beingdeveloped as the chartdevelops.Theseshouldbesetbelowminorpullbacks/retestswithinthetrend.

■SettingStopsWhereImportantPrice SupportLevels AreViolatedIn an uptrend or risingchannel of any time frame,

it’s important to heed anymovement that moves belowa previous low on any timeframeortakesoutorviolatesa previous low, especially ifthis occurs accompanied bystrong volume increases andpronouncedsellingpressure.The tough part is
determining when it’s an“important violation” and ifthat violation gets a follow-throughwithvolumeaswell.

Thefollow-throughiskeyformeindeterminingwhethertotake action or if it’s just a“one-dayanomaly.”My personal preference is
to tighten the stop to a leveljust below the last intradaypullback low, as a violationof that level could besignaling a loss of intradaymomentum,possible pendingrollover or a possible time-consuming consolidation

period ahead. It certainlysignals that at least a short-term trend may have beenviolated.Thisappliesaswellin a downtrend whenimportant resistance it takenout with volume as well,perhaps signaling that a keytechnical breakout could begettingstarted.

■SettingStopsunder KeyTrend-LineViolationsOvermymanyyearsof trial-and-error trading usingstandard technical analysis, Ihave found that trend linesand rising channels are

probably the most importantand useful tools indetermining if a trend iscontinuing to extend orbreakingand/orreversing.It’s always been clear to
me that stocks in motion ortrending are inclined to stayin motion and keep trendinguntil that trend is obviouslyaltered or violated.Remember this phrasebecause it holds true in so

manycasesand isoneof thebasic rules of technicalanalysis.Theonlyproblemisdeterminingif,infact,astockis indeed “trending” (pleaserefertoChapter6ondrawingtrendlines).In addition to important
price support violation withvolume, trend line andchannelbreaksusually signalthat a pending reversal maybe under way or beginning.

You will find that this veryoften coincides with animportantpricesupportbreakand adds credence andvalidation when at least twokey levelsaresimultaneouslyviolated, especially withextraordinary volumeaccompanyingthebreak.

■SettingStopsUsing KeyMovingAverageViolationsMostofthesuccessfultradersI’ve known use key movingaverages on their charts tohelp determine key support

andresistancepoints,aswell.Over the many years I’vebeen trading and advisingtraders on my site, I havedetermined that the 10-, 21-,and 50-period movingaverages are best used fortrading on all time frames,evenintradaytradingusing1-minutecharts.Aviolationofanyorallof
thosemoving averages couldalsobenotonlyanindication

of a trend change but a keyalertsignaltosetstopsbelow,if you have not already doneso.Whenusedinconjunctionwith key support/resistanceviolations and trend-line/channel violations, itfurther adds to the possibletrend break probability andshould be a confidencebooster in determining yourdecision for action. (Chartexamples of key movingaverage, trend-line, and price

support violations used totrigger stops are shown inFigures9.1and9.2).
FIGURE9.1Rentech(RNF)
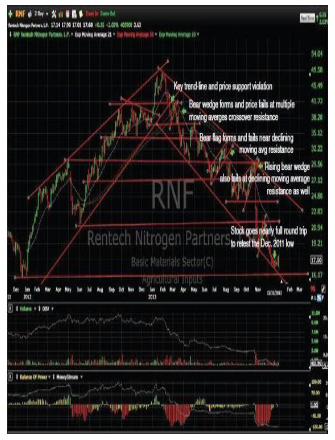

FIGURE9.2CalumetSpecialtyProducts(CLMT)


In Figure 9.1 we see thatRNFwas ina stronguptrendfrom December 2011 toFebruary 2013, running fromnear $16 to over $49, nearlytripling its price. Then adramatic downside reversaltookplace,droppingit$10injust twoweeks.Thatcrackedthe major up channel andsimultaneouslyalsobrokethe10-, 21-, and 50-daymovingaverages. The first bounce

failed to take out thosemoving averages, and thestock rolled over again,forming several bear flagsandwedges over the next 11months,which saw itdeclinein a steady down channelbacknearthe$17level.Figure 9.2 shows that
CLMTrosesharplyinafive-wave advance from October2011 to March 2013,approximately tripling in
price during that time frame.Then a downside gap andprice reversal in late March3013 triggered a newdowntrendwithmultiplebearflags and wedges along theway,whichalsosawitviolatetwoimportanttrendlinesandits key moving averages andprice support at midyear.Subsequently, the stockcontinued its decline fromover$40tounder$25.
We’ve learned that acombination of price supportviolation with either keymoving average or trend-lineviolation can be a powerfulindicatoroftrendchange,andproper stops should be setunder those levels with a bitof leeway to protect fromwhipsaws (getting stoppedbecausethestopsweresettooclosetothoselevelsandthenwatchingthestocksnapbacksharply, reestablishing the

existingtrendrightafteryourstop took you out). Howmany of you haveexperienced that just toooften?Tightening stops, of
course, can be done after thefirst level or tier is reached,but care must be taken andclose attention paid towhereyou adjust them. One of thebiggest complaints of mosttraders I have known,

especially those not highlyexperienced, is setting a stoptoo close and getting takenout, only to see the stockquickly turn around rightafter they have exited andthenrunupsharply.Again, I do not advocate
trading without set stops—ever!ButIhavefoundinmymany discussions withseasoned traders who knowwhere key support may be

that they sometimes usemental stops, although Ipersonally will not let myemotions interfere with thatdecision, and neither shouldyou.If a stock is stopped and
then turns around, you canalwaysreenterifitcallsforit,especially if it breaks backoutoverakeyresistancelevelwith a strong price/volumesurge.Iamtrulyamazedhow

few traders will allowthemselves toquickly reentera position, sometimes veryquickly, after a stock wasmarginally stopped andturned around sharply,breaking back out. Manytraders’ egos will not allowthemtoreenterapositionthatjustresultedinaloss.Tradersoftentellme,“Itleftmewitha negative opinion of it” or“Once a stock burns me, Iwon’t trade it again.”

Amazing! Some of my besttrades ever have occurredright after Iwas stopped andwent back in because thetrend quickly reestablisheditselfwithastrongthrust.It’s my strong belief that
most stops that are violatedare due to an incorrectmethod of setting a stopbased only on a percentagelossbasis.What’s the logicalreasoning for that? Why
wouldn’t a trader considersetting stops just belowbreaks of important trendchannels, moving averages,or simply previous pricesupport breaks? My manyyears of trading experiencehavetaughtmethat thesearethe technically logical pointstosetprotectivestops.The question most often
asked of me is: if a keyprevious low and resulting

price violation occur, wheredo I set a stop? The answeroften depends on your paintolerance,butIwillthenlookatroundnumbers,ifany,justbelowthebreaklevel.Roundnumbers are alsopsychological levels andwhen violated often canaccelerateastock’sdecline.Atleastanadditional1to2
percent leeway below aviolatedlevelissuggested,or

abitmoredependingonyourtime frame. Swing andintermediate traders maywanttosetthestopwithabitmore leeway to avoidstopping a longer-termposition. Either way, stopsare amust especially fordayandswingtradersandgettingcomfortable knowing whereto set them is a must fortraderstolearn.Because humans have

emotionsandmaybeat leastpartially irrational whenemotions are part of theequation, properinterpretationofthekeystockmovement is sometimesskewed. This can result inmisreadingthemeaningofanimportantmove and result inimproper judgments andopinions. However, thedisciplined trader must havetaken action to preservecapital, and this is why
learning to set protectivestops is most valuable andquite critical for your long-terminvestmentsuccess.

CHAPTER10
TechnicalDivergences

andLossofMomentum
The divergence of stockprices from their ongoingangle of ascent and/ordivergence from theirunderlying technicals can bethe first sign of a loss ofmomentum and is a direwarning sign of potential
trendchange.When analyzing the wide
variety of underlyingtechnicalindicatorswhichareprovided on most chartingservices,Ifocusonjustafewsuch as MoneyStream,Balance of Power, andVolume Buzz (WordenBrothers’ proprietarytechnical measurements),totalandrelativevolume,on-balance volume, stochastics

(an oscillator-like indicatormeasuringoverbought/oversold) andrelativepricestrength, just toname a few. It’s never a badthing to analyze as manyindicators as possible to getconfirmation of a price trend(or divergences if they areoccurring). However, Ibelieve in keeping it simple,as toomuch information canbe confusing and evenoverwhelming, especially for

the inexperienced or novicetrader trying to learn thebenefitsoftechnicalanalysis.Even the experienced tradercangainclaritybyusing justa few of the indicators Irecommended earlier andeliminating some of the“noise” that too manyindicatorscancause.I realize that many
opinions in the technicalanalysis universe differ as to

which indicators are mostaccurate or powerful indetermining the validity of atrend or price movement ineither direction (long orshort). However, my nearly50 years of heavy tradingexperiencehasshownmethattheindicatorsIrecommendinthis book to be among themostusefulandaccurateonesout there. I strongly believethat focusing your attentionon them and gaining

familiarity with them willgreatly enhance your tradingaccuracyandprofitability.

■ Price TrendAngleDivergencesIn my opinion, probably thesingle most importanttechnical factor to watch foron any time frame is thedivergence of price fromtrend. This is usuallyindicated by the break of

trend-line angles and/orviolation of key movingaverages, especially whentheyoccuratornearthesametime.Thisisoftenaprecursorto impending trend changesand should be closelymonitored especially if theothers indicators Imentionedabove are confirming that atrend change is likely takingplace, as action may bewarrantedwhenitoccurs.
Pricedivergences from theprice trend angle whenaccompanied by a dramaticchange in volume or a“price/volume thrust” in theopposite direction of thepreviousongoing trend is thekey forme in realizingwhena stock may be at or near adramaticchangeindirectionWhenyoulearntoobserve
these pending changes, yourability to take action and

protect your capital positionwillbegreatlyenhanced.

■ UnderlyingTechnicalsDivergingfromPriceOne of the most powerfultools in technical trading isthe ability to spot anydivergencesintheunderlyingtechnicals from the price

trenditself.I’vediscussedtheones I favor earlier, and theinabilityofanyandespeciallyseveral of those indicators tokeep pace with price can beveryimportantindeterminingifyouwillneedtotakeactionsuch as exiting or tighteningstops.Examplesofbothpricedivergences from trend angleand underlying technicalsnonconfirming negativedivergences can be seen inFigures10.1and10.2.

FIGURE10.1MarkwestEnergyPartners(MWE)


FIGURE10.2PDCEnergy(PDCE)


Figure 10.1 is an MWEdailychartdisplayingarisingprice trend during 2013,havingarunfrom$47to$75.However, it also shows adeterioration andnonconfirmation of theunderlying technicals(specifically, the on-balancevolume, Balance of Power,andandMoneyStream)attheOctoberandNovemberhighs.Subsequently, the price

pattern diverged from thetrend line and rolled overhard,anddroppedbacktothelow$60s at thiswritingwithtwo bear wedges formingalongtheway!PDCE was in sharply
rising parallel up channelfrom June 2012 to October2013 running from $19 to$74.However, over the finalsixmonthsoftheuptrend,thenew highs were not

confirmed by the underlyingtechnicals, telegraphingsomekey negative divergences.Price soon diverged fromtrend and rolled over at thebeginningofNovember2013andmovedlower.I especially favor Worden
Brothers’ Balance of PowerandMoneyStreamproprietarytechnical indicators toconfirm or deny that a trendis continuing its momentum

and have been using themregularly for the past 20years. Following is anexplanation of what they areintendedtoindicate.

■ Balance ofPowerBalance of Power (BOP) isthe exclusive intellectualpropertyofWordenBrothers,Inc.ItwasdevelopedbyDonWorden, a leading technicalinnovator.BOP tells youwhether the
underlying action in thetrading of a stock is

characterized by systematicbuying (accumulation) orsystematic selling(distribution). The singlemost definitive and valuablecharacteristic of BOP is apronounced ability tocontradict price movement.BOP goes far beyond the“divergences” that manytechnical indicators arecapable of. In divergenceanalysis, the price and theindicator tend to move

together. A divergence isdetected when, for example,the price makes a new highand the indicator fails toconfirm.BOPiscapableofoutright
contradiction.Thus,whiletheprice is attaining new highs,BOP may very well beattaining new lows. It is notunusual for BOP to move inthe exact opposite directionofprice.

BOP is plotted above andbelowazeroline.However,itisnotanoscillator.Itdoesnotswing up and downwith theprice. It goes its own way,often quite independent ofprice movement.When BOPis above the zero line, it isdepicting systematic buying.Whenitisbelowtheline,itisrevealingsystematicselling.For convenience, BOP is
plotted in color. Green

signifies dominant buying,red dominant selling. WhenBOPisclosetothezeroline,revealingnocleardominanceof either buying or selling, itis plotted in yellow. (This isallpatternedafterstopandgolights.) For even greaterconvenience, the price barsareplottedinthesamecolorsas the corresponding BOPbars below. It is possible tointerpret BOP using only thecolored price bars. This is a

boon to those who havedifficulty rectifying thespatial relationships inherentinchartreading.BOPfitsintoacategoryof
devices that can be termedtrend quality indicators. Avariety of methods leadnaturally to buy and sellsignals. What BOP tells youissomethingaboutthequalityof the underlying trend. Notitself a pinpoint timing

indicator, BOP will modifyyour assessment of the vitalrisk-rewardratioofatradeorinvestment. It will help youdetermine whether thesupply-demand balance willbe in your favor. Itwill helpyouspotchangesofcharacterinastock.BOP brings out hidden
patterns of accumulation ordistribution, and it does sowith great reliability. But,

yousee,asignificantincreasein price is not the inevitableresult of informedaccumulation. Distributiondoes not inevitably lead to acollapse in price. Evenwell-informed buyers and sellerscan be wrong about futureprice trends. BOP offers aninside glimpse of informedaccumulationordistribution.Let us just say that if you
invest consistently in the

same direction as informedmoney, your chances ofsuccess will increasesignificantly. Watchparticularly for changes incharacteratpotentialtopsandbottoms. Be suspicious ofstocks in which BOP hasn’tworked well. If the BOPpatternwasmisleadinginthepast,itwillprobablycontinuetobesointhefuture.The BOP scale runs from

100 to –100. The indicatoritselfcanriseaboveorbelowthese extremes, but it isrelatively rare. When ithappens,we just truncate theprofileatthetoporbottomofthe chart. Since the scale isconsistentfromcharttochart,you are able to make directcomparisons from stock tostock. Some will ask, whichis the most important: (1)whether BOP is above orbelow the zero line or (2)

whether the direction of theBOP profile is up or down,whichistosay,whetherBOPisimprovingordeteriorating?OffirstimportanceiswhetherBOP is above or below thezero line. This indicatesdominantbuyingorsellingonanabsolutebasis.However,apositive BOP with adeteriorating pattern can besignificant as well, but onlyinadivergentsituation.Thus,apositiveBOPmovingdown

in tandem with an erodingpricecouldnotbeinterpretedbearishly.ButapositiveBOPmoving down into a risingprice must be construedbearishly. This would be allthe more so if the price isactually attaining new highs.Conversely, a positive BOPmovingupintoafallingpriceshould be interpreted as apositive, and all themore soif the price is breaking so-called “support levels.”

Where absolute BOP versusimproving or deterioratingBOP seem to becontradictory, you will oftenfindthattheanswerliesinthetime implications. AbsoluteBOP (green or red) usuallyhas the longer-termimplications.One lastpoint:Beforeyou
arrive at a decision on anystock,checkBOPinavarietyoftimeframes.

■MoneyStreamThe CumulativeMoneyStream (CMS) wasalso developed by award-winning technician DonWorden and is the exclusiveintellectual property ofWorden Brothers, Inc.MoneyStream grew out ofjoint venture with a large

regional brokerage firm todevelop a price/volumeindicator. The result is anindicatorwithmuchthesameobjectives as OBV. CMS isinterpreted in the same wayyou would interpret OBV.Generally, you look fordivergences.Important divergences can
beseenataglance,owingtoour use of automatic linearregression lines in both the

price and indicator profiles.Thechartissetupsothatyoucanmake direct comparisonsbetween the slopes of thepriceregression linesand theindicator regression lines.(However, do not neglect tolook closely for movementsnot necessarily reflected inthe regression line, which ismeantasahelp,notacrutch.)If the CMS regression linesareslopingupwardatgreateranglesthanthoseoftheprice,

the message is bullish, andviceversa.The main difference
between OBV and CMS isthatCMShasagreaterabilitytocontradictpricemovementthan OBV does. This isachieved by using all of theelements within the dailyprice bar rather than just theclose. The high, low, close,anddailyrangearerelatedtovolume in a unique and

proprietary way. You maywish to compare CMS andOBV in a variety of stocksand time frames. Generally,you will find that CMS hasthe greater predictive power—butnotalways.SometimesOBVdoesthebetterjob.Themore things you look at, andthe more time frames youhabitually check out, thebetteryouaregoingtodo.MoneyStream was

developed after years ofexperiencewithprice/volumeindicators. In addition to JoeGranville’s OBV, ideas byDavid Bostian and MarChaikin were influential inthe formulation. The finalresult embodies a method offiltering outwhat is believedto be a logical error in thepreceding indicators.CMS isnot as volatile as Bostian’sandChaikin’screationsandithasmorepower tocontradict

thanOBV.CMS works very well in
conjunction with BOP. CMSand BOP are based onentirely different conceptsand sometimes they disagreecompletely. The idea is towaitformutualconfirmation.Together they are potentmedicine. CMS lends itselfbetter to precise timing thanBOP.ThisisbecauseCMSisaffected considerably by the

price trend itself. BOP,however, is incomparable atferreting out hidden patternsof accumulation ordistribution.MoneyStream has the
option to be plottedwith 30-and 100-period linearregression lines on theMoneyStream graph and theprice graph so you cancomparethetrendsofthetwographs.
■ On-BalanceVolume andDivergencesOBV measures buying andselling pressure as acumulativeindicatorthataddsvolume on up days andsubtracts volume on downdays.OBVwasdevelopedbyJoe Granville and introduced
inhis1963book,Granville’sNew Key to Stock MarketProfits.Itwasoneofthefirstindicatorstomeasurepositiveand negative volume flow.Chartists can look fordivergences between OBVand price to predict pricemovements or use OBV toconfirmpricetrends.

CalculationThe OBV line is simply arunning total of positive andnegative volume. A period’svolume is positive when thecloseisabovethepriorclose.Aperiod’svolumeisnegativewhen the close is below thepriorclose.

InterpretationGranville theorized thatvolume precedes price.OBVriseswhenvolumeonupdaysoutpaces volume on downdays.OBVfallswhenvolumeon down days is stronger. Arising OBV reflects positivevolumepressurethatcanleadto higher prices. Conversely,fallingOBVreflectsnegativevolume pressure that canforeshadow lower prices.
Granville noted in hisresearch that OBV wouldoften move before price.ExpectpricestomovehigherifOBV is risingwhilepricesare either flat or movingdown.Expectprices tomovelowerifOBVisfallingwhileprices are either flat ormovingup.TheabsolutevalueofOBV
is not important. Chartistsshould instead focus on the

characteristics of the OBVline.First,definethetrendforOBV. Second, determine ifthecurrent trendmatches thetrend for the underlyingsecurity. Third, look forpotentialsupportorresistancelevels.Oncebroken,thetrendfor OBV will change andthese breaks can be used togenerate signals. Also noticethatOBVisbasedonclosingprices. Therefore, closingprices should be considered

whenlookingfordivergencesor support/resistance breaks.And, finally, volume spikescan sometimes throw off theindicator by causing a sharpmove that will require asettlingperiod.

DivergencesBullish and bearishdivergence signals can beused to anticipate a trendreversal. These signals aretrulybasedonthetheorythatvolume precedes prices. Abullish divergence formswhen OBV moves higher orforms a higher low even aspricesmove loweror forgealower low. A bearishdivergence formswhenOBV
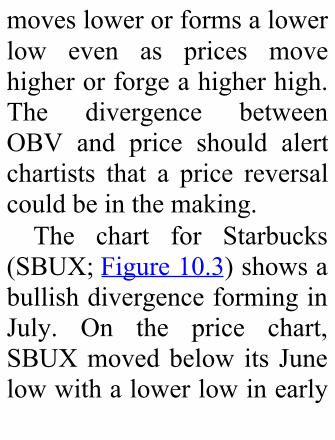
moveslowerorformsalowerlow even as prices movehigherorforgeahigherhigh.The divergence betweenOBV and price should alertchartists that a price reversalcouldbeinthemaking.The chart for Starbucks
(SBUX;Figure10.3)showsabullishdivergenceforminginJuly. On the price chart,SBUXmovedbelow its Junelowwithalowerlowinearly

July. OBV, however, heldabove its June low to formabullish divergence. OBVwent on to break resistancebefore SBUX brokeresistance.Thiswasaclassiccaseofvolumeleadingprice.SBUX broke resistance aweek later and continuedabove 20 for a 30-pluspercentgain.
FIGURE10.3Starbucks(SBUX)


Figure 10.4 shows OBVmoving higher as TexasInstruments (TXN) tradeswithin a range. Rising OBVduring a trading rangeindicates accumulation,whichisbullish.
FIGURE10.4TexasInstruments(TXN)ShowingConfirmingBullishOBV


The chart for Medtronic(MDT; Figure 10.5) shows abearish divergence withvolume leading price lower.Thebluedottedlinesidentifythe divergence period. MDTmoved higher (43 to 45) asOBV moved lower. Alsonotice that OBV brokesupport during thisdivergence period. Theuptrend in OBV reversedwith the break below the

February low. MDT,however, was still movinghigher. Volume ultimatelywon the day as MDTfollowedvolumelowerwithadeclineintothelow30s.
FIGURE10.5Medtronic(MDT)ShowingBearishDivergencewithVolume


The chart in Figure 10.6shows Valero Energy (VLO)with OBV forming a bearishdivergence in April and aconfirming support break inMay.
FIGURE10.6ValeroEnergy(VLO)ShowingBearishDivergencewithVolume


TrendConfirmationOBVcanbeused to confirmapricetrend,upsidebreakoutordownsidebreak.Thechartfor Best Buy (BBY; Figure10.7)shows threeconfirmingsignals as well asconfirmation of the pricetrend.OBVandBBYmovedlower in December–January,higher from March to April,lower from May to AugustandhigherfromSeptemberto

October. The trends in OBVmatchedthetrendinBBY.
FIGURE10.7BestBuy(BBY)withThreeConfirmingSignalsinDifferentDirections


OBV also confirmed trendreversalsinBBY.NoticehowBBY broke its down trendline in late February andOBV confirmed with aresistancebreakoutinMarch.BBY broke its up trend linein late April and OBVconfirmed with a supportbreak in early May. BBYbroke its down trend line inearly September and OBVconfirmed with a trend-line

break a week later. Thesecoincident signals indicatedthat positive and negativevolumewereinharmonywithprice.Sometimes OBV moves
step-for-step with theunderlying security. In thiscase, OBV is confirming thestrength of the underlyingtrend, be it down or up. Thechart for Autozone (AZO;Figure 10.8) shows prices as

a black line and OBV as apink line. Both movedsteadily higher fromNovember2009untilOctober2010. Positive volumeremained strong throughouttheadvance.
FIGURE10.8Autozone(AZO)withConfirmingOn-BalanceVolume


■ConclusionsOBV is a simple indicatorthatusesvolumeandpricetomeasure buying pressure andselling pressure. Buyingpressure is evident whenpositive volume exceedsnegative volume and theOBV line rises. Sellingpressure is present whennegative volume exceedspositivevolumeandtheOBV

line falls. Chartists can useOBV to confirm theunderlying trend or look fordivergences that mayforeshadow a price change.As with all indicators, it isimportant to use OBV inconjunction with otheraspects of technical analysis.It is not a stand-aloneindicator. OBV can becombined with basic patternanalysisortoconfirmsignalsfrommomentumoscillators.

CHAPTER11
TheInterpretation

andUseofStochasticOscillators
Thereare severaloscillator-typeindicatorsthathavebeendeveloped over the last 50years to indicate overboughtand oversold conditions.When used in conjunction

with the other indicators wehave already discussed, theycan be very helpful tools indetermining possible pointsof exit and entry becauseprice has been stretched toofar too fast and likely tosnapback in the otherdirection. This is especiallytrue for the day or swingtrader but can be applied tolonger time frames as anextended price condition islikelytoretraceasaresultof

profittaking,especiallyifthatcondition exists near keysupport or resistance whichmust be factored in to makeanintelligentjudgment.Oscillators and related
indicators are not trendindicators but measure thespeed of movement and canbeaverypowerfuladditivetoyour base of technicalknowledge and certainlyenhanceyourleveloftrading

accuracy and profitability.Below are several of thoseindicators, how they areconstructed, and how tointerpretthem.

■IntroductionDeveloped by George C.Lane in the late 1950s, thestochastic oscillator is amomentum indicator thatshows the location of thecloserelative to thehigh-lowrange over a set number ofperiods. According to Lane,the stochastic oscillator“doesn’t follow price, itdoesn’t follow volume or

anything like that. It followsthe speed or the momentumof price. As a rule, themomentumchangesdirectionbefore price.” The stochasticoscillator indicator’ssensitivity to marketmovements can be reducedby adjusting the time periodor by taking a movingaverage of the result. Thebullish and bearishdivergences in the stochasticoscillator can be used to

foreshadow reversals. Thiswas the first signal thatLaneidentified.Lanealsousedthisoscillator to identifybull andbear setups to anticipatefuture reversals. Because thestochastic oscillator is rangebound, is also useful foridentifying overbought andoversoldlevels.

■ CalculationandInterpretationThe default setting for thestochastic oscillator is 14periods, which can be days,weeks,months,oranintradaytime frame.A 14-period%Kwould use the most recentclose, the highest high over

the last 14 periods and thelowest low over the last 14periods.%Disa3-daysimplemoving averageof%K.Thisline is plotted alongside %Kto act as a signal or triggerline.The stochastic oscillator
measures the level of thecloserelative to thehigh-lowrange over a given period oftime.Assumethatthehighesthigh equals 110, the lowest

lowequals100and thecloseequals 108. The high-lowrange is 10, which is thedenominator in the %Kformula. The close less thelowestlowequals8,whichisthe numerator. Eight dividedby 10 equals 0.80 or 80percent.Multiplythisnumberby 100 to find %K; %Kwould equal 30 if the closewasat103(0.30*100).Thestochastic oscillator is above50 when the close is in the

upper half of the range andbelow50whenthecloseisinthe lower half. Low readings(below20)indicatethatpriceis near its low for the giventime period. High readings(above80)indicatethatpriceis near its high for the giventimeperiod.The IBM example in
Figure 11.1 shows three 14-day ranges with the closingpriceat theendof theperiod
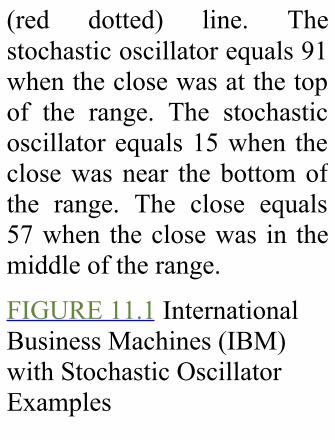
(red dotted) line. Thestochasticoscillatorequals91whentheclosewasatthetopof the range. The stochasticoscillatorequals15when theclosewasnear thebottomofthe range. The close equals57when theclosewas in themiddleoftherange.
FIGURE11.1InternationalBusinessMachines(IBM)withStochasticOscillatorExamples


■ Fast, Slow,orFullThere are three versions ofthe stochastic oscillator thatshowthelocationofthecloserelativetothehigh-lowrangeoverasetnumberofperiods.The fast stochastic
oscillator isbasedonGeorgeLane’s original formulas for%Kand%D.%K in the fast

version that appears ratherchoppy. %D is the 3-daySMAof%K.In fact, Lane used %D to
generate buy or sell signalsbased on bullish and bearishdivergences.Laneassertsthata%Ddivergenceisthe“onlysignal which will cause youtobuyorsell.”Because %D in the fast
stochastic oscillator is usedfor signals, the slow

stochastic oscillator wasintroduced to smooth %Kwith a 3-day SMA,which isexactlywhat%Disinthefaststochasticoscillator.%K in the slow stochastic
oscillator equals %D in thefaststochasticoscillator.
Fast StochasticOscillatorFast %K = %K basiccalculationFast %D = 3-period

SMAofFast%KSlow StochasticOscillatorSlow %K = Fast %Ksmoothed with 3-periodSMASlow %D = 3-periodSMAofSlow%K
The full stochasticoscillator is a fullycustomizable version of theslow stochastic oscillator.Users can set the look-back

period,thenumberofperiodsto slow%K and the numberofperiodsforthe%Dmovingaverage. The defaultparameterswereusedintheseexamples:
Fast StochasticOscillator(14,3)Slow StochasticOscillator (14,3) andFull StochasticOscillator(14,3,3)Full Stochastic

Oscillator:Full %K =Fast %KsmoothedwithX-periodSMAFull %D = X-periodSMAoffull%K
In the QQQQ example inFigure 11.2, notice that %Kin the slow stochasticoscillator equals %D in thefaststochasticoscillator.

FIGURE11.2QQQQDailyChartComparingVariousStochasticOscillatorsonOneChart


■Overbought/OversoldSince it’s a bound oscillator,the stochastic oscillatormakes it easy to identifyoverbought and oversoldlevels. The oscillator rangesfrom0to100.Nomatterhowfast a security advances ordeclines, the stochasticoscillator will always

fluctuate within this range.Traditionalsettingsuse80asthe overbought threshold and20 as the oversold threshold.These levels can be adjustedto suit analytical needs andsecurity characteristics.Readingsabove80forthe20-day stochastic oscillatorwould indicate that theunderlying security wastradingnearthetopofits20-dayhigh-lowrange.Readingsbelow 20 occur when a

security is trading at the lowendofitshigh-lowrange.Before looking at some
chart examples, it isimportant to note thatoverbought readings are notnecessarilybearish.Securitiescan become overbought andremain overbought during astronguptrend.Closinglevelsthat are consistently near thetop of the range indicatesustained buying pressure. In

a similar vein, oversoldreadings are not necessarilybullish. Securities can alsobecome oversold and remainoversold during a strongdowntrend. Closing levelsconsistently near the bottomof the range indicatesustained selling pressure. Itis, therefore, important toidentify the bigger trend andtrade in the direction of thistrend. Look for occasionaloversold readings in an
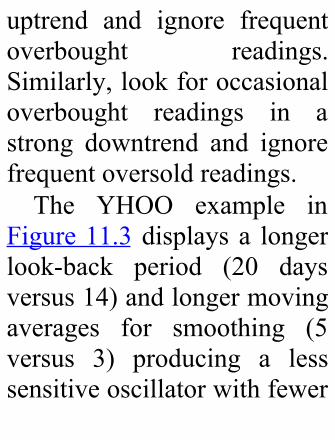
uptrend and ignore frequentoverbought readings.Similarly,lookforoccasionaloverbought readings in astrong downtrend and ignorefrequentoversoldreadings.The YHOO example in
Figure11.3displaysa longerlook-back period (20 daysversus14)andlongermovingaverages for smoothing (5versus 3) producing a lesssensitiveoscillatorwithfewer

signals. Yahoo was tradingbetween14and18fromJuly2009 until April 2010. Suchtradingrangesarewellsuitedfor the stochastic oscillator.Dips below 20 warn ofoversoldconditionsthatcouldforeshadowabounce.Movesabove80warnofoverboughtconditions that couldforeshadow a decline.Noticehow the oscillator can moveabove 80 and remain above80 (orange highlights).

Similarly, the oscillatormoved below 20 andsometimes remained below20. The indicator is bothoverbought and strong whenabove80.Asubsequentmovebelow 80 is needed to signalsome sort of reversal orfailure at resistance (reddotted lines).Conversely, theoscillatorisbothoversoldandweak when below 20. Amove above 20 is needed toshow an actual upturn and

successfulsupport test (greendottedlines).
FIGURE11.3Yahoo!(YHOO)withtheFullStochasticOscillator(20,5,5)


In the CCI example inFigure11.4thefullstochasticoscillator(20,5,5)wasusedtoidentify oversold readings.Overbought readings wereignored because the biggertrendwas up. Trading in thedirection of the bigger trendimproves the odds. The fullstochastic oscillator movedbelow 20 in early Septemberand early November.Subsequent moves back

above 20 signaled an upturnin prices (green dotted line)andcontinuationofthebiggeruptrend.
FIGURE11.4CrownCastle(CCI)withaBreakoutinJulytoStartanUptrend


In the AZO example inFigure 11.5, showing adowntrendunderway,thefullstochastic oscillator (10,3,3)was used to identifyoverbought readings toforeshadow a potentialreversal. Oversold readingswere ignored because of thebigger downtrend. Theshorter look-back period (10versus 14) increases thesensitivityoftheoscillatorfor

more overbought readings.For reference, the fullstochastic oscillator (20,5,5)isalsoshown.Noticethatthisless sensitive version did notbecome overbought inAugust, September, andOctober. It is sometimesnecessary to increasesensitivitytogeneratesignals.
FIGURE11.5Autozone(AZO)withaSupportBreakinMay2009thatStarteda

Downtrend

■ Bullish andBearishDivergencesDivergences form when anew high or low in price isnot confirmed by thestochastic oscillator. Abullish divergence formswhen price records a lowerlow, but the stochastic

oscillatorformsahigherlow.This shows less downsidemomentum that couldforeshadowabullishreversal.A bearish divergence formswhen price records a higherhigh, but the stochasticoscillatorformsalowerhigh.This shows less upsidemomentum that couldforeshadow a bearishreversal. Once a divergencetakes hold, chartists shouldlook for a confirmation to

signal an actual reversal. Abearish divergence can beconfirmed with a supportbreak on the price chart or astochastic oscillator breakbelow50,whichisthecenterline.Abullishdivergencecanbe confirmed with aresistance break on the pricechartorastochasticoscillatorbreakabove50.Fifty is an important level
to watch. The stochastic

oscillator moves betweenzero and 100, which makes50thecenterline.Thinkofitasthe50-yardlineinfootball.The offense has a higherchance of scoring when itcrosses the 50-yard line. Thedefense has an edge as longas it prevents the offensefrom crossing the 50-yardline. A stochastic oscillatorcross above 50 signals thatpricesaretradingintheupperhalf of their high-low range

for the given look-backperiod.Thissuggests that thecupishalffull.Conversely,across below 50means pricesaretradinginthebottomhalfofthegivenlook-backperiod.This suggests that the cup ishalfempty.TheIGTexampleinFigure
11.6showshowitmovedtoanew low, but the stochasticoscillator formed a higherlow. There are three steps to

confirming this higher low.Thefirstisasignallinecrossand/or move back above 20.A signal line cross occurswhen %K crosses %D. Thisprovides the earliest entrypossible. The second is amove above 50, which putspricesintheupperhalfofthestochastic range. The third isa resistance breakout on theprice chart. Notice how thestochastic oscillator movedabove 50 in late March and

remained above 50 until lateMay.
FIGURE11.6InternationalGamingTech(IGT)withaBullishDivergenceinFebruary–March2010


In the KKS Figure 11.7example, the stockmoved tohigherhighsinearlyandlateApril, but the stochasticoscillator peaked in lateMarch and formed lowerhighs.Thesignallinecrossesandmoves below 80 but didnot provide good earlysignals in this case becauseKSSkeptmovinghigher.Thestochastic oscillator movedbelow 50 for the second
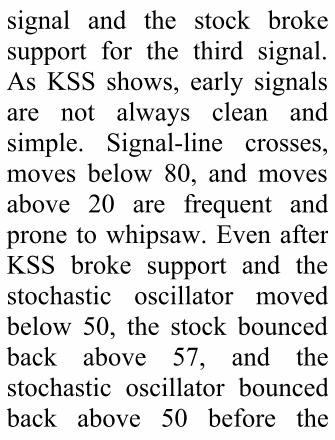
signal and the stock brokesupport for the third signal.AsKSS shows, early signalsare not always clean andsimple. Signal-line crosses,moves below 80, and movesabove 20 are frequent andpronetowhipsaw.EvenafterKSS broke support and thestochastic oscillator movedbelow 50, the stock bouncedback above 57, and thestochastic oscillator bouncedback above 50 before the

stock continued sharplylower.
FIGURE11.7Kohls(KSS)withaBearishDivergenceinApril2010


■ Bullish andBearishSetupsGeorge Lane identifiedanotherformofdivergencetopredict bottoms or tops. Abull setup is basically theinverse of a bullishdivergence. The underlyingsecurity forms a lower high,but the stochastic oscillatorforms a higher high. Even

though the stock could notexceed its prior high, thehigher high in the stochasticoscillator showsstrengthening upsidemomentum.Thenextdeclineisthenexpectedtoresultinatradablebottom.NTAPformedalowerhigh
as the stochastic oscillatorforged a higher high (seeFigure11.8).Thishigherhighshows strength in upside

momentum. Remember thatthis is a setup, not a signal.The setup foreshadows atradable low in the nearfuture.NTAPdeclinedbelowits June low, and thestochastic oscillator movedbelow20tobecomeoversold.Traders could have actedabove 50. Alternatively,NTAP subsequently brokeresistance with a strongmove.

FIGURE11.8NetworkAppliance(NTAP)withaBullSetupinJune2009


A bear setup occurs whenthe security forms a higherlow, but the stochasticoscillator forms a lower low.Even though the stock heldaboveitspriorlow,thelowerlow in the stochasticoscillator shows increasingdownside momentum. Thenext advance is expected toresultinanimportantpeak.Figure 11.9 shows
Motorola (MOT)with a bear
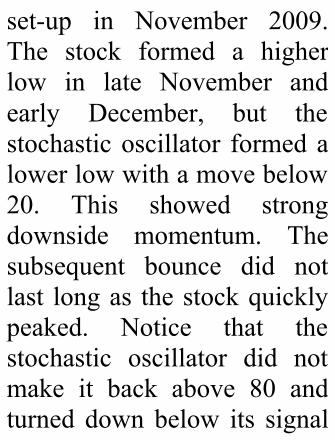
set-up in November 2009.The stock formed a higherlow in late November andearly December, but thestochasticoscillator formedalowerlowwithamovebelow20. This showed strongdownside momentum. Thesubsequent bounce did notlast longas thestockquicklypeaked. Notice that thestochastic oscillator did notmake it back above 80 andturned down below its signal

lineinmid-December.
FIGURE11.9Motorola(MOT)withaBearSetupinNovember2009


■ConclusionsWhile momentum oscillatorsare best suited for tradingranges, theycanalsobeusedwith securities that trend,provided the trend takesonazigzag format. Pullbacks arepart of uptrends that zigzaghigher. Bounces are part ofdowntrendsthatzigzaglower.In this regard, the stochasticoscillator can be used to

identify opportunities inharmony with the biggertrend.The indicator can also be
used to identify turns nearsupport or resistance. Shoulda security trade near supportwith an oversold stochasticoscillator, look for a breakabove 20 to signal an upturnand successful support test.Conversely,shouldasecuritytrade near resistance with an

overbought stochasticoscillator, look for a breakbelow 80 to signal adownturn and resistancefailure.The settings on the
stochastic oscillator dependon personal preferences,tradingstyle,andtimeframe.A shorter look-back periodwill produce a choppyoscillator with manyoverbought and oversold

readings.A longer look-backperiod will provide asmoother oscillator withfewer overbought andoversoldreadings.Like all technical
indicators, it is important tousethestochasticoscillatorinconjunction with othertechnical analysis tools.Volume, support/resistance,andbreakoutscanbeused toconfirm or refute signals

produced by the stochasticoscillator.

CHAPTER12
MovingAverage

Convergence/Divergence
Moving averageconvergence/divergence(MACD) is a technicalanalysis indicator created byGerald Appel in the late1970s. It is used to spotchanges in the strength,direction, momentum, andduration of a trend in astock’sprice.

TheMACD“oscillator”or“indicator” is a collection ofthree signals (or computeddata series), calculated fromhistorical price data, mostoftentheclosingprice.Thesethree signal lines are: theMACD line, the signal line(or average line), and thedifference (or divergence).The term MACD may beused to refer to the indicatoras a whole or specifically tothe MACD line itself. The

first line, called the MACDline, equals the differencebetween a “fast” (short-period) exponential movingaverage(EMA)anda“slow”(longer-period) EMA. TheMACD line is charted overtime, alongwith an EMA ofthe MACD line, termed thesignal line or average line.The difference (ordivergence) between theMACD line and the signalline is shown as a bar graph

calledthehistogramline.AfastEMArespondsmore
quickly than a slow EMA torecent changes in a stock’sprice. By comparing EMAsof different periods, theMACD line can indicatechanges in the trend of astock. By comparing thatdifference to an average, ananalyst can detect subtleshiftsinthestock’strend.Moving averages and the

MACDareexamplesoftrendfollowing, or “lagging,”indicators. These indicatorsaresuperbwhenpricesmoveinrelativelylongtrends.Theydon’t warn you of upcomingchangesinprices,theysimplytellyouwhatpricesaredoing(i.e., risingor falling) so thatyou can invest accordingly.Trend-following indicatorshave you buy and sell late,and, in exchange formissingthe early opportunities, they

greatly reduce your risk bykeepingyouontherightsideofthemarket.The QQQQ example chart
in Figure 12.1 shows theMACDindicatorinthelowerpanel.
FIGURE12.1QQQQDailyChart


■ MACDFormulaThemostpopularformulaforthe MACD is the differencebetween a security’s 26-dayand12-dayEMAs.Of the two moving
averages that make upMACD, the 12-day EMA isthe faster, and the 26-dayEMA is the slower. Closing

prices are used to form themoving averages. Usually, a9-day EMA of MACD isplotted alongside to act as atrigger line. A bullishcrossover occurs whenMACD moves above its 9-day EMA, and a bearishcrossover occurs whenMACD moves below its 9-dayEMA.The histogram is positive
whenMACD is above its 9-

dayEMAandnegativewhenMACD is below its 9-dayEMA.

■InterpretationMACD is a trend followingindicator and is designed toidentify trend changes. It’sgenerally not recommendedfor use in ranging marketconditions. Three types oftradingsignalsaregenerated:
■ MACD line crossingthesignalline.

■ MACD line crossingzero.■ Divergence betweenpriceandMACDlevels.
The signal-line crossing istheusualtradingrule.Thisisto buy when the MACDcrossesup through the signalline, or sell when it crossesdownthrough thesignal line.WhentheMACDlinecrossesthrough zero on thehistogram, it is said that the

MACD line has crossed thesignalline.Thehistogramcanalso help visualizing whenthe two lines are comingtogether. A crossing of theMACD line up through zerois interpreted as bullish, ordownthroughzeroasbearish.Positive divergence
between MACD and pricearises when price makes anew selloff low, but theMACD doesn’t make a new

low (i.e., it remains abovewhere it fell to on thatprevious price low). This isbullish, suggesting that thedowntrend may be nearlyover. Negative divergence iswhenpricemakesanewrallyhigh,butMACDdoesn’t riseas high as before, this isbearish.InFigure12.2, theMACD
lineisinnegativeterritoryasthe12-dayEMAtradesbelow

the 26-day EMA. The initialcross occurred at the end ofSeptember (arrow) and theMACD moved further intonegative territory as the 12-day EMA diverged furtherfrom the 26-day EMA. Theother area shows a period ofpositive MACD values,which is when the 12-dayEMA was above the 26-dayEMA.
FIGURE12.2HomeDepot

(HD)DailyChartwithMACDCrossovers


■ Signal-LineCrossoversSignal-linecrossoversare theprimarycuesprovidedbytheMACD. The standardinterpretation is to buywhenthe MACD line crosses upthroughthesignalline,orsellwhenitcrossesdownthroughthesignalline.Theupwardmoveiscalled

a bullish crossover and thedownward move a bearishcrossover. Respectively, theyindicate that the trend in thestockisabouttoaccelerateinthedirectionofthecrossover.Thehistogramshowswhen
a crossing occurs. Since thehistogram is the differencebetween theMACD line andthe signal line, when theycross there is no differencebetweenthem.

The histogram can alsohelp in visualizing when thetwo lines are approaching acrossover. Though it mayshow a difference, thechanging size of thedifference can indicate theacceleration of a trend. Anarrowinghistogramsuggestsa crossover may beapproaching, and a wideninghistogram suggests that anongoing trend is likely togetevenstronger.

While it is theoreticallypossible for a trend toincrease indefinitely, undernormal circumstances, evenstocksmovingdrasticallywilleventually slow down, lesttheygouptoinfinityordowntonothing.Figure 12.3 shows IBM
with its 12- and 26-dayEMAs in the upper sectionandthe12,26,9MACDintheindicatorwindow.Therewere

eightsignalline-crossoversinsixmonths: four up and fourdown.Thereweresomegoodsignalsandsomebadsignals.The upper section of thebottom panel area highlightsa period when the MACDlinesurgedabove2toreachapositive extreme.Thereweretwo bearish signal-linecrossovers inApril andMay,but IBM continued trendinghigher. Even though upwardmomentum slowed after the

surge, upward momentumwas still stronger thandownside momentum inApril–May.The thirdbearishsignal-line crossover in Mayresultedinagoodsignal.
FIGURE12.3InternationalBusinessMachines(IBM)DailyChartShowingSignal-LineCrossovers


■ Zero orCenter-LineCrossoversAcrossingoftheMACDlinethrough zero happens whenthereisnodifferencebetweenthe fast and slow EMAs. Amove from positive tonegative is bearish and fromnegative to positive, bullish.

Zero crossovers provideevidence of a change in thedirection of a trend but lessconfirmation of itsmomentum than a signal-linecrossover.Center-line crossovers are
the next most commonMACD signals. A bullishcenter-line crossover occurswhen theMACD linemovesabove the zero line to turnpositive. This happens when

the 12-day EMA of theunderlying security movesabove the 26-day EMA. Abearish center-line crossoveroccurs when the MACDmovesbelow thezero line toturn negative. This happenswhenthe12-dayEMAmovesbelowthe26-dayEMA.Center-line crossovers can
last a few days or a fewmonths. It alldependson thestrength of the trend. The

MACD will remain positiveaslongasthereisasustaineduptrend. The MACD willremainnegativewhenthereisasustaineddowntrend.Figure 12.4 shows Pulte
Homes (PHM) with at leastfour center-line crosses innine months. The resultingsignals worked well becausestrong trends emerged withthesecenter-linecrossovers.
FIGURE12.4PulteHomes

(PHM)DailyChart


Figure 12.5 is a chart ofCummins Inc. (CMI) withseven center-line crossoversin fivemonths. Incontrast toPulte Homes, these signalswould have resulted innumerous whipsaws becausestrong trends did notmaterialize after thecrossovers.
FIGURE12.5CumminsInc.(CMI)DailyChartwithCrossovers


Figure 12.6 shows 3M(MMM)withabullishcenter-line crossover in late March2009andabearishcenter-linecrossover in early February2010. This signal lasted 10months. In other words, the12-day EMA was above the26-day EMA for 10 months.Thiswasonestrongtrend.
FIGURE12.63MCo.(MMM)DailyChartDisplayingBullishCenter-

LineCrossover


■FalseSignalsLike any forecastingalgorithm, the MACD cangeneratefalsesignals.Afalsepositive, for example, wouldbe a bullish crossoverfollowedbyasuddendeclinein a stock. A false negativewould be a situation wherethere was no bullishcrossover, yet the stockacceleratedsuddenlyupward.

A prudent strategy wouldbe to apply a filter to signal-linecrossovers toensure thattheywillhold.Anexampleofapricefilterwouldbetobuyif the MACD line breaksabovethesignallineandthenremains above it for threedays. As with any filteringstrategy, this reduces theprobability of false signalsbutincreasesthefrequencyofmissedprofit.

Analysts use a variety ofapproaches to filter out falsesignalsandconfirmtrueones.
■ Divergencesand Loss ofMomentumIn general, a divergenceoccurs when the trend of asecurity’spricedoesn’t agreewiththetrendofanindicator.MACD divergences formwhen the MACD divergesfrom the price action of the

underlyingsecurity.Abullishdivergence forms when asecurity records a lower lowand the MACD forms ahigherlow.Thelowerlowinthe security affirms thecurrent downtrend, but thehigher low in the MACDshows less downsidemomentum. Despite lessdownside momentum,downside momentum is stilloutpacing upside momentumaslongastheMACDremains

innegative territory.Slowingdownside momentum cansometimes foreshadow atrend reversal or a sizablerally.Figure 12.7 shows Google
(GOOG) with a bullishdivergence in October–November2008.First, noticethat we are using closingprices to identify thedivergence. Second, noticethat therewere clear reaction

lows (troughs) as bothGoogle and its MACD linebounced in October and lateNovember. Third, notice thatthe MACD formed a higherlow as Google formed alower low inNovember.TheMACD turned up with abullish divergence with asignal-line crossover in earlyDecember.Googleconfirmeda reversal with resistancebreakout.

FIGURE12.7Google(GOOG)DailyChartShowingMACDPositiveorBullishDivergence

In Figure 12.8, we seeGamestop (GME) with alargebearishdivergencefromAugusttoOctober.Thestockforged a higher high above28, but the MACD line fellshort of its prior high andformed a lower high. Thesubsequent signal-linecrossover and support breakin the MACD were bearish.On the price chart, noticehow broken support turned

into resistance on thethrowback bounce inNovember. This throwbackprovided a second chance tosellorsellshort.
FIGURE12.8Gamestop(GME)DailyChartDisplayingBearishDivergence


Divergences should betaken with caution. Bearishdivergences arecommonplace in a stronguptrend, while bullishdivergences occur often in astrong downtrend. Uptrendsoften start with a strongadvancethatproducesasurgein upside momentum(MACD). Even though theuptrend continues, itcontinues at a slower pace

that causes the MACD todeclinefromitshighs.Upsidemomentum may not be asstrong,butupsidemomentumis still outpacing downsidemomentum as long as theMACD line is above zero.The opposite occurs at thebeginning of a strongdowntrend.Figure12.9showstheS&P
500 exchange-traded fund(SPY) with four bearish

divergences from August toNovember2009.Despite lessupside momentum, theexchange-traded fund (ETF)continued higher because theuptrend was strong. NoticehowSPYcontinueditsseriesof higher highs and higherlows. Remember, upsidemomentum is stronger thandownsidemomentumas longas its MACD is positive. ItsMACD (momentum) mayhave been less positive

(strong) as the advanceextended, but it was stilllargelypositive.
FIGURE12.9S&P500SPDRS(SPY)DailyChartwithBearishDivergences


■ConclusionsThe MACD indicator isespecially useful because itbrings together momentumand trend in one indicator.This blend of trend andmomentumcanbeapplied todaily, weekly, or monthlycharts. The standard settingfor MACD is the differencebetween the 12- and 26-period EMAs. Chartists

looking for more sensitivitymay try a shorter short-termmovingaverageanda longerlong-term moving average.MACD (5,35,5) is moresensitive than MACD(12,26,9)andmightbebettersuited for weekly charts.Chartists looking for lesssensitivity may considerlengthening the movingaverages. A less sensitiveMACD will still oscillateabove/below zero, but the

center-line crossovers andsignal-line crossoverswill belessfrequent.The MACD is not
particularly good foridentifying overbought andoversold levels. Even thoughitispossibletoidentifylevelsthat are historicallyoverbought or oversold, theMACD does not have anyupperor lower limits tobindits movement. During sharp

moves, the MACD cancontinue to overextendbeyond its historicalextremes.Also, remember that the
MACD line is calculatedusing the actual differencebetween two movingaverages.ThismeansMACDvalues are dependent on theprice of the underlyingsecurity. The MACD valuesfor $20 stocks may range

from –1.5 to 1.5, while theMACD values for $100stocksmayrangefrom–10to+10.

CHAPTER13
BollingerBands

Developed by JohnBollinger, Bollinger Bands®are volatility bands placedabove and below a movingaverage. Volatility is basedon the standard deviation,which changes as volatilityincreases and decreases. Thebands automatically widenwhen volatility increases andnarrow when volatilitydecreases. This dynamicnature of Bollinger Bands

alsomeans they can be usedon different securities withthe standard settings. Forsignals, Bollinger Bands canbe used to identify M topsand W bottoms or todetermine the strength of thetrend.Bollinger Bands and the
related indicators %b andbandwidth can be used tomeasure the “highness” or“lowness” of the price

relative to previous trades.Bollinger Bands are avolatility indicator similar totheKeltnerchannel.BollingerBandsconsistof:■ An N-period movingaverage(MA).■ An upper band at Ktimes an N-periodstandarddeviationabovethemovingaverage(MA+Kσ).■ A lower band at K

times an N-periodstandarddeviationbelowthemovingaverage(MA−Kσ).
TypicalvaluesforNandKare 20 and 2, respectively.The default choice for theaverage is a simple movingaverage (SMA), but othertypes of averages can beemployed as needed.Exponentialmovingaverages(EMAs) are a common

second choice. Usually, thesame period is used for boththe middle band and thecalculation of standarddeviation.

■InterpretationThe use of Bollinger Bandsvaries widely among traders.Sometradersbuywhenpricetouches the lower BollingerBand and exit when pricetouches the moving averagein the center of the bands.Other tradersbuywhenpricebreaks above the upper

BollingerBand, or sellwhenprice falls below the lowerBollinger Band. Moreover,theuseofBollingerBands isnotconfined tostock traders;options traders,most notablyimplied volatility traders,often sell options whenBollinger Bands arehistorically far apart or buyoptions when the BollingerBands are historically closetogether, in both instancesexpecting volatility to revert
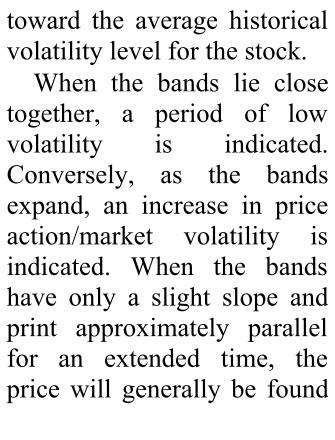
toward the average historicalvolatilitylevelforthestock.When the bands lie close
together, a period of lowvolatility is indicated.Conversely, as the bandsexpand, an increase in priceaction/market volatility isindicated. When the bandshave only a slight slope andprint approximately parallelfor an extended time, thepricewill generally be found

tooscillatebetweenthebandsasthoughinachannel.Traders are often inclined
to use Bollinger Bands withother indicators to confirmpriceaction.Inparticular,theuse of an oscillator likeBollingerBandswilloftenbecoupled with a nonoscillatorindicatorlikechartpatternsora trend line. If theseindicators confirm therecommendation of the

Bollinger Bands, the traderwill have greater convictionthat the bands are predictingcorrectpriceactioninrelationtomarketvolatility.In the S&P 500 (SPY)
example in Figure 13.1 youwill see normal BollingerBandsettings.Settingscanbeadjusted to suit thecharacteristics of particularsecurities or trading styles.Bollinger recommends

making small incrementaladjustments to the standarddeviation multiplier.Changing the number ofperiods for the movingaverage also affects thenumber of periods used tocalculate the standarddeviation. Therefore, onlysmall adjustments arerequired for the standarddeviation multiplier. Anincrease in the movingaverage period would

automatically increase thenumber of periods used tocalculate the standarddeviation and would alsowarrant an increase in thestandard deviationmultiplier.With a 20-daySMAand20-day standard deviation, thestandard deviation multiplierissetat2.Bollingersuggestsincreasing the standarddeviationmultiplierto2.1fora 50-period SMA anddecreasing the standard

deviationmultiplierto1.9fora10-periodSMA.
FIGURE13.1S&P500SPDRS(SPY)DailyCandlestickChartDisplayingNormalBollingerBandSettings


■ Signal: WBottomsBollinger uses variouspatternswithBollingerBandstoidentifyWbottoms.A“Wbottom” forms in adowntrend and involves tworeaction lows. Bollingerespecially looks for Wbottoms where the secondlowislowerthanthefirst,but

holds above the lower band.There are four steps toconfirm a W bottom withBollinger Bands. First, areaction low forms.This lowis usually, but not always,below the lower band.Second, there is a bouncetoward the middle band.Third, there is a new pricelow in the security.This lowholds above the lower band.Theability toholdabove thelowerbandon the testshows

less weakness on the lastdecline.Fourth, thepatternisconfirmedwithastrongmoveoff the second low and aresistancebreak.Figure 13.2 shows
Nordstrom (JWN) with a Wbottom in January–February2010. First, the stock formedareactionlowinJanuaryandbroke below the lower band.Second, there was a bounceback above themiddle band.
Third,thestockmovedbelowits January low and heldabove the lower band. Eventhough the February 5 spikelow broke the lower band,Bollinger Bands arecalculated using closingprices, so signals should alsobe based on closing prices.Fourth, thestocksurgedwithexpanding volume in lateFebruaryandbrokeabovetheearlyFebruaryhigh.

FIGURE13.2Nordstrom(JWN)withaWBottominJanuary–February2010


In Figure 13.3 Sandisk(SNDK), the stock firstformedareactionlowinJune(bluearrow)andbrokebelowthelowerband.Second,therewas a bounce back to themiddleband.Third,thestockmovedbelowitsJanuarylowand held above the lowerband. Even though the Junespike low broke the lowerband, Bollinger Bands arecalculated using closing

prices so signals should alsobe based on closing prices.Fourth, thestocksurgedwithexpandingvolumeinJulyandbroke above the late Junehigh.
FIGURE13.3Sandisk(SNDK)displaysasmallerWBottominJuly–August2009


■ Signal: MTopsBollinger uses these variousM patterns with BollingerBandstoidentifyMbottoms.However, Bollinger tops areusuallymorecomplicatedanddrawn out than bottoms.Double tops, head-and-shoulders patterns, anddiamonds represent evolving

tops.Generally an M top is
similar to a double top.However, the reaction highsare not always equal. Thefirst high can be higher orlower than the second high.Bollinger suggests lookingfor signs of nonconfirmationwhen a security is makingnew highs. This is basicallytheoppositeoftheWbottom.A nonconfirmation occurs

with three steps. First, asecurity forges a reactionhigh above the upper band.Second, there is a pullbacktoward the middle band.Third,pricesmoveabove thepriorhighbutfailtoreachtheupperband.Thisisawarningsign. The inability of thesecondreactionhightoreachtheupperbandshowswaningmomentum, which canforeshadow a trend reversal.Final confirmation comes

with a support break orbearishindicatorsignal.Figure 13.4 shows Exxon
Mobil (XOM)withanMtopin April–May 2008. XOMmoved above the upper bandin April. There was apullback in May and thenanother push above90.Eventhough the stock movedabove the upper band on anintradaybasis,itdidnotcloseabovetheupperband.TheM

top was confirmed with asupport break two weekslater.Alsonoticethatmovingaverageconvergence/divergence(MACD) formed a bearishdivergenceandmovedbelowits signal line forconfirmation.
FIGURE13.4ExxonMobil(XOM)withanMTopinApril–May2008
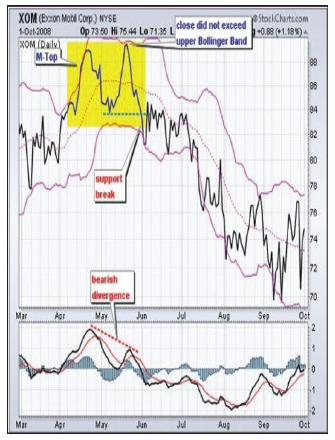

Figure 13.5 shows PulteHomes (PHM) within anuptrendinJuly–August2008.PHM’s price exceeded theupper band in earlySeptember to confirm theuptrend. After a pullbackbelow the 20-day SMA(middle Bollinger Band), thestockmovedtoahigherhighabove 17. Despite this newhigh for the move, price didnot exceed the upper band.

This flashed a warning sign.The stock broke support aweek later, and MACDmoved below its signal line.Thistopformedasmallhead-and-shoulderspattern.
FIGURE13.5PulteHomes(PHM)withinanUptrendinJuly–August2008


■ Signal:Walking theBandsMoves above or below thebands are not necessarilysignals. John Bollingerindicated that moves thattouchorexceedthebandsarenotsignals,but rather“tags.”Moves to the upper band

show strength, while a sharpmove to the lower bandshows weakness.Momentumoscillators work much thesameway.Overbought isnotnecessarily bullish. It takesstrength to reach overboughtlevels and overboughtconditions can extend in astrong uptrend. Similarly,prices can “walk the band”with numerous touchesduring a strong uptrend. Anupper band touch that occurs

after a Bollinger Bandconfirmed W bottom couldsignalthestartofanuptrend.Just as a strong uptrendproduces numerous upperband tags, it is also commonfor prices to never reach thelowerbandduringanuptrend.The 20-day SMA sometimesacts as support. Dips belowthe 20-day SMA can oftenprovide buying opportunitiesbefore the next tag of theupperband.

Figure 13.6 shows AirProducts (APD)with a surgeand close above the upperband in mid-July. First, asurge that broke above tworesistance levels took place.Such a strong upward thrustis a sign of strength, notweakness. The BollingerBands then narrowed, butAPDdidnotclosebelow thelower band. Prices, and the20-day SMA, then turned upinSeptember.APDmanaged

tocloseabovetheupperbandatleastfivetimesoverafour-month period. The lowerindicator window displays a10-periodcommoditychannelindex (CCI). Dips below –100 read as oversold, andmoves back above –100signalthestartofanoversoldbounce. The upper band tagand breakout starts theuptrend. CCI then identifiedtradable pullbacks with dipsbelow –100. This is an

example of combiningBollinger Bands with amomentum oscillator fortradingsignals.
FIGURE13.6AirProducts(APD)withaSurgeandCloseabovetheUpperBandinMid-July


Figure 13.7 showsMonsanto (MON) with awalk down the lower band.MONbrokedowninJanuarywithabreakofsupportandaclose below the lower band.Frommid-Januaryuntil earlyMay,MONclosedbelow thelowerbandatleastfivetimes.Also, the stock did not closeabove the upper band onceduring this period. Thesupportbreakandinitialclose
below the lower bandsignaledadowntrend.
FIGURE13.7Monsanto(MON)withaWalkDowntheLowerBand


■ConclusionsBollinger Bands reflectdirection with the 20-periodSMA and volatility with theupper/lower bands. As such,theycanbeusedtodetermineifpricesarerelativelyhighorlow. According to Bollinger,the bands should contain 88to89percentofprice action,whichmakes amove outsidethe bands significant.

Technically, prices arerelatively high when abovetheupperbandandrelativelylow when below the lowerband. However, relativelyhigh should not be regardedasbearishor as a sell signal.Likewise, relatively lowshould not be consideredbullish or as a buy signal.Prices are high or low for areason. As with otherindicators, Bollinger Bandsarenotmeanttobeusedasa

stand-alone tool. Chartistsshould combine BollingerBands with basic trendanalysis and other indicatorsforconfirmation.
22RulesforUsingBollingerBands
1. Bollinger Bandsprovide a relative

definition of highand low. Bydefinition, price ishigh at the upperbandandlowatthelowerband.2. That relativedefinition can beused to compareprice action andindicator action toarrive at rigorousbuy and sell

decisions.3. Appropriateindicators can bederived frommomentum,volume, sentiment,open interest,intermarket data,andsoon.
4.Ifmorethan one

indicatoris used,theindicatorsshouldnot bedirectlyrelated tooneanother.Forexample,amomentum

indicatormightcomplementa volumeindicatorsuccessfully,but twomomentumindicatorsaren’tbetterthanone.5.

BollingerBandscan beused inpatternrecognitiontodefine/clarifypurepricepatternssuch as“M” topsand “W”bottoms,

momentumshifts,andsoon.6.Tagsofthe bandsare justthat—tags, notsignals.Atag of theupperBollingerBand is

notinandof itself asellsignal. Atag of thelowerBollingerBand isnotinandof itself abuysignal.7. In

trendingmarkets,price can,and does,walk upthe upperBollingerBand anddown thelowerBollingerBand.8. Closes

outsidetheBollingerBandsareinitiallycontinuationsignals,notreversalsignals.(This hasbeen thebasis formany
successfulvolatilitybreakoutsystems.)9. Thedefaultparametersof 20periodsfor themovingaverageand

standarddeviationcalculations,and twostandarddeviationsfor thewidth ofthe bandsare justthat—defaults.Theactual

parametersneededfor anygivenmarket/taskmay bedifferent.
10. Theaveragedeployed asthe middleBollingerBand should

notbethebestone forcrossovers.Rather, itshould bedescriptive oftheintermediate-termtrend.11. Forconsistentpricecontainment:

If the averageis lengthenedthe number ofstandarddeviationsneeds to beincreasedfrom2at20periodsto 2.1 at 50periods.Likewise, ifthe average isshortened thenumber of

standarddeviationsshould bereduced from2at20periodsto 1.9 at 10periods.12. TraditionalBollingerBands arebased on asimplemovingaverage. This

is because asimpleaverageis used in thestandarddeviationcalculationandwe wish to belogicallyconsistent.13.ExponentialBollingerBands

eliminatesuddenchanges in thewidth of thebands causedby large pricechangesexiting theback of thecalculationwindow.Exponentialaverages mustbe used both

for the middleband and inthe calculationof standarddeviation.14. Make nostatisticalassumptionsbased on theuse of thestandarddeviationcalculation in

theconstructionofthebands.Thedistribution ofsecurity pricesis non-normal,and the typicalsample size inmostdeploymentsof BollingerBands is toosmall forstatistical

significance.(In practice,we typicallyfind 90percent,not95percent, of thedata insideBollingerBandswiththedefaultparameters.)15.%btellsuswhere we are

in relation tothe BollingerBands. Thepositionwithinthe bands iscalculatedusing anadaptation oftheformulaforstochastics.16. %b hasmany uses;among the

moreimportant areidentificationofdivergences,patternrecognition,and thecodingof tradingsystems usingBollingerBands.17. Indicators

can benormalizedwith %b,eliminatingfixedthresholds intheprocess.Todo this, plot50-period orlongerBollingerBands on anindicator andthen calculate

%b of theindicator.18. BandWidth tells ushow wide theBollingerBandsare.Theraw width isnormalizedusing themiddle band.Using thedefault

parametersBandWidth isfour times thecoefficient ofvariation.19. BandWidth hasmany uses. Itsmost popularuse is toidentify “TheSqueeze,” butitisalsouseful

in identifyingtrendchanges.20. BollingerBands can beused on mostfinancial timeseries,includingequities,indices,foreignexchange,commodities,

futures,options, andbonds.21. BollingerBands can beusedonbarsofanylength—5-minute, 1-hour, daily,weekly,andsoon.The key isthat the barsmust contain

enoughactivitytogivea robustpicture of theprice-formationmechanism atwork.22. BollingerBands do notprovidecontinuousadvice; rather,

they helpidentify setupswheretheoddsmaybeinyourfavor.

CHAPTER14
PositionSizingandMoney

Management
Afteryouhavelearnedmostor all of the information intheprecedingchapters(whichmay very well take years oftradingexperiencetomaster),you still need to haveguidelines to managing theportfolio and the positionsizes. It’s my strong beliefandexperienceofobservation

and discussions with manytraders over the years thateven with all the tradingprowess and skills a tradermight have gleaned oraccumulatedoveraperiodoftime, it’s still very importantto be able to manage thefunds and positions sizes toreduce risk, accumulate alarger capital position, and,most important, protect yourcapital (my number one ruleintrading!).

■ PositionSizingThere are many opinions onhow to manage your moneywhen trading and howmanypositions you should own atany one time. My personalbelief from many years oftrialanderror is thatpositionsize certainly depends onportfolio dollar size. My

feeling is that leverage is akey in day and shorter-termtrading and that smallernumbers of positions, saythree to five or so, probablyno more than a half-dozenpositions, not only is moremanageable but enableslarger-size individualpositions creating leverageandtheabilitytoscaleoutofportions of positions whenprice objectives are metwithouteliminatingtheentire

positionandpossiblymissingthe “bigger move” over alongertimeframe.One of the biggest
complaints I hear fromtraders is “I sold it too soonand missed a much biggermove.” By leveraging yourportfolio with a smallernumberofpositions,youwillbeabletomilkatrendlongerby scaling out at objectives,but still keeping a core

portion for the longer haul.By doing this you will beraisingcashpositionsthatcanbe used for new ideas, butafteraperiodoftimeofdoingthis, you’ll find that addingnew positions defeats theleverage theory because thecapital is becoming spreadover more and perhaps toomany positions for a short-term trader to properlymanage.

This is obviously differentthan an investorwith a largedollaramountinhisportfoliowho is more likely longer-term oriented and perhapsmore conservative. This typeofinvestornormallywantsto“spreadtherisk”overalargernumber of positions. Quitefrankly, when you reach apoint that your portfolio hasgrown so large that youbecome more and possiblytoo conservative, wanting to

diversify and reduce risk, itcan becomecounterproductive to yourtrading.When you realize at that
point that your portfolio andinvesting goals may havetransitioned or changed, Istrongly suggest reducing theportfolio dollar size andperhaps putting some withprofessionalmoneymanagersor mutual funds for your

longer-term retirement oreven further diversifying inreal estate or high-incomeinstruments.Ihavefoundthatoneof thebestapproachestokeepthetradingportfoliosizein check and retain itsmanageabilityistoconstantlypeel off dollar portions,especially on the mostsuccessful trades,notonlyasa way of rewarding yourselffor a trading job well donebutasawayofbuildingyour

retirementplan.It’satwofoldpurpose that has worked formany bright individualtraders I’ve known over theyears. It keeps your tradingportfolio size in check andmoremanageable and, at thesame time, constantlyincreasesyourretirementplansizeforthelonghaul.Iwanttoemphasizethatno
matterhowlargeyourtradingportfolio may be, you may

want to seriously considerlimiting the number of stockpositions and keeping largeramounts in each to createleverage and flexibilitywhenprice objectives are met,enhancing your ability tomaximize your tradingprofits.

■ The Stop-Loss as aMoneyManagementToolMost of my subscribers andloyal followers are aware ofmy philosophy that beforeentering a position you must

know where to place yourstop-loss entry. As statedearlier, my number one ruleof investing is “protection ofyourtradingcapitalposition.”Theeasiestwayofdoingthatisbysettingastop-lossbasedon the possible violation ofvarious technical chartingparameters we discussed inearlierchapters.When more than one or
evenseveralof thosesupport
or resistance points on thechartsareviolated,especiallywith a dramatic pickup involume,it’slikelytimetoact.However, I would like towarnallofyounottorelyonyour ability to act once thestock has made it move, asyour emotions and/orjudgment can be swayed,misinformed, or misguided.By determining where aheadof time and setting a stop atthe time of entry, you will

have done your duty as adisciplined trader and doneallyoucantoproperlyprotectyournewposition.Nearly all electronic
trading platforms today arequite sophisticated and giveyoutheabilitytosetmultiplestops at different levels. Isuggest that larger, moreleverageable positions havestops set just below variousimportant chart support

points. This allows you tostay in a partial positionshould the first stopbe takenout and avoids whipsaws ornews events that may takeyou out of your entireposition.However, you must also
determineifpriceandvolumeaction are so severe andtechnically destructiveenough towarrant letting theentire position go. This may

require you to make aneducatedjudgmenttoremovethe remainder of the stops inplace and exit the rest of theposition because it is readilyapparent that a major trendchangecouldbetakingplace.Thisactionmustbedoneonlyaftercarefulevaluationofriskgoing forward withoutemotional reaction (easiersaid than done!). The moreexperienced trader should beabletomoreeasilydetermine

if this is necessary or calledfor, but new or amateurtraders will likely find thisdecisiontochangethecourseof protective action a muchtougherdecision.Inthiscase,itmaybebesttojustletyourstops do their job. Simplysaid, at any time a decisionmay have to be made tochange your protective planandtakeadifferentcourseofaction, and you will alwaysneed to be flexible in your

decision making based onprice/volume action creatingsevere technical changescallingforpossibleaction.

■ Raising andAdjustingStops as PriceProgressesIt’s certainly important to bemonitoring your positionsclosely and evaluating thechart action at all times.Rising prices and trends will

requireyoutoadjustthestopscontinuously if they are tohave important protectivevalue.Astopnotalteredasaprice rises is most likelyuseless as a precise portfolioprotection tool to maximizeyour profits and properlyprotect the position againstsudden severe price changes,especially in the oppositedirection of the ongoingtrend.

My recommendation is toconstantly be raising yourstops as the trend progressesat a point a bit belowwhereyour technical analysis hasdetermined that the next keysupport may be based onprice,trendlines,andmovingaverages, as I stated inprevious chapters. You mayalso want to decide to scaleoutpartialpositionswhenthisoccurs, making sure you’veadjusted the stops for the

remainder of the position,again at a point below thenexttechnicalchartsupport.Using this method of
scalingyourstopswillenableyou to at least take partialprofits, and at the same timeenable you to stay in at leastpart of your position forpossible futurepriceprogressor extension of the movethat’s under way. However,you’ll obviously have to

accept a smaller profit orlarger loss if this method isused and the trend reverses,taking out the lower orsecondary stop levels. That’sa decision based on whatamount of risk you arewilling to accept inorder foryourentirepositionnot tobeeliminated. This method canbeusedonanytimeframe.

■TheTrailingStopMethodApopularprotectivestop-losstool used bymany traders toprotectgainsand limit lossesautomatically is the trailingstop. With a trailing stoporder,youseta stoppriceaseither a spread in points or apercentage of current marketvalue.Thetrailingstopoffers

aclearadvantage in that it ismoreflexibleinnaturethanafixed stop-loss. It is anattractive alternative becauseit allows the trader tocontinueprotectinghiscapitalifthepricedrops.Butassoonas the price increases, thetrailing feature kicks in,allowing for an eventualprotectionofprofitwhilestillreducingtherisktocapital.For example, imagine you

purchased 500 shares of astock at $50 per share; thecurrent price is $57. Youwant to lock inat least$5ofthe per-share profit you’vemade but wish to continueholding the stock, hoping tobenefit from any furtherincreases. To meet yourobjective, you could place atrailingstoporderwithastopvalueof$2pershare.In practical terms, here’s

what happens: Your orderwill sit on your broker’sbooks and automaticallyadjustupwardas thepriceofacommonstockincreases.Aslongasthestockkeepsrisingor holds relatively steady,nothinghappens.However,ifit turns south and hits yourtrailingstop,yourbrokersellsandyoupocketyourprofit.Itis important to note that thetrailingstoponlygoesup—itnever goes down with a

marketprice.At the time your trailing
stop order is placed, yourbrokerknowstosellthestockif the price falls below $55($57 current market price –$2 trailing stop loss = $55sale price). Imagine that thestock increases steadily to$62 per share; now, yourtrailing stop order hasautomatically kept pace andwill guarantee at least a $60

sale price ($62 current stockprice–$2 trailing stopvalue=$60persharesaleprice).Inotherwords, the trailing stoporder will increase in yourfavor and lock in any gainsyou’vemadeintheinterim.Ifthestockwere to fall to$60,yourtrailingstoporderwouldconvert toamarketorder forexecution, and your shareswould be sold and shouldresultinacapitalgainof$10pershare.

This method of protectioneliminates the need tocontinuously monitor pricesandconstantlyadjustthestoplevel after prices increase.The stops will simply beadjustedforyouasthepricesincreases. In the precedingexample,oncethestockturnslowerby$2ormoreyouareautomaticallystoppedout.The difficultywith trailing
stopsand the reason Idonot

normally recommend them isknowinghowmuchleewaytogive yourself. Frankly, thefault with this system is thatthedecisiononhowmuchthestops should be below themost current price is usuallytotally arbitrary and lackingin technical reasoning. Yes,the normal stop set below alogical support or confluenceof several support pointstakes more work, but in myexperience after nearly 50

yearstrading, it’smuchmoreaccurate and worth the timeyou have to spend analyzingthe technicals lookingfor thetechnically logical points tosetyourstops.However, in any case, my
philosophy is that a stop ofany kind—be it based ontechnical analysis of supportpoints or arbitrarily settrailing stops—is better thanno stops at all or even

“mental stops,”which totallyrely on your discipline andability to pay close attentionto price movements andrequireyou tomonitorpricesconstantly.

CHAPTER15
SwingTrading

It’s my observation andbelief,asaresultofnearly50years of active trading, thatprice and other technicalpatterns are similar on alltime frames. They can beused and analyzed in thesame manner, as well. As Ihave previously andrepeatedlystated,Ipreferandrecommendtheuseandclosemonitoring of 1- and 5-minute charts intraday for
day-tradingpricepatterns.Onmy web site, frequentintraday, live video, webinarupdate, and chart patternreviewsessionsareconductedthroughoutthetradingsessionto closely monitor price andrelevant chart patterndevelopment, along withintraday consolidationformation and trendmomentum.Price and related

underlying technical patternson15-minute,60-minute,anddaily charts should also beused to assist the trader indetermining what effectlonger time frame pricetrends,moving averages, andprice support/resistance mayhave on intraday patterntrading. This will assist youin further determining wheretargets and stops may be setforyourdaytrade.

Ihavefoundovertheyearsthattheuseof15-minute,60-minute, and daily chart timeframesarebest foranalyzingchartpatternsinordertofindstrong, high-probabilitypotential swing tradecandidates. It’s quiteamazing,though,thatmostofthe stocks I’ve recommendedover the years for swingtrades started out with apowerfulday-trademovethatwelikelyhaddaytraded.The

impressive strength andtechnical thrust of the moveaccompanied by strongrelative volume probablyacross key resistance wasmostlikelythereasonitcameto my attention in the firstplace. So monitoring thosehuge daily price/volumepercentagesurges iscertainlyan excellent source fordiscovering potential swing-trade candidates. Just onevery strong dailymove itself

canandoftendoesinitiateanimportantpricemovethatcanlastweeksormonths.Holding a stock for longer
thanjustadaytradegenerallybecomes known a swingtrade, but there are differingopinionsanddefinitionsastowhat exactly a “swing trade”is time-wise. Generally,tradersconsideraswingtradeto be anywhere from a fewdays to a few weeks. My

personalopinionisaslittleasfour to five days to probablya maximum of three to fourweeks.Youwill often hear swing
trading defined as“momentum trading.” Aswing trade is open longerthan a day, but shorter thantrend-followingtradesorbuy-and-hold investmentstrategies.Swing tradingalsodiffersfromthebuy-and-hold

approach to investing. Long-term investors may hold asecurity through periods ofweakness that may lastseveral months or years.Swing traders don’t care forsuchpoorperformanceinthenearterm.Ifasecurity’spriceis performing poorly, swingtraders exit first and askquestionslater.Swingtradersare nimble and judicious inchoosing potentialopportunities, and market

timing is critical to swingtradingstocksSwing trading, as opposed
todaytrading,atleastallowsyou to take a breath. Whileyou still have to watch yourstocks to ensure that keylevels are not breached, youdonothavetowatchthetapevery closely intraday, whichmany who are working andnottradingforalivingjustdonothave the timeorstomach

for. Without offending theswing traders of theworld, Iwould dare to say that youcan swing trade on a part-time basis and still turn aprofit. You’ll probably havemuchfewertradedecisionstomake, but you still need todevelop a thorough tradingplanwithentry,exit,andstoppoints.Swing trading can provide
for a much larger profit

potential than day trading,which can tend to be hit andrun or scalping oriented andbeyond. Because your timeframe for trading is larger,your profit targets may alsobe greater. This is whereswing trading becomes fun.For example, youcanhaveaset profit target, but becauseyour holding period is muchlonger than day trading, youactually can let your profitsrunabit.

Swing trading does notrequire you to place tradesdaily, making it easier forthose occupied for most ofthe trading session due toworkorvacations and soon.Generally, trades are placedevery few days to two tothree weeks. The reason forthe lengthier time is thatyouneed toprovide the stock theability to “swing” from onepricepoint tothenext.Thereare times when a stock will

just have a breakaway gapandyouwill, of course, holdoffonthetwo-tothree-weektimelineandjustletthestockrun.Holdingpositionsformore
thanadayalsohas theexactopposite risk profile of daytrading. Having less marginto use naturally reduces yourrisk; however, swing tradesexpose you to holdingpositions overnight. For me,

this introduces toomuch riskrelative to day trading.Mostnewseventssuchasearnings,public relationsannouncements, or analystrecommendations occuroutside of normal tradinghours.Ipersonallyjustcannotrisk waking up and seeingthat my stock has gappeddown 20 percent or morefromthepreviousday’scloseonasurpriseannouncement.

Certainly, swing tradingalso requires you to havemore patience, and I clearlydonot like towait for things(type A personality?). Youmayholdyourtradeforafewdays or weeks. It reallydepends on how well thestock trends. The periods oftime where it is unknownwhetherIwillclosethetradeoutwithaprofit increasemyanxiety levels to a pointoutside of my comfort zone.

Make a swing trade that’smore likely to yield goodresultsbygettingtoknowthefollowing signs of favorableconditions:
Six Criteria to Lookfor When ChoosingSwingTrades
1.Themarketisonyourside.You’vedeterminedthat the market is

trending in the samedirection you want toswing trade. (If it isn’t,you may need to find adifferenttrendingmarketentirely.)2.The industrygroup isonyourside.Stockstendto follow their industrygroups up or down. Ifthe security’s industrygroup is trendingstrongly in the same

direction you want toswing trade,chancesarethat your trade will beprofitable.3. If you’re trendtrading, the candidate ismoving out of a base.Thecandidate shouldbeinanexistinguptrendordowntrend that haspulled back in the shortterm.4. If you’re trading

ranges,thecandidatehasjust bounced off ofsupport/resistancewithatechnical indicatorconfirmation. Watch forthe technical indicator(an oscillator) togenerate a buy or sellsignal. Divergencesbetween your oscillatorand the price actionsignal higher-confidencetrades.

5. The stop-loss level isnear your desiredexecutionprice.Thebestswing-tradingcandidatesare those where youremergency exit isnearby. The closer yourdesired entry price is toyour stop-loss level, theless you stand to lose ifmattersturnugly.6. You make adisciplined, not

emotional, decision toallocatetherightamountto the trade. Loss isalways possible, evenwith the best swing-trading candidate. Setyour position size inaccordance with yourtrading plan, whichshould put an absoluteceiling on your positionsizeandset amaximumpercentage of capitalyou’rewillingtolose.

CHAPTER16
RulesandGuidelinesto

BetterTrading
The previous chapters havecovered all the technicalanalysismethods, techniques,and philosophies that I haveused and developed over thepast nearly 50 years, and Ibelieve theywillmakeyouabetter and more profitabletrader.Before I conclude, I want

to give you some rules andguidelinestoenableyoutobea better, more profitable dayandswingtrader:
1. Know your entryprice, exit price, andstop-loss even beforeyou enter the trade incase of a worst-casescenario.
This is rulenumber onefor a reason.

Before youpress the“Enter” key,you mustknow when togetin,whentoget out, andwhat to do ifthe tradedoesn’t workout asexpected. Astop price isessentialifyou

want tominimizelosses.Knowingwhen to get inor out willhelp you tolock inprofits,aswellassaveyou frompotentialdisasters andlarge capitaldrawdowns.

2. Avoid trading duringthe first 15 minutes ofthemarketopen.
It’s verytough to tradein the first 10to 20 minutes,and it takesyears oftradingexperienceandan acquiredconfidence

level beforeyou shouldconsidertrading nearthe opening.Those first 15minutes ofmarket actionareoftenpanictrades ormarket ordersplaced thenight before.Novice day

traders shouldavoidthistimeperiod whilealso lookingforreversals.
3. Use limit orders, notmarketorders.
A marketorder simplytells yourbroker to buyor sell at thebest available

price.Unfortunately,best doesn’tnecessarilymeanprofitable. Thedrawback tomarket orderswas revealedduring theMay 2010“flash crash.”When marketorders were
triggered onthatday,manysell orderswere filled at10, 15, or 20points lowerthananticipated. Alimit order,however, letsyoucontrolthemaximumprice you’llpay or the

minimumprice at whichyou’ll sell.You set theparameters,which is whylimit ordersarerecommended.Only the mostexperiencedtraders withthe highestlevel of

confidenceshouldconsidermarketorders.
4.Rookie tradersshouldavoidusingmargin.
When youuse margin,you areborrowingmoney fromyourbrokerageto finance all

or part of atrade. Full-time daytraders (i.e.,pattern daytraders) areusuallyallowed 4:1intradaymargin. Forexample, witha $30,000tradingaccount,you’ll

be givenenoughbuyingpower topurchase$120,000worth ofsecurities.Overnight,however, themarginrequirement isstill2:1. When used

properly,margin canleverage, orincrease,potentialreturns. Theproblemisthatif a trade goesagainst you,margin willincreaselosses. One ofthe reasonsthat day

trading got abad name adecade agowas the use ofmargin—whenpeople cashedin their401k(s) andborrowedbundles ofmoney tofinance theirtrades. Whenthebullmarket

endedin2000,so did manytraders’accounts.Bottomline: ifyou are anovice trader,first learnhowto day-tradestocks withoutusingmargin. For theexperienced

trader, margincan be one ofthe bestvehicles forcompoundedprofitsexponentially,so it’s veryattractive andtempting, butthe riskremains at alltimes, andonemust be

disciplined orwatch theirtrading capitalrapidlydisappear.
5.Haveasellingplan. Manyrookies spendmost of theirtime thinkingabout stocksthey want tobuy without
consideringwhen to sell.Before youenter themarket, youneed to knowin advancewhen to exit.“Playing it byear” is not asellingstrategy,norishope.Asadaytrader, you

need set aprice target aswell as a timetarget evenbefore youenter yourtrade.
6. Keep a journal of allyourtrades.
Many prosswear by theirjournal, wherethey keep

records of alltheir winningand losingtrades. Writedown whatyou did rightor wrong.Doing so willhelp youimprove as atrader, whichis yourprimary goal.Not

surprisingly,you’llprobably learnmore fromyour losersthan yourwinners.
7.Rookie tradersshouldfirstpracticeday tradingin a paper-tradingaccountforafewweeks.
Althoughnoteveryone

agrees thatpracticetrading isimportant, itcan bebeneficial tomost rookietraders. If youdo open apracticeaccount, besure to tradewitha realisticamount of

money.It’snothelpful topractice tradewith a milliondollars if themost youhavein youraccount is$30,000. Also,if you dopractice trade,think of it asan educationalexercise, not a

game.8. Learn tounemotionally cut yourlosses.
Managinglosingtradesisthe key tosurviving as aday trader.Although youalsowanttoletyour winnersrun, you can’t

afford to letthem run fortoo long andturn againstyou. Learninghow to controllosses isessentialifyouare going todaytrade.
9. Be willing to losebeforeyoucanwin.
Although

many traderscan handlewinners,controllinglosing stockscan bedifficult.Manyrookies panicatthefirsthintof losses, andendupmakinga series ofimpulsivetradesthatcost

them money.If you’re daytrading, youmust bewilling toaccept somelosses. Thekey: knowingin advancewhat levelyourprotection is(stop-loss).

Althoughanyone canlearn to daytrade, fewhave thediscipline tomakeconsistentprofits. Whattrips up manypeople aretheiremotions,which is whyit’s so

important tocreate a set offlexible rules.Your goal:follow therules to helpkeep you onthe right sideofanytrade.
10. Trade strong stockslonginanuptrend;shortweak stocks in adowntrend.

Mosttraderswill find itbeneficial totrade stockswith a highcorrelation tothe majorindexes;stocksthat arerelativelyweak orstrong,compared tothe index, can

be isolated.Thiscreatesanopportunityforthe day trader,as he or shecan isolatewhich stocksare likely toprovide abetter return,given themovement ofindividualstocks relative

totheindex. When theindexes/marketfutures aremovinghigher, tradersshould look tobuystocksthataremoving upmoreaggressivelythan thefutures. When

thefuturespullback, a strongstock will notpull back asmuch, or maynot even pullback at all.These are thestocks to tradein an uptrend,as they leadthe markethigher andthus provide

more profitpotential andlower risk;smallerpullbacksmeanlessrisk. When theindexes/futuresare dropping,short sellstocks thatdrop morethan the

market,percentage-wise. Whenthe futuresmove higherwithin thedowntrend, aweak stockwill not moveup asmuch orwill not moveupatall.Weakstocks are lessrisky when in

a “short”position andprovide greatprofitpotentialwhen themarket isfalling.
11. Wait for thepullback/retest.
Trend linesare anapproximatevisualguide to

where wavesin price willbeginandend.Therefore, wecanuseatrendline for entryinto the nextprice wave inthe directionof the trend.When enteringa longposition,buying after

the pricemoves downtoward thetrend line andthen movesback highertends to beprofitable.Shortsellinginadowntrendwould besimilar. Waituntil the price

moves up thedownward-sloping trendline, thenwhenthestockbegins tomove backdown, this iswhenthemoreprobableprofitableentry can bemade.

These twotrendlinetradeguidelinesprovide a verylow-risk entry,as thepurchases aremade close tothe stop level,which couldbe severalcents belowthetrendline.

Some final additionalguidelinestoconsider:
Don’t commit all yourcash at once. In a fast-moving market,opportunities come upall thetime.Trytokeepsome cash on hand totake advantage of thoseopportunities.Discover and usehedging techniques. Justbecause you’re bullish

doesn’t mean that youcan’t also put on abearish position or buyan inverse exchange-traded fund (ETF) forportfolio protectionwhen the markets lookweak and headed lower,even intraday. Hedgingtechniques protect youwhen the market movesagainstyou.Use discipline and

patience versus emotionand panic. Part of thehuman equation in theworld of financialmarkets is that fear andgreed can becomeirrational, short-termdriversofprices.Insteadof joining the crowd,watch them to give youan advantage inassessinga stock’spricemovements. Stick withyour plan and use

disciplineandpatience. Day and swingtraders should ideallytrade with the overalltrend and patiently waitfor low-risk entries topotentially profit fromthat trend. Trend lines,moving averages, andkey support levelsshould be used as aguide to help tradersdetermine these low-risk
entry points, as wellprovide potential stoplevels. Buying stocksthatarestrongerthantheindex in uptrends andshorting stocks that areweakerthantheindexindowntrends shouldprovidemore safety andrelative outperformanceprofits. Don’t tradewhen the trend isunclear. Cash can beking in times of panic.

Don’t let the moneyburn a hole in yourpocket!Bepatient!
Remember, many of themost successful traders I’veknown and admired wereonly in the market 30 to 40percent of the time. The restof the time they were beingcunninglypatient,doingtheirhomework and analysis,holding cash positions,waiting for the next big

opportunity and the rightsetups to present themselves.Those are the traits of themost successful traders inmarkethistory.

CHAPTER17
38StepstoBecominga

SuccessfulTrader
Most traders will identifywith this list and should beable to place themselveswithin these steps. Keep inmind that few peopleprogress through these stepsin an orderly fashion.Developing your trading

skills is an iterative process.For example, youmay reachstep 13 and find that,although you were makingmoney, your basic premisefor trading was flawed (youmight have been benefitingfrom the bull market, ratherthan your own tradingprowess and then have beenrudely awakened when themarketenteredabearphase).Youmaydropbacktostep4andstart“climbing”thesteps

again. Having the propermind-set, attitude, andpsychological makeupbecomes increasinglyimportant as you progressthrough the steps. The focusof the earlier steps is onexternal issues (i.e.,developingproficiency in themechanics of trading), whilethefocusofthelatterstepsison internal issues (i.e.,improvingourselvesmentallyand psychologically,

maturingastraders).1. We accumulateinformation—buyingbooks, going toseminars, andresearching.2. We begin to tradewith our “new”knowledge.3. We consistently“donate” and thenrealize we may needmore knowledge or

information.4. We accumulate moreinformation.5. We switch thecommodities we arecurrentlyfollowing.6. We go back into themarket and trade withour “updated”knowledge.7. We get “beat up”again and begin to losesomeof our confidence.
Fearstartssettingin.8. We start to listen to“outside news” and toothertraders.9. We go back into themarket and continue to“donate.”10. We switchcommoditiesagain.11.We search formoreinformation.12.Wegoback into themarketandstarttoseea
littleprogress.13. We getoverconfident and themarkethumblesus.14. We start tounderstand that tradingsuccessfully is going totakemoretimeandmoreknowledge than weanticipated.
(Note: Most people willgive up at this point, as theyrealize work is involved.
Keepgoing.)15. We get serious andstart concentrating onlearning a “real”methodology.16. We trade ourmethodology with somesuccess but realize thatsomethingismissing.17. We begin tounderstand the need forhavingrulestoapplyourmethodology.

18.Wetakeasabbaticalfrom trading to developand research our tradingrules.19. We start tradingagain, this time withrules, and find somesuccess, but overall westill hesitate when weexecute.20. We add, subtract,and modify rules as wesee a need to be more

proficientwithourrules.21.We feelweareveryclose to crossing thatthreshold of successfultrading.22. We start to takeresponsibility for ourtrading results as weunderstand that oursuccess is in us, not themethodology.23.Wecontinuetotradeand become more

proficient with ourmethodology and ourrules.24.Aswetrade,westillhave a tendency toviolateourrules,andourresultsarestillerratic.25. We know we areclose.26. We go back andresearchourrules.27.Webuildconfidenceinourrulesandgoback

into the market andtrade.28. Our trading resultsaregettingbetter,butweare still hesitating inexecutingourrules.29. We now see theimportance of followingour rules as we see theresults of our tradeswhen we don’t followtherules.30.Webegintoseethat

our lack of success iswithin us (a lack ofdiscipline in followingthe rules because ofsome kind of fear), andwe begin to work onknowing ourselvesbetter.31. We continue totrade, and the marketteaches us more andmoreaboutourselves.32. We master our

methodology and ourtradingrules.33. We begin toconsistently makemoney.34. We get a littleoverconfident and themarkethumblesus.35.Wecontinuetolearnourlessons.36.Westopthinkingandallow our rules to tradefor us (trading becomes

boring but successful),and our trading accountcontinues togrowasweincrease our contractsize.37.Wearemakingmoremoney than we everdreamedpossible.38. We go on with ourlives and accomplishmany of the goals wehavealwaysdreamedof.

ABOUTTHEONLINEVIDEO
Profitable Day and SwingTrading is accompanied bytwo online videos, whichexpand on the lessons and

examples presented in thebook:
1. Day Trading withHarryBoxer A video of technicalanalysis techniques forlooking at 1-minute and5-minute intradaytradingcharts.2. Swing Trading withHarryBoxer A video of technicalanalysis techniques for
short-term and swingtrading.
TogettheURLandaccesscode for your online video,please refer to the printedcardattheendofthisbook.Ifyoupurchasedane-book,youcan find instructions forverifying your purchase andobtaining an access code attheendofthisbook.

INDEX
AAdeptTechnologies(ADEP)Aetrium,Inc.(ATRM)AirProducts(APD)AllianceFiberOptic(AFOP)

America-Invest.comAnikaTherapeutics(ANIK)Appel,GeraldApplied Micro Circuits(AMCC)Arrowhead Research(ARWR)Autozone(AZO)
BBalance of Power (WordenBrothers)Bearishcrossover

Bernstein,JoelBestBuy(BBY)Bitauto Holdings Limited(BITA)Bollinger,JohnBollingerBands
conclusionsinterpretationMtopsrulesforusingWbottomswalkingthebands
“BoxerWedge”

BullflagsBullish and bearishdivergencesBullishandbearishsetupsBullishcrossover
CCalumet Specialty Products(CLMT)CanadianSolarInc.Center-linecrossoversChannelsandanglesCoils

CrossoversignalsCrownCastle(CCI)CumminsInc.(CMI)
DDaqoNewEnergy(DQ)Daytrading
fifth-wave exit methodformeasuredmovepatterns
bestintraday rising

parallel channelwith high relativevolumelow-volume“ebb”
timeframeparametersDemark,TomDivergences and loss ofmomentum. See alsoTechnical divergences andlossofmomentum
EEarly trend development,

analyzingdisciplined, organized,focused approach,developingearly price/volumeaction,monitoringfocuslist,creatingWorden BrothersVolumeBuzzindicator
Elliott,RalphNelsonElliottWavecycleanalysisElliottWaveTheoryExitpoints,determining

fifth-wave exit methodfordaytradinglogarithmic or percentscalingmeasuredmovemethod
ExxonMobil(XOM)
FFalsesignalsFeldman,SteveFibonacci,LeonardoFibonaccianalysisFishman,Gary

Fifth-wave exit method fordaytradingFocuslist,creatingFoundationMedicine(FMI)Fractals
GGamestop(GME)Gentium(GENT)Google(GOOG)Granville,JoeGreenstein,HankGreyTelevision(GTN)

Guidelines. See Rules andguidelines
HHefter,RichardHimaxTechnologies(HIMX)HistogramHomeDepot(HD)dailychartHughes,Neil
IInternational BusinessMachines(IBM)

International Gaming Tech(IGT)Intraday rising parallelchannel with high relativevolume
JJinkoSolar(JKS)
KKohls(KKS)Kongzhong Corporation(KONG)

LLane,GeorgeC.Logarithmic or percentscalingLow-volume“ebb”
MMtopsMarket predictions based onwavepatternsMarkwest Energy Partners(MWE)

MeasuredmovemethodMedtronic(MDT)Mellanox Technologies(MLNX)MicronTechnology(MU)Momentum trading. SeeSwingtradingMoneyStream (WordenBrothers)Monsanto(MON)Motorola(MOT)Moving averageconvergence/divergence

(MACD)conclusionsdivergences and loss ofmomentumfalsesignalsformulainterpretationsignal-linecrossoverszero or center-linecrossovers
Movingaveragescrossoversignals

NNetworkAppliance(NTAP)Nordstrom(JWN)
OOn-balance volume (OBV)anddivergences
calculationdivergencesinterpretationtrendconfirmation
Openinggapprice

Overbought/oversoldlevels
PPandoraMedia(P)Patterns
bestintraday rising parallelchannel with highrelativevolumelow-volume“ebb”
PDCEnergy(PDC)PennantsPosition sizing and money

management. See also Stops,determiningandsetting
raising and adjustingstopsaspriceprogressesstop-loss as moneymanagementtooltrailingstopmethod
PricetrendangledivergencesPrice/volumesurgePulte Homes (PLT) dailychart
Q

QQQQdailychart
RRegado Biosciences Inc.(RGDO)Rentech Nitrogen Partners(RNF)RockwellMedical(RMTI)Rulesandguidelines
SSandisk(SNDK)Shapiro,Harris

Signal-linecrossoversSolarCity(SCTY)SolarwindsInc.Somekh,BillS&P 500 exchange-tradedfund(SPY)Starbucks(SBX)StemlineTherapeutics,Inc.Stochastic oscillators,interpretationanduseof
bullish and bearishdivergencesbullish and bearish

setupscalculation andinterpretationconclusionsfast,slow,orfulloverbought/oversoldoverview
Stops, determining andsetting. See also Positionsizing and moneymanagement
under key trend-lineviolations

using key movingaverageviolationswhere important pricesupport levels areviolated
SuccessfultradingstepstoSupportandresistancelinesSwingtrading
criteriatolookforwhenchoosing
TTargets and price objectives,

settingexitpoints,determining
fifth-wave exitmethod for daytradinglogarithmic orpercentscalingmeasured movemethod
Fibonacci and ElliottWavecycleanalysis
market predictionsbased on wave

patternstheoryinterpretationwave categories, seriesof
TechnicalAnalysisChallengeTechnical divergences andlossofmomentum
BalanceofPowerconclusionsMoneyStreamon-balance volume anddivergences
calculation

divergencesinterpretationtrendconfirmation
price trend angledivergencesunderlying technicalsdivergingfromprice
TexasInstruments(TXN)Theoryinterpretationthetechtrader.com3M(MMM)Tradingsession,preparingfor
analyzing patterns from

previoustradingdaymorningroutinewhattolookfor
Tradingstyletargets,wheretoset
TrailingstopmethodTrendconfirmationTrendlines,drawing
channelsandanglesreviewingandadjustingsupport and resistancelines
VValeroEnergy(VLO)Ventas(VTR)VisionChinaMedia(VISN)Volume Buzz indicator(WordenBrothers)
WWbottomsWavecategories,seriesofWave patterns, marketpredictionsbasedon

WedgesWordenBrothers
BalanceofPowerMoneyStreamVolumeBuzzindicator
WUBA
XXPOLogisticsInc.(XPO)
YYahoo(YHOO)

ZZerocrossoversZhoneTechnologies(ZHNE)

YourpurchaseofProfitableDayandSwingTradingby
HarryBoxerincludes

accesstothe80-minuteonlinevideoseminar.Pleasegotowww.wiley.com/go/boxertradingebooktoverifyyourpurchaseandreceiveanaccess
code.
Fortechnicalsupport,pleasevisit

www.wiley.com.Fortelephonesupport,
pleasecontactusat:1-800-762-2974(U.S.),1-317-572-3994(International).