Rocky Mountain Institute Mountain Institute Empire State Building Case Study Cost-Effective...
80
Rocky Mountain Institute Empire State Building Case Study Cost-Effective Greenhouse Gas Reductions via Whole-Building Retrofits: Process, Outcomes, and What is Needed Next For more information, please visit www.esbsustainability.com
Transcript of Rocky Mountain Institute Mountain Institute Empire State Building Case Study Cost-Effective...
Rocky Mountain Institute
Empire State Building Case Study Cost-Effective Greenhouse Gas Reductions via Whole-Building Retrofits:
Process, Outcomes, and What is Needed Next
For more information, please visit www.esbsustainability.com
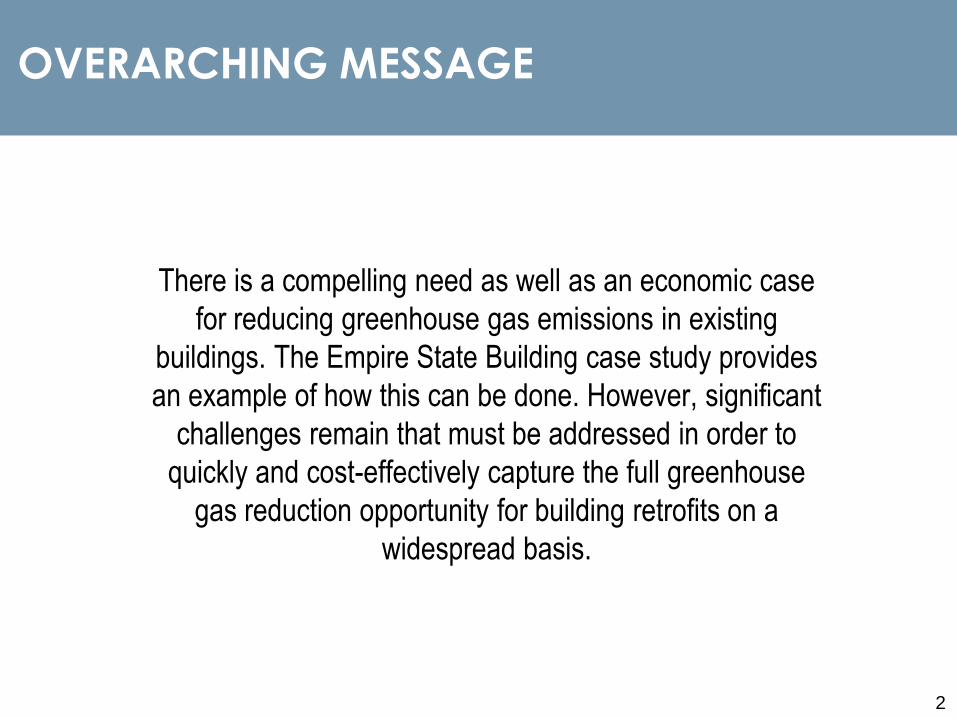
OVERARCHING MESSAGE
There is a compelling need as well as an economic case
for reducing greenhouse gas emissions in existing
buildings. The Empire State Building case study provides
an example of how this can be done. However, significant
challenges remain that must be addressed in order to
quickly and cost-effectively capture the full greenhouse
gas reduction opportunity for building retrofits on a
widespread basis.
2
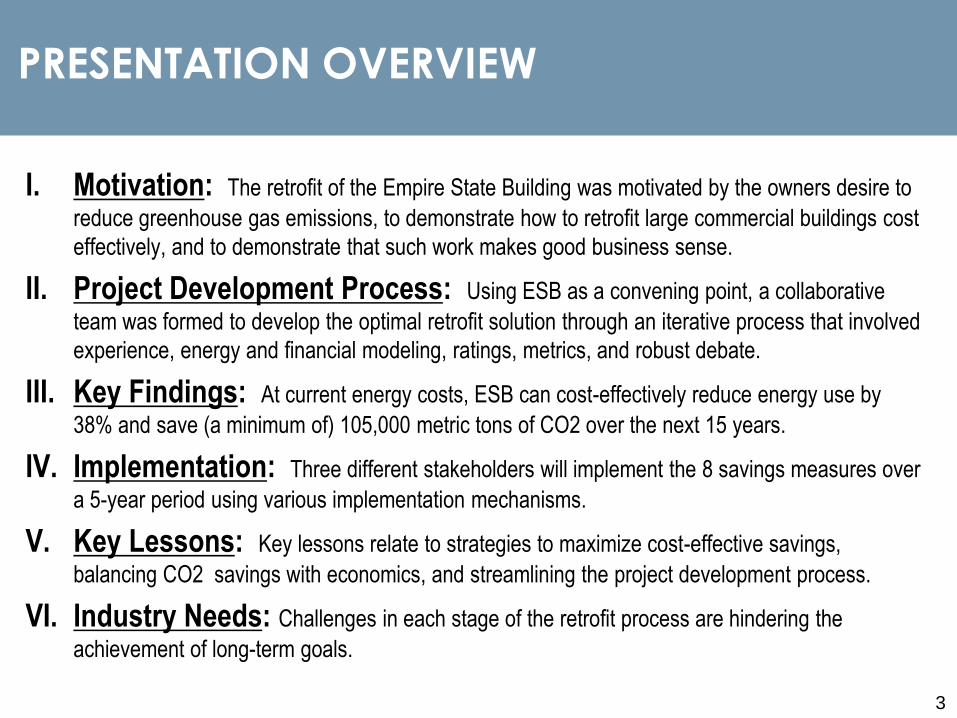
PRESENTATION OVERVIEW
I. Motivation: The retrofit of the Empire State Building was motivated by the owners desire to
reduce greenhouse gas emissions, to demonstrate how to retrofit large commercial buildings cost
effectively, and to demonstrate that such work makes good business sense.
II. Project Development Process: Using ESB as a convening point, a collaborative
team was formed to develop the optimal retrofit solution through an iterative process that involved
experience, energy and financial modeling, ratings, metrics, and robust debate.
III. Key Findings: At current energy costs, ESB can cost-effectively reduce energy use by
38% and save (a minimum of) 105,000 metric tons of CO2 over the next 15 years.
IV. Implementation: Three different stakeholders will implement the 8 savings measures over
a 5-year period using various implementation mechanisms.
V. Key Lessons: Key lessons relate to strategies to maximize cost-effective savings,
balancing CO2 savings with economics, and streamlining the project development process.
VI. Industry Needs: Challenges in each stage of the retrofit process are hindering the
achievement of long-term goals.
3

VI. NeedsV. Key LessonsIV. ImplementationIII. Key FindingsII. Process
I. MOTIVATION
The retrofit of the Empire State Building was motivated by the building
ownership’s desire to:
1) Prove or disprove the economic viability of whole-building energy
efficiency retrofits.
2) Create a replicable model for whole-building retrofits.
3) Reduce greenhouse gas emissions.
I. Motivation

5
Prior to 2008, the Empire State Building’s performance was average compared
to most U.S. office buildings.
Annual utility costs:
• $11 million ($4/sq. ft.)
Annual CO2 emissions:
• 25,000 metric tons (22 lbs/sq. ft.)
Annual energy use:
• 88 kBtu/sq. ft.
Peak electric demand:
• 9.5 MW (3.8 W/sq. ft. inc. HVAC)
I. MOTIVATION1) Prove or disprove the economic viability of whole-building energy efficiency
retrofits.

0
20
40
60
80
100
120
Tota
l ES
B C
apita
l Bud
get (
mill
ion
$)
Capital Budget Adjustments for Energy Efficiency Projects
6
With a $500 million capital improvement program underway, ownership
decided to re-evaluate certain projects with cost-effective energy efficiency
and sustainability opportunities in mind.
I. MOTIVATION1) Prove or disprove the economic viability of whole-building energy efficiency
retrofits.
2008
Capital
Budget for
Energy-
Related
Projects =
$93m+ 0%
Energy
Savings
Sum of adds /
changes / deletes
= +$13m
New Capital
Budget w /
Efficiency
Projects =
$106m
+ 38% Energy
Savings

7
Energy efficiency and sustainability provide amenities (lower energy costs,
easier carbon reporting, daylighting, etc.) that set the building apart from
surrounding tenant space.
($30,000)
($25,000)
($20,000)
($15,000)
($10,000)
($5,000)
$0
$5,000
$10,000
$15,000
1 2 3 4 5 6 7 8 9 10 11 12
Nom
inal
Dol
lars
($)
Year in Lease
Illustrative: Tenant Utility Cash Flow
Annual cost/savings NPV
If tenants understand (and can
capture) the value of extra
investments up front, they are
more likely to make them.
I. MOTIVATION1) Prove or disprove the economic viability of whole-building energy efficiency
retrofits.

VI. NeedsV. Key LessonsIV. ImplementationIII. Key FindingsII. Process
I. MOTIVATION
The retrofit of the Empire State Building was motivated by the building
ownership’s desire to:
1) Prove or disprove the economic viability of whole-building energy
efficiency retrofits.
2) Create a replicable model for whole-building retrofits.
3) Reduce greenhouse gas emissions.
I. Motivation

9
I. MOTIVATION2) Create a replicable model for whole-building retrofits.
There are known opportunities to cost-effectively reduce greenhouse gas
emissions, yet few owners are pursuing them.
Building efficiency measures are identified
as having negative costs.
Source: NRDC - http://www.nrdc.org/globalwarming/blueprint/default.asp
Cutting U.S. Global Warming Pollution 80% by 2050: Cost & Payoff by Sector

10
ESB ownership wants to demonstrate how to cost-effectively retrofit a large
multi-tenant office building to inspire others to embark on whole-building
retrofits.
I. MOTIVATION2) Create a replicable model for whole-building retrofits.
8
VI. NeedsV. Key LessonsIV. ImplementationIII. Key FindingsII. Process
I. MOTIVATION
The retrofit of the Empire State Building was motivated by the building
ownership’s desire to:
1) Prove or disprove the economic viability of whole-building energy
efficiency retrofits.
2) Create a replicable model for whole-building retrofits.
3) Reduce greenhouse gas emissions cost-effectively.
I. Motivation

1
2
We need to reduce greenhouse gas emissions by 75% by 2050 to stabilize
the climate.
I. MOTIVATION3) Reduce Greenhouse Gas Emissions
Business as usual global emissions*
55
62
85
64%68%
76%
2008 2030 2050
We need to be at
20 GtCO2e by
2050 to mitigate
climate change
Today, we’re at
55 GtCO2e
*Source: McKinsey Analysis, IPCC, Stern Review (2006)

1
3
The building sector must be a large part of the solution as it is the largest
contributor to U.S. greenhouse gas emissions.
We need to be at
20 GtCO2e by
2050 to mitigate
climate change
Source: EIA data - Table 12.2: http://www.eia.doe.gov/emeu/aer/envir.html
0
500
1,000
1,500
2,000
2,500
1980 1984 1988 1992 1996 2000 2004
Mill
ion
Met
ric T
ons
of C
arbo
n D
ioxi
de
Year
U.S. CO2 Emissions by End-Use Sector: 1980 - 2006
Buildings Industry Transportation
Buildings are responsible for 38%
of CO2 emissions in the U.S.
I. MOTIVATION3) Reduce Greenhouse Gas Emissions

1
4
Nearly 75% of U.S. commercial buildings are over 20 years old (and thus
ready for retrofit). Retrofitting existing buildings must be part of the solution.
0
2,000
4,000
6,000
8,000
10,000
12,000
14,000
Before 1920 1920 to 1945 1946 to 1959 1960 to 1969 1970 to 1979 1980 to 1989 1990 to 1999 2000 to 2003
Mill
ion
squa
re fe
et o
f Com
mer
cial
Bui
ldin
g
Year Constructed
U.S. Commercial Building Space by Age
Source: EIA data - Table 12.2: http://www.eia.doe.gov/emeu/aer/envir.html
72% of the U.S. commercial stock
was constructed before 1990.
I. MOTIVATION3) Reduce Greenhouse Gas Emissions
VI. NeedsV. Key LessonsIV. ImplementationIII. Key FindingsII. Process
I. MOTIVATION
I. Motivation
“The goal with ESB has been to define intelligent choices which will either save money, spend the same money more efficiently, or spend additional sums for which there is reasonable payback through savings. Addressing these investments correctly will create a competitive advantage for ownership through lower costs and better work environment for tenants. Succeeding in these efforts will make a replicable model for others to follow.”
- Anthony E. Malkin

II. PROJECT DEVELOPMENT PROCESS
Using ESB as a convening point, a collaborative team was formed to
develop the optimal solution through a rigorous and iterative process that
involved experience, energy and financial modeling, ratings systems,
technical advice, and robust debate. Key points include:
1) Five key groups and a host of contributors used a collaborative and
iterative approach.
2) A 4-phase project development process helped guide progress.
3) A variety of complementary tools were used and developed to
triangulate to the best answer.
VI. NeedsV. Key LessonsIV. ImplementationIII. Key FindingsII. ProcessI. Motivation

17
II. PROJECT DEVELOPMENT PROCESS1) Five key groups and contributors used a collaborative and iterative approach.
The project development process, which the team focused on, is the first step
towards executing and verifying the success of a retrofit.
Project development is focused on understanding current performance, analyzing
opportunities, and determining which projects to implement.
Project
Execution
Measurement &
Verification
2010 2025Retrofit Project Timeline

18
Core team members for the project development process included the Clinton
Climate Initiative (CCI), Johnson Controls Inc. (JCI), Jones Lang LaSalle (JLL),
Rocky Mountain Institute (RMI), and the Empire State Building (ESB).
OwnerEmpire State
Building Company LLC
Project ManagerJones Lang LaSalle
Energy Service
CompanyJohnson Controls Inc.
Project AdvisorClinton Climate Initiative
Design Partner &
Peer ReviewerRocky Mountain
Institute
Operations
ReviewerEmpire State
Building Operations
II. PROJECT DEVELOPMENT PROCESS1) Five key groups and contributors used a collaborative and iterative approach.
Team Organization Chart
19
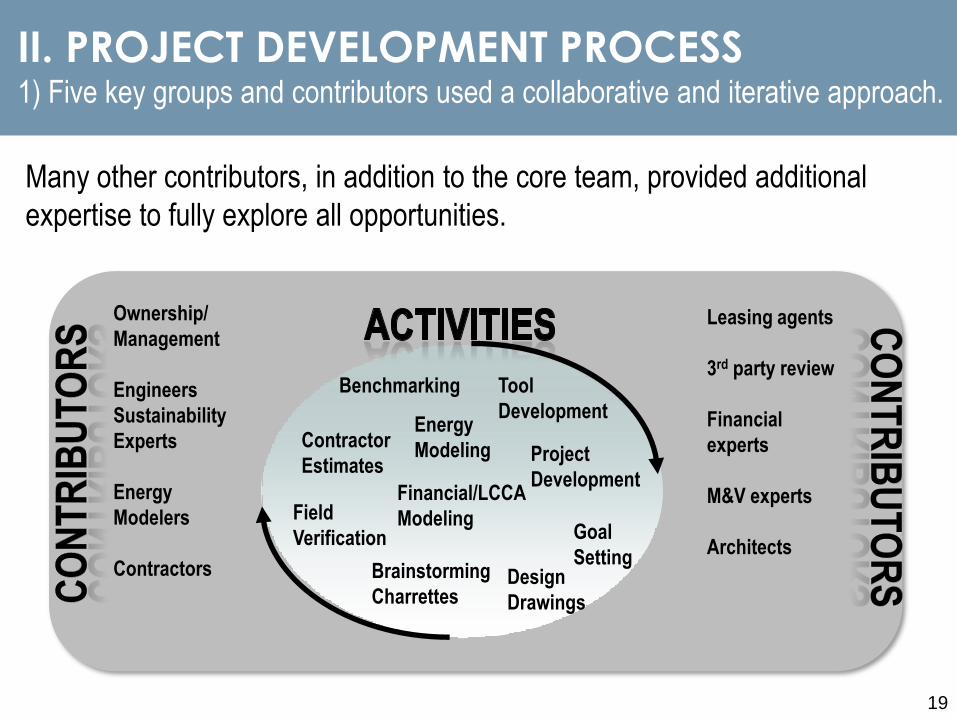
Many other contributors, in addition to the core team, provided additional
expertise to fully explore all opportunities.
II. PROJECT DEVELOPMENT PROCESS1) Five key groups and contributors used a collaborative and iterative approach.
Leasing agents
3rd party review
Financial
experts
M&V experts
Architects
Ownership/
Management
Engineers
Sustainability
Experts
Energy
Modelers
Contractors
Goal
SettingBrainstorming
Charrettes
Benchmarking
Contractor
Estimates
Design
Drawings
Energy
Modeling
Financial/LCCA
Modeling
Tool
Development
Field
Verification
Project
Development

II. PROJECT DEVELOPMENT PROCESS
Using ESB as a convening point, a collaborative team was formed to
develop the optimal energy efficiency retrofit solution through a rigorous and
iterative process that involved experience, energy and financial modeling,
ratings systems, technical advice, and robust debate. Key points include:
1) Five key groups and a host of contributors used a collaborative and
iterative approach.
2) A 4-phase project development process helped guide progress.
3) A variety of complementary tools were used and developed to
triangulate to the best answer.
VI. NeedsV. Key LessonsIV. ImplementationIII. Key FindingsII. ProcessI. Motivation

21
Project activities (audits, workshops, presentations, analyses, reports, etc.)
were divided into 4 phases.
II. PROJECT DEVELOPMENT PROCESS2) A 4-phase project development process helped guide progress.
Phase I: Inventory & Programming
Phase II: DesignDevelopment
Phase III: DesignDocumentation
Phase IV: FinalDocumentation
• Tenant Initiatives (prebuilts,
design guidelines, energy
management) Report
• Tuned eQUEST model
• Model (eQUEST, financial,
GHG) outputs
• Integrated Sustainability
Master Plan Report (inc.
Energy Master Plan)
• April 14th kick-off meeting
• May 7th/May 14th team
workshops
• June 2nd Presentation to
Ownership
• Baseline Capital Projects
Report
• Baseline Energy
Benchmark Report
• June 18th Theoretical
Minimum workshop
• July 2nd workshop
• July 15th Presentation to
ownership
• July 30th Tenant Focus
workshop
• August 13th eQUEST
workshop
• August 27th Presentation to
Ownership
• Sept. 10th workshop
• Sept 29th Presentation to
Ownership
• October 6-8th Finance
workshop (Boulder)
• Nov 10th Presentation to
Ownership
Act
iviti
esO
utpu
ts
22
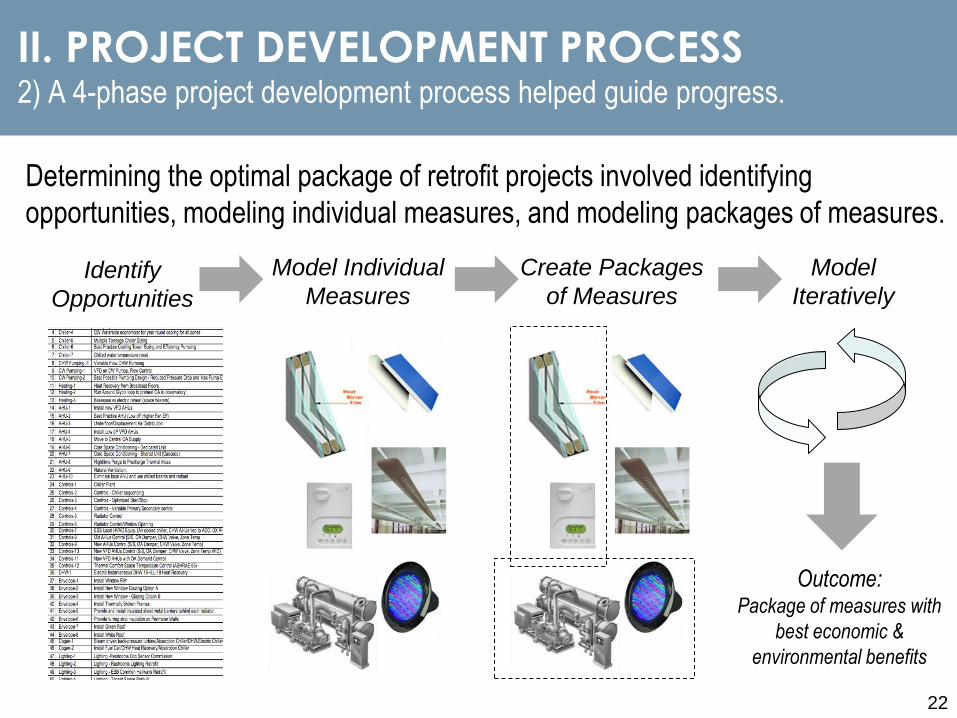
Determining the optimal package of retrofit projects involved identifying
opportunities, modeling individual measures, and modeling packages of measures.
II. PROJECT DEVELOPMENT PROCESS2) A 4-phase project development process helped guide progress.
Identify
Opportunities
Model Individual
Measures
Create Packages
of Measures
Model
Iteratively
Outcome:Package of measures with
best economic &
environmental benefits

23
Significant time was spent 1) refining energy and financial model inputs to ensure
outputs were accurate and 2) understanding the critical relationship between
economics and CO2 reductions.
II. PROJECT DEVELOPMENT PROCESS2) A 4-phase project development process helped guide progress.
2008 2010 2012 2014 2016 2018 2020 2022Dol
lars
($)
Incremental Cash Flow for each Package of Measures
2008 2010 2012 2014 2016 2018 2020 2022
Abs
olut
e M
etric
Ton
s of
CO
2
CO2 Emissions for each Package

II. PROJECT DEVELOPMENT PROCESS
Using ESB as a convening point, a collaborative team was formed to
develop the optimal solution through a rigorous and iterative process that
involved experience, energy and financial modeling, ratings systems,
technical advice, and robust debate. Key points include:
1) Five key groups and a host of contributors used a collaborative and
iterative approach.
2) A 4-phase project development process helped guide progress.
3) A variety of complementary tools were used and developed to
triangulate to the best answer.
VI. NeedsV. Key LessonsIV. ImplementationIII. Key FindingsII. ProcessI. Motivation

25
Industry standard and newly developed design tools, decision-making tools,
and rating tools helped to evaluate and benchmark existing and future
performance.
II. PROJECT DEVELOPMENT PROCESS3) A variety of tools were used and developed to triangulate to the best answer.
Design Tools Decision-Making Tools Rating Tools

III. KEY FINDINGS
At current energy costs, the Empire State Building can cost-effectively
reduce energy use by 38% and save (a minimum of) 105,000 metric tons of
CO2 over the next 15 years.
1) Eight interactive levers ranging from base building measures to
tenant engagement deliver these results.
2) Key reductions in peak cooling and electric loads are possible.
3) Enhanced work environments are created.
4) Various green certifications can be obtained.
VI. NeedsV. Key LessonsIV. ImplementationIII. Key FindingsII. ProcessI. Motivation

27
The Empire State Building can achieve a high level of energy and CO2
reduction cost-effectively.
III. KEY FINDINGS1) Eight interactive levers ranging from base building measures to tenant
engagement deliver these results.
NPV “Max”
NPV “Mid”
NPV “Neutral”
“Max CO2” Reduction
($25,000)
($5,000)
$15,000
$35,000
0 40,000 80,000 120,000 160,000
Net
Pre
sent
Val
ue o
f Pac
kage
of M
easu
res
Thousands
Cumulative metric tons of CO2 saved over 15 years
15-Year NPV of Package versus Cumulative CO2 Savings
There are diminishing (and
expensive) returns for
greater efficiency.
A solution that
balances CO2
reductions and
financial returns is
in this range.

28
Achieving an energy reduction greater than 38% appears to be cost-prohibitive.
III. KEY FINDINGS1) Eight interactive levers ranging from base building measures to tenant
engagement deliver these results.
($2,000)
$0
$2,000
$4,000
Cos
t per
Met
ric T
on o
f CO
2
Cost per Metric Ton of CO2 by Individual Measure
The average cost per ton of carbon dioxide saved for
the first 90% of the savings is -$200/ton while the
average cost per ton for the last 10% is over $300 per ton.

29
Energy and CO2 savings in the optimal package result from 8 key projects.
III. KEY FINDINGS1) Eight interactive levers ranging from base building measures to tenant
engagement deliver these results.
9%6%
5%5%
5%3% 3% 2%
0
100,000
200,000
300,000
Ann
ual E
nerg
y U
se (
kBtu
)Th
ousands
Annual Energy Savings by Measure
38%
Reduction

30
Taking the right steps in the right order ensures loads are minimized prior to
investigating expensive new equipment or controls.
III. KEY FINDINGS1) Eight interactive levers ranging from base building measures to tenant
engagement deliver these results.
Reduce Loads
Use Efficient Technology
Provide Controls
31
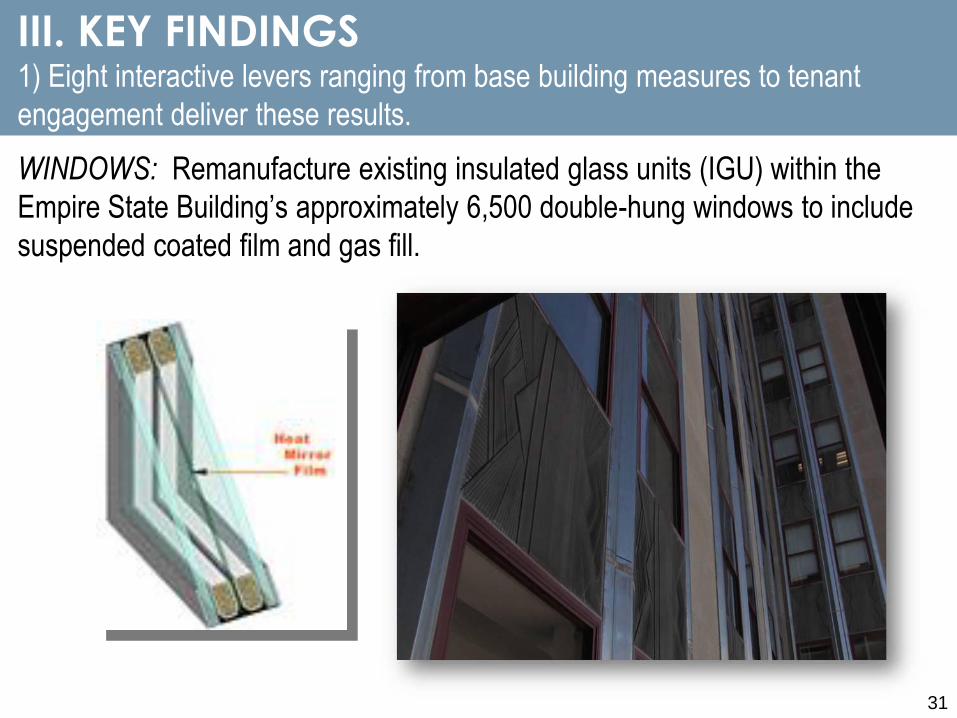
WINDOWS: Remanufacture existing insulated glass units (IGU) within the
Empire State Building’s approximately 6,500 double-hung windows to include
suspended coated film and gas fill.
III. KEY FINDINGS1) Eight interactive levers ranging from base building measures to tenant
engagement deliver these results.

32
RADIATIVE BARRIER: Install more than six-thousand insulated reflective
barriers behind radiator units located on the perimeter of the building.
III. KEY FINDINGS1) Eight interactive levers ranging from base building measures to tenant
engagement deliver these results.

33
TENANT DAYLIGHTING / LIGHTING / PLUGS: This measure involves
reducing lighting power density in tenant spaces, installing dimmable ballasts
and photosensors for perimeter spaces, and providing occupants with a plug
load occupancy sensor for their personal workstation.
III. KEY FINDINGS1) Eight interactive levers ranging from base building measures to tenant
engagement deliver these results.

34
CHILLER PLANT RETROFIT: The chiller plant retrofit project includes the
retrofit of four industrial electric chillers in addition to upgrades to controls,
variable speed drives, and primary loop bypasses.
III. KEY FINDINGS1) Eight interactive levers ranging from base building measures to tenant
engagement deliver these results.

35
VAV AIR HANDLING UNITS: Replace existing constant volume units with
variable air volume units using a new air handling layout (two floor-mounted
units per floor instead of four ceiling-hung units).
III. KEY FINDINGS1) Eight interactive levers ranging from base building measures to tenant
engagement deliver these results.

36
DDC CONTROLS: The measure involves upgrading the existing control
systems at the Empire State Building.
III. KEY FINDINGS1) Eight interactive levers ranging from base building measures to tenant
engagement deliver these results.

37
DEMAND CONTROL VENTILATION: This project involves the installation of
CO2 sensors for control of outside air introduction to chiller water and DX Air
Handling Units.
III. KEY FINDINGS1) Eight interactive levers ranging from base building measures to tenant
engagement deliver these results.
38
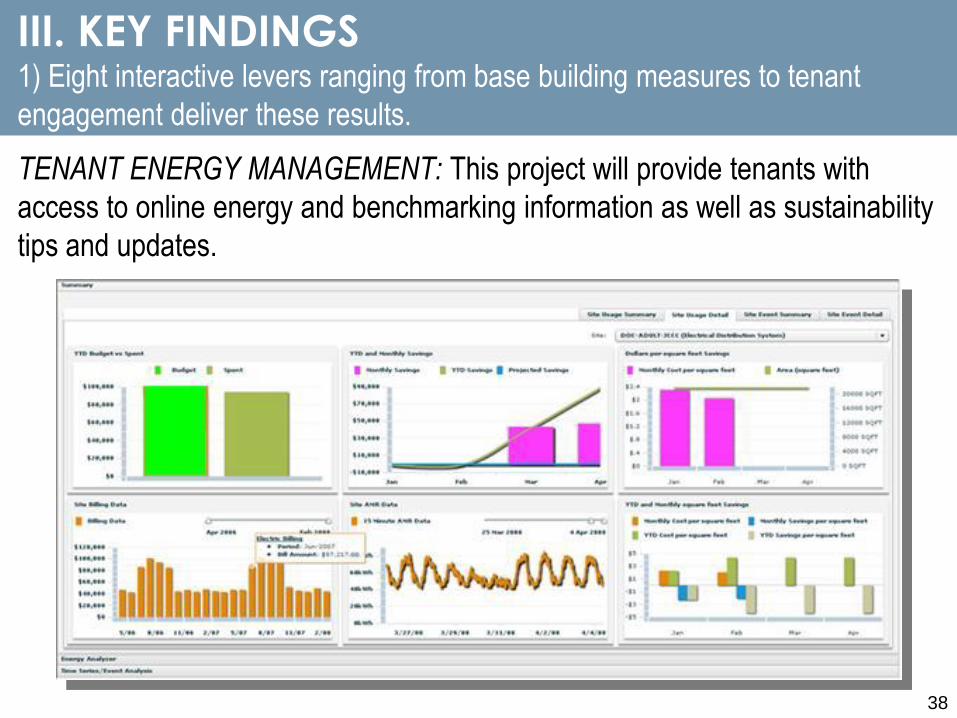
TENANT ENERGY MANAGEMENT: This project will provide tenants with
access to online energy and benchmarking information as well as sustainability
tips and updates.
III. KEY FINDINGS1) Eight interactive levers ranging from base building measures to tenant
engagement deliver these results.

39
Though it is more informative to look at financials for the package of measures,
capital costs and energy savings were determined for each individual measure.
III. KEY FINDINGS1) Eight interactive levers ranging from base building measures to tenant
engagement deliver these results.
Project
Description
Projected
Capital Cost
2008 Capital
Budget
Incremental
Cost
EstimatedAnnual
Energy Savings*
Windows $4.5m $455k $4m $410k
Radiative Barrier $2.7m $0 $2.7m $190k
DDC Controls $7.6m $2m $5.6m $741k
Demand Control Vent Inc. above $0 Inc. above $117k
Chiller Plant Retrofit $5.1m $22.4m -$17.3m $675k
VAV AHUs $47.2m $44.8m $2.4m $702k
Tenant Day/Lighting/Plugs $24.5m $16.1m $8.4m $941k
Tenant Energy Mgmt. $365k $0 $365k $396k
Power Generation (optional) $15m $7.8m $7m $320k
TOTAL (ex. Power Gen) $106.9m $93.7m $13.2m $4.4m
*Note that energy savings are also incremental to the original capital budget.

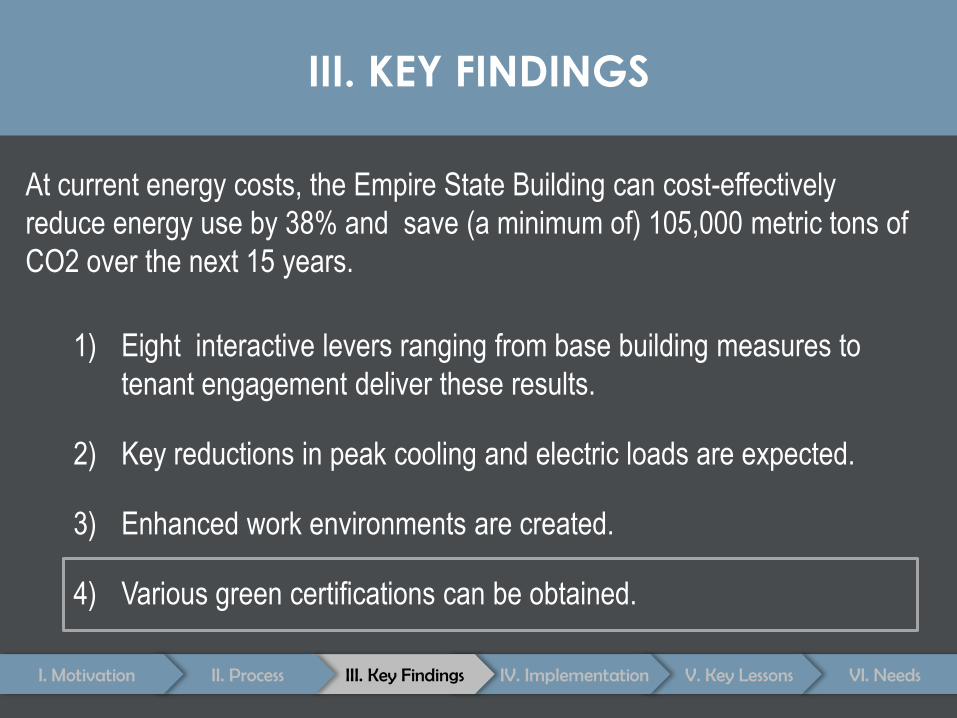
III. KEY FINDINGS
At current energy costs, the Empire State Building can cost-effectively
reduce energy use by 38% and save (a minimum of) 105,000 metric tons of
CO2 over the next 15 years.
1) Eight interactive levers ranging from base building measures to
tenant engagement deliver these results.
2) Key reductions in peak cooling and electric loads are expected.
3) Enhanced work environments are created.
4) Various green certifications can be obtained.
VI. NeedsV. Key LessonsIV. ImplementationIII. Key FindingsII. ProcessI. Motivation

41
The selected package of measures reduces peak cooling requirements by 33%
(1600 tons) enabling immediate and future CapEx avoidance.
III. KEY FINDINGS2) Key reductions in peak cooling and electric loads are expected.
NPV Max Package
NPV Mid Package
NPV Neutral Package
CO2 Max Package-20,000
-10,000
0
10,000
20,000
30,000
40,000
0 200 400 600 800 1,000 1,200 1,400 1,600 1,800 2,000
Net
Pre
sent
Val
ue (
$)Th
ousands
Reduction in Peak Cooling Capacity
Cost of Cooling Efficiency
The 1600-ton load reduction allows for
the chiller retrofit instead of
replacement/adding capacity.

42
The optimal package of measures also reduces peak electrical demand by 3.5
MW, benefitting both the building and the utility.
III. KEY FINDINGS2) Key reductions in peak cooling and electric loads are expected.
0
2
4
6
8
10
12
Offi
ce B
uild
ing
Pea
k D
eman
d (M
W)
Current
Peak
Capacity
Office Building Electrical Capacity
Future
Peak
Capacity
If on-site back-up generation is desired, options include:
• Cogeneration;
• Gas-fired/bio-fuel fired generation;
• Fuel cells;
• Renewables (PV/wind); and
• Purchasing new capacity from Con
Edison

III. KEY FINDINGS
At current energy costs, the Empire State Building can cost-effectively
reduce energy use by 38% and save (a minimum of) 105,000 metric tons of
CO2 over the next 15 years.
1) Eight interactive levers ranging from base building measures to
tenant engagement deliver these results.
2) Key reductions in peak cooling and electric loads are expected.
3) Enhanced work environments are created.
4) Various green certifications can be obtained.
VI. NeedsV. Key LessonsIV. ImplementationIII. Key FindingsII. ProcessI. Motivation

44
This package of measures also results in enhanced indoor environmental
quality and additional amenities for tenants:
III. KEY FINDINGS3) Enhanced work environments are created.
• Better thermal comfort resulting from better windows, radiative
barrier, and better controls;
• Improved indoor air quality resulting from DCV; and
• Better lighting conditions that coordinate
ambient and task lighting.
III. KEY FINDINGS
At current energy costs, the Empire State Building can cost-effectively
reduce energy use by 38% and save (a minimum of) 105,000 metric tons of
CO2 over the next 15 years.
1) Eight interactive levers ranging from base building measures to
tenant engagement deliver these results.
2) Key reductions in peak cooling and electric loads are expected.
3) Enhanced work environments are created.
4) Various green certifications can be obtained.
VI. NeedsV. Key LessonsIV. ImplementationIII. Key FindingsII. ProcessI. Motivation
46
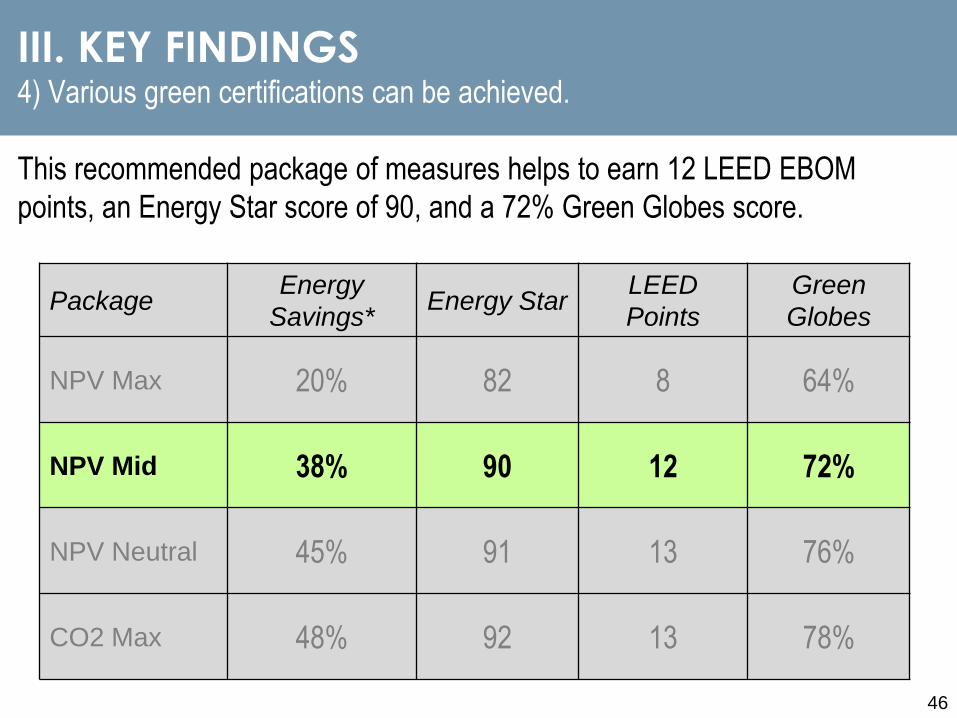
This recommended package of measures helps to earn 12 LEED EBOM
points, an Energy Star score of 90, and a 72% Green Globes score.
III. KEY FINDINGS4) Various green certifications can be achieved.
PackageEnergy
Savings* Energy Star
LEED
Points
Green
Globes
NPV Max 20% 82 8 64%
NPV Mid 38% 90 12 72%
NPV Neutral 45% 91 13 76%
CO2 Max 48% 92 13 78%

47
The Empire State Building will be pursuing the Energy Star label as well as
Gold certification under the LEED for Existing Buildings: Operation &
Maintenance Rating System.
III. KEY FINDINGS4) Various green certifications can be achieved.

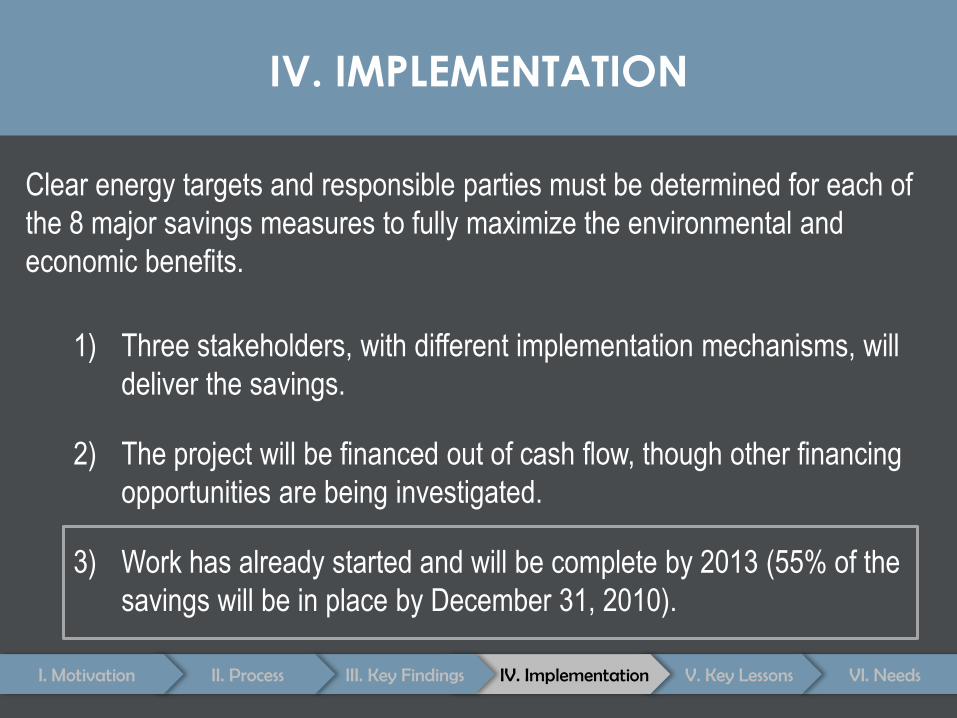
IV. IMPLEMENTATION
Clear energy targets and responsible parties must be determined for each of
the 8 major savings measures to fully maximize the environmental and
economic benefits.
1) Three stakeholders, with different implementation mechanisms, will
deliver the savings.
2) The project will be financed out of cash flow, though other financing
opportunities are being investigated.
3) Work has already started and will be complete by 2013 (55% of the
savings will be in place by December 31, 2010).
VI. NeedsV. Key LessonsIV. ImplementationIII. Key FindingsII. ProcessI. Motivation

49
Johnson Controls, the Empire State Building, and Tenants are each
responsible for delivering some of the total savings.
IV. IMPLEMENTATION1) Three stakeholders, with different implementation mechanisms, will deliver
the savings.
61%
22%17%
0
50,000,000
100,000,000
150,000,000
200,000,000
250,000,000
Adjusted Baseline JCI ESB Tenant NPV Mid
Ann
ual E
nerg
y S
avin
gs (
kBtu
)
Energy Savings by Implementation Stakeholder
50
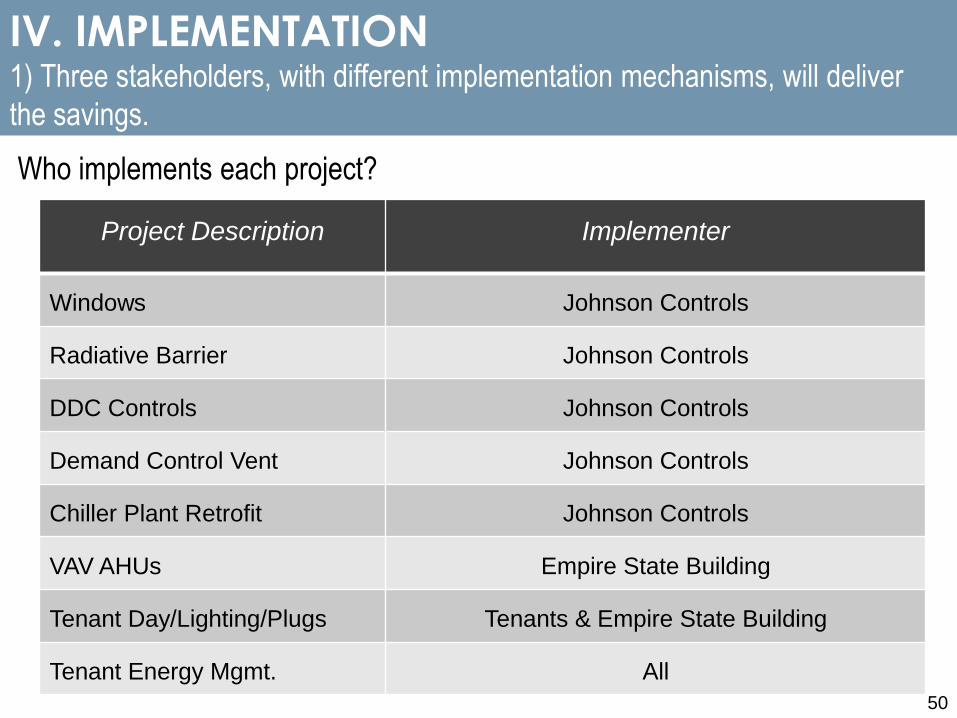
Who implements each project?
Project Description Implementer
Windows Johnson Controls
Radiative Barrier Johnson Controls
DDC Controls Johnson Controls
Demand Control Vent Johnson Controls
Chiller Plant Retrofit Johnson Controls
VAV AHUs Empire State Building
Tenant Day/Lighting/Plugs Tenants & Empire State Building
Tenant Energy Mgmt. All
IV. IMPLEMENTATION1) Three stakeholders, with different implementation mechanisms, will deliver
the savings.

51
Johnson Controls Inc will deliver 61% of the total savings using a performance
contract mechanism. Five different performance contracts have a total cost of
$20 million and guaranteed savings of ~20% percent.
IV. IMPLEMENTATION1) Three stakeholders, with different implementation mechanisms, will deliver
the savings.
How does the Performance Contract work?
1. ESB pays JCI guaranteed maximum price for capital cost of all
projects
2. ESB accrues energy savings as a result of the
retrofit projects … if savings are too low,
JCI pays ESB the difference.
3. Savings guarantee term is 15 years JCI61%
ESB22%
ESB/ Tenants
17%

52
Empire State Building will deliver 22% of the total available savings as air
handling units and pre-built spaces are replaced over the next 4 years.
IV. IMPLEMENTATION1) Three stakeholders, with different implementation mechanisms, will deliver
the savings.
JCI61%
ESB22%
ESB/ Tenants
17%

53
ESB is responsible for helping/incentivizing tenants to pay for and achieve
nearly 20% of the total available energy savings as spaces turnover.
IV. IMPLEMENTATION1) Three stakeholders, with different implementation mechanisms, will deliver
the savings.
JCI61%
ESB22%
ESB/ Tenants
17%
54
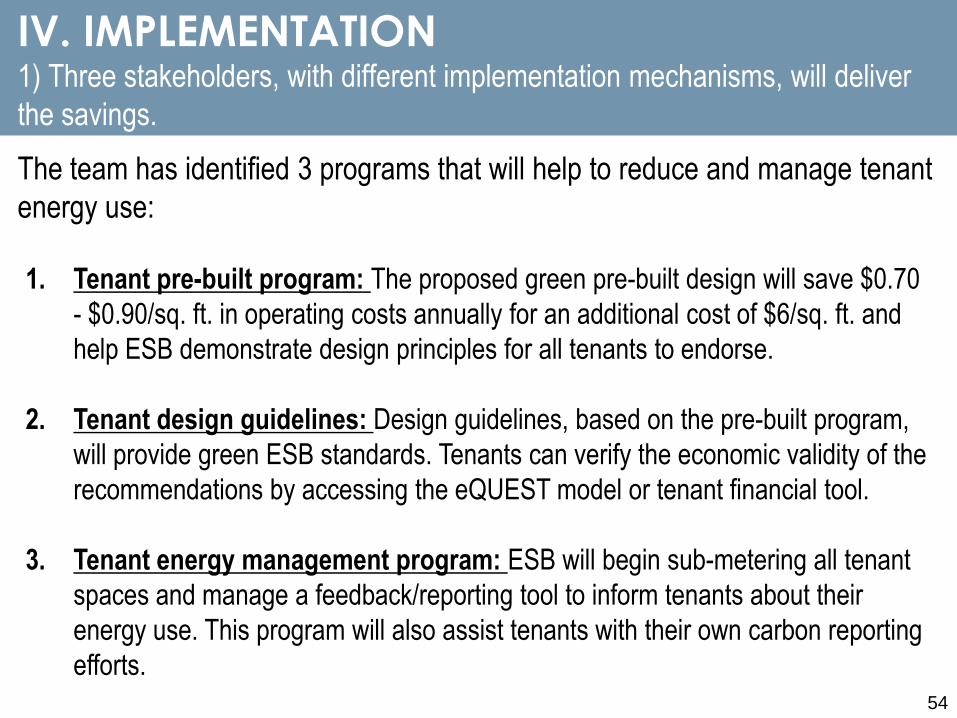
The team has identified 3 programs that will help to reduce and manage tenant
energy use:
IV. IMPLEMENTATION1) Three stakeholders, with different implementation mechanisms, will deliver
the savings.
1. Tenant pre-built program: The proposed green pre-built design will save $0.70
- $0.90/sq. ft. in operating costs annually for an additional cost of $6/sq. ft. and
help ESB demonstrate design principles for all tenants to endorse.
2. Tenant design guidelines: Design guidelines, based on the pre-built program,
will provide green ESB standards. Tenants can verify the economic validity of the
recommendations by accessing the eQUEST model or tenant financial tool.
3. Tenant energy management program: ESB will begin sub-metering all tenant
spaces and manage a feedback/reporting tool to inform tenants about their
energy use. This program will also assist tenants with their own carbon reporting
efforts.

IV. IMPLEMENTATION
Clear energy targets and responsible parties must be determined for each of
the 8 major savings measures to fully maximize the environmental and
economic benefits.
1) Three stakeholders, with different implementation mechanisms, will
deliver the savings.
2) The project will be financed out of cash flow, though other financing
opportunities are being investigated.
3) Work has already started and will be complete by 2013 (55% of the
savings will be in place by December 31, 2010).
VI. NeedsV. Key LessonsIV. ImplementationIII. Key FindingsII. ProcessI. Motivation

56
The additional $13.2 million required for energy efficiency projects will be paid
for out of cash flow.
IV. IMPLEMENTATION2) The project will be financed out of cash flow, though other financing
opportunities are being investigated.
0
20
40
60
80
100
120
Tota
l ES
B C
apita
l Bud
get (
mill
ion
$)
Capital Budget Adjustments for Energy Efficiency Projects
2008
Capital
Budget for
Energy-
Related
Projects =
$93m+ 0%
Energy
Savings
Sum of adds /
changes / deletes
= +$13m
New Capital
Budget w /
Efficiency
Projects =
$106m
+ 38% Energy
Savings
IV. IMPLEMENTATION
Clear energy targets and responsible parties must be determined for each of
the 8 major savings measures to fully maximize the environmental and
economic benefits.
1) Three stakeholders, with different implementation mechanisms, will
deliver the savings.
2) The project will be financed out of cash flow, though other financing
opportunities are being investigated.
3) Work has already started and will be complete by 2013 (55% of the
savings will be in place by December 31, 2010).
VI. NeedsV. Key LessonsIV. ImplementationIII. Key FindingsII. ProcessI. Motivation

58
The projects to be implemented via the Johnson Controls performance contract
will be complete by October 2010. The remaining projects will be complete by
December 2013.
IV. IMPLEMENTATION3) Work has already started and will be complete by 2013.
April
2009
October
2010
December
2013
Chiller Plant RetrofitFinal
engineering &
subcontractor
awards
DDC Controls
Demand Control Ventilation
Windows
Radiators
AHU replacement
Tenant Energy Management
Tenant Lighting, Daylighting, Plugs

V. LESSONS LEARNED
Key lessons learned for the retrofit of large commercial office buildings
include:
1) The maximum cost-effective savings are achieved by:
a) Taking a whole-systems, dynamic, life-cycle approach;
b) Coordinating projects with equipment replacement cycles; and
c) Addressing tenant spaces.
2) At a certain point, there is tension between CO2 savings and
business value (even with anticipated CO2 regulations).
3) The process can and must be streamlined.
VI. NeedsV. Key LessonsIV. ImplementationIII. Key FindingsII. ProcessI. Motivation
60
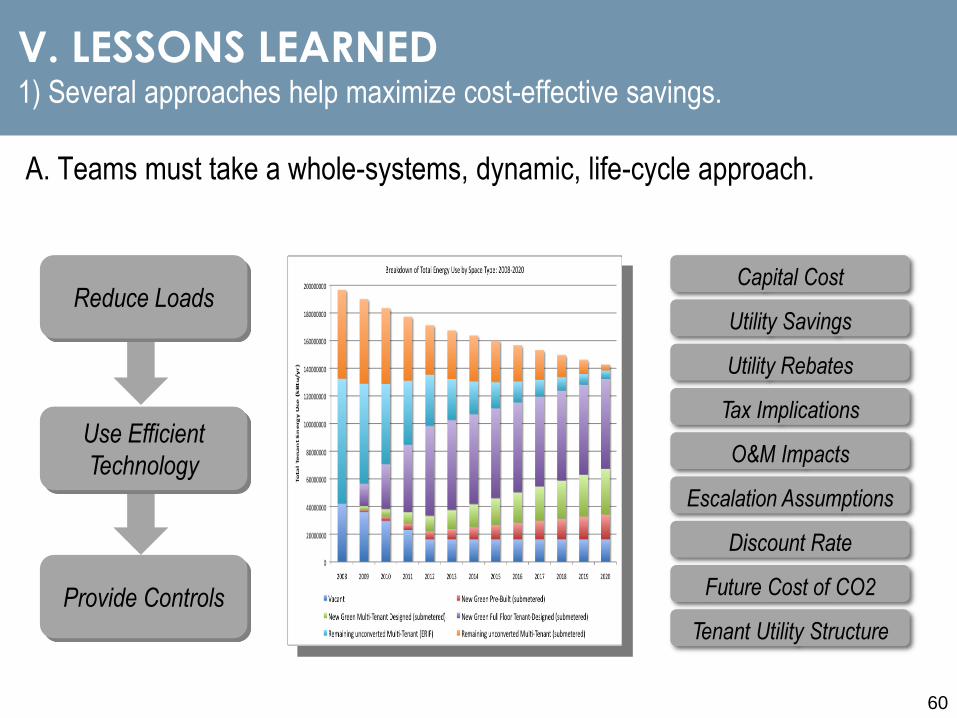
A. Teams must take a whole-systems, dynamic, life-cycle approach.
V. LESSONS LEARNED1) Several approaches help maximize cost-effective savings.
Reduce Loads
Use Efficient
Technology
Provide Controls
Capital Cost
Utility Savings
Utility Rebates
Tax Implications
O&M Impacts
Escalation Assumptions
Discount Rate
Future Cost of CO2
Tenant Utility Structure

61
B. Projects are most cost-effective when coordinated with equipment
replacement cycles.
V. LESSONS LEARNED1) Several approaches help maximize cost-effective savings.
($100,000,000)
($80,000,000)
($60,000,000)
($40,000,000)
($20,000,000)
$0
$20,000,000
$40,000,000
0 20,000 40,000 60,000 80,000 100,000 120,000 140,000 160,000
Net
Pre
sent
Val
ue o
f Pac
kage
of M
easu
res
Cumulative metric tons of CO2 saved over 15 years
15-Year NPV of Package versus Cumulative CO2 Savings
Incremental
CapEx
Absolute
CapEx
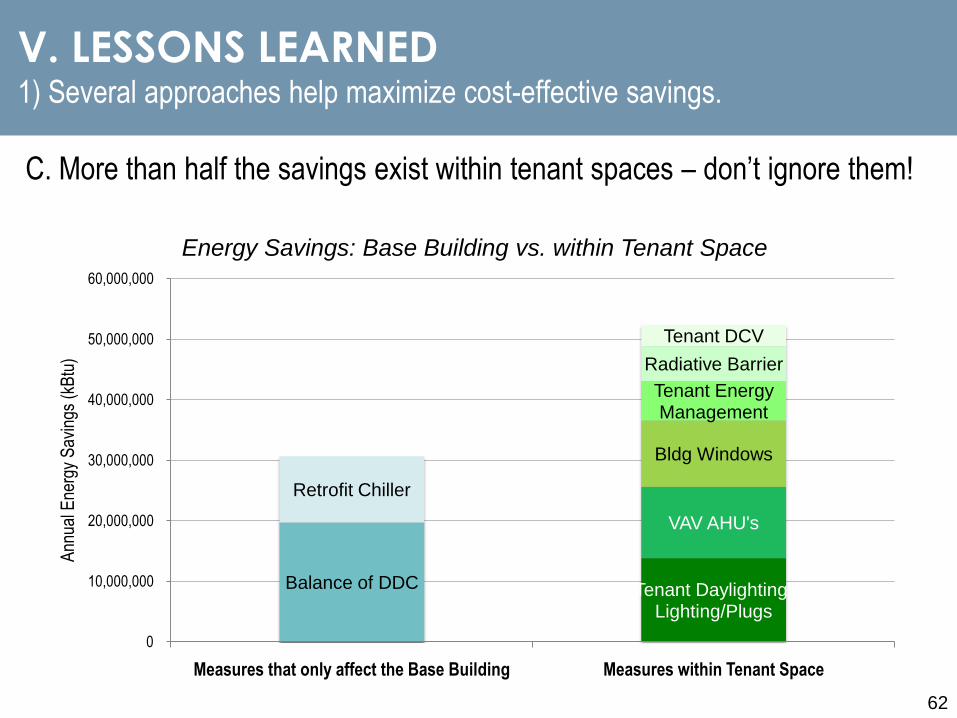
62
V. LESSONS LEARNED1) Several approaches help maximize cost-effective savings.
C. More than half the savings exist within tenant spaces – don’t ignore them!
Balance of DDC
Retrofit Chiller
Tenant Daylighting/Lighting/Plugs
VAV AHU's
Bldg Windows
Tenant EnergyManagement
Radiative Barrier
Tenant DCV
0
10,000,000
20,000,000
30,000,000
40,000,000
50,000,000
60,000,000
Measures that only affect the Base Building Measures within Tenant Space
Ann
ual E
nerg
y S
avin
gs (
kBtu
)
Energy Savings: Base Building vs. within Tenant Space

V. LESSONS LEARNED
Key lessons learned for the retrofit of large commercial office buildings
include:
1) The maximum cost-effective savings are achieved by:
a) Taking a whole-systems, dynamic, life-cycle approach;
b) Coordinating projects with equipment replacement cycles; and
c) Addressing tenant spaces.
2) At a certain point, there is tension between CO2 savings and
business value (even with anticipated CO2 regulations).
3) The process can and must be streamlined.
VI. NeedsV. Key LessonsIV. ImplementationIII. Key FindingsII. ProcessI. Motivation

64
V. LESSONS LEARNED2) At a certain point, there is tension between CO2 savings and business value.
Maximizing business value leaves considerable CO2 on the table.
20%
19%
7%3%
0
50,000,000
100,000,000
150,000,000
200,000,000
250,000,000
Adjusted Baseline NPV Max NPV Mid NPV Neutral CO2 Max Year 15
Ann
ual E
nerg
y C
ost i
n D
olla
rs
Energy Cost Savings by Package
Choice package to
maximize NPV.

65
V. LESSONS LEARNED2) At a certain point, there is tension between CO2 savings and business value.
Attempting to save CO2 faster may be cost prohibitive.
NPV Mid
NPV MidAcclerated
($40,000,000)
($30,000,000)
($20,000,000)
($10,000,000)
$0
$10,000,000
$20,000,000
$30,000,000
$40,000,000
0 20,000 40,000 60,000 80,000 100,000 120,000 140,000 160,000
Net
Pre
sent
Val
ue o
f Pac
kage
of M
easu
res
Cumulative metric tons of CO2 saved over 15 years
15-Year NPV of Package versus Cumulative CO2 Savings
Acceleration reduces the
NPV as projects become
out of sync with
replacement cycles

66
V. LESSONS LEARNED2) At a certain point, there is tension between CO2 savings and business value.
Anticipated CO2 regulation in the U.S. doesn’t change the solution set …
though European levels of regulation would.
($30,000,000)
($20,000,000)
($10,000,000)
$0
$10,000,000
$20,000,000
$30,000,000
$40,000,000
$50,000,000
0 20,000 40,000 60,000 80,000 100,000 120,000 140,000 160,000
NP
V (
$)
Cumulative CO2 Savings (Metric Tons)
15-Yr NPV and Cumulative CO2 Savings at Fluctuating Carbon Costs
No Regulation .33% CA: Low Carbon Economy Act1.34%: RGGI 2% CA: Lieberman Warner8.8% CA: EU OTC

V. LESSONS LEARNED
Key lessons learned for the retrofit of large commercial office buildings
include:
1) The maximum cost-effective savings are achieved by:
a) Taking a whole-systems, dynamic, life-cycle approach;
b) Coordinating projects with equipment replacement cycles; and
c) Addressing tenant spaces.
2) At a certain point, there is tension between CO2 savings and
business value (even with anticipated CO2 regulations).
3) The process can and must be streamlined.
VI. NeedsV. Key LessonsIV. ImplementationIII. Key FindingsII. ProcessI. Motivation

68
V. LESSONS LEARNED3) The process can and must be streamlined.
Several opportunities to reduce the time and cost of the project development
process exist.
Project Development Time
Improved Process Apply Insights Improved Tools Optimized Project Development Time
Tim
e an
d C
osts
Opportunities to Improve Project Development Process
Reduction in
time and costs?

VI. INDUSTRY NEEDS
This project was a great “test lab”, but what now? If all buildings need to be
retrofitted to profitably reduce greenhouse gas emissions by 75% by 2050,
we have a lot of work to do in a short amount of time.
VI. NeedsV. Key LessonsIV. ImplementationIII. Key FindingsII. ProcessI. Motivation
Opportunity Areas: Residential, Commercial, Industrial
Barriers: What is preventing us from reaching our goal?
Outcome: 75% Reduction by 2050
Strategies: What is the most impactful way to overcome barriers?
Coordination: Who is working on what and what can you do?
Project
Origin
Project
Development
Construction &
Commissioning
Financing&
Contracting
Measurement
& Verification
70
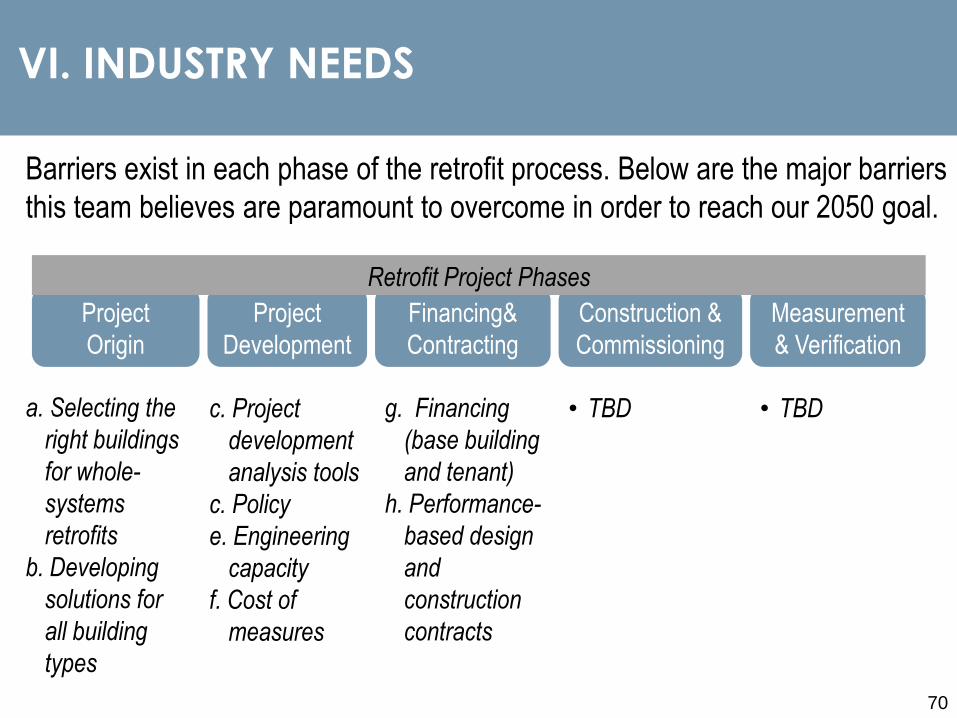
VI. INDUSTRY NEEDS
Barriers exist in each phase of the retrofit process. Below are the major barriers
this team believes are paramount to overcome in order to reach our 2050 goal.
Retrofit Project Phases
c. Project
development
analysis tools
c. Policy
e. Engineering
capacity
f. Cost of
measures
g. Financing
(base building
and tenant)
h. Performance-
based design
and
construction
contracts
• TBD • TBDa. Selecting the
right buildings
for whole-
systems
retrofits
b. Developing
solutions for
all building
types

71
VI. INDUSTRY NEEDSa) Select the right buildings for whole-systems retrofits
Retrofitting the right buildings in the right order can reduce the societal cost
($/metric ton) for carbon abatement.
1
3
2
4

72
VI. INDUSTRY NEEDSb) Develop solutions for small to mid-range commercial buildings.
Most retrofit or energy service companies only address large commercial
buildings or residential buildings. Yet 95% of the U.S. building stock is small to
mid-sized buildings that consume 44% of total energy use.
Source: EIA data

73
VI. INDUSTRY NEEDSc) Develop better project development tools.
Significant time was spent creating the energy and financial models for this
building and then iterating between them. Quicker and simpler tools could help
accelerate the process.
74
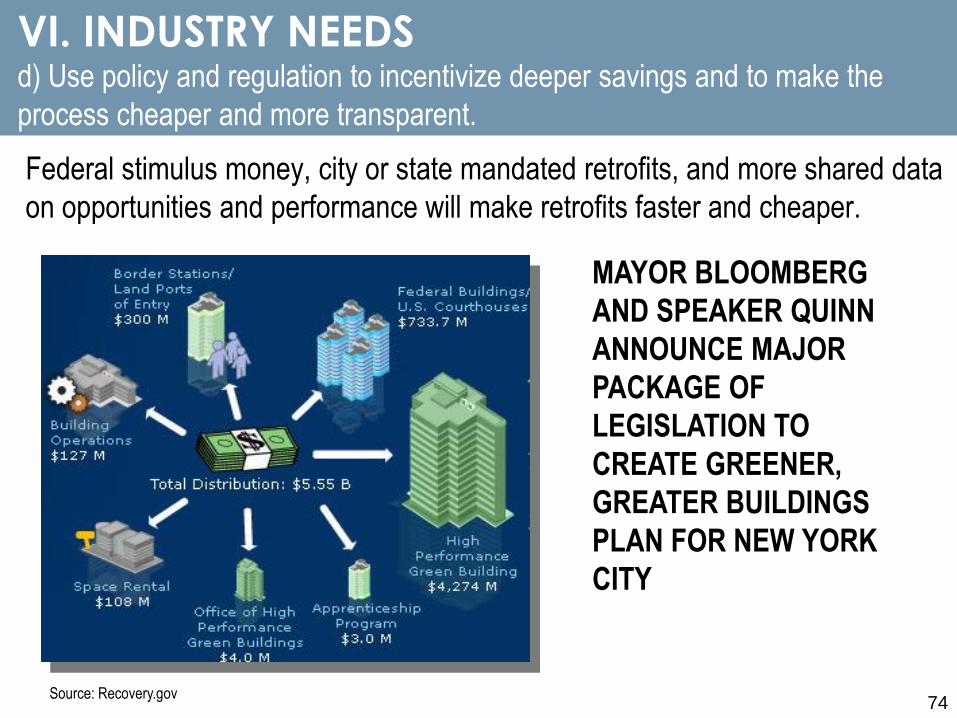
VI. INDUSTRY NEEDSd) Use policy and regulation to incentivize deeper savings and to make the
process cheaper and more transparent.
Federal stimulus money, city or state mandated retrofits, and more shared data
on opportunities and performance will make retrofits faster and cheaper.
Source: Recovery.gov
MAYOR BLOOMBERG
AND SPEAKER QUINN
ANNOUNCE MAJOR
PACKAGE OF
LEGISLATION TO
CREATE GREENER,
GREATER BUILDINGS
PLAN FOR NEW YORK
CITY

75
VI. INDUSTRY NEEDSe) Increase workforce capacity of whole-systems trained auditors, engineers,
operators, and commissioning agents.
There is a lack of American engineers who are trained and ready to rebuild
efficient buildings, cities, and cars.
Source: RAND Issue paper - http://www.rand.org/pubs/issue_papers/IP241/IP241.pdf
Science &
Engineering
“There is no negawatt university” – Amory Lovins

76
VI. INDUSTRY NEEDSf) Determine how to make efficiency measures and renewable energy
technologies more cost-effective.
Value-chain analyses can help determine opportunities for cost reductions for
technologies that can save significant amounts of energy.
• Additional controls;
• Easy to install methods to retrofit exterior wall systems to increase thermal
resistance;
• LED lighting;
• DALI lighting controls;
• Chilled beam systems;
• Heat recovery systems;
• Green roofs;
• Rainwater collection;
• Condenser water savings;
• Dessicant systems; and
• Even higher performance windows.

77
VI. INDUSTRY NEEDSg) Determine solutions for both base building and tenant financing.
Availability of capital is a major hurdle and a variety of innovative solutions that
work for large, small, owner-occupied, and leased spaces is needed.

78
VI. INDUSTRY NEEDSh) Standardize (and use) performance-based design and construction contracts.
Design and engineering parties are often incentivized by different outcomes,
thus deterring the group from optimizing energy efficiency.
Get paid for what you save, not what you spend.

CONCLUSION
VI. NeedsV. Key LessonsIV. ImplementationIII. Key FindingsII. ProcessI. Motivation
There is a compelling need as well as an economic case
for reducing greenhouse gas emissions in existing
buildings. The Empire State Building case study provides
an example of how this can be done. However, significant
challenges remain that must be addressed in order to
quickly and cost-effectively capture the full greenhouse
gas reduction opportunity for building retrofits on a
widespread basis.

Rocky Mountain Institute
For more information, please contact:
Kathy Baczko
Clinton Climate Initiative
New York City Director
+1 646 981 6472
Anthony E. Malkin
Empire State Building
Owner
Iain Campbell
Johnson Controls, Inc.
VP & GM, NA Solutions, Building Efficiency
+1 414 524 7701
Ray Quartararo
Jones Lang LaSalle
Northeast Regional Manager, International Director
+1 212 812 5857
Amory Lovins
Rocky Mountain Institute
Chief Scientist
+1 970 927 3851
More project information available at:
www.esbsustainability.com