
Rockies Production Stacking it Up - petronerds.com · • Boutique energy analytics and advisory...
30
Rockies Production – Stacking it Up TRISHA CURTIS, PRESIDENT AND CO-FOUNDER, PETRONERDS [email protected] DUG ROCKIES 2018 APRIL 25, 2018 1 © PETRONERDS LLC | WWW.PETRONERDS.COM | 970-329-1645
Transcript of Rockies Production Stacking it Up - petronerds.com · • Boutique energy analytics and advisory...

Rockies Production –Stacking it UpT R I S H A C U R T I S , P R E S I D E N T A N D C O - F O U N D E R , P E T R O N E R D S
T R I S H A @ P E T R O N E R D S . C O M
D U G R O C K I E S 2 0 1 8
A P R I L 2 5 , 2 0 1 8
1© PETRONERDS LLC | WWW.PETRONERDS.COM | 970-329-1645

© PETRONERDS LLC | WWW.PETRONERDS.COM | 970-329-1645 2
Source: Extraction rig, September 2017
PetroNerd:• Boutique energy analytics and advisory firm based in
Denver, CO
• Personalized, data-driven advisory services
• Evaluate the performance and asset quality of North
American oil and natural gas shale resources, improve
midstream and downstream market knowledge and
understand the impact of market developments near
and abroad
• HedgeAware - Interactive cloud-based solution for
quickly assessing the hedging strategies and past
performance of U.S. oil and gas producers on a single,
easy to use platform

Podcasts
© PETRONERDS LLC | WWW.PETRONERDS.COM | 970-329-1645 3

“Completion Design Changes and the Impact of US Shale Well Productivity”
© PETRONERDS LLC | WWW.PETRONERDS.COM | 970-329-1645 4
http://www.petronerds.com/wp-content/uploads/2017/11/OIES-PetroNerds-Completion-Design-and-Productivity-2017.pdf
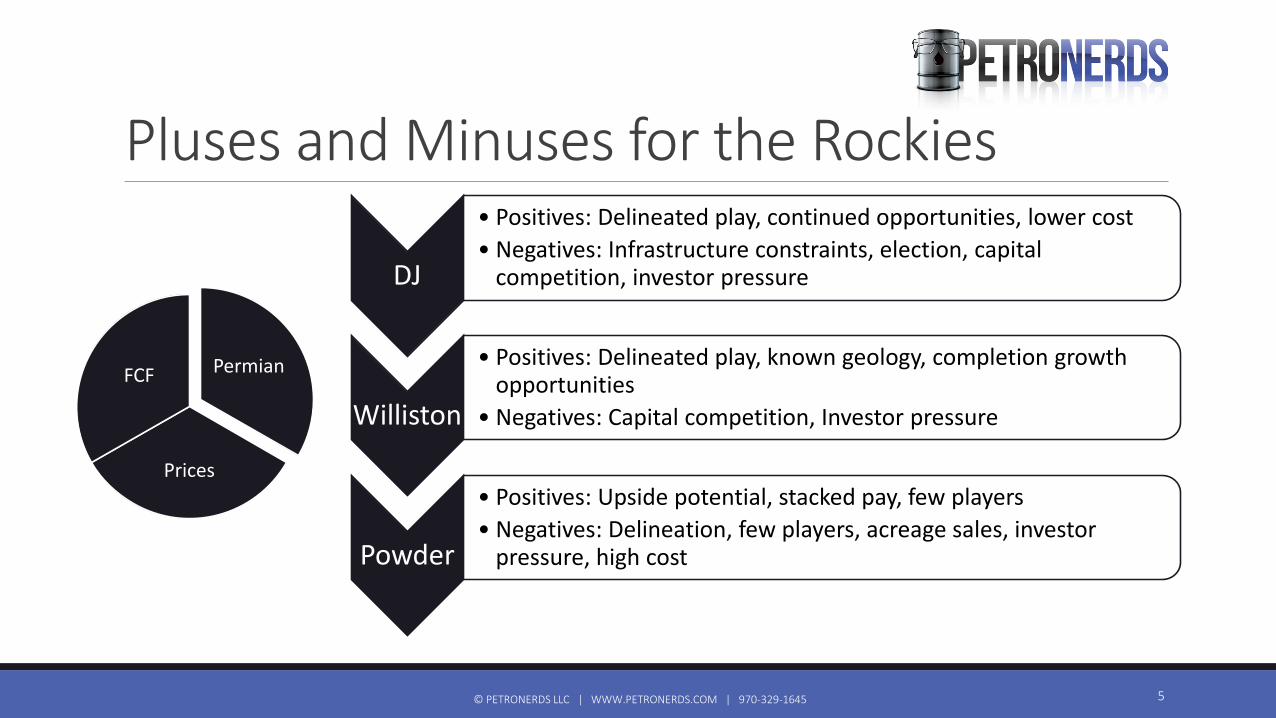
Pluses and Minuses for the Rockies
© PETRONERDS LLC | WWW.PETRONERDS.COM | 970-329-1645 5
DJ
• Positives: Delineated play, continued opportunities, lower cost
• Negatives: Infrastructure constraints, election, capital competition, investor pressure
Williston
• Positives: Delineated play, known geology, completion growth opportunities
• Negatives: Capital competition, Investor pressure
Powder
• Positives: Upside potential, stacked pay, few players
• Negatives: Delineation, few players, acreage sales, investor pressure, high cost
Permian
Prices
FCF

Operators are Hedging
© PETRONERDS LLC | WWW.PETRONERDS.COM | 970-329-1645 6
Source: HedgeAware, a PetroNerds Product

Production, CAPEX, Free Cash Flow
© PETRONERDS LLC | WWW.PETRONERDS.COM | 970-329-1645 7
Source: HedgeAware, a PetroNerds Product
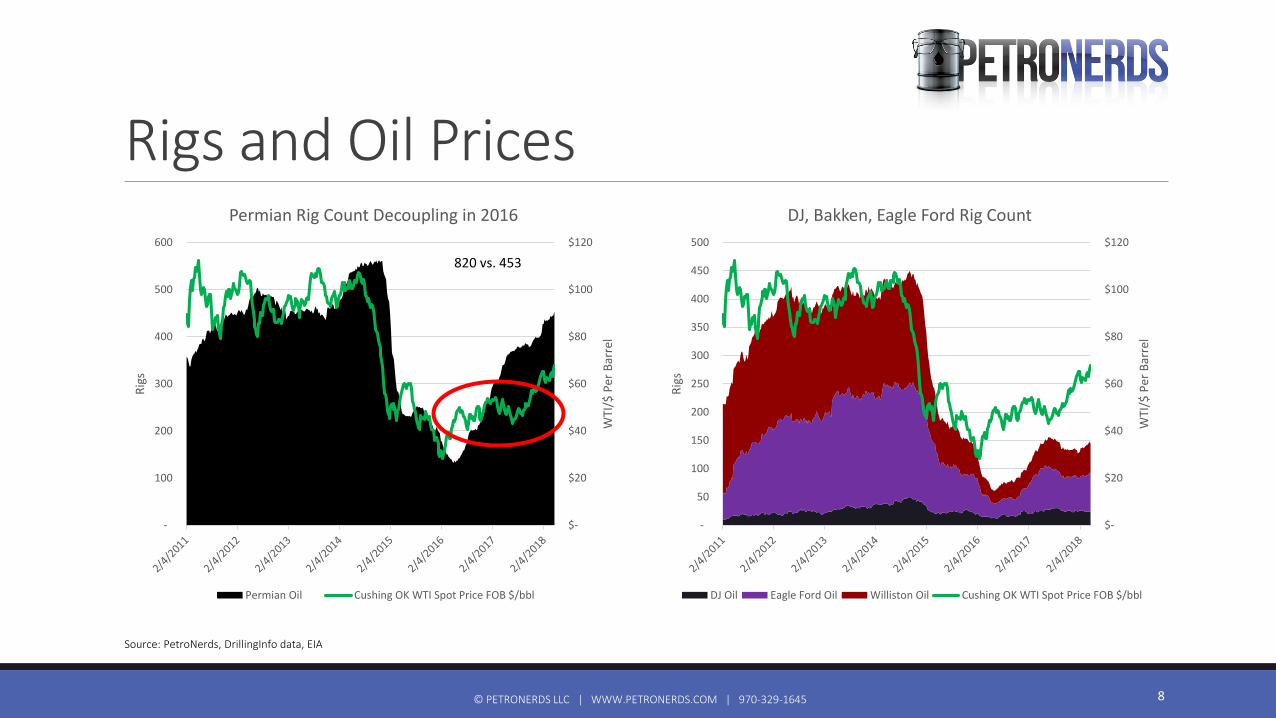
Rigs and Oil Prices
8© PETRONERDS LLC | WWW.PETRONERDS.COM | 970-329-1645
$-
$20
$40
$60
$80
$100
$120
-
100
200
300
400
500
600
WTI
/$ P
er B
arre
l
Rig
s
Permian Rig Count Decoupling in 2016
Permian Oil Cushing OK WTI Spot Price FOB $/bbl
820 vs. 453
$-
$20
$40
$60
$80
$100
$120
-
50
100
150
200
250
300
350
400
450
500
WTI
/$ P
er B
arre
l
Rig
s
DJ, Bakken, Eagle Ford Rig Count
DJ Oil Eagle Ford Oil Williston Oil Cushing OK WTI Spot Price FOB $/bbl
Source: PetroNerds, DrillingInfo data, EIA
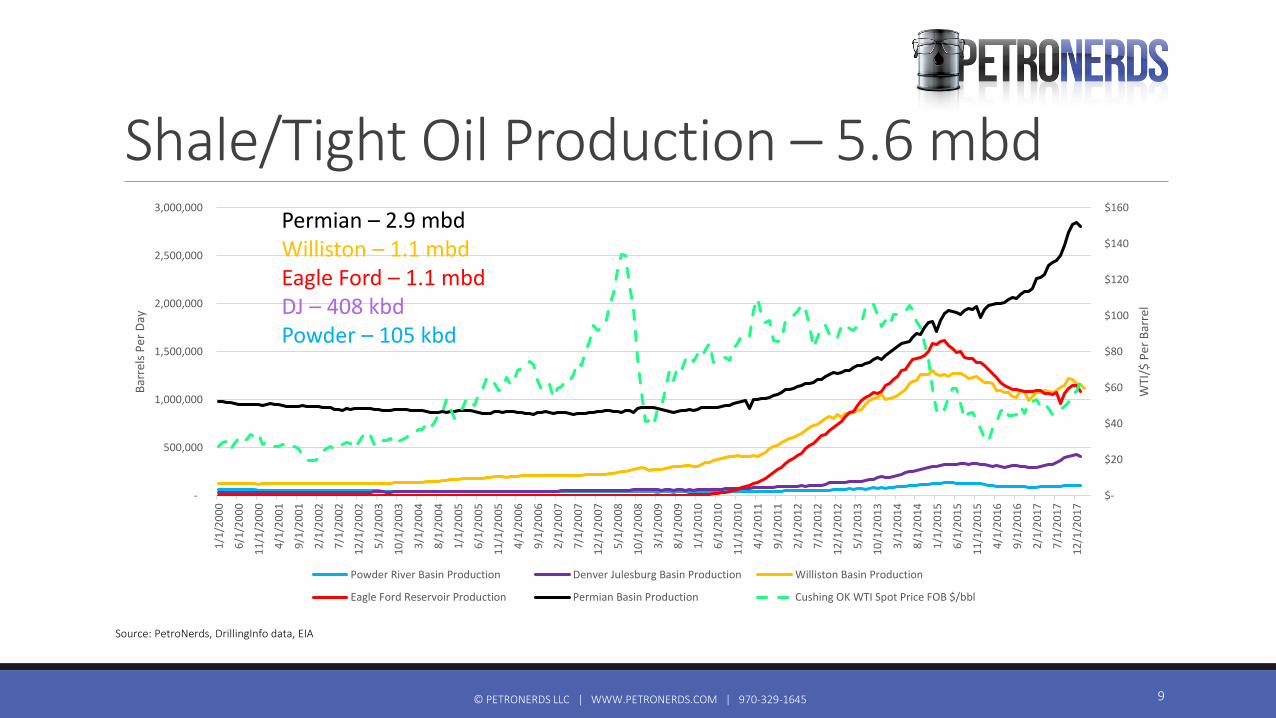
Shale/Tight Oil Production – 5.6 mbd
© PETRONERDS LLC | WWW.PETRONERDS.COM | 970-329-1645 9
$-
$20
$40
$60
$80
$100
$120
$140
$160
-
500,000
1,000,000
1,500,000
2,000,000
2,500,000
3,000,0001
/1/2
00
0
6/1
/20
00
11
/1/2
00
0
4/1
/20
01
9/1
/20
01
2/1
/20
02
7/1
/20
02
12
/1/2
00
2
5/1
/20
03
10
/1/2
00
3
3/1
/20
04
8/1
/20
04
1/1
/20
05
6/1
/20
05
11
/1/2
00
5
4/1
/20
06
9/1
/20
06
2/1
/20
07
7/1
/20
07
12
/1/2
00
7
5/1
/20
08
10
/1/2
00
8
3/1
/20
09
8/1
/20
09
1/1
/20
10
6/1
/20
10
11
/1/2
01
0
4/1
/20
11
9/1
/20
11
2/1
/20
12
7/1
/20
12
12
/1/2
01
2
5/1
/20
13
10
/1/2
01
3
3/1
/20
14
8/1
/20
14
1/1
/20
15
6/1
/20
15
11
/1/2
01
5
4/1
/20
16
9/1
/20
16
2/1
/20
17
7/1
/20
17
12
/1/2
01
7
WTI
/$ P
er B
arre
l
Bar
rels
Per
Day
Powder River Basin Production Denver Julesburg Basin Production Williston Basin Production
Eagle Ford Reservoir Production Permian Basin Production Cushing OK WTI Spot Price FOB $/bbl
Permian – 2.9 mbdWilliston – 1.1 mbdEagle Ford – 1.1 mbdDJ – 408 kbdPowder – 105 kbd
Source: PetroNerds, DrillingInfo data, EIA

Permian Basin Production and Decline Curve
10© PETRONERDS LLC | WWW.PETRONERDS.COM | 970-329-1645
-
1,000,000
2,000,000
3,000,000
4,000,000
5,000,000
6,000,000
7,000,000
8,000,000
-
2,000,000
4,000,000
6,000,000
8,000,000
10,000,000
12,000,000
1/1
/20
07
3/1
/20
08
5/1
/20
09
7/1
/20
10
9/1
/20
11
11
/1/2
01
2
1/1
/20
14
3/1
/20
15
5/1
/20
16
7/1
/20
17
mcf
/d
Bar
rels
Per
Day
–W
ater
an
d L
iqu
id
Total Liquid Production Horizontal Liquid Production
Horizontal Water Production Horizontal Gas Production
-
100
200
300
400
500
600
700
800
0 3 6 9 12 15 18 21 24 27 30 33 36 39 42 45 48 51
Bar
rels
Per
Day
Month
2013 2014 2015 2016 2017
# of Wells Included in Month 1
2013 1,154 2014 1,656 2015 1,838 2016 1,697 2017 2,604
Source: PetroNerds, DrillingInfo data

Measuring Productivity in the Permian Basin
11© PETRONERDS LLC | WWW.PETRONERDS.COM | 970-329-1645
Source: PetroNerds, DrillingInfo data
-
1,000
2,000
3,000
4,000
5,000
6,000
7,000
8,000
9,000
1/1
/08
9/1
/08
5/1
/09
1/1
/10
9/1
/10
5/1
/11
1/1
/12
9/1
/12
5/1
/13
1/1
/14
9/1
/14
5/1
/15
1/1
/16
9/1
/16
5/1
/17
FEET
Average Lateral Length
0
2
4
6
8
10
12
14
16
18
1/1
/08
8/1
/08
3/1
/09
10
/1/0
9
5/1
/10
12
/1/1
0
7/1
/11
2/1
/12
9/1
/12
4/1
/13
11
/1/1
3
6/1
/14
1/1
/15
8/1
/15
3/1
/16
10
/1/1
6
5/1
/17
BA
RR
ELS
PER
FO
OT
First 6 Month Cumulative Production Per Lateral Foot

Permian Complexity▪ Tremendous stacked pay potential
▪ Successful development will require lots of work and capital
▪ Stringent leasing requirements in the Permian Basin often prevent optimal asset delineation
▪ INFRASTRUCTURE – Gas, Water, Oil
▪ MIDLAND Differential Blowouts
▪ Land rush, Wall Street push, and high acreage costs
▪ Now operators are trying to delineate, develop, and maintain leasing requirements all at the same time
▪ Optimal spacing and completion design (frac) is key
▪ Well density, inventory, parent child problems, all coming into focus
© PETRONERDS LLC | WWW.PETRONERDS.COM | 970-329-1645 12
Source: Diamondback, April 2018 Investor Presentation

DJ – Denver Julesburg Basin
13© PETRONERDS LLC | WWW.PETRONERDS.COM | 970-329-1645

Spud to Total Depth in Less than Three Days
14© PETRONERDS LLC | WWW.PETRONERDS.COM | 970-329-1645
Extraction Oil and Gas, September 2017

DJ Basin Production
© PETRONERDS LLC | WWW.PETRONERDS.COM | 970-329-1645 15
-
500,000
1,000,000
1,500,000
2,000,000
2,500,000
-
50,000
100,000
150,000
200,000
250,000
300,000
350,000
400,000
450,000
1/1
/20
06
6/1
/20
06
11
/1/2
006
4/1
/20
07
9/1
/20
07
2/1
/20
08
7/1
/20
08
12
/1/2
008
5/1
/20
09
10
/1/2
009
3/1
/20
10
8/1
/20
10
1/1
/20
11
6/1
/20
11
11
/1/2
011
4/1
/20
12
9/1
/20
12
2/1
/20
13
7/1
/20
13
12
/1/2
013
5/1
/20
14
10
/1/2
014
3/1
/20
15
8/1
/20
15
1/1
/20
16
6/1
/20
16
11
/1/2
016
4/1
/20
17
9/1
/20
17
GA
S -
mcf
/day
WAT
ER a
nd
LIQ
UID
S –
Bar
rels
Per
Day
Total Liquid Production Horizontal Liquid Production Horizontal Water Production Horizontal Gas Production
Source: PetroNerds, DrillingInfo data
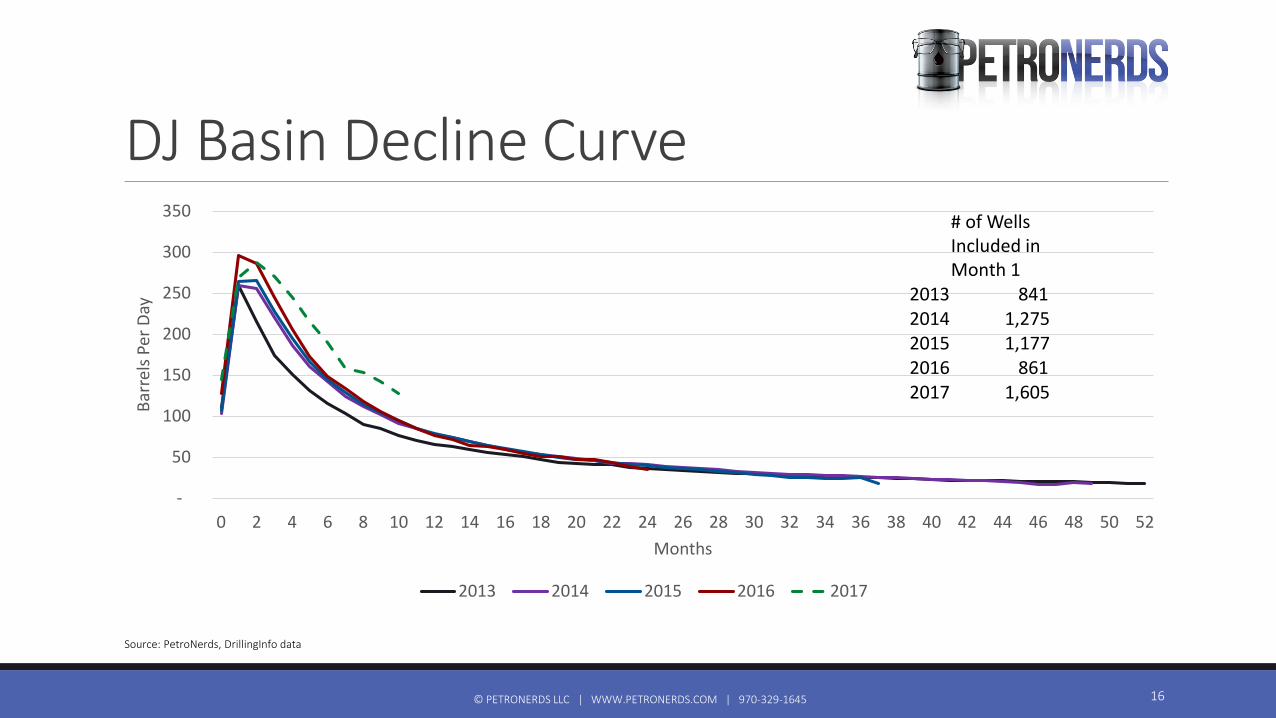
DJ Basin Decline Curve
© PETRONERDS LLC | WWW.PETRONERDS.COM | 970-329-1645 16
-
50
100
150
200
250
300
350
0 2 4 6 8 10 12 14 16 18 20 22 24 26 28 30 32 34 36 38 40 42 44 46 48 50 52
Bar
rels
Per
Day
Months
2013 2014 2015 2016 2017
Source: PetroNerds, DrillingInfo data
# of Wells Included in Month 1
2013 841 2014 1,275 2015 1,177 2016 861 2017 1,605

Measuring Productivity in the DJ Basin
17© PETRONERDS LLC | WWW.PETRONERDS.COM | 970-329-1645
0
5
10
15
20
25
1/1
/20
10
7/1
/20
10
1/1
/20
11
7/1
/20
11
1/1
/20
12
7/1
/20
12
1/1
/20
13
7/1
/20
13
1/1
/20
14
7/1
/20
14
1/1
/20
15
7/1
/20
15
1/1
/20
16
7/1
/20
16
1/1
/20
17
7/1
/20
17
BA
RR
ELS
PER
FO
OT
First 6 Month Cumulative Production Per Lateral Foot
-
1,000
2,000
3,000
4,000
5,000
6,000
7,000
8,000
9,000
1/1
/20
10
7/1
/20
10
1/1
/20
11
7/1
/20
11
1/1
/20
12
7/1
/20
12
1/1
/20
13
7/1
/20
13
1/1
/20
14
7/1
/20
14
1/1
/20
15
7/1
/20
15
1/1
/20
16
7/1
/20
16
1/1
/20
17
7/1
/20
17
FEET
Average Lateral Length
Source: PetroNerds, DrillingInfo data

Top DJ Basin Operators by Production
© PETRONERDS LLC | WWW.PETRONERDS.COM | 970-329-1645 18
Source: PetroNerds, DrillingInfo data
Operator Daily Liquids b/dDaily Gas
mcf/d
1 ANADARKO PETROLEUM CORPORATION 110,214 766,411
2 NOBLE ENERGY, INC. 83,556 345,921
3 EXTRACTION OIL & GAS LLC 56,903 225,098
4 PDC ENERGY INC 44,448 307,711
5 SRC ENERGY INC 27,040 134,294
6 WHITING PETROLEUM CORPORATION 22,997 29,702
7 BILL BARRETT CORPORATION 16,862 53,732
8 CRESTONE PEAK RESOURCES OPERATING LLC 15,608 125,445
9 GREAT WESTERN OPERATING COMPANY LLC 13,233 47,783
10 EOG RESOURCES INCORPORATED 10,533 10,693
11 BONANZA CREEK ENERGY OPERATING COMPANY LLC 9,414 38,319
12 KAISER-FRANCIS OIL COMPANY 4,736 4,320
13 CONOCOPHILLIPS COMPANY 3,630 6,212
14 FIFTH CREEK ENERGY OPERATING COMPANY LLC 3,310 4,411
15 BAYSWATER EXPLORATION AND PRODUCTION LLC 3,012 3,600

DJ GOR and API Gravity
19© PETRONERDS LLC | WWW.PETRONERDS.COM | 970-329-1645
Source: PetroNerds, DrillingInfo data
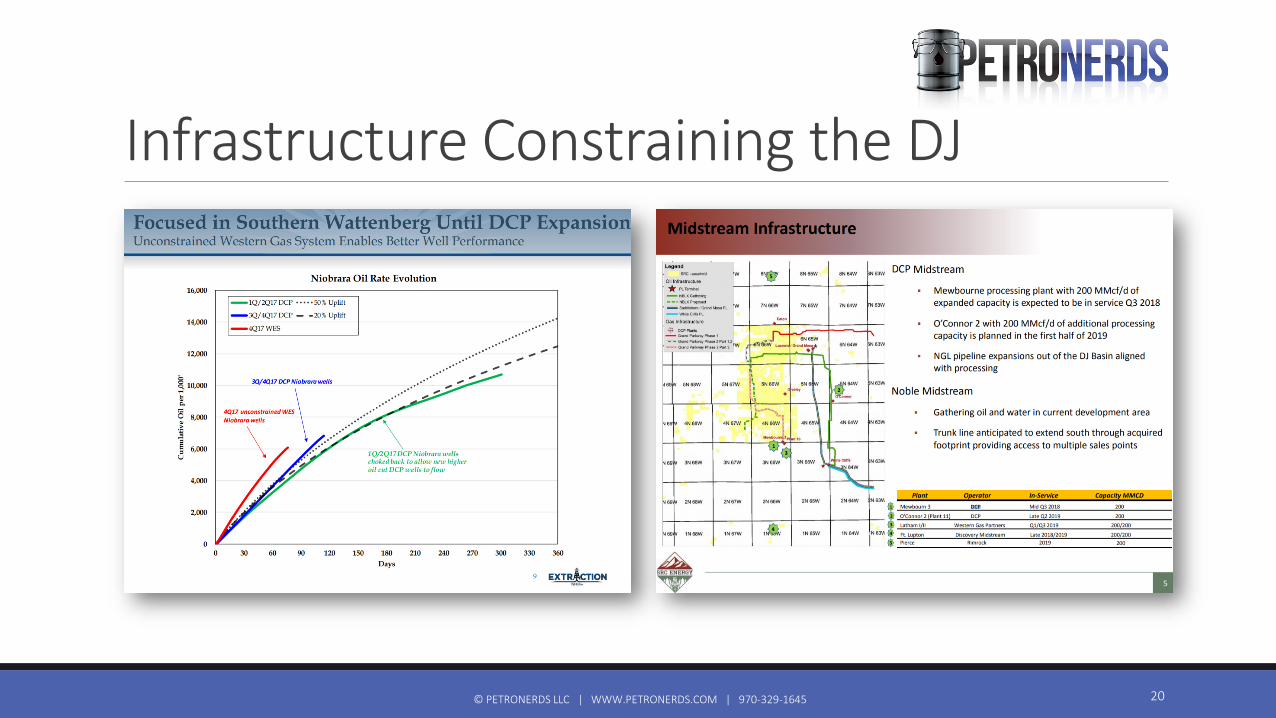
Infrastructure Constraining the DJ
© PETRONERDS LLC | WWW.PETRONERDS.COM | 970-329-1645 20
The Bakken –Williston Basin
21© PETRONERDS LLC | WWW.PETRONERDS.COM | 970-329-1645

Williston Basin Production
© PETRONERDS LLC | WWW.PETRONERDS.COM | 970-329-1645 22
-
500,000
1,000,000
1,500,000
2,000,000
2,500,000
1/1
/20
00
7/1
/20
00
1/1
/20
01
7/1
/20
01
1/1
/20
02
7/1
/20
02
1/1
/20
03
7/1
/20
03
1/1
/20
04
7/1
/20
04
1/1
/20
05
7/1
/20
05
1/1
/20
06
7/1
/20
06
1/1
/20
07
7/1
/20
07
1/1
/20
08
7/1
/20
08
1/1
/20
09
7/1
/20
09
1/1
/20
10
7/1
/20
10
1/1
/20
11
7/1
/20
11
1/1
/20
12
7/1
/20
12
1/1
/20
13
7/1
/20
13
1/1
/20
14
7/1
/20
14
1/1
/20
15
7/1
/20
15
1/1
/20
16
7/1
/20
16
1/1
/20
17
7/1
/20
17
1/1
/20
18
WAT
ER a
nd
Liq
uid
-B
arre
ls P
er D
ay a
nd
GA
S –
mcf
/day
LIQ GAS WTR
Source: PetroNerds, DrillingInfo data

Williston Basin Decline Curve
© PETRONERDS LLC | WWW.PETRONERDS.COM | 970-329-1645 23
-
100
200
300
400
500
600
700
800
0 1 2 3 4 5 6 7 8 9 10111213141516171819202122232425262728293031323334353637383940414243444546474849505152
Bar
rels
Per
Day
Month
2013 2014 2015 2016 2017 2018
Source: PetroNerds, DrillingInfo data
# of Wells in Month 1
2013 2,157 2014 2,272 2015 1,419 2016 680 2017 799 2018 35

Measuring Productivity in the Williston Basin
24© PETRONERDS LLC | WWW.PETRONERDS.COM | 970-329-1645
-
2,000
4,000
6,000
8,000
10,000
12,000
14,000
16,000
3/1
/20
08
11
/1/2
00
8
7/1
/20
09
3/1
/20
10
11
/1/2
01
0
7/1
/20
11
3/1
/20
12
11
/1/2
01
2
7/1
/20
13
3/1
/20
14
11
/1/2
01
4
7/1
/20
15
3/1
/20
16
11
/1/2
01
6
7/1
/20
17
FEET
Average Lateral Length
Source: PetroNerds, DrillingInfo data
0
2
4
6
8
10
12
1/1
/20
08
7/1
/20
08
1/1
/20
09
7/1
/20
09
1/1
/20
10
7/1
/20
10
1/1
/20
11
7/1
/20
11
1/1
/20
12
7/1
/20
12
1/1
/20
13
7/1
/20
13
1/1
/20
14
7/1
/20
14
1/1
/20
15
7/1
/20
15
1/1
/20
16
7/1
/20
16
1/1
/20
17
7/1
/20
17
BA
RR
ELS
PER
FO
OT
First 6 Month Cumulative Production Per Lateral Foot

Top Williston Basin Operators by Production
Operator Daily Liquids Daily Gas
1 CONTINENTAL RESOURCES, INC. 140,719 283,588
2 WHITING PETROLEUM CORPORATION 91,245 229,628
3 HESS BAKKEN INVESTMENTS II, LLC 88,313 190,804
4 CONOCOPHILLIPS COMPANY 83,386 116,086
5 EXXON MOBIL CORPORATION 75,387 174,735
6 OASIS PETROLEUM NORTH AMERICA LLC 66,851 162,765
7 MARATHON OIL COMPANY 66,752 85,181
8 STATOIL OIL & GAS LP 50,388 82,790
9 EOG RESOURCES INCORPORATED 43,411 83,087
10 WPX ENERGY WILLISTON, LLC 42,499 51,539
11 QEP ENERGY COMPANY 33,237 72,699
12 BRUIN E&P OPERATING, LLC 33,203 43,887
13 NEWFIELD EXPLORATION COMPANY 27,007 58,727
14 PETRO-HUNT CORPORATION 23,883 39,466
15 SLAWSON EXPLORATION COMPANY, INC. 23,314 25,604
© PETRONERDS LLC | WWW.PETRONERDS.COM | 970-329-1645 25
Source: PetroNerds, DrillingInfo data

PRB – Powder River Basin
26© PETRONERDS LLC | WWW.PETRONERDS.COM | 970-329-1645

-
200
400
600
800
1,000
1,200
1,400
-
50,000
100,000
150,000
200,000
250,000
300,000
1/1
/20
00
8/1
/20
00
3/1
/20
01
10
/1/2
001
5/1
/20
02
12
/1/2
002
7/1
/20
03
2/1
/20
04
9/1
/20
04
4/1
/20
05
11
/1/2
005
6/1
/20
06
1/1
/20
07
8/1
/20
07
3/1
/20
08
10
/1/2
008
5/1
/20
09
12
/1/2
009
7/1
/20
10
2/1
/20
11
9/1
/20
11
4/1
/20
12
11
/1/2
012
6/1
/20
13
1/1
/20
14
8/1
/20
14
3/1
/20
15
10
/1/2
015
5/1
/20
16
12
/1/2
016
7/1
/20
17
Wel
l Co
un
t
Liq
uid
an
d W
ATER
–B
arre
ls P
er D
ay a
nd
GA
S –
mcf
/d
Horizontal Well Count Total Liquid Horizontal Liquid Horizontal Gas Horizontal Water
Powder River Basin Production
© PETRONERDS LLC | WWW.PETRONERDS.COM | 970-329-1645 27
Total production – 115,000 b/d
1,200 horizontal wells producing 85,000 b/d

Powder River Decline Curve
© PETRONERDS LLC | WWW.PETRONERDS.COM | 970-329-1645 28
-
100
200
300
400
500
600
700
800
900
0 1 2 3 4 5 6 7 8 9 10 11 12 13 14 15 16 17 18 19 20 21 22 23 24 25 26 27 28 29 30 31 32 33 34 35 36 37 38 39 40 41 42 43 44 45 46 47 48 49 50 51 52
Bar
rels
Per
Day
Month2013 2014 2015 2016 2017 2018
# of Wells Included in Month 1
2013 1862014 3312015 2112016 572017 1302018 4
Source: PetroNerds, DrillingInfo data

Parkman Reservoir Horizontal Decline Curve
© PETRONERDS LLC | WWW.PETRONERDS.COM | 970-329-1645 29
-
200
400
600
800
1,000
1,200
0 1 2 3 4 5 6 7 8 9 10 11 12 13 14 15 16 17 18 19 20 21 22 23 24 25 26 27 28 29 30 31 32 33 34 35 36 37 38 39 40 41 42 43 44 45 46 47 48 49 50 51 52
Bar
rels
Per
Day
Month
2013 2014 2015 2016 2017
# of Wells Included in Month 1
2013 432014 852015 602016 102017 21
Source: PetroNerds, DrillingInfo data

Top Powder River Basin Operators by Production
Operator Daily Liquids Daily Gas
1 EOG RESOURCES INCORPORATED 20,212 106,227
2 DEVON ENERGY CORPORATION 19,401 22,291
3 EOG Y RESOURCES, INC. 7,593 46,158
4 CHESAPEAKE ENERGY CORPORATION 7,271 50,494
5 BALLARD PETROLEUM HOLDINGS, LLC 5,830 8,576
6 DENBURY RESOURCES INC. 5,437 116,659
7 SM ENERGY COMPANY 4,983 13,519
8 PEAK POWDER RIVER RESOURCES LLC 3,996 9,671
9 SAMSON INVESTMENT COMPANY 2,753 4,710
10 SHERIDAN PRODUCTION COMPANY, LLC 2,000 557
11 MERIT ENERGY COMPANY 1,931 -
12 TRUE COMPANIES 1,579 850
13 WOLD ENERGY PARTNERS LLC 1,473 4,965
14 HELIS OIL & GAS COMPANY LLC ESTATE 1,142 3,621
15 MCL 1 OIL & GAS WYOMING LLC 1,112 8,523
© PETRONERDS LLC | WWW.PETRONERDS.COM | 970-329-1645 30
Source: PetroNerds, DrillingInfo data


![Untitled-1 []instructions for the kbd-31000 small-block chevy belt drive kit other kits available for the small-block chevy are the kbd-31100 cam bolt is lh thread kbd-31000 small-block](https://static.fdocuments.in/doc/165x107/5e3cb8557b36fd7c2e2be3fc/untitled-1-instructions-for-the-kbd-31000-small-block-chevy-belt-drive-kit-other.jpg)


