Rockhaven Resources Corporate Presentation
24
Corporate Presentation February 2017 TSX-V: RK | OTCQX: RKHNF
-
Upload
kin-communications-inc -
Category
Investor Relations
-
view
221 -
download
0
Transcript of Rockhaven Resources Corporate Presentation

Corporate PresentationFebruary 2017
TSX-V: RK | OTCQX: RKHNF

TSX-V:RK
FORWARD LOOKING STATEMENTS
Certain information regarding the Company contained herein may constitute forward-looking statements within the meaning of applicable securities laws. Forward-looking statements may include estimates, plans, expectations, opinions, forecasts, projections, guidance or other statements that are not statements of fact. Although the Company believes that the expectations reflected in such forward-looking statements are reasonable, it can give no assurance that such expectations will prove to have been correct. The Company cautions the actual performance will be affected by a number of factors, many of which are beyond the Company’s control, and that future events and results may vary substantially from what the Company currently foresees. Discussion of the various factors that may affect future results is contained in the Company’s Annual Report which is available at www.sedar.com. The Company’s forward-looking statements are expressly qualified in their entirety by the cautionary statement. Additional information about the Klaza property Mineral Resource and Preliminary Economic Assessment is summarized in Rockhaven’s March 1, 2016 technical report titled, “Technical Reports and PEA for the Klaza Au-Ag deposit, Yukon Canada for Rockhaven Resources Ltd.” which can be viewed at www.sedar.com under the Rockhaven profile or on the Rockhaven website at www.rockhavenresources.com. The technical information in this presentation has been approved by Matthew R. Dumala, P.Eng., a geological engineer with Archer Cathro & Associates (1981) Limited and qualified person for the purpose of National instrument 43-101.

TSX-V:RK
• 100% owned by Rockhaven with no underlying royalties on
resource areas
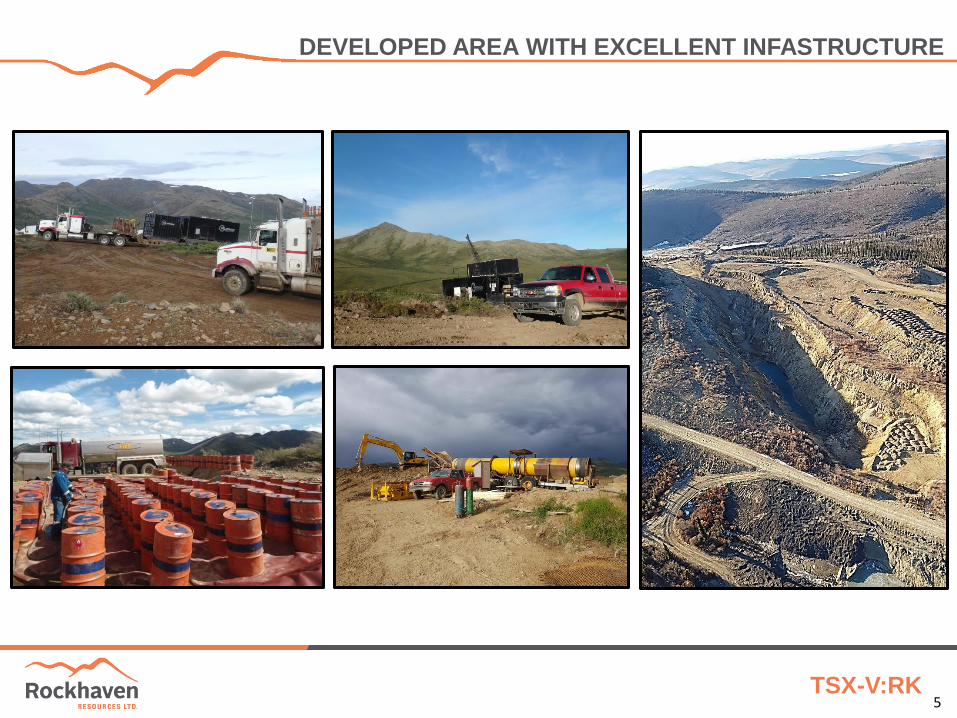
• Road accessible with a community and an electrical power grid
located nearby
• 1.36 million ounces of gold at 4.48 g/t and 26 million ounces of
silver at 89 g/t in the inferred mineral resource category
• Positive Economics presented 2016 PEA showing a Pre-Tax
NPV(5%) at CAD$150 million and IRR of 20%
• LOM projected process recoveries of 94% gold, 88% silver, 83%
lead and 84% zinc
• Exploration Benefits Agreement signed with local First Nation
• New high-grade gold discoveries in 2016
• Low discovery cost per ounce
3
For additional information on the Klaza property Mineral Resource Estimate and PEA, please refer to the Klaza Property Technical Report dated January 22nd, 2016 and March 1st, 2016 filed on SEDAR
FOCUS ON FLAGSHIP KLAZA PROJECT

TSX-V:RK 4
Klaza Deposit
ROAD-ACCESSIBLE LOCATION
TSX-V:RK 5
DEVELOPED AREA WITH EXCELLENT INFASTRUCTURE

TSX-V:RK 6
2 KLAZA SETTING
Looking Southeast

TSX-V:RK 7
2 KLAZA PROPERTY EXPANDED TO 250 KM2
• Since 2010, the Company has taken the Klaza property from 4km2 to 250km2
• $28M spent to date drilling and expanding the property
• No royalties on the Klaza deposit (100% owned)
• EBA signed with local First Nations

TSX-V:RK 8
• 78,000 m of drilling in 339
holes completed to date
• 22,000 m of excavator
trenching
• Large mineralizing system -
main mineralized corridor
2,000 m x 2,400 m
• 2016 drill program of 8,000
meters (not included in
resource estimate)
• Eleven structurally controlled
zones with:
• Good continuity
• Mineralization traced
from surface
• Open ended strike
lengths ranging
between 250 and
2,400 m
>78,000 m of Diamond Drilling Since 2010 >78,000 m OF DIAMOND DRILLING SINCE 2010
TSX-V:RK 9
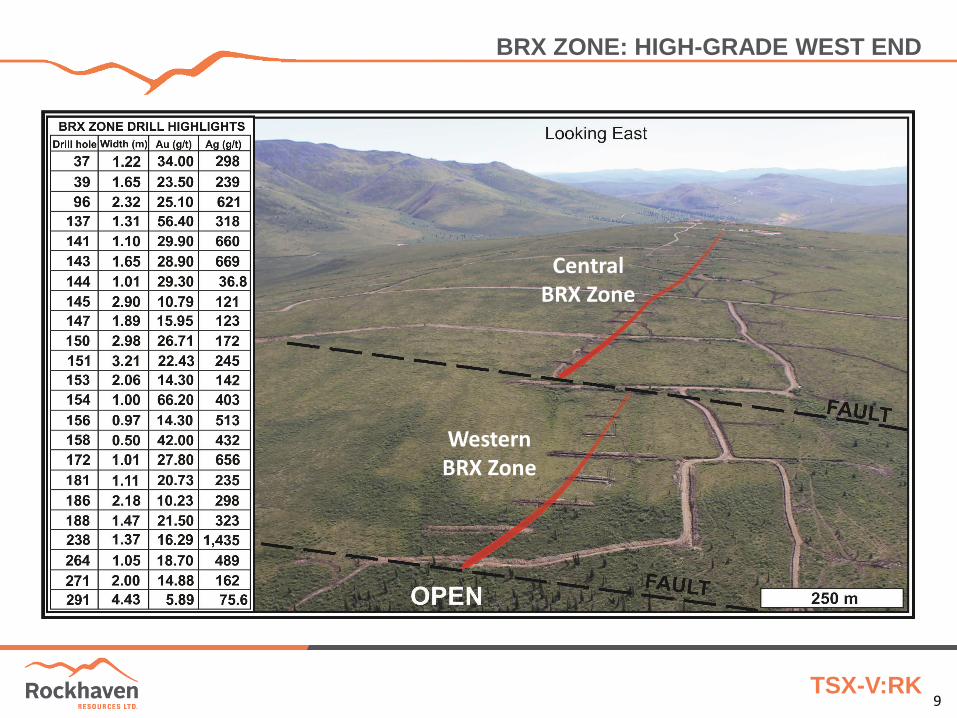
Western BRX Zone
Central BRX Zone
BRX ZONE: HIGH-GRADE WEST END

TSX-V:RK 10
KLAZA ZONE: LARGE MINERALIZING SYSTEM
Western Klaza Zone
Central Klaza Zone

TSX-V:RK 11
KL-14-143 123.40-125.05 m Sampled interval returned 28.9 g/t gold, 669 g/t silver, 1.88% lead, 2.32% zinc and 0.83%
copper over 1.65 m
KL-14-182 183.89-184.71 m Sampled interval returned 14.60 g/t gold, 778 g/t silver, 3.14% lead, 1.36% zinc and 0.05%
copper over 0.82 m
DISTAL EPITHERMAL VEIN MINERALIZATION
TSX-V:RK 12
Tonnes (kt)
Grade Contained Metal
Au (g/t)
Ag (g/t)
Pb (%)
Zn (%)
Au EQ4 (g/t)
Au (koz)
Ag (koz) Pb (klb) Zn (klb)
Au EQ4 (koz)
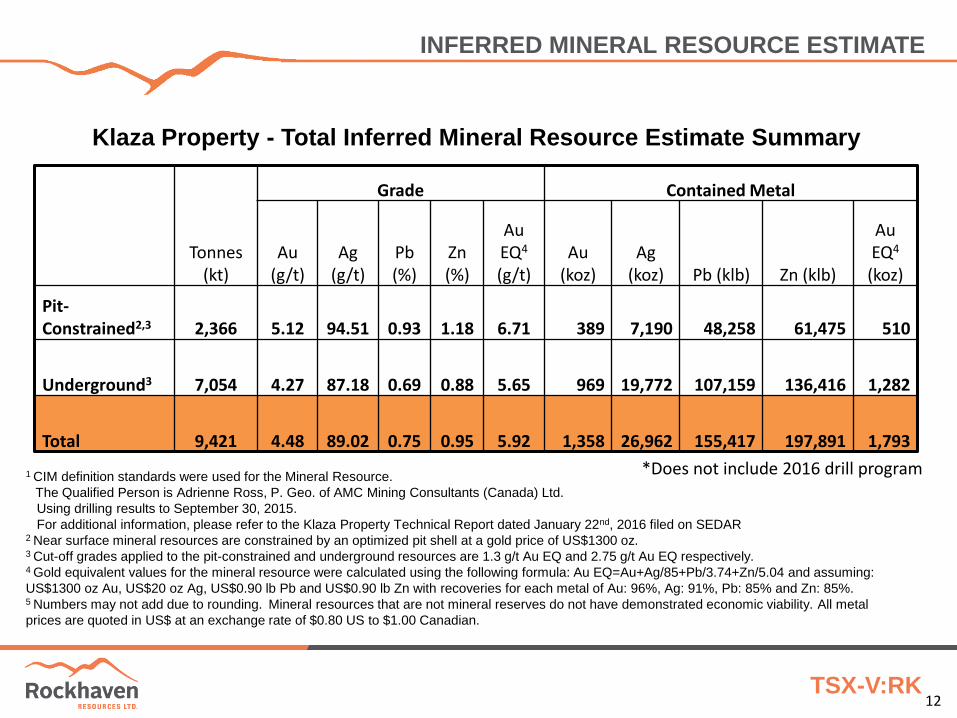
Pit-Constrained2,3 2,366 5.12 94.51 0.93 1.18 6.71 389 7,190 48,258 61,475 510
Underground3 7,054 4.27 87.18 0.69 0.88 5.65 969 19,772 107,159 136,416 1,282
Total 9,421 4.48 89.02 0.75 0.95 5.92 1,358 26,962 155,417 197,891 1,793
Klaza Property - Total Inferred Mineral Resource Estimate Summary
1 CIM definition standards were used for the Mineral Resource. The Qualified Person is Adrienne Ross, P. Geo. of AMC Mining Consultants (Canada) Ltd.
Using drilling results to September 30, 2015.
For additional information, please refer to the Klaza Property Technical Report dated January 22nd, 2016 filed on SEDAR 2 Near surface mineral resources are constrained by an optimized pit shell at a gold price of US$1300 oz. 3 Cut-off grades applied to the pit-constrained and underground resources are 1.3 g/t Au EQ and 2.75 g/t Au EQ respectively. 4 Gold equivalent values for the mineral resource were calculated using the following formula: Au EQ=Au+Ag/85+Pb/3.74+Zn/5.04 and assuming:
US$1300 oz Au, US$20 oz Ag, US$0.90 lb Pb and US$0.90 lb Zn with recoveries for each metal of Au: 96%, Ag: 91%, Pb: 85% and Zn: 85%. 5 Numbers may not add due to rounding. Mineral resources that are not mineral reserves do not have demonstrated economic viability. All metal
prices are quoted in US$ at an exchange rate of $0.80 US to $1.00 Canadian.
INFERRED MINERAL RESOURCE ESTIMATE
*Does not include 2016 drill program

TSX-V:RK 13
1 not all blocks along minor secondary structures shown 2 Cut-off grades applied to the pit-constrained and underground resources are 1.3 g/t Au EQ and 2.75 g/t Au EQ respectively. 3Gold equivalent values were calculated using the following formula: Au EQ=Au+Ag/85+Pb/3.74+Zn/5.04 and assuming: US$1300 oz Au, US$20 oz Ag, US$0.90 lb Pb and US$0.90 lb Zn with recoveries for each metal of
Au: 96%, Ag: 91%, Pb: 85% and Zn: 85%. 4 All metal prices are quoted in US$ at an exchange rate of $0.80 US to $1.00 Canadian.
≥10 g/t
≥5 g/t, <10 g/t
≥3 g/t, <5 g/t
≥2 g/t, <3 g/t
≥1 g/t, <2 g/t
Gold Equivalent
374,000 oz AuEQ
Eastern BRX*
599,000 oz AuEQ
Central Klaza
227,000oz AuEQ
Central BRX
448,000 oz AuEQ
Western BRX
145,000 oz AuEQ
Western Klaza
*not included in the current PEA
Total Inferred Mineral Resources
Zone Tonnes
(kt)
Gold Silver Lead Zinc
koz g/t Koz g/t M lbs % M lbs %
Western BRX 1,368 352 8.01 5,813 132.0 39.4 1.31 42.8 1.42
Central BRX 1,311 121 2.87 6,771 161.0 36.9 1.28 40.2 1.39
Eastern BRX 2,406 317 4.10 4,127 53.0 11.2 0.21 16.0 0.30
Western Klaza 542 98 5.62 3,455 198.0 7.7 0.64 10.6 0.88
Central Klaza 3,794 470 3.85 6,796 56.0 60.2 0.72 88.3 1.06
BLOCK MODEL

TSX-V:RK 14
• Pre-tax NPV5% at CAD$150 million and IRR of 20% and post-
tax NPV5% at CAD$86 million and IRR of 14%
• Long mine life projected to be 14 years producing total payable
metals of approximately 630,000 oz gold, 11,364,000 oz silver,
51,229,000 lbs lead and 52,461,000 lbs zinc
• Project capital costs of CAD$262 million which includes $34
million in contingency costs
• LOM projected process recoveries of 94% gold, 88% silver,
83% lead and 84% zinc
• Average LOM operating cash cost of US$652/oz AuEQ* and
total all-in sustaining cost of US$966/oz AuEQ
• Combination of contractor open pit and owner-operated
longhole open stoping underground mining
• Centrally located flotation-POX-leach process plant, operating
year round at 1,500 tpd
*Gold equivalent values for mining purposes assume base case metal prices and recoveries used in the PEA and are calculated using the following formula:
AuEQ=1*Au+Ag/106.5+Pb/7.63+Zn/14.45. Base metal pricing of US$0.80/lb lead and US$0.85/lb zinc were used.
With the base case gold price of US$1200/oz,
silver price of US$16/oz and an exchange rate
of CAD$1.00 equal to US$0.75 are as follows:
PEA HIGHLIGHTS
Description Cost (C$M)
Underground development 136
Flotation tailings storage & residue
tailings storage 10
Underground mine infrastructure 17
Mobile equipment 32
Processing plant 91
Surface infrastructure 14
Capital indirects 11
Contingency 34
Additional 5% sustaining for equipment
rebuilds 13
Total capital cost 358
Project capital (Year 0-4) 262
Sustaining capital (4-14) 96
Description Cost (C$/t)
Mining cost 59.65
Processing cost 43.37
General and Administration cost 12.00
Total operating cost 115.02
Total Capital Cost Estimate
TSX-V:RK 15
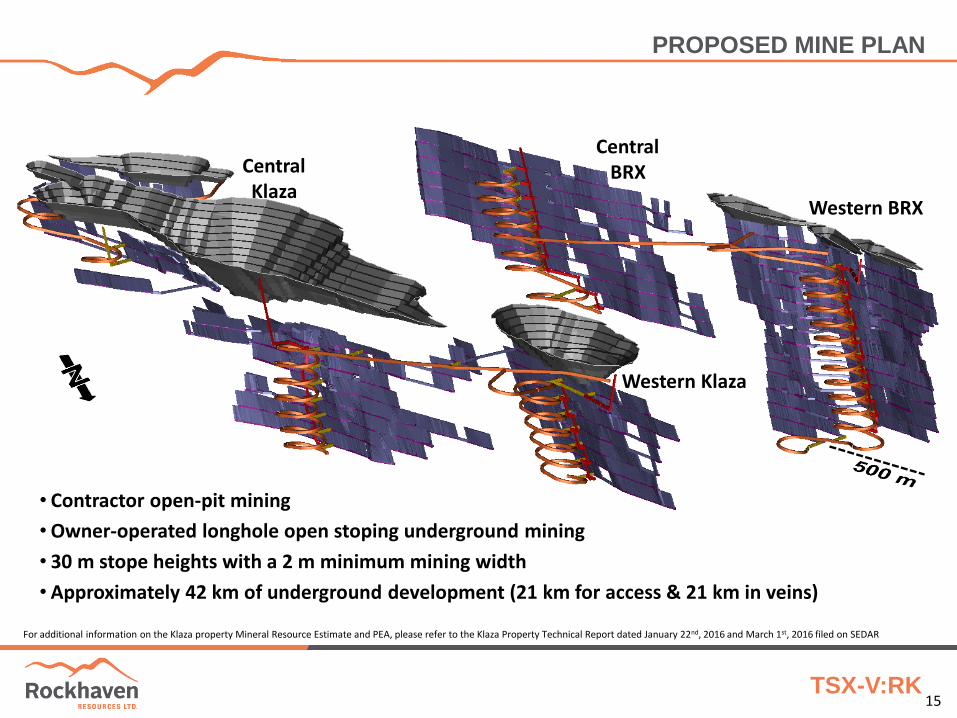
PROPOSED MINE PLAN
Western Klaza
Central Klaza
Western BRX
Central BRX
• Contractor open-pit mining
• Owner-operated longhole open stoping underground mining
• 30 m stope heights with a 2 m minimum mining width
• Approximately 42 km of underground development (21 km for access & 21 km in veins)
For additional information on the Klaza property Mineral Resource Estimate and PEA, please refer to the Klaza Property Technical Report dated January 22nd, 2016 and March 1st, 2016 filed on SEDAR

TSX-V:RK 16
PROPOSED INFASTRUCTURE
TSX-V:RK 17
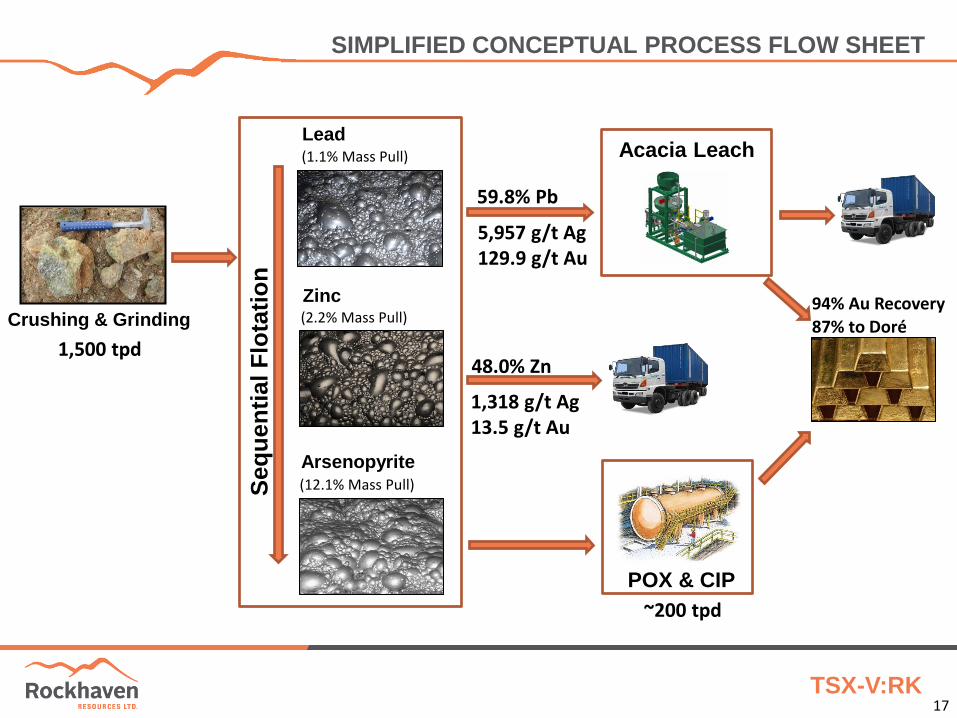
Lead (1.1% Mass Pull)
(2.2% Mass Pull)
(12.1% Mass Pull)
Acacia Leach
59.8% Pb
48.0% Zn
Zinc
Arsenopyrite
Seq
uen
tial F
lota
tio
n
5,957 g/t Ag 129.9 g/t Au
1,318 g/t Ag 13.5 g/t Au
POX & CIP
94% Au Recovery 87% to Doré
1,500 tpd
~200 tpd
Crushing & Grinding
SIMPLIFIED CONCEPTUAL PROCESS FLOW SHEET
TSX-V:RK
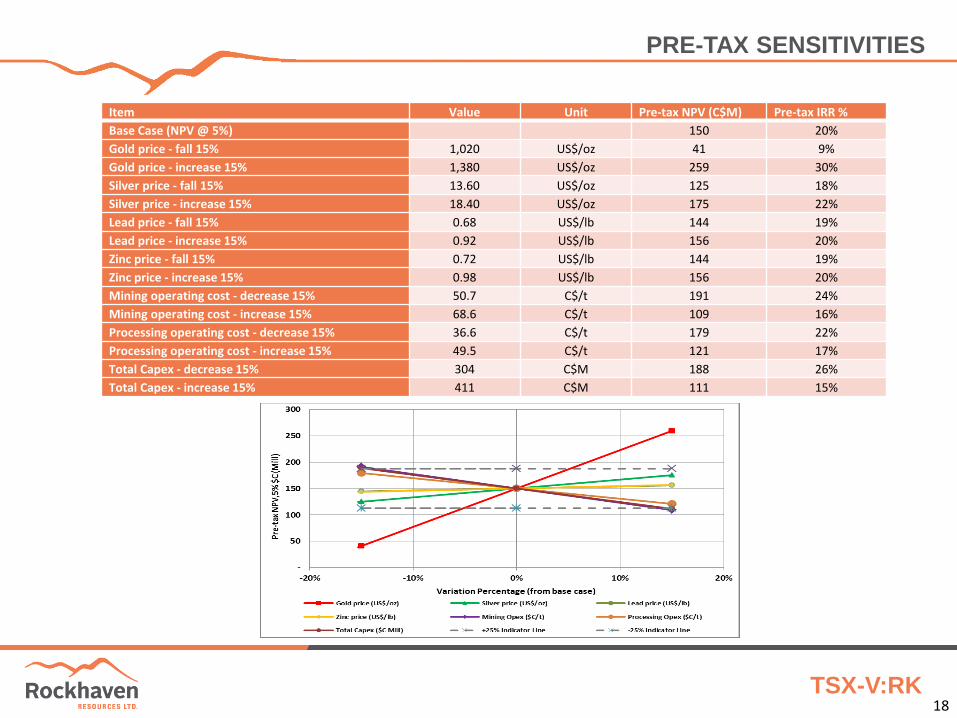
Item Value Unit Pre-tax NPV (C$M) Pre-tax IRR %
Base Case (NPV @ 5%) 150 20%
Gold price - fall 15% 1,020 US$/oz 41 9%
Gold price - increase 15% 1,380 US$/oz 259 30%
Silver price - fall 15% 13.60 US$/oz 125 18%
Silver price - increase 15% 18.40 US$/oz 175 22%
Lead price - fall 15% 0.68 US$/lb 144 19%
Lead price - increase 15% 0.92 US$/lb 156 20%
Zinc price - fall 15% 0.72 US$/lb 144 19%
Zinc price - increase 15% 0.98 US$/lb 156 20%
Mining operating cost - decrease 15% 50.7 C$/t 191 24%
Mining operating cost - increase 15% 68.6 C$/t 109 16%
Processing operating cost - decrease 15% 36.6 C$/t 179 22%
Processing operating cost - increase 15% 49.5 C$/t 121 17%
Total Capex - decrease 15% 304 C$M 188 26%
Total Capex - increase 15% 411 C$M 111 15%
18
PRE-TAX SENSITIVITIES

TSX-V:RK
Item Value Unit Post-tax NPV (C$M) Post-tax IRR %
Base Case (NPV @ 5%) 86 14%
Gold price - fall 15% 1,020 US$/oz 9 6%
Gold price - increase 15% 1,380 US$/oz 163 22%
Silver price - fall 15% 13.60 US$/oz 68 12%
Silver price - increase 15% 18.40 US$/oz 104 16%
Lead price - fall 15% 0.68 US$/lb 82 14%
Lead price - increase 15% 0.92 US$/lb 90 15%
Zinc price - fall 15% 0.72 US$/lb 81 14%
Zinc price - increase 15% 0.98 US$/lb 90 15%
Mining operating cost - decrease 15% 50.7 C$/t 116 17%
Mining operating cost - increase 15% 68.6 C$/t 55 11%
Processing operating cost - decrease 15% 36.6 C$/t 107 16%
Processing operating cost - increase 15% 49.5 C$/t 64 12%
Total Capex - decrease 15% 304 C$M 116 19%
Total Capex - increase 15% 411 C$M 55 10%
Corporate tax rate - decrease 15% 25% % 95 15%
Corporate tax rate - increase 15% 35% % 76 13%
19
POST-TAX SENSITIVITIES

TSX-V:RK 20
Further Exploration Towards Development
• Expansion of resource areas along strike and down-dip;
• Detailed drilling of other known mineralized structures in order to model and include these into future mineral resource estimations; and,
• New discoveries within close proximity of current mineral resources.
• Additional metallurgical testing to investigate the ability to reduce processing costs and lower cut-off grades through pre-concentration;
• Drilling immediately adjacent to open pits envisioned in the PEA;
• Infill drilling to better define areas of high-grade mineralization within the current resource area; and,
• Continued permitting and engineering studies.
Opportunities exist to further enhance the Klaza project’s value by lowering
operating costs and increasing production rates through additional studies,
resource expansion and exploration.
EXPLORATION VS DEVELOPMENT TRACK

TSX-V:RK
Au, Ag,
Pb, Zn, As,
Sb, Cu,
Cd, Te, Bi
21
DRIVERS FOR DISCOVERY AT KLAZA

TSX-V:RK
MAGNETIC LOWS INDICATE ADDITIONAL TARGETS
22
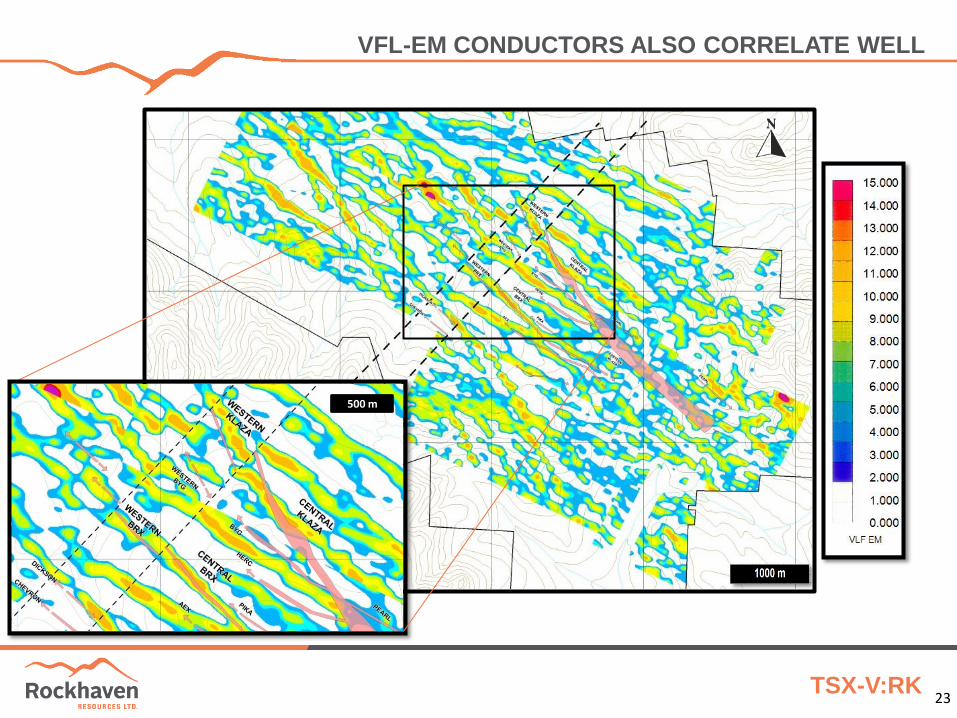
TSX-V:RK 23
500 m
VFL-EM CONDUCTORS ALSO CORRELATE WELL

TSX-V:RK
Management / Directors / Advisors
Matt A. Turner, B.Sc. President, CEO and Director
Ian J. Talbot, B.Sc., LLB. COO
Larry Donaldson, CA CFO
Marc G. Blythe, P.Eng. VP Project Dev.
Rob C. Carne, M.Sc., P.Geo. Director
Glenn R. Yeadon, B.Comm., LLB. Director
Bruce A. Youngman, B.Sc. Director
Randy C. Turner, B.Sc., P.Geo Director
R. Allan Doherty, P.Geo. Director
David G. Skoglund Director
Bradley J. Shisler Director
Jeremy Richards, Ph.D., P.Geol. Technical Advisor
24
SHARES OUTSTANDING: 129,753,093
SHARES FULLY DILUTED: 148,837,368
MARKET CAPITALIZATION: $25,000,000
WORKING CAPITAL: ~$1,100,000
CORPORATE DEBT: NONE
SIGNIFICANT HOLDERS:
SHARES %
STRATEGIC METALS LTD
60,394,212 46%
INSIDERS 15,062,334 12%
TOCQUEVILLE 6,400,000 5%
TOTAL: 70,509,834 63%
STRONG MANAGEMENT & INSIDER OWNERSHIP
TSX-V:RK TSX-V:SMD TSX-V:SNG TSX-V:ADG TSX-V:ATC


![Sacred Grounding - Rockhaven Ecozoic Center · Rockhaven Ecozoic Center | 7621 Rivermont Trl, House Springs, MO 63051| [636] 575-5671 Sacred Grounding June 2, 2018 – Sat. (9:30](https://static.fdocuments.in/doc/165x107/60116c20e771323755350f42/sacred-grounding-rockhaven-ecozoic-rockhaven-ecozoic-center-7621-rivermont-trl.jpg)