Rockhampton Cyclone Dinah 1967 - Harden...
13
Tropical Cyclone Dinah, 1967 By Mr Jeff Callaghan Retired Senior Severe Weather Forecaster, Bureau of Meteorology, Brisbane Dinah 2431 January 1967 probably generated the largest waves observed in Southern Queensland and Northern NSW over the last century. On its passage towards southern Queensland Dinah caused severe damage at Heron Island initially from inundation from large northeast swells and a day later from severe winds. It then turned more southsoutheasterly and passed over the Sandy Cape lighthouse, which recorded a central pressure of 944.8 hPa and high water 10 metres above normal. Although well off the coast many trees were blown down from Rockhampton to Grafton. Houses were unroofed at Bundaberg Maryborough and along the Sunshine and Gold Coasts. Banana and cane crops were wiped out on the Tweed Coast and a severe wind gust overturned a car at Evans Head. The hardest hit area of northern NSW was around Brunswick Heads where several banana plantations were wiped out. Huge seas and storm surge caused severe erosion at Emu Park, Yeppoon, and in the Maryborough Bundaberg area. Very large waves broke completely over Lady Musgrave Island (about 80km northeast of Bundaberg while the following report was received from a Marine biologist on nearby Lady Fairfax Island “The section of Island on which I live is only 5 acres and it was no surprise to find it underwater with the arrival of Dinah. It fact it was extremely difficult to read the rain gauge, the gauge being covered by 3 feet of water.” The following report was received from the head light keeper on Sandy Cape “A very heavy easterly swell was observed on the inside beach on the 28 th but afterwards visibility was so reduced to make observations impossible. High seas together with high tides brought the sea level up to within 20 feet of the boatshed, approximately 30 feet higher than usual.” The report from Lady Elliott Island was as follows ‘A very heavy swell persisted and was most visible from the northwest and during the forenoon high tide phenomenal seas broke across the reef all around the island, previous banks of coral above high water were all moved as seas broke over onto the island. Self sown trees approximately five years on the east beach were washed out and blown onto the island. It appears that the cyclone passed Lady Elliot at approx 1300, this being the lowest point on the barograph.” A storm surge of 2 metres covered the flats inland from Double Island Point and a storm surge inundated cane farms at Bli Bli on the Sunshine Coast and was knee deep in Hastings St Noosa. Spectacular wave damage occurred on the ocean side of Bribie Island where two massive concrete World War II gun emplacements, 13 metres by 9 metres by 4.5metres in dimension, were undermined by the sea and moved about 2 metres from their original position Around Sandgate in Moreton Bay seawater 1.5 metres deep came into houses. More than one hundred homes were flooded and at Cribb Island one house was washed into the sea. At nearby Nudgee beach the sea wall was destroyed and houses were flooded with 0.66 metres of salt water. Storm surge also affected the Gold Coast and water lapped the decking of the Jubilee Bridge, which is about 1.5 metres above highest astronomical tide. A similar storm surge occurred on the Tweed River isolating Fingal with six houses awash. Large waves caused a section of the esplanade to
-
Upload
dangnguyet -
Category
Documents
-
view
214 -
download
0
Transcript of Rockhampton Cyclone Dinah 1967 - Harden...

Tropical Cyclone Dinah, 1967
By Mr Jeff Callaghan
Retired Senior Severe Weather Forecaster, Bureau of Meteorology, Brisbane
Dinah 24-‐31 January 1967 probably generated the largest waves observed in Southern Queensland and Northern NSW over the last century. On its passage towards southern Queensland Dinah caused severe damage at Heron Island initially from inundation from large northeast swells and a day later from severe winds. It then turned more south-‐southeasterly and passed over the Sandy Cape lighthouse, which recorded a central pressure of 944.8 hPa and high water 10 metres above normal. Although well off the coast many trees were blown down from Rockhampton to Grafton. Houses were unroofed at Bundaberg Maryborough and along the Sunshine and Gold Coasts. Banana and cane crops were wiped out on the Tweed Coast and a severe wind gust overturned a car at Evans Head. The hardest hit area of northern NSW was around Brunswick Heads where several banana plantations were wiped out. Huge seas and storm surge caused severe erosion at Emu Park, Yeppoon, and in the Maryborough Bundaberg area. Very large waves broke completely over Lady Musgrave Island (about 80km northeast of Bundaberg while the following report was received from a Marine biologist on nearby Lady Fairfax Island “The section of Island on which I live is only 5 acres and it was no surprise to find it underwater with the arrival of Dinah. It fact it was extremely difficult to read the rain gauge, the gauge being covered by 3 feet of water.” The following report was received from the head light keeper on Sandy Cape “A very heavy easterly swell was observed on the inside beach on the 28th but afterwards visibility was so reduced to make observations impossible. High seas together with high tides brought the sea level up to within 20 feet of the boatshed, approximately 30 feet higher than usual.” The report from Lady Elliott Island was as follows ‘A very heavy swell persisted and was most visible from the northwest and during the forenoon high tide phenomenal seas broke across the reef all around the island, previous banks of coral above high water were all moved as seas broke over onto the island. Self sown trees approximately five years on the east beach were washed out and blown onto the island. It appears that the cyclone passed Lady Elliot at approx 1300, this being the lowest point on the barograph.” A storm surge of 2 metres covered the flats inland from Double Island Point and a storm surge inundated cane farms at Bli Bli on the Sunshine Coast and was knee deep in Hastings St Noosa. Spectacular wave damage occurred on the ocean side of Bribie Island where two massive concrete World War II gun emplacements, 13 metres by 9 metres by 4.5metres in dimension, were undermined by the sea and moved about 2 metres from their original position Around Sandgate in Moreton Bay seawater 1.5 metres deep came into houses. More than one hundred homes were flooded and at Cribb Island one house was washed into the sea. At nearby Nudgee beach the sea wall was destroyed and houses were flooded with 0.66 metres of salt water. Storm surge also affected the Gold Coast and water lapped the decking of the Jubilee Bridge, which is about 1.5 metres above highest astronomical tide. A similar storm surge occurred on the Tweed River isolating Fingal with six houses awash. Large waves caused a section of the esplanade to
Cyclone Dinah, 1967
Data by J. Callaghan 22 September 2011
collapse at Surfers Paradise and the unprecedented 1967 severe erosion on the Gold Coast had begun. Four other tropical cyclones continued the erosion which culminated with three east coast lows in June 1967.
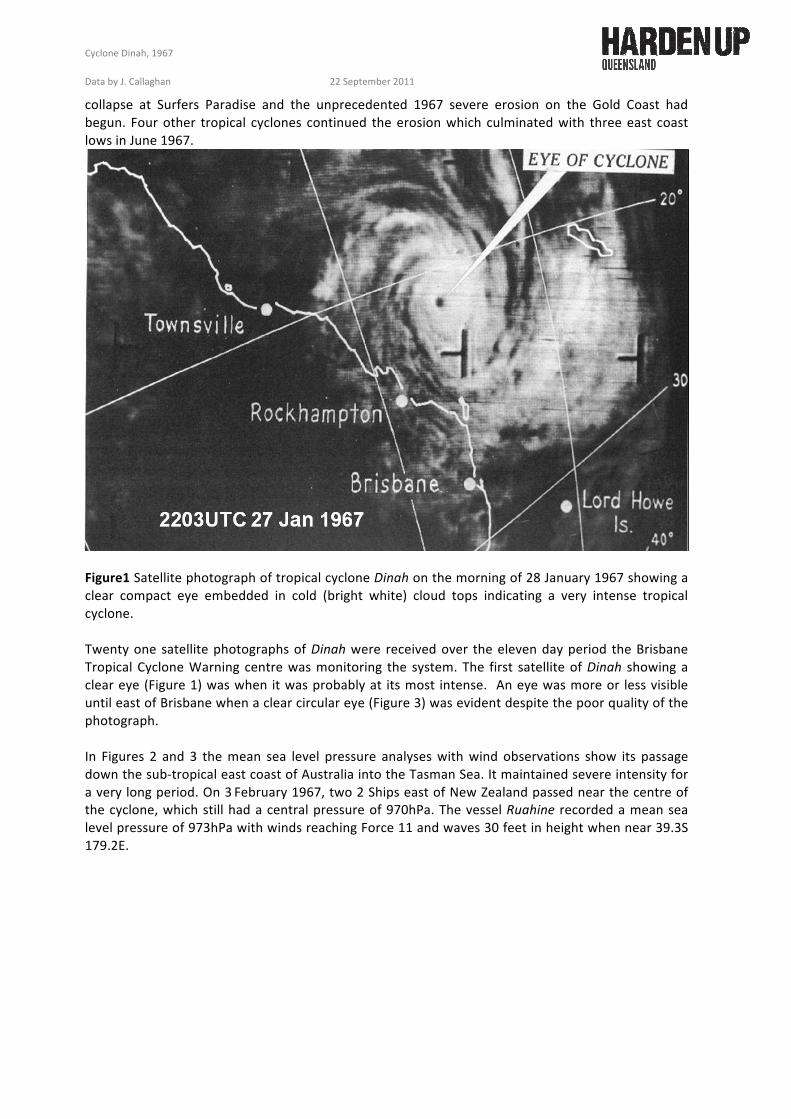
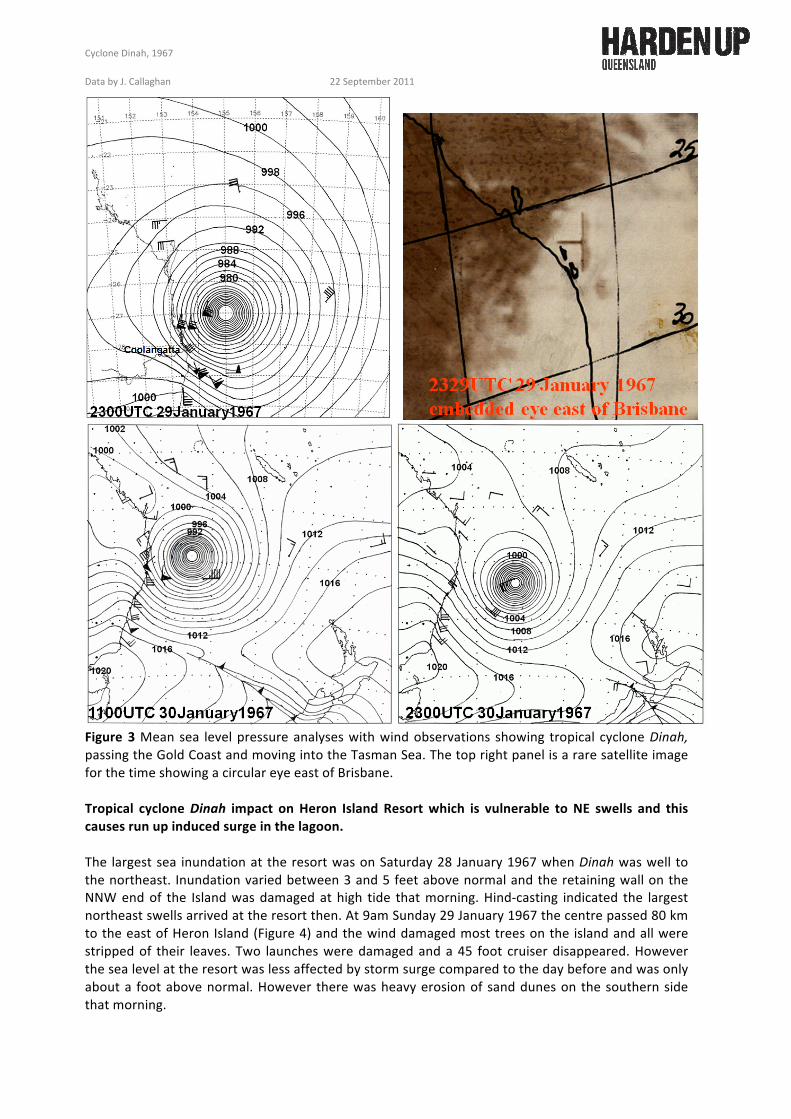
Figure1 Satellite photograph of tropical cyclone Dinah on the morning of 28 January 1967 showing a clear compact eye embedded in cold (bright white) cloud tops indicating a very intense tropical cyclone. Twenty one satellite photographs of Dinah were received over the eleven day period the Brisbane Tropical Cyclone Warning centre was monitoring the system. The first satellite of Dinah showing a clear eye (Figure 1) was when it was probably at its most intense. An eye was more or less visible until east of Brisbane when a clear circular eye (Figure 3) was evident despite the poor quality of the photograph. In Figures 2 and 3 the mean sea level pressure analyses with wind observations show its passage down the sub-‐tropical east coast of Australia into the Tasman Sea. It maintained severe intensity for a very long period. On 3 February 1967, two 2 Ships east of New Zealand passed near the centre of the cyclone, which still had a central pressure of 970hPa. The vessel Ruahine recorded a mean sea level pressure of 973hPa with winds reaching Force 11 and waves 30 feet in height when near 39.3S 179.2E.
Cyclone Dinah, 1967
Data by J. Callaghan 22 September 2011
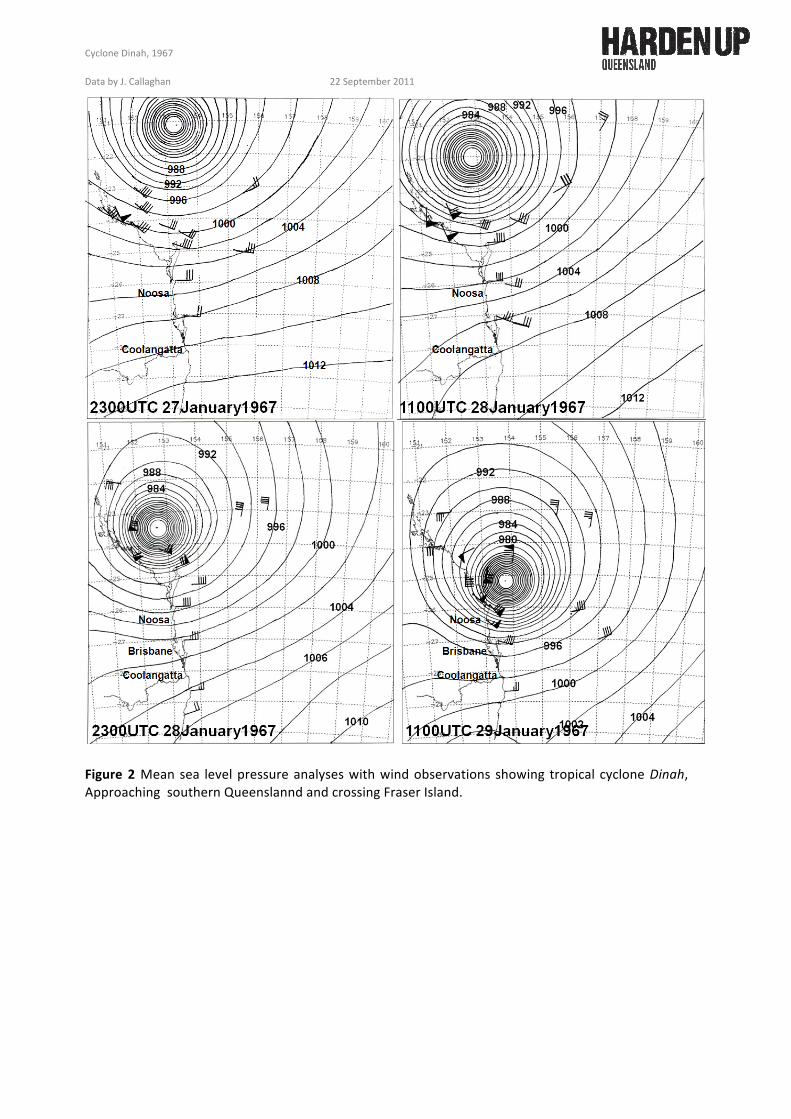
Figure 2 Mean sea level pressure analyses with wind observations showing tropical cyclone Dinah, Approaching southern Queenslannd and crossing Fraser Island.
Cyclone Dinah, 1967
Data by J. Callaghan 22 September 2011
Figure 3 Mean sea level pressure analyses with wind observations showing tropical cyclone Dinah, passing the Gold Coast and moving into the Tasman Sea. The top right panel is a rare satellite image for the time showing a circular eye east of Brisbane. Tropical cyclone Dinah impact on Heron Island Resort which is vulnerable to NE swells and this causes run up induced surge in the lagoon. The largest sea inundation at the resort was on Saturday 28 January 1967 when Dinah was well to the northeast. Inundation varied between 3 and 5 feet above normal and the retaining wall on the NNW end of the Island was damaged at high tide that morning. Hind-‐casting indicated the largest northeast swells arrived at the resort then. At 9am Sunday 29 January 1967 the centre passed 80 km to the east of Heron Island (Figure 4) and the wind damaged most trees on the island and all were stripped of their leaves. Two launches were damaged and a 45 foot cruiser disappeared. However the sea level at the resort was less affected by storm surge compared to the day before and was only about a foot above normal. However there was heavy erosion of sand dunes on the southern side that morning.
Cyclone Dinah, 1967
Data by J. Callaghan 22 September 2011
Available observations from Heron Island mean wind and MSLP 9pm 27th 1100UTC 27 January 1967 160/40knots 997.8hPa 9am 28th 2300UTC 27 January 1967 130/45knots 997.9hPa 3pm 28th 0500UTC 28 January 1967 140/53knots 994.9hPa 9pm 28th 1100UTC 28 January 1967 160/70knots 988.2hPa
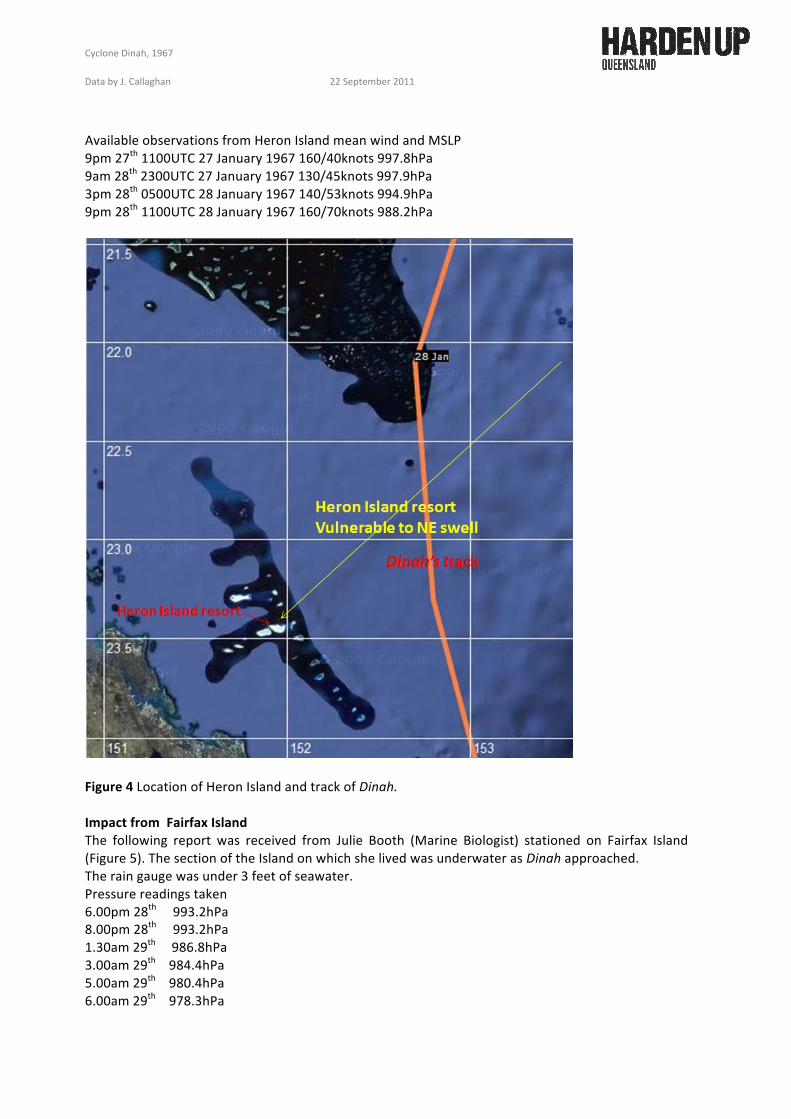
Figure 4 Location of Heron Island and track of Dinah. Impact from Fairfax Island The following report was received from Julie Booth (Marine Biologist) stationed on Fairfax Island (Figure 5). The section of the Island on which she lived was underwater as Dinah approached. The rain gauge was under 3 feet of seawater. Pressure readings taken 6.00pm 28th 993.2hPa 8.00pm 28th 993.2hPa 1.30am 29th 986.8hPa 3.00am 29th 984.4hPa 5.00am 29th 980.4hPa 6.00am 29th 978.3hPa
Cyclone Dinah, 1967
Data by J. Callaghan 22 September 2011
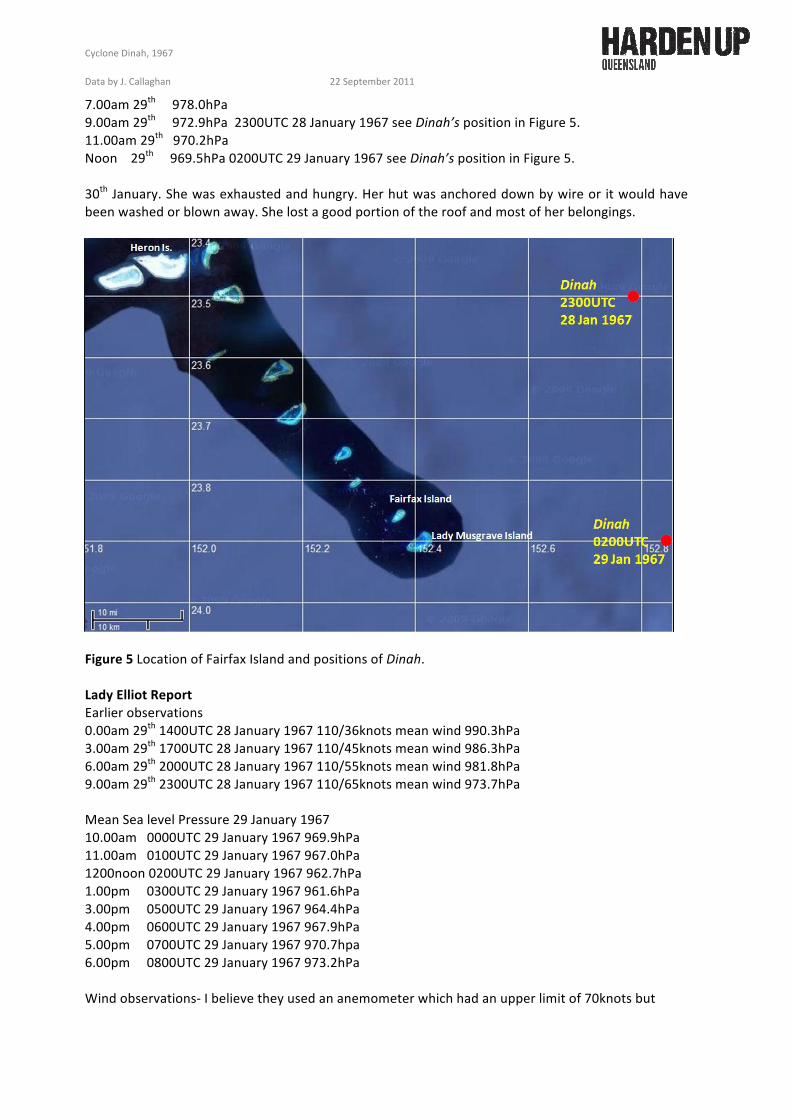
7.00am 29th 978.0hPa 9.00am 29th 972.9hPa 2300UTC 28 January 1967 see Dinah’s position in Figure 5. 11.00am 29th 970.2hPa Noon 29th 969.5hPa 0200UTC 29 January 1967 see Dinah’s position in Figure 5. 30th January. She was exhausted and hungry. Her hut was anchored down by wire or it would have been washed or blown away. She lost a good portion of the roof and most of her belongings.
Figure 5 Location of Fairfax Island and positions of Dinah. Lady Elliot Report Earlier observations 0.00am 29th 1400UTC 28 January 1967 110/36knots mean wind 990.3hPa 3.00am 29th 1700UTC 28 January 1967 110/45knots mean wind 986.3hPa 6.00am 29th 2000UTC 28 January 1967 110/55knots mean wind 981.8hPa 9.00am 29th 2300UTC 28 January 1967 110/65knots mean wind 973.7hPa Mean Sea level Pressure 29 January 1967 10.00am 0000UTC 29 January 1967 969.9hPa 11.00am 0100UTC 29 January 1967 967.0hPa 1200noon 0200UTC 29 January 1967 962.7hPa 1.00pm 0300UTC 29 January 1967 961.6hPa 3.00pm 0500UTC 29 January 1967 964.4hPa 4.00pm 0600UTC 29 January 1967 967.9hPa 5.00pm 0700UTC 29 January 1967 970.7hpa 6.00pm 0800UTC 29 January 1967 973.2hPa Wind observations-‐ I believe they used an anemometer which had an upper limit of 70knots but
Cyclone Dinah, 1967
Data by J. Callaghan 22 September 2011
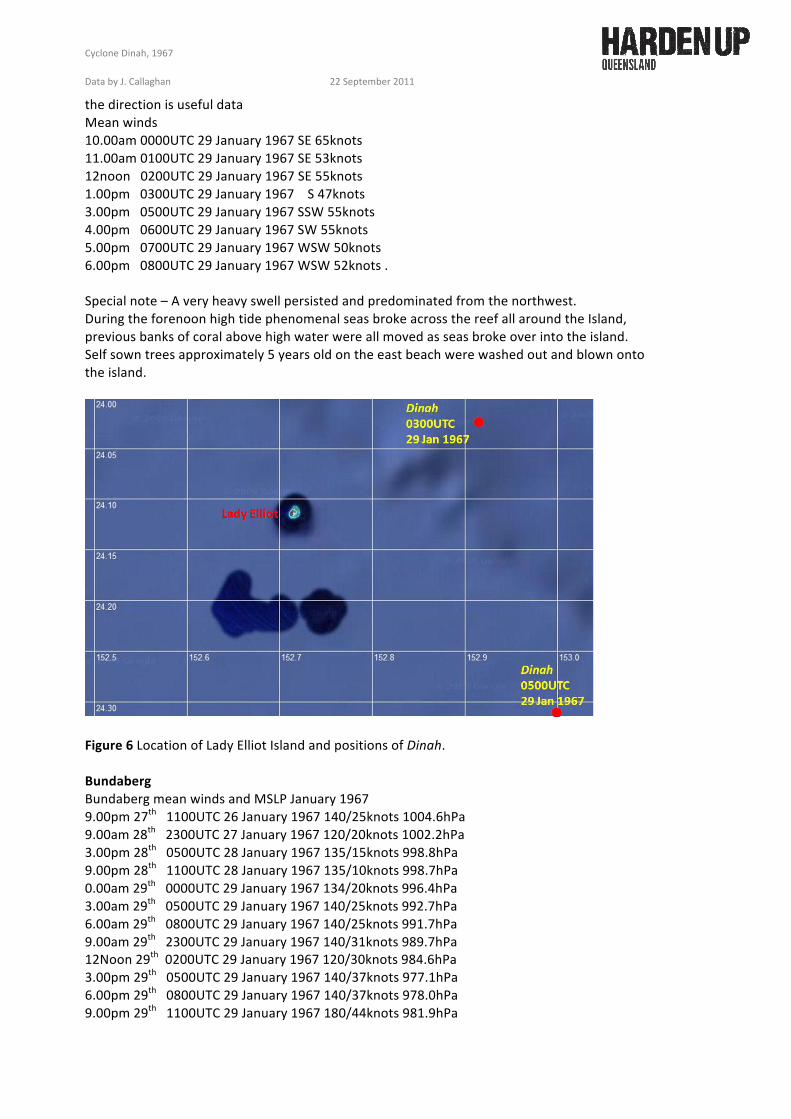
the direction is useful data Mean winds 10.00am 0000UTC 29 January 1967 SE 65knots 11.00am 0100UTC 29 January 1967 SE 53knots 12noon 0200UTC 29 January 1967 SE 55knots 1.00pm 0300UTC 29 January 1967 S 47knots 3.00pm 0500UTC 29 January 1967 SSW 55knots 4.00pm 0600UTC 29 January 1967 SW 55knots 5.00pm 0700UTC 29 January 1967 WSW 50knots 6.00pm 0800UTC 29 January 1967 WSW 52knots . Special note – A very heavy swell persisted and predominated from the northwest. During the forenoon high tide phenomenal seas broke across the reef all around the Island, previous banks of coral above high water were all moved as seas broke over into the island. Self sown trees approximately 5 years old on the east beach were washed out and blown onto the island.
Figure 6 Location of Lady Elliot Island and positions of Dinah. Bundaberg Bundaberg mean winds and MSLP January 1967 9.00pm 27th 1100UTC 26 January 1967 140/25knots 1004.6hPa 9.00am 28th 2300UTC 27 January 1967 120/20knots 1002.2hPa 3.00pm 28th 0500UTC 28 January 1967 135/15knots 998.8hPa 9.00pm 28th 1100UTC 28 January 1967 135/10knots 998.7hPa 0.00am 29th 0000UTC 29 January 1967 134/20knots 996.4hPa 3.00am 29th 0500UTC 29 January 1967 140/25knots 992.7hPa 6.00am 29th 0800UTC 29 January 1967 140/25knots 991.7hPa 9.00am 29th 2300UTC 29 January 1967 140/31knots 989.7hPa 12Noon 29th 0200UTC 29 January 1967 120/30knots 984.6hPa 3.00pm 29th 0500UTC 29 January 1967 140/37knots 977.1hPa 6.00pm 29th 0800UTC 29 January 1967 140/37knots 978.0hPa 9.00pm 29th 1100UTC 29 January 1967 180/44knots 981.9hPa
Cyclone Dinah, 1967
Data by J. Callaghan 22 September 2011
0.00am 30th 1400UTC 29 January 1967 220/37knots 984.9hPa 3.00am 30th 1700UTC 29 January 1967 220/25knots 986.6hPa 6.00am 30th 2000UTC 29 January 1967 210/03knots 990.7hPa 9.00am 30th 2300UTC 29 January 1967 210/05knots 994.3hPa 12Noon 30th 0200UTC 30 January 1967 220/05knots 994.1hPa 3.00pm 30th 0500UTC 30 January 1967 220/02knots 994.4hPa A big tide with huge waves flooded roads and low lying areas at Bargara and the highest sea level was at 11am 28th January. Also at Bargara winds tore off a large section of roofing from a unit in Clarke Street and a number of other houses suffered damage. A 75 foot tower was blown over. At Burnett Heads the sea crossed beach front roads and flooded low lying properties. The Catholic Church had most of its roof torn off and a section of the roof on the Progress Association Hall was ripped away. In Bundaberg a section of the roof of the Wintergarden Theatre was torn off and a section of the roof on the Grandstand at Salter Oval was torn off. Some houses in the city suffered roof damage.
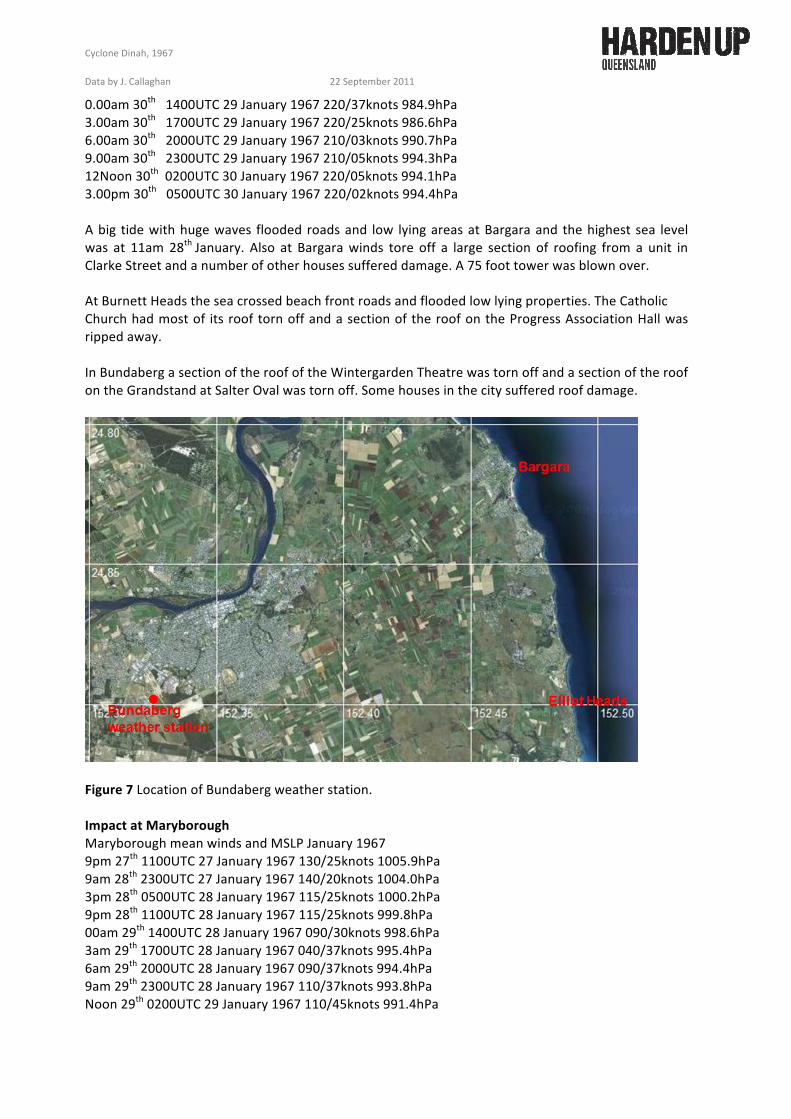
Figure 7 Location of Bundaberg weather station. Impact at Maryborough Maryborough mean winds and MSLP January 1967 9pm 27th 1100UTC 27 January 1967 130/25knots 1005.9hPa 9am 28th 2300UTC 27 January 1967 140/20knots 1004.0hPa 3pm 28th 0500UTC 28 January 1967 115/25knots 1000.2hPa 9pm 28th 1100UTC 28 January 1967 115/25knots 999.8hPa 00am 29th 1400UTC 28 January 1967 090/30knots 998.6hPa 3am 29th 1700UTC 28 January 1967 040/37knots 995.4hPa 6am 29th 2000UTC 28 January 1967 090/37knots 994.4hPa 9am 29th 2300UTC 28 January 1967 110/37knots 993.8hPa Noon 29th 0200UTC 29 January 1967 110/45knots 991.4hPa
Cyclone Dinah, 1967
Data by J. Callaghan 22 September 2011
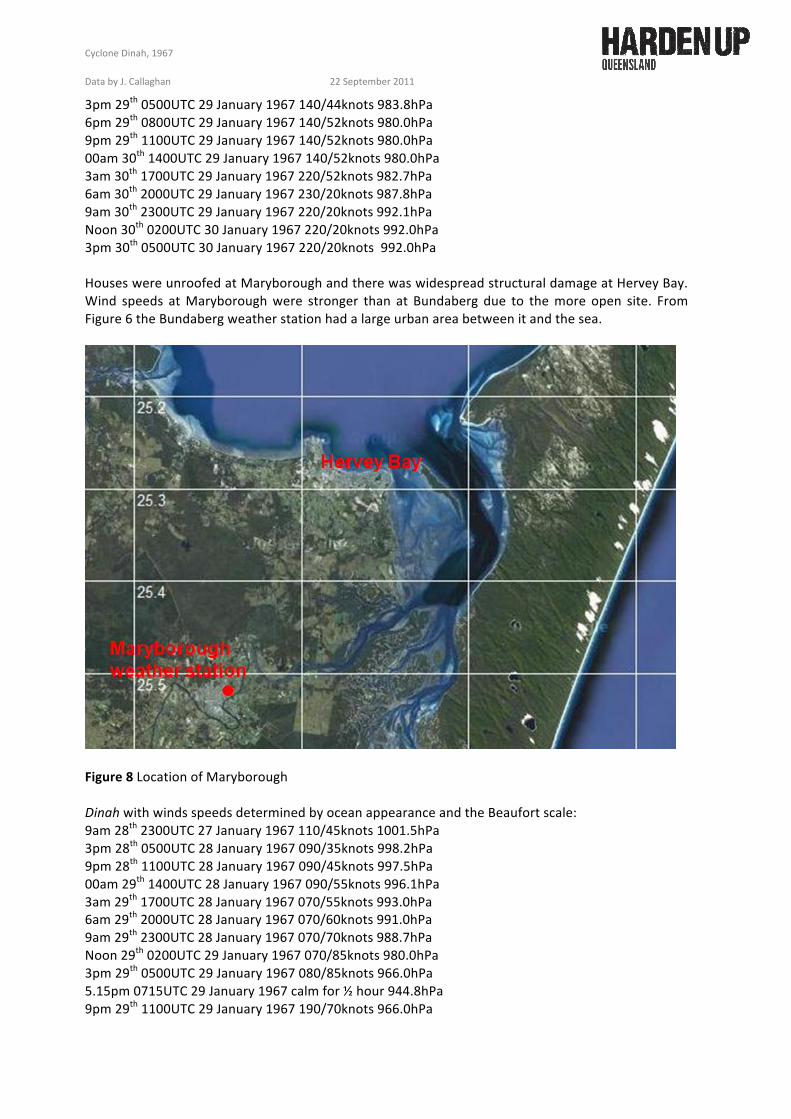
3pm 29th 0500UTC 29 January 1967 140/44knots 983.8hPa 6pm 29th 0800UTC 29 January 1967 140/52knots 980.0hPa 9pm 29th 1100UTC 29 January 1967 140/52knots 980.0hPa 00am 30th 1400UTC 29 January 1967 140/52knots 980.0hPa 3am 30th 1700UTC 29 January 1967 220/52knots 982.7hPa 6am 30th 2000UTC 29 January 1967 230/20knots 987.8hPa 9am 30th 2300UTC 29 January 1967 220/20knots 992.1hPa Noon 30th 0200UTC 30 January 1967 220/20knots 992.0hPa 3pm 30th 0500UTC 30 January 1967 220/20knots 992.0hPa Houses were unroofed at Maryborough and there was widespread structural damage at Hervey Bay. Wind speeds at Maryborough were stronger than at Bundaberg due to the more open site. From Figure 6 the Bundaberg weather station had a large urban area between it and the sea.
Figure 8 Location of Maryborough Dinah with winds speeds determined by ocean appearance and the Beaufort scale: 9am 28th 2300UTC 27 January 1967 110/45knots 1001.5hPa 3pm 28th 0500UTC 28 January 1967 090/35knots 998.2hPa 9pm 28th 1100UTC 28 January 1967 090/45knots 997.5hPa 00am 29th 1400UTC 28 January 1967 090/55knots 996.1hPa 3am 29th 1700UTC 28 January 1967 070/55knots 993.0hPa 6am 29th 2000UTC 28 January 1967 070/60knots 991.0hPa 9am 29th 2300UTC 28 January 1967 070/70knots 988.7hPa Noon 29th 0200UTC 29 January 1967 070/85knots 980.0hPa 3pm 29th 0500UTC 29 January 1967 080/85knots 966.0hPa 5.15pm 0715UTC 29 January 1967 calm for ½ hour 944.8hPa 9pm 29th 1100UTC 29 January 1967 190/70knots 966.0hPa
Cyclone Dinah, 1967
Data by J. Callaghan 22 September 2011
00am 30th 1400UTC 29 January 1967 220/85knots 977.5hPa 3am 30th 1700UTC 29 January 1967 220/65knots 984.2hPa 6am 30th 2000UTC 29 January 1967 270/40knots 989.6hPa 9am 30th 2300UTC 29 January 1967 270/30knots 992.6hPa 3pm 30th 0500UTC 30 January 1967 290/10knots 995.2hPa 6pm 30th 0800UTC 30 January 1967 360/05knots 997.7hPa
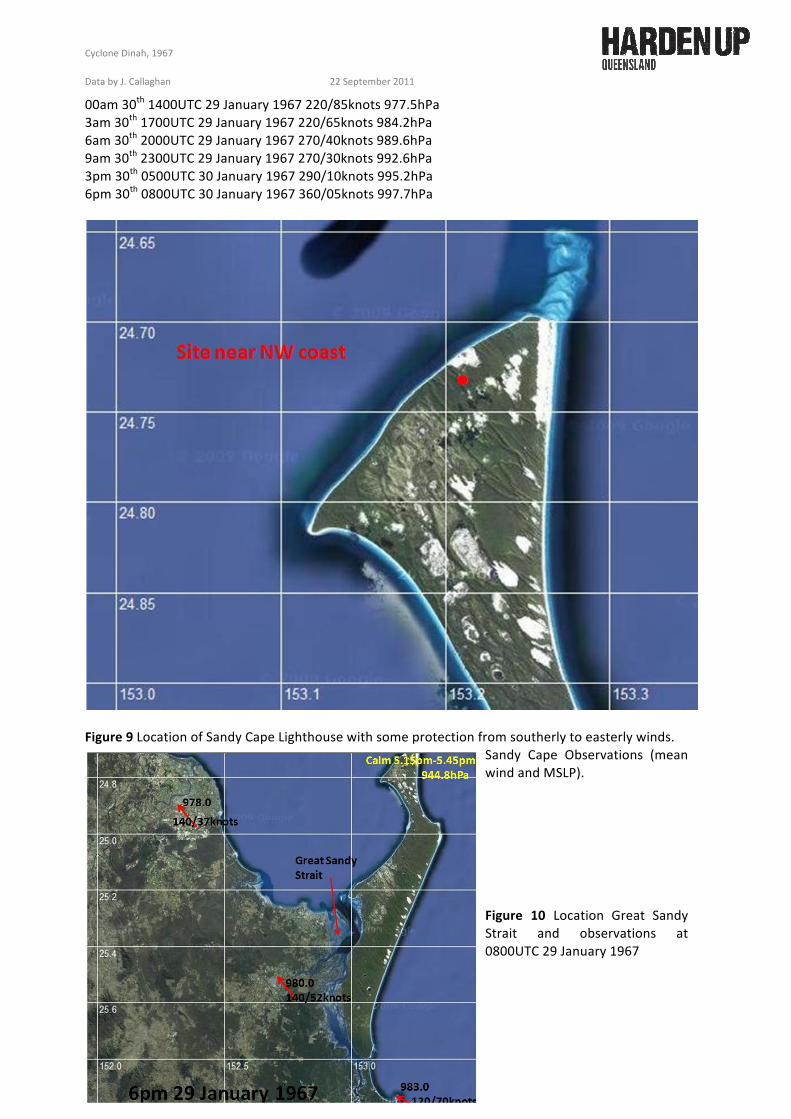
Figure 9 Location of Sandy Cape Lighthouse with some protection from southerly to easterly winds.
Sandy Cape Observations (mean wind and MSLP). Figure 10 Location Great Sandy Strait and observations at 0800UTC 29 January 1967

Cyclone Dinah, 1967
Data by J. Callaghan 22 September 2011
Great Sandy Strait (Figure 10) Recently from a Marine Biologist –there is massive damage to seagrass in Great Sandy Strait evident from southeasterly waves generated by Dinah still visible today. Observations at Double Island Point (location see Figure 11) Double Island Point observations (mean wind and MSLP) during Dinah 9am 28th 090/30knots 1004.1hPa 3pm 28th 110/37knots 1000.8hPa 9pm 28th 090/45knots 1000.8hPa 00am 29th 090/45knots 998.5hPa 3am 29th 090/45knots 996.2hPa 6am 29th 090/45knots 995.6hPa 9am 29th 090/40knots 995.3hPa Noon 29th 090/48knots 992.2hPa 3pm 29th 100/55knots 987.1hPa 6pm 29th 120/70knots 983.0hPa 9pm 29th 140/80knots 972.9hPa 00am 30th 140/98knots 966.1hPa 3am 30th 160/86knots lowest pressure 965.8hPa 6am 30th 180/40knots 982.4hPa 9am 30th 240/20knots 989.1hPa Noon 30th 220/20knots 992.0hPa 3pm 30th 180/10knots 993.5hPa Damage report from Double Island Point: Large trees were uprooted and many trees were washed down from the foreshore along Rainbow Beach. Rocks were uncovered on the beach. Tons of sand were shifted through the sand blow burying the boat shed. Residents in the area have since reported a large storm surge (2metres) along the flats between Rainbow Beach and Double Island Point. Salt water flooded cane fields at Bli Bli and seawater was knee deep in Hastings Street Noosa. Observations at Cape Moreton (location see Figure 11) Observations from Cape Moreton Lighthouse with winds speeds determined by ocean appearance and the Beaufort scale:-‐ Cape Moreton observations (mean wind and MSLP) during Dinah 9am 28th 110/20knots 1007.9hPa (surge at Sandgate in AM high tide) 3pm 28th 110/30knots 1004.8hPa 9pm 28th 110/35knots 1005.5hPa 00am 29th 110/30knots 1002.3hPa 3am 29th 110/30knots 1001.2hPa 6am 29th 110/35knots 1001.1hPa 9am 29th 090/35knots 1000.6hPa Noon 29th 090/35knots 999.2hPa (big surge at Sandgate 5ft water in houses)
Cyclone Dinah, 1967
Data by J. Callaghan 22 September 2011
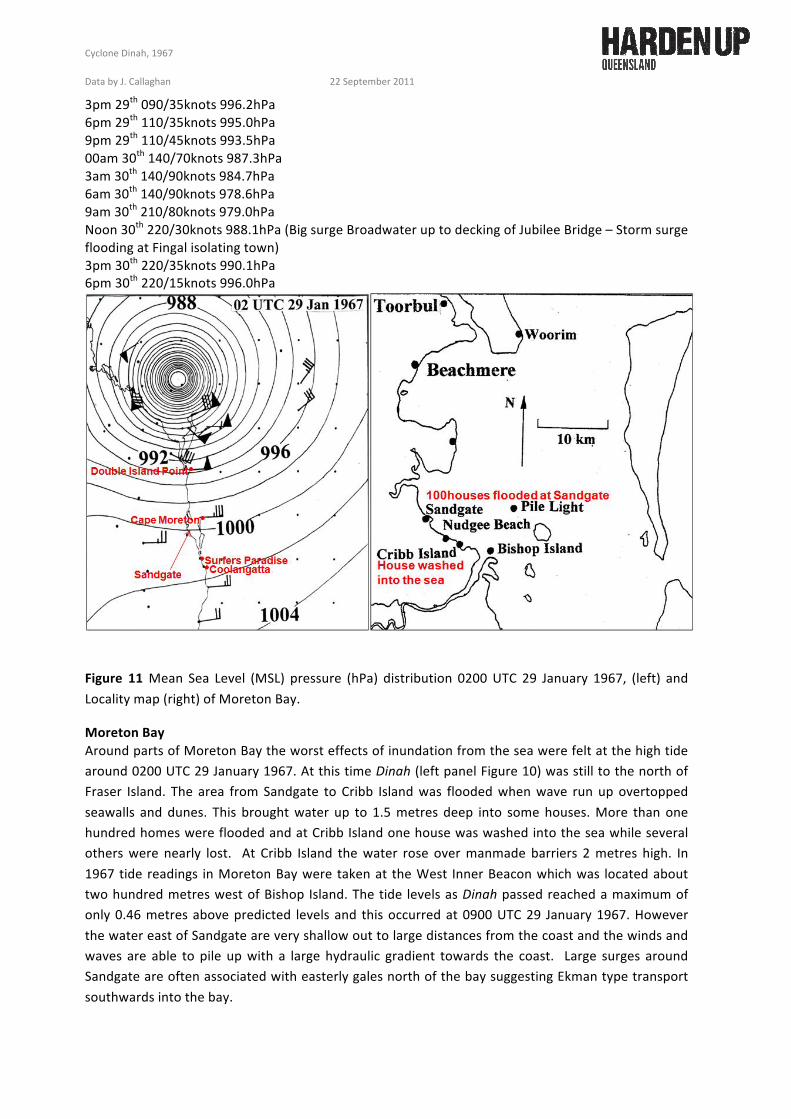
3pm 29th 090/35knots 996.2hPa 6pm 29th 110/35knots 995.0hPa 9pm 29th 110/45knots 993.5hPa 00am 30th 140/70knots 987.3hPa 3am 30th 140/90knots 984.7hPa 6am 30th 140/90knots 978.6hPa 9am 30th 210/80knots 979.0hPa Noon 30th 220/30knots 988.1hPa (Big surge Broadwater up to decking of Jubilee Bridge – Storm surge flooding at Fingal isolating town) 3pm 30th 220/35knots 990.1hPa 6pm 30th 220/15knots 996.0hPa
Figure 11 Mean Sea Level (MSL) pressure (hPa) distribution 0200 UTC 29 January 1967, (left) and Locality map (right) of Moreton Bay.
Moreton Bay Around parts of Moreton Bay the worst effects of inundation from the sea were felt at the high tide around 0200 UTC 29 January 1967. At this time Dinah (left panel Figure 10) was still to the north of Fraser Island. The area from Sandgate to Cribb Island was flooded when wave run up overtopped seawalls and dunes. This brought water up to 1.5 metres deep into some houses. More than one hundred homes were flooded and at Cribb Island one house was washed into the sea while several others were nearly lost. At Cribb Island the water rose over manmade barriers 2 metres high. In 1967 tide readings in Moreton Bay were taken at the West Inner Beacon which was located about two hundred metres west of Bishop Island. The tide levels as Dinah passed reached a maximum of only 0.46 metres above predicted levels and this occurred at 0900 UTC 29 January 1967. However the water east of Sandgate are very shallow out to large distances from the coast and the winds and waves are able to pile up with a large hydraulic gradient towards the coast. Large surges around Sandgate are often associated with easterly gales north of the bay suggesting Ekman type transport southwards into the bay.
Cyclone Dinah, 1967
Data by J. Callaghan 22 September 2011
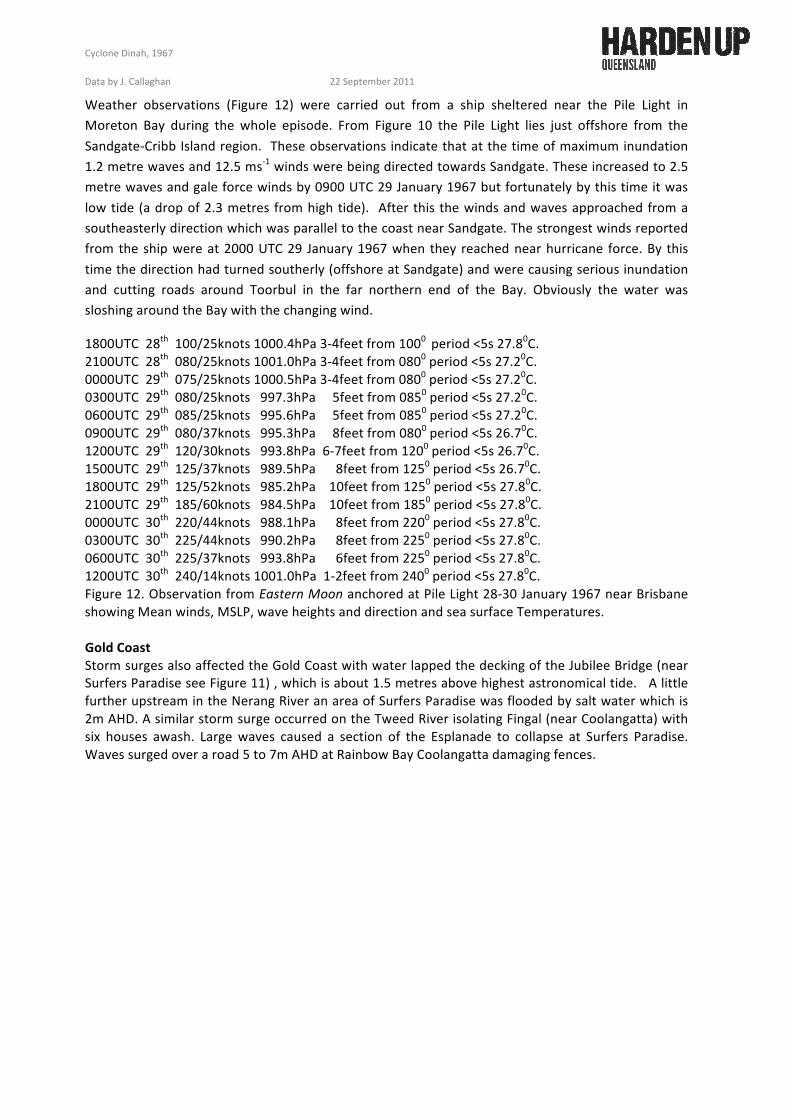
Weather observations (Figure 12) were carried out from a ship sheltered near the Pile Light in Moreton Bay during the whole episode. From Figure 10 the Pile Light lies just offshore from the Sandgate-‐Cribb Island region. These observations indicate that at the time of maximum inundation 1.2 metre waves and 12.5 ms-‐1 winds were being directed towards Sandgate. These increased to 2.5 metre waves and gale force winds by 0900 UTC 29 January 1967 but fortunately by this time it was low tide (a drop of 2.3 metres from high tide). After this the winds and waves approached from a southeasterly direction which was parallel to the coast near Sandgate. The strongest winds reported from the ship were at 2000 UTC 29 January 1967 when they reached near hurricane force. By this time the direction had turned southerly (offshore at Sandgate) and were causing serious inundation and cutting roads around Toorbul in the far northern end of the Bay. Obviously the water was sloshing around the Bay with the changing wind.
1800UTC 28th 100/25knots 1000.4hPa 3-‐4feet from 1000 period <5s 27.80C. 2100UTC 28th 080/25knots 1001.0hPa 3-‐4feet from 0800 period <5s 27.20C. 0000UTC 29th 075/25knots 1000.5hPa 3-‐4feet from 0800 period <5s 27.20C. 0300UTC 29th 080/25knots 997.3hPa 5feet from 0850 period <5s 27.20C. 0600UTC 29th 085/25knots 995.6hPa 5feet from 0850 period <5s 27.20C. 0900UTC 29th 080/37knots 995.3hPa 8feet from 0800 period <5s 26.70C. 1200UTC 29th 120/30knots 993.8hPa 6-‐7feet from 1200 period <5s 26.70C. 1500UTC 29th 125/37knots 989.5hPa 8feet from 1250 period <5s 26.70C. 1800UTC 29th 125/52knots 985.2hPa 10feet from 1250 period <5s 27.80C. 2100UTC 29th 185/60knots 984.5hPa 10feet from 1850 period <5s 27.80C. 0000UTC 30th 220/44knots 988.1hPa 8feet from 2200 period <5s 27.80C. 0300UTC 30th 225/44knots 990.2hPa 8feet from 2250 period <5s 27.80C. 0600UTC 30th 225/37knots 993.8hPa 6feet from 2250 period <5s 27.80C. 1200UTC 30th 240/14knots 1001.0hPa 1-‐2feet from 2400 period <5s 27.80C. Figure 12. Observation from Eastern Moon anchored at Pile Light 28-‐30 January 1967 near Brisbane showing Mean winds, MSLP, wave heights and direction and sea surface Temperatures. Gold Coast Storm surges also affected the Gold Coast with water lapped the decking of the Jubilee Bridge (near Surfers Paradise see Figure 11) , which is about 1.5 metres above highest astronomical tide. A little further upstream in the Nerang River an area of Surfers Paradise was flooded by salt water which is 2m AHD. A similar storm surge occurred on the Tweed River isolating Fingal (near Coolangatta) with six houses awash. Large waves caused a section of the Esplanade to collapse at Surfers Paradise. Waves surged over a road 5 to 7m AHD at Rainbow Bay Coolangatta damaging fences.