Rockfishes of the genera Sebastes and Rockfish Report June 15, 2009 6 Overall Seafood Recommendation...
109
Seafood Watch Seafood Report Rockfishes of the genera Sebastes and Sebastolobus Black Rockfish, Illustration © Monterey Bay Aquarium West Coast Region Original Report Published June 16, 2006 Last Updated June 15, 2009 Santi Roberts and Melissa M Stevens Fisheries Research Analysts (Former) Monterey Bay Aquarium
Transcript of Rockfishes of the genera Sebastes and Rockfish Report June 15, 2009 6 Overall Seafood Recommendation...
Seafood Watch Seafood Report
Rockfishes of the genera Sebastes and Sebastolobus
Black Rockfish, Illustration © Monterey Bay Aquarium
West Coast Region
Original Report Published June 16, 2006
Last Updated June 15, 2009
Santi Roberts and Melissa M Stevens Fisheries Research Analysts (Former)
Monterey Bay Aquarium

SeafoodWatch® Rockfish Report June 15, 2009
2
About Seafood Watch® and the Seafood Reports
Monterey Bay Aquarium’s Seafood Watch® program evaluates the ecological sustainability of wild-caught and farmed seafood commonly found in the United States marketplace. Seafood Watch® defines sustainable seafood as originating from sources, whether wild-caught or farmed, which can maintain or increase production in the long-term without jeopardizing the structure or function of affected ecosystems. Seafood Watch® makes its science-based recommendations available to the public in the form of regional pocket guides that can be downloaded from the Internet (seafoodwatch.org) or obtained from the Seafood Watch® program by emailing [email protected]. The program’s goals are to raise awareness of important ocean conservation issues and empower seafood consumers and businesses to make choices for healthy oceans. Each sustainability recommendation on the regional pocket guides is supported by a Seafood Report. Each report synthesizes and analyzes the most current ecological, fisheries and ecosystem science on a species, then evaluates this information against the program’s conservation ethic to arrive at a recommendation of “Best Choices,” “Good Alternatives,” or “Avoid.” The detailed evaluation methodology is available upon request. In producing the Seafood Reports, Seafood Watch® seeks out research published in academic, peer-reviewed journals whenever possible. Other sources of information include government technical publications, fishery management plans and supporting documents, and other scientific reviews of ecological sustainability. Seafood Watch® Fisheries Research Analysts also communicate regularly with ecologists, fisheries and aquaculture scientists, and members of industry and conservation organizations when evaluating fisheries and aquaculture practices. Capture fisheries and aquaculture practices are highly dynamic; as the scientific information on each species changes, Seafood Watch’s sustainability recommendations and the underlying Seafood Reports will be updated to reflect these changes. Parties interested in capture fisheries, aquaculture practices and the sustainability of ocean ecosystems are welcome to use Seafood Reports in any way they find useful. For more information about Seafood Watch® and Seafood Reports, please contact the Seafood Watch® program at Monterey Bay Aquarium by calling (831) 647-6873 or emailing [email protected]. Disclaimer Seafood Watch® strives to have all Seafood Reports reviewed for accuracy and completeness by external scientists with expertise in ecology, fisheries science and aquaculture. Scientific review, however, does not constitute an endorsement of the Seafood Watch® program or its recommendations on the part of the reviewing scientists. Seafood Watch® is solely responsible for the conclusions reached in this report. Seafood Watch® and Seafood Reports are made possible through a grant from the David and Lucile Packard Foundation.
SeafoodWatch® Rockfish Report June 15, 2009
3
Executive Summary Rockfishes (Sebastes, Sebastolobus) are an extremely evolutionarily successful group, with over 100 species worldwide and at least 72 species in the eastern Pacific. They have been fished along the Pacific coastline for thousands of years, but in the last fifty years have experienced heavy commercial and recreational fishing pressure along the US and Canadian coasts. Their life history characteristics—slow growth, late age at maturity, and in some cases, extreme longevity of 100 years or more—make many of them vulnerable to intense fishing pressure. Nearshore species tend to be faster-growing and shorter-lived than the shelf and slope species, and are thus relatively more resilient to fishing. The abundance of several West Coast and British Columbia (BC) shelf and slope rockfish species is at historical lows due to the combined strain of overfishing, habitat loss from trawling activities, and adverse oceanographic changes resulting in weak recruitment for juvenile rockfishes. Alaskan stocks appear to be in better condition, with the biomass of the commercially most valuable species (in terms of landings) above the BMSY proxy (B35%). The status of the majority of other rockfish species is unknown at this time. As rockfish generally co-occur with other species of rockfish, fishing for a single species presents a challenge. Thus, many species that are in poor or unknown condition are caught in fisheries for other rockfish species. Exceptions to this rule are the thornyheads (Sebastolobus spp.), which aggregate together but not with other rockfish. Off the West Coast, thornyheads are well above the BMSY proxy (B40%) while the stock status of those in Alaska are unknown but not experiencing overfishing. Thornyheads in BC are likely in poor condition, however, with unknown but declining biomass. With exceptions in the Puget Sound and the “inside” fishery in BC (mainly inside the Strait of Georgia and Juan de Fuca Strait), no nearshore rockfishes have been identified as overfished or experiencing overfishing, though the stock status of most is unknown. Because of the low biomass of some rockfish species and the mixed-species nature of the groundfish fishery, the overall groundfish harvest has been significantly reduced off the West Coast. Management has closed some fishing grounds to prevent the incidental take of depleted stocks, designed to allow them time to rebuild. Such measures, combined with a possible change in environmental conditions improving recruitment success, appear to be working; all depleted rockfish off the West Coast are increasing in biomass, albeit slowly. Management in all regions has closed large areas to certain fishing gears, notably trawling, either to reduce bycatch, provide a protected area for depleted groundfish, or mitigate the damage caused by those gears on the seafloor. However, fishing continues in the hardbottom and biogenic habitats favored by rockfish, which remains a serious concern in the case of bottom trawls, a moderate concern with bottom longlines and midwater trawls, and a low concern with hook-and-line and pole gear that does not touch the seafloor. Bottom longlines are also used to catch shelf and slope rockfish, although the impact on the seabed is more moderate for this gear than for trawls. Both bottom longlines and bottom trawls also discard moderate amounts of bycatch, and concerns remain over seabird bycatch in Alaskan and BC bottom longline fisheries. In contrast, midwater trawls and the hook-and-line and pole gear used in most nearshore fisheries typically have very low discard rates. The southern (south of 40º10’ N) nearshore fishery, however, does have moderate levels of discards, perhaps due to the higher diversity of fish caught and gears used.
SeafoodWatch® Rockfish Report June 15, 2009
4
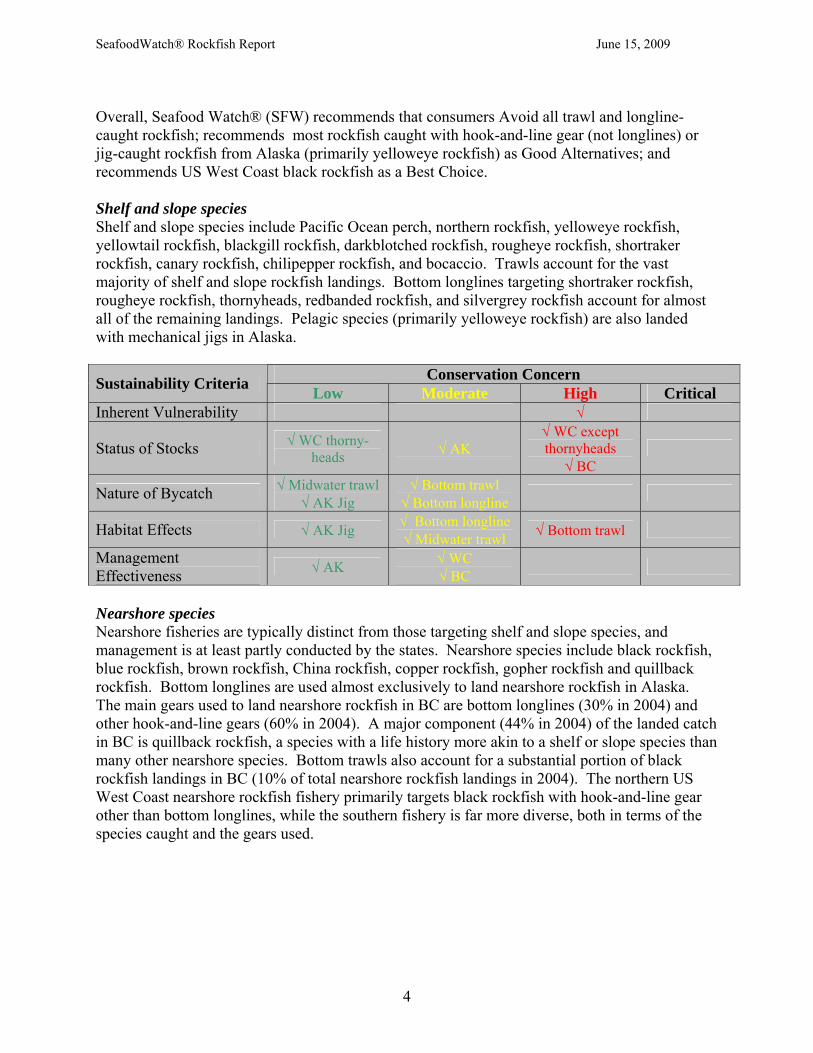
Overall, Seafood Watch® (SFW) recommends that consumers Avoid all trawl and longline-caught rockfish; recommends most rockfish caught with hook-and-line gear (not longlines) or jig-caught rockfish from Alaska (primarily yelloweye rockfish) as Good Alternatives; and recommends US West Coast black rockfish as a Best Choice. Shelf and slope species Shelf and slope species include Pacific Ocean perch, northern rockfish, yelloweye rockfish, yellowtail rockfish, blackgill rockfish, darkblotched rockfish, rougheye rockfish, shortraker rockfish, canary rockfish, chilipepper rockfish, and bocaccio. Trawls account for the vast majority of shelf and slope rockfish landings. Bottom longlines targeting shortraker rockfish, rougheye rockfish, thornyheads, redbanded rockfish, and silvergrey rockfish account for almost all of the remaining landings. Pelagic species (primarily yelloweye rockfish) are also landed with mechanical jigs in Alaska.
Conservation Concern Sustainability Criteria Low Moderate High Critical Inherent Vulnerability √
Status of Stocks √ WC thorny-heads √ AK
√ WC except thornyheads
√ BC
Nature of Bycatch √ Midwater trawl √ AK Jig
√ Bottom trawl √ Bottom longline
Habitat Effects √ AK Jig √ Bottom longline √ Midwater trawl √ Bottom trawl
Management Effectiveness √ AK √ WC
√ BC
Nearshore species Nearshore fisheries are typically distinct from those targeting shelf and slope species, and management is at least partly conducted by the states. Nearshore species include black rockfish, blue rockfish, brown rockfish, China rockfish, copper rockfish, gopher rockfish and quillback rockfish. Bottom longlines are used almost exclusively to land nearshore rockfish in Alaska. The main gears used to land nearshore rockfish in BC are bottom longlines (30% in 2004) and other hook-and-line gears (60% in 2004). A major component (44% in 2004) of the landed catch in BC is quillback rockfish, a species with a life history more akin to a shelf or slope species than many other nearshore species. Bottom trawls also account for a substantial portion of black rockfish landings in BC (10% of total nearshore rockfish landings in 2004). The northern US West Coast nearshore rockfish fishery primarily targets black rockfish with hook-and-line gear other than bottom longlines, while the southern fishery is far more diverse, both in terms of the species caught and the gears used.

SeafoodWatch® Rockfish Report June 15, 2009
5
Conservation Concern Sustainability Criteria Low Moderate High Critical
Inherent Vulnerability √ all nearshore species except
quillback √ quillback
Status of Stocks √ WC Black rockfish
√ US except black rockfish and Puget
Sound stocks √ BC nearshore “outside” stocks
√ BC nearshore “inside” stocks √ Puget Sound stocks
Nature of Bycatch
√ All hook and line (not bottom longline) except southern WC nearshore
fishery √ Midwater trawl
√ Southern WC hook and line √ Bottom trawl
√ Bottom longline
Habitat Effects √ Hook-and-line √ Bottom longline √ Midwater trawl
√ Bottom trawl
Management Effectiveness √ US √ BC
US = US West Coast and Alaska; BC = British Columbia; AK = Alaska; WC = West Coast; Southern WC = Nearshore mixed gear fishery south of 40º10”. About the Overall Seafood Recommendation:
• A seafood product is ranked “Avoid” if two or more criteria are of High Conservation Concern (red) OR if one or more criteria are of Critical Conservation Concern (black) in the table above.
• A seafood product is ranked “Good Alternative” if the five criteria “average” to yellow (Moderate Conservation Concern) OR if the “Status of Stocks” and “Management Effectiveness” criteria are both of Moderate Conservation Concern.
• A seafood product is ranked “Best Choice” if three or more criteria are of Low Conservation Concern (green) and the remaining criteria are not of High or Critical Conservation Concern.
As trawl-caught rockfish account for over 80% of US West Coast landings and over 90% of BC and Alaskan landings, Seafood Watch® recommends that consumers avoid rockfish unless the species and gear used are known.

SeafoodWatch® Rockfish Report June 15, 2009
6
Overall Seafood Recommendation for Rockfish
US West Coast black rockfish
AK hook and line caught nearshore rockfish (except quillback)
Best Choice
AK jig, bottom longline, or midwater trawl slope/shelf rockfish and quillback rockfish
AK nearshore rockfish, except quillback (all gear)
Quillback rockfish from BC outside waters and US West Coast (except bottom trawl)
US West Coast nearshore (except Puget Sound and quillback) and BC nearshore outside waters rockfish, bottom-trawl caught
US West Coast thornyheads (except bottom trawled)
Hook-and-line, bottom longline, and midwater trawl-caught nearshore rockfish (other than US West Coast black rockfish, AK nearshore rockfish, and BC quillback in inside waters)
Puget Sound stocks (except bottom trawled)
Good Alternative
All bottom trawl-caught slope/shelf rockfish and thornyheads
Bottom longline, midwater trawl, and hook-and-line caught caught slope/shelf BC rockfish
Bottom-longline, midwater trawl, and hook-and-line caught US West Coast slope/shelf rockfish other than thornyheads
Bottom-trawl caught stocks from Puget Sound
Bottom-trawl caught quillback rockfish
Bottom-trawl caught BC nearshore rockfish from inside waters
BC inside waters quillback rockfish (all gears)
Avoid
SeafoodWatch® Rockfish Report June 15, 2009
7
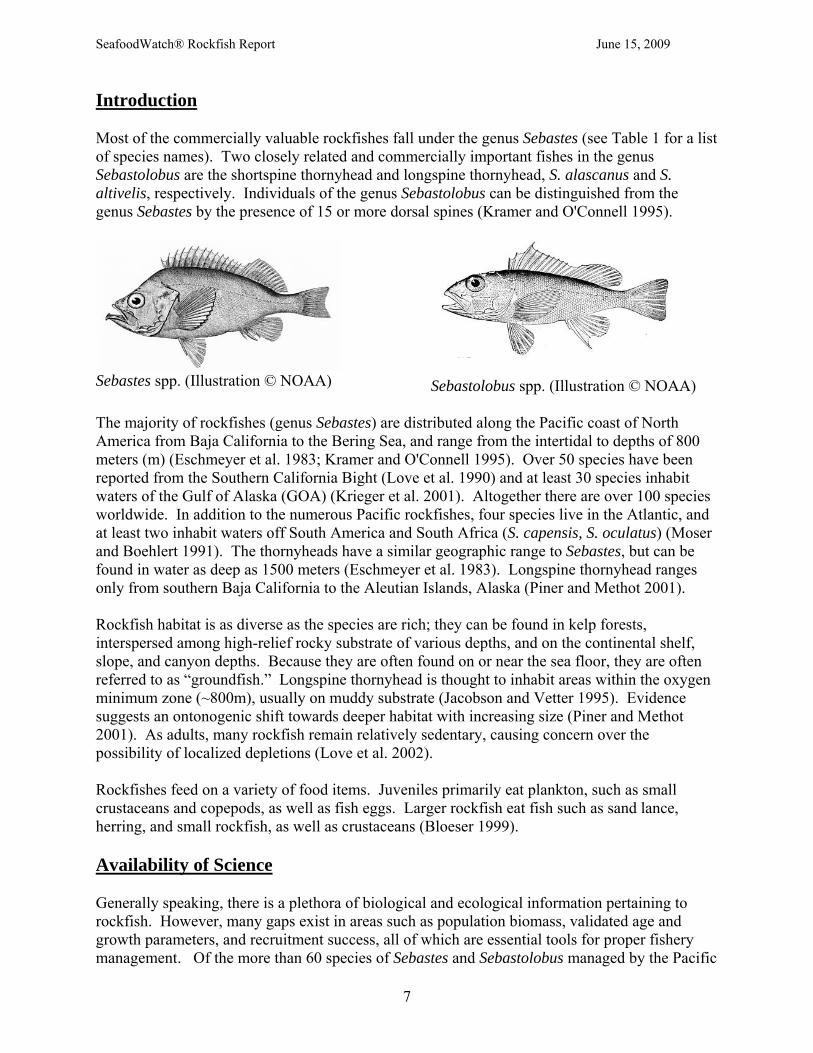
Introduction Most of the commercially valuable rockfishes fall under the genus Sebastes (see Table 1 for a list of species names). Two closely related and commercially important fishes in the genus Sebastolobus are the shortspine thornyhead and longspine thornyhead, S. alascanus and S. altivelis, respectively. Individuals of the genus Sebastolobus can be distinguished from the genus Sebastes by the presence of 15 or more dorsal spines (Kramer and O'Connell 1995).
Sebastes spp. (Illustration © NOAA)
Sebastolobus spp. (Illustration © NOAA)
The majority of rockfishes (genus Sebastes) are distributed along the Pacific coast of North America from Baja California to the Bering Sea, and range from the intertidal to depths of 800 meters (m) (Eschmeyer et al. 1983; Kramer and O'Connell 1995). Over 50 species have been reported from the Southern California Bight (Love et al. 1990) and at least 30 species inhabit waters of the Gulf of Alaska (GOA) (Krieger et al. 2001). Altogether there are over 100 species worldwide. In addition to the numerous Pacific rockfishes, four species live in the Atlantic, and at least two inhabit waters off South America and South Africa (S. capensis, S. oculatus) (Moser and Boehlert 1991). The thornyheads have a similar geographic range to Sebastes, but can be found in water as deep as 1500 meters (Eschmeyer et al. 1983). Longspine thornyhead ranges only from southern Baja California to the Aleutian Islands, Alaska (Piner and Methot 2001). Rockfish habitat is as diverse as the species are rich; they can be found in kelp forests, interspersed among high-relief rocky substrate of various depths, and on the continental shelf, slope, and canyon depths. Because they are often found on or near the sea floor, they are often referred to as “groundfish.” Longspine thornyhead is thought to inhabit areas within the oxygen minimum zone (~800m), usually on muddy substrate (Jacobson and Vetter 1995). Evidence suggests an ontonogenic shift towards deeper habitat with increasing size (Piner and Methot 2001). As adults, many rockfish remain relatively sedentary, causing concern over the possibility of localized depletions (Love et al. 2002). Rockfishes feed on a variety of food items. Juveniles primarily eat plankton, such as small crustaceans and copepods, as well as fish eggs. Larger rockfish eat fish such as sand lance, herring, and small rockfish, as well as crustaceans (Bloeser 1999). Availability of Science Generally speaking, there is a plethora of biological and ecological information pertaining to rockfish. However, many gaps exist in areas such as population biomass, validated age and growth parameters, and recruitment success, all of which are essential tools for proper fishery management. Of the more than 60 species of Sebastes and Sebastolobus managed by the Pacific

SeafoodWatch® Rockfish Report June 15, 2009
8
Fishery Management Council (PFMC), only 16 have had rigorous stock assessments. These include Pacific Ocean perch (POP), shortspine thornyhead, bocaccio, and cowcod, as well as widow, shortbelly, yellowtail, chilipepper, and canary rockfish, which were last assessed in 2004 (PFMC 2004), and gopher rockfish, which was last assessed in 2005. Many species landed in the Canadian fishery have been assessed, but limited data on biological parameters complicates assessments for resource managers. Market Availability Common and market names; Rockfish are commonly marketed on the West Coast as ‘Pacific red snapper’, a designation allowed for 13 species under the Federal Department of Agriculture’s (FDA) Seafood List (Randolph and Snyder 1993). ‘Rockcod’ is another common name. Few species, if any, are ever designated by species at the market. Thornyheads are sometimes called channel rockfish. Seasonal availability and product forms: Rockfishes are caught in a year-round fishery along the Pacific Coast from California to Alaska (including Canada), except where regulations limit the catch of certain species. Rockfishes and thornyheads are available fresh or frozen, filleted, or whole. Some species, such as copper, grass, China, and quillback rockfish, and some catches of thornyheads, are sold live to specialty markets, mainly Asian restaurants (CDFG 2001). Generally speaking, more valuable rockfishes are sold whole, less valuable species are filleted (Love et al. 2002). Consumption information: In a 2001 survey of West Coast seafood consumption conducted by Seafood Watch® researchers at the Monterey Bay Aquarium, rockfish appeared to be a popular item, ranking ninth out of over fifty species of fish and shellfish (Mahoney and Schueneman 2001). Only three other finfish groups were more popular than the rockfish group: halibut, salmon (both wild and farmed), and tunas. Rockfish can be found (mainly in filleted form) at grocery stores and restaurants along the West Coast, but are often times disguised in seafood cuisine, such as cioppino (Italian style seafood soup) and fish tacos. Product sources:
Commercial fishery Rockfish and thornyheads are caught commercially or recreationally throughout their range, which varies by species, geographical area, and depth. Important groundfish trawl grounds off the US West Coast are located outside of 3 miles (CA state law prohibits bottom trawling 0-3 miles from shore) between 15 meters (m) and 500 m depth, usually adjacent to large fishing ports such as Crescent City, CA, Newport, OR, and Seattle, WA (Council 2002; NRC 2002). Off the coast of BC, Canada, major rockfish trawling grounds are located in Queen Charlotte Sound, Hecate Strait, Strait of Georgia and the west coast of Vancouver Island (Schnute et al. 1999). In Alaska, total rockfish landings are divided roughly equally between fisheries in the Gulf of Alaska and those in the Bering Sea and Aleutian Islands. Sebastes spp. The first commercial rockfish fishers caught minor amounts using hook-and-line gear. The introduction of the “balloon trawl” in 1943 allowed for significantly greater catches of rockfish,

SeafoodWatch® Rockfish Report June 15, 2009
9
as large schools could now be targeted over rocky bottoms (Lenarz 1987; Love et al. 2002). In the mid-1960s fishing effort focused largely on stocks of Pacific Ocean perch (POP; S. alutus), which were abundant in the North Pacific. Substantial exploitation by foreign vessels, mainly Soviet and Japanese fleets, peaked in 1965 at 350,000 metric tons (mt) and then declined to 8,000 mt in 1978 (NPFMC 2001). Most foreign fishing ended with the passage of the Magnuson Stevens Fishery Conservation and Management Act of 1976. Joint venture fishing (with foreign processing vessels) dominated groundfish landings until 1979, when the domestic fleet took over and began to increase in power and size. Improvements in gear and technology re-shaped the modern groundfish fleet, making it capable of exceeding sustainable production of the groundfish resource (PFMC 2000). During the 1980s rockfish landings averaged 45,800 mt; peak rockfish catch occurred in 1982 when over 61,000 mt were landed along the US West Coast (PacFIN 2005). The 1990s saw declines in all major stocks, prompting a limited entry program implemented in 1994 and reductions in allowable catch. In essence, the rockfish fishery went from a relatively small fishery harvesting surplus production to one with excess capacity and limited potential for long-term sustainability (Bloeser 1999). Current US West Coast rockfish landings are severely reduced from previous peak levels, and reflect the reduced allowable catch (Figure 1).
0
5,000
10,000
15,000
20,000
25,000
1990
1991
1992
1993
1994
1995
1996
1997
1998
1999
2000
2001
2002
Rep
orte
d la
ndin
gs (m
t)
CAOR WA
Figure 1: US West Coast statewide landings of rockfishes, 1991-2001 (PacFIN 2005) Live fish fishery A relatively new commercial fishery for rockfishes is the live fish, or premium fishery, which has grown rapidly in the last ten years. In the 1970s, BC fishers began taking live quillback rockfish to sell in Vancouver and other cities (Love et al. 2002). In California, the fishery and connecting businesses increased tenfold from 1989 to 1999, going from 76 to 819 vessels (Starr et al. 2002). Initially, sheephead, cabezon, lingcod, greenling, and nearshore rockfishes were targeted and the fishery was open access (no permit required) (Starr et al. 2002). Fishers also began to target thornyheads as landing limits on nearshore rockfishes decreased (Starr et al. 2002). The fragmented nature (many small vessels, nearshore operators) and extremely rapid transit of fish to the market prevented managers from quantifying the amount and type of fish being caught, so regulations have only recently had an impact.

SeafoodWatch® Rockfish Report June 15, 2009
10
Because many nearshore rockfish species are slow-growing and relatively sedentary, this type of fishery may create localized depletions (DFO 2005c; Love et al. 2002). Managers are also concerned that approximately 60% of the rockfish species without stock assessments are being targeted in the California and Oregon live fish fisheries (Bloeser 1999). In 1999, the state of California implemented a limited entry fishery for live fish, and established minimum size limits for ten species (Starr et al. 2002). Managers reduced the allowable catch with weekly or monthly closures and catch limits, and further management action is expected through implementation of a Nearshore Fisheries Management Plan (FMP) by the California Department of Fish and Game (CDFG) (Starr et al. 2002). Washington currently does not permit a live fish fishery in its state waters. BC has a live fish fishery for inshore rockfish species, such as quillback and copper rockfish (DFO 2005c). Sebastolobus spp. Shortspine thornyhead (S. alascanus) lives in shallower water and reaches a larger size than longspine thornyhead (S. altivelis) (Love et al. 2002). Thornyheads were not a directed catch until the 1980s when they became popular in Asian markets, mainly in Japan. Since then, they have been an important component of the Dover sole, thornyhead, sablefish (DTS) complex along the US West Coast. Thornyhead landings reached a record high of 7,090 metric tons (mt) in 1992 and have since declined to less than 1,800 mt annually due to harvest restrictions (Leet et al. 2001). Because thornyheads are hearty and adults do not possess an air bladder, so that, contrary to other rockfish, they survive capture from depth, they are targeted by the live fish fishery. According to CDFG, landings of live thornyheads increased from 2 mt in 1993 to an estimated 100 mt in 1999 (Leet et al. 2001). The Canadian fishery for thornyheads developed in the last decade in response to market demand from Japan and an increase of “frozen at sea” (FAS) technology within the trawl fleet (DFO, 1999). The total trawl catch of thornyheads has increased more than 10-fold since the mid-1980s (DFO 2005). Longspine thornyhead is fished primarily off the west coast of Vancouver Island at depths between 700 and 1,000 m depth, while shortspine thornyhead is fished coastwide between 150 and 550 m depth (DFO, 1999a). Currently (2003) approximately 20 vessels are active in the deepwater thornyhead fishery, landing between 600 and 900 mt of longspine and 1,150-1,750 mt of shortspine thornyhead annually (Haigh and Schnute 2003). Recreational fisheries Rockfishes have comprised at least half the recreational catch along the coast of California (Karpov et al. 1995) and 85% of the fish caught in Monterey Bay (Mason 1998). Most of the catch is taken by hook-and-line, although divers spear some fish. Targeted species vary with regional abundance and fisher preference. Black, dusky, yelloweye, quillback and copper rockfishes predominate off Alaska, while blue, yellowtail, olive, widow, gopher, rosy, and brown rockfishes are frequently taken off northern and central California. In Oregon, black rockfish are the most important, followed by blue, yellowtail, and canary rockfishes (Love et al. 2002). Commercial passenger fishing vessel (CPFV, or “party boat”) surveys conducted in central California by CDFG in the last few decades indicate a three-fold increase in recreational fishing from 1964 to 1982 (Mason 1998). As abundance of nearshore species decreased, anglers fished deeper water and an initial increase in mean length of rockfish was recorded (Mason 1998). This was followed by a decrease in general abundance, length, and weight for several species, such as bocaccio and yellowtail, chilipepper, canary, and blue rockfish (Mason 1998). A similar decline in abundance and size is noted from the Southern California Bight recreational fishery (Love et

SeafoodWatch® Rockfish Report June 15, 2009
11
al. 1998). Catch-per-unit-effort (CPUE) declined sharply between 1980 and 1996, from approximately 3,000 rockfish per 1,000 hours of fishing to 345 rockfish per 1,000 hours (Love et al. 2002). Although this trend may be complicated due to changes in species composition of the fishery over the years, as well as changes in fishing location, a general decline in species size and abundance is evident. In BC, recreational fishing occurs primarily along the southern coast (Schnute 2001). First Nations and recreational landings are estimated from creel surveys and voluntary logbook programs, and are not standardized or reported on a coast-wide basis, making it difficult to assess the relative contribution of recreational catch. It is thought, however, that the degree of recreational catch is significant, due to the average allocation of 254,000 recreational licenses annually in BC (1998-2000) (Schnute 2001). In addition, creel survey estimates in the Strait of Georgia indicate that the recreational catch may rival the commercial catch for that area (DFO 2004). As recreational fisheries do not supply fish to the market, they are not evaluated in this report. However, poorly regulated recreational fisheries can put substantial added pressure on species caught by commercial fisheries and available on the market. Recent commercial landings Alaskan fisheries accounted for over 90% of rockfish landings in 2004, with slightly more coming from the Gulf of Alaska than the Bering Sea and Aleutian Islands area (Figure 2).
50%
41%
4%3% 2%
GOABSAICAORWA
Figure 2: US rockfish landings by state and area, 2004. Total landings 40,560mt (data from PacFIN 2005 and ADFG 2005)
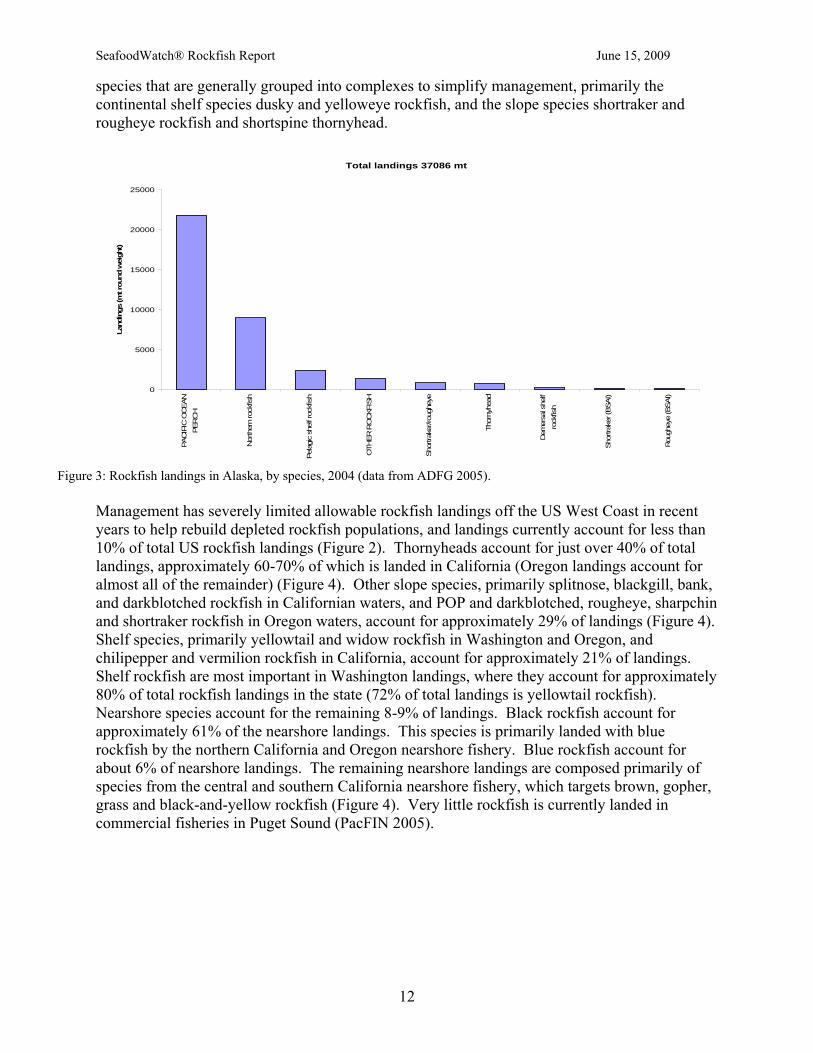
Pacific Ocean perch accounted for approximately 60% of the Alaskan landings (Figure 3). Although very little POP is currently landed off the West Coast (the stock is on a rebuilding plan), POP still makes up over half of the rockfish landed in US rockfish fisheries (POP also accounted for approximately 30% of rockfish landings off British Columbia in 2004). The other major component of Alaskan rockfish fisheries is the northern rockfish, which accounted for approximately 25% of landings in 2004 (Figure 3). Both POP and northern rockfish landings are roughly equal between the GOA and BSAI areas. The remainder of the catch comprised many
SeafoodWatch® Rockfish Report June 15, 2009
12
species that are generally grouped into complexes to simplify management, primarily the continental shelf species dusky and yelloweye rockfish, and the slope species shortraker and rougheye rockfish and shortspine thornyhead. Total landings 37086 mt
0
5000
10000
15000
20000
25000PA
CIF
IC O
CEA
NPER
CH
Nor
ther
n ro
ckfis
h
Pela
gic
shel
f roc
kfis
h
OTH
ER R
OC
KFIS
H
Sho
rtrak
er/ro
ughe
ye
Thor
nyhe
ad
Dem
ersa
l she
lfro
ckfis
h
Shor
trake
r (BS
AI)
Rou
ghey
e (B
SAI)
Land
ings
(mt r
ound
wei
ght)
Figure 3: Rockfish landings in Alaska, by species, 2004 (data from ADFG 2005).
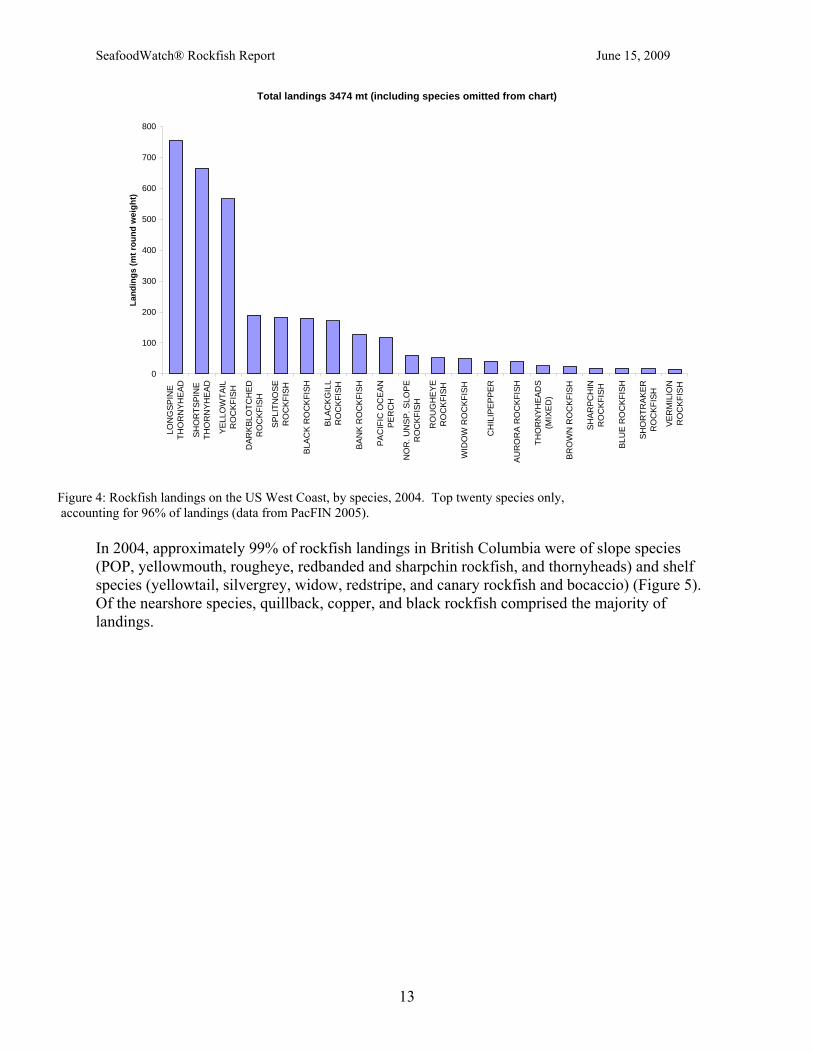
Management has severely limited allowable rockfish landings off the US West Coast in recent years to help rebuild depleted rockfish populations, and landings currently account for less than 10% of total US rockfish landings (Figure 2). Thornyheads account for just over 40% of total landings, approximately 60-70% of which is landed in California (Oregon landings account for almost all of the remainder) (Figure 4). Other slope species, primarily splitnose, blackgill, bank, and darkblotched rockfish in Californian waters, and POP and darkblotched, rougheye, sharpchin and shortraker rockfish in Oregon waters, account for approximately 29% of landings (Figure 4). Shelf species, primarily yellowtail and widow rockfish in Washington and Oregon, and chilipepper and vermilion rockfish in California, account for approximately 21% of landings. Shelf rockfish are most important in Washington landings, where they account for approximately 80% of total rockfish landings in the state (72% of total landings is yellowtail rockfish). Nearshore species account for the remaining 8-9% of landings. Black rockfish account for approximately 61% of the nearshore landings. This species is primarily landed with blue rockfish by the northern California and Oregon nearshore fishery. Blue rockfish account for about 6% of nearshore landings. The remaining nearshore landings are composed primarily of species from the central and southern California nearshore fishery, which targets brown, gopher, grass and black-and-yellow rockfish (Figure 4). Very little rockfish is currently landed in commercial fisheries in Puget Sound (PacFIN 2005).
SeafoodWatch® Rockfish Report June 15, 2009
13
Total landings 3474 mt (including species omitted from chart)
0
100
200
300
400
500
600
700
800
LON
GSP
INE
THO
RN
YHE
AD
SHO
RTS
PIN
ETH
OR
NYH
EAD
YELL
OW
TAIL
RO
CKF
ISH
DAR
KBL
OTC
HE
DR
OC
KFIS
H
SPL
ITN
OSE
RO
CK
FISH
BLA
CK
RO
CK
FISH
BLA
CK
GIL
LR
OC
KFI
SH
BAN
K R
OC
KFI
SH
PAC
IFIC
OC
EAN
PER
CH
NO
R. U
NSP
. SLO
PE
RO
CKF
ISH
RO
UG
HEY
ER
OC
KFI
SH
WID
OW
RO
CKF
ISH
CH
ILIP
EPP
ER
AU
RO
RA
RO
CKF
ISH
THO
RN
YHEA
DS
(MIX
ED
)
BR
OW
N R
OC
KFI
SH
SHA
RPC
HIN
RO
CK
FISH
BLU
E R
OC
KFIS
H
SHO
RTR
AKE
RR
OC
KFIS
H
VER
MIL
ION
RO
CKF
ISH
Land
ings
(mt r
ound
wei
ght)
Figure 4: Rockfish landings on the US West Coast, by species, 2004. Top twenty species only, accounting for 96% of landings (data from PacFIN 2005).
In 2004, approximately 99% of rockfish landings in British Columbia were of slope species (POP, yellowmouth, rougheye, redbanded and sharpchin rockfish, and thornyheads) and shelf species (yellowtail, silvergrey, widow, redstripe, and canary rockfish and bocaccio) (Figure 5). Of the nearshore species, quillback, copper, and black rockfish comprised the majority of landings.

SeafoodWatch® Rockfish Report June 15, 2009
14
Total landings 19527 mt (including species omitted from chart)
0
1000
2000
3000
4000
5000
6000
7000
Paci
fic o
cean
per
ch*
Yello
wta
il ro
ckfis
h*
Yello
wm
outh
rock
fish*
Silv
ergr
ay ro
ckfis
h*
Wid
ow ro
ckfis
h*
Red
strip
e ro
ckfis
h*
Can
ary
rock
fish*
Rou
ghey
e ro
ckfis
h*
Shor
tspi
neth
orny
head
*
Red
band
ed ro
ckfis
h
Shar
pchi
n ro
ckfis
h
Long
spin
eth
orny
head
*
Boca
ccio
Shor
trake
r roc
kfis
h*
Split
nose
rock
fish
Qui
llbac
k ro
ckfis
h*
Yello
wey
e ro
ckfis
h*
Dar
kblo
tche
d ro
ckfis
h
Gre
enst
riped
rock
fish
Cop
per r
ockf
ish*
Land
ings
mt (
NO
T R
OU
ND
WEI
GH
T)
Figure 5: Rockfish landings in British Columbia, by species, 2004, excluding those from the directed halibut fishery. The quantity of landings should not be compared with those from the US, as weights are not round weight equivalent. * Species that are managed with a single-species quota (see Management section) (data from DFO 2005).

SeafoodWatch® Rockfish Report June 15, 2009
15
Analysis of Seafood Watch® Sustainability Criteria for Wild-caught Species Criterion 1: Inherent Vulnerability to Fishing Pressure Guiding Principle: Sustainable wild-caught species have a low vulnerability to fishing pressure, and hence a low probability of being overfished, because of their inherent life history characteristics.
Rockfishes as a group are characterized by relatively slow growth, late age-at-maturity (relative to other marine fishes), and remarkable longevity. The oldest fish recorded to date was a 205-year-old rougheye rockfish (S. aleutianus) captured in May 2000 in southeastern Alaska. The fish was aged visually from a sagittal otolith transverse section (Munk 2001). More commonly, nearshore species reach a maximum of 30-50 years, and deeper-dwelling, more northerly-ranging species can reach upwards of 100 years of age or more (Cailliet et al. 2001) (Table 1). Age at 50% maturity varies among species but is typically 5-7 years, and may be as late as 20 years for deeper-dwelling, northerly-ranging species (Gunderson et al. 1980; Wyllie Echeverria 1987; Pearson and Hightower 1991). Many rockfish species exhibit sexual dimorphism, with females growing slower and reaching a larger maximum size than males (Lenarz and Wyllie Echeverria 1991). Maximum sizes range from only 18 cm (Puget Sound rockfish) to over 120 cm (shortraker rockfish) (Love et al. 2002). Rockfishes differ from many other teleosts (bony fishes) in that they exhibit internal fertilization and primitive viviparity, supplying nutrients to developing embryos (Boehlert and Yoklavich 1984; Wourms 1991). The gestation period is approximately one month until parturition (Boehlert and Yoklavich 1984), but the duration of parturition for a stock can last several months (Wyllie Echeverria 1987). Most females release a single large brood each year in the winter or early spring for southerly populations (south of Point Conception) and spring or summer for northerly populations (north of Point Conception) (O'Connell et al. 1987; Yoklavich et al. 1996). Some species, such as chilipepper rockfish, bocaccio, and cowcod are known to produce multiple broods that may buffer against extremely variable environmental conditions common along the Pacific Coast (Wyllie Echeverria 1987; Love et al. 1990). The number of eggs produced at 50% maturity are highly variable, but typically range from 2,000 to 500,000 eggs per year (Gunderson et al. 1980; Love et al. 1990; Haldorson and Love 1991) and can be as high as 2,000,000 eggs per year (cowcod) (Love et al. 1990). As with most fishes, fecundity increases dramatically with size, so older females tend to produce more offspring (Haldorson and Love 1991). Thornyheads of the genus Sebastolobus exhibit oviparity; egg masses are released in late winter to early spring, and fertilization is assumed to be external (Erickson and Pikitch 1993). After parturition, the larvae lead a pelagic existence for 2-7 months (depending on the species) and then begin to settle in shallower, nearshore substrates, a process known as recruitment. Thornyheads may remain pelagic for up to 13 months (Piner and Methot 2001). In fisheries assessments, much importance is placed on year class strength, which is thought to be directly related to recruitment. Evidence suggests that oceanic factors such as upwelling events, decadal temperature oscillations, and currents influence survival and settlement location of juvenile rockfish (Moser and Boehlert 1991; Yoklavich et al. 1996). The right combination of these factors to encourage larval survival may only occur every few years or more, so many species have successful recruitment only on relatively rare occasions. For example, large numbers of

SeafoodWatch® Rockfish Report June 15, 2009
16
bocaccio larvae survive to become juveniles only once every 20 years (Love et al. 2002). Indeed, adverse ocean conditions since the mid 1970s may have reduced recruitment success in some West Coast species, contributing to the severe declines seen in some species (see Status of Stocks section) (Ralston and Howard 1995). In contrast, some rockfish stocks off Alaska and British Columbia have benefited from above-average recruitment in recent years (Heifetz et al. 1999). Rockfish continue to reproduce as they get older and fecundity (the quantity of eggs produced by an individual) in rockfish increases with age, at least for some species. Thus, in an unfished population, older mature individuals may provide a disproportionate quantity of spawning output (Love et al. 2002). In widow rockfish, for example, 77% of total spawning output comes from age 10+ females (Ralston and Pearson 1997). Furthermore, recent research suggests that larvae from older black rockfish are more likely to survive to the juvenile stage (Berkeley et al. 2004a; 2004b), increasing the importance of older mature females to the population even further. It is likely that increased longevity, viviparity, and improved recruitment success of older females allows rockfishes to better survive relatively long periods of adverse environmental conditions. However, such biological characteristics also predispose rockfish to recruitment overfishing, which happens when too many immature fish are removed from the population. Rockfish also show several other behaviors that make them particularly susceptible to overfishing. Many live in specific habitat types, which often vary with the different stages of life, and many appear to be obligatory residents (Love et al. 2002). In general, many of the shallow-dwelling and benthic species (including olive, blue, gopher, black-and-yellow, copper, China, quillback, and yelloweye rockfish) that live on optimal habitat tend to stay within a fairly restricted geographic area (Love et al. 2002). As stated by Love et al. (2002): “Many of the deep-slope species probably exhibit little geographic movement throughout the northeast Pacific, and perhaps instead represent a mosaic of small, localized stocks.” Such a distribution makes rockfish vulnerable to localized depletion, where there is a reduction in population size over a relatively small area due to intensive fishing (DiCosimo et al. 2005). In cases where quotas are set for large management areas and most fishing occurs in small concentrated areas, the genetic, age, and size composition of the population can be changed for the worse. Studies indicate that Gulf of Alaska and Aleutian Islands POP, northern rockfish, and dusky rockfish exhibited some evidence of depletion during 1991-2004, and POP in the Buldir Reef area was found to be depleted in 2003 (DiCosimo et al. 2005; D. Hanselman, NMFS, pers. comm.). Copper and quillback rockfish are also depleted in both the northern and southern ends of Puget Sound (W. Palsson, pers. comm.). As the spatial structure of most rockfish remains unknown (DiCosimo et al. 2005), the possibility that other rockfish populations have been or are depleted locally is entirely plausible. Many rockfish also aggregate in multispecies complexes, making singling out a particular species for capture a difficult task for fishers. Management bodies group the majority of rockfish species together into assemblages or complexes based on what species are caught together. However, many of the species grouped and caught together have quite different life history traits, making some more vulnerable to fishing than others. In these cases, apparent stable or increasing catches for a biologically resilient target species may mask declines in a more vulnerable species (Musick et al. 2000; DiCosimo et al. 2005). Furthermore, bycatch is a particular concern in many Sebastes rockfishes for another reason, as their closed air bladder does not allow air to escape as they are hauled to the surface, causing air embolism and likely

SeafoodWatch® Rockfish Report June 15, 2009
17
death (Parker et al. 2000). Thornyhead rockfish are exceptions to this rule as they have no air bladders. In addition, the range of many rockfishes is relatively narrow. Of the 102 Sebastes rockfish known worldwide, 96 are limited to the North Pacific and the Gulf of California (Love et al. 2002). The majority are found in central and southern California waters (56-60 species), with the number of species found in the southern Gulf of Alaska and the Aleutian Islands and Bering Sea less than five (Figure 6). Species with limited ranges have less capacity to replace overfished stocks with fish from other areas.
Figure 6: Rockfish distribution in the northeast Pacific (Love et al. 2002).
Synthesis Seafood Watch® determines a species’ inherent vulnerability to fishing pressure using various biological parameters. These rankings are then refined with information on behaviors that might make the species particularly susceptible to fishing. Of the biological parameters, intrinsic rate of increase (‘r’) is generally not known for rockfish, but the Von Bertalanffy growth coefficient (‘k’), estimates of age at first maturity, maximum age, and fecundity exist for many species. Table 1 provides a summary of these parameters.

SeafoodWatch® Rockfish Report June 15, 2009
18
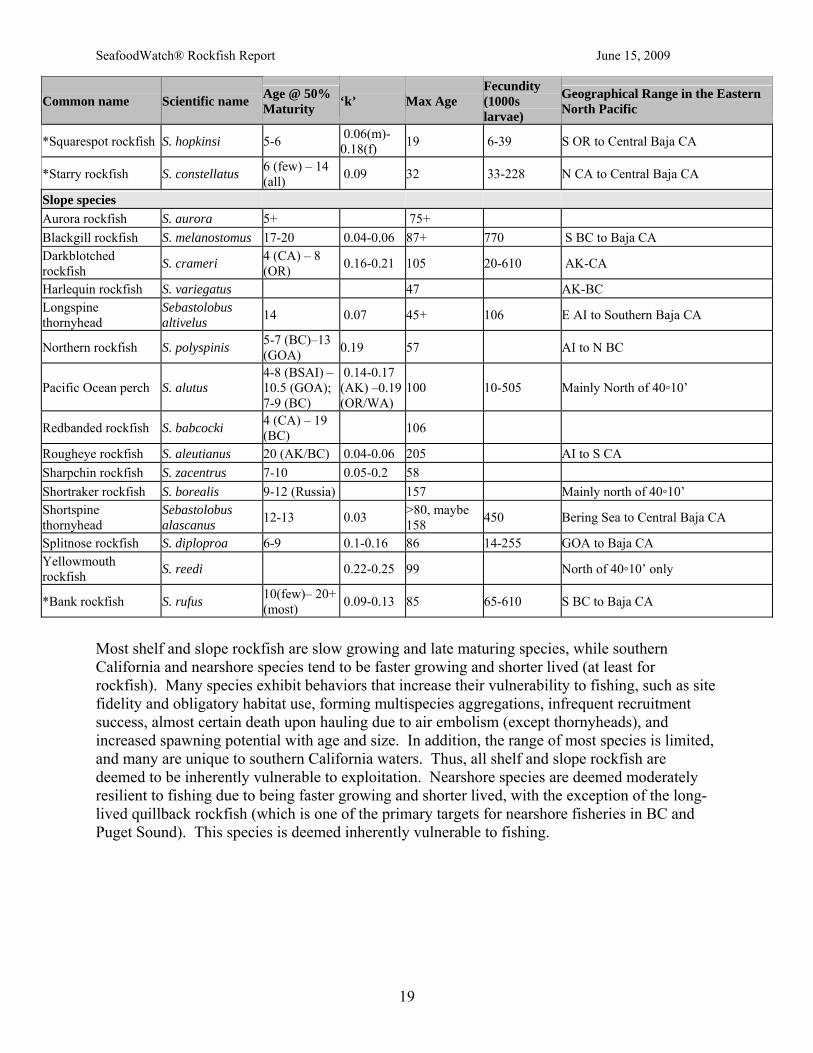
Table 1: Rockfish life history parameters, broken down by Pacific Fishery Management Council- defined assemblages. Not comprehensive. * Species occur south of 40º10’ N. Primary source: Love et al. 2002. Other sources: Eschmeyer et al. 1983; Cailliet et al. 2001; Munk 2001; Starr et al. 2002.
Common name Scientific name Age @ 50% Maturity ‘k’ Max Age
Fecundity (1000s larvae)
Geographical Range in the Eastern North Pacific
Nearshore species Black rockfish S. melanops 6-8 0.14-0.15 50 125-1200 AI to S CA Brown rockfish S. auriculatus 4-5 0.16 34 55-339 N GOA to Central Baja CA China rockfish S. nebulosus 4-5 79 N GOA to Southern CA Copper rockfish S. caurinus 4-6 0.1 55 16-640 N GOA to Central Baja CA Puget Sound rockfish S. emphaeus 2-3 0.54-0.7 22 3-58 GOA to N CA
Quillback rockfish S. maliger 7 (CA) – 11 (BC) 0.07-0.23 95 GOA to S CA
*Black and yellow rockfish S. chrysomelas 3-4 0.22-0.28 20-30 80-760 N CA to Central Baja CA
*Gopher rockfish S. carnatus 4 30 N CA to Central Baja CA *Grass rockfish S. rastrelliger 3-4 0.11 23 760 OR to Central Baja *Kelp rockfish S. atrovirens 3.5-7 25 10-275 N CA to Central Baja CA *Olive rockfish S. serranoides 5 0.17-0.26 30 30-490 S OR to Central Baja CA
*Calico rockfish S. dalli 3.5” (no age est.) 0.12 12+ 4-18 N CA to Central Baja CA
Shelf species
Bocaccio S. paucispinis 4-6 Unknown, possibly 50+ 20-2300 S AK to S CA
Canary rockfish S. pinniger 7-9 84 260-1900 W GOA to N Baja CA Chilipepper rockfish S. goodei 3-4 0.2-0.28 35 18-538 S BC to Baja CA Dusky rockfish (prev. light dusky) S. variabilis 11 (GOA) 0.07-0.14 76 (AK)-67
(BC) AK/BC
Greenstriped rockfish S. elongatus 6-7 0.1-0.12 54 344 W GOA to Central Baja CA Redstripe rockfish S. proriger 6-7 55 SE Bering Sea & AI to Southern Baja Rosethorn rockfish S. helvomaculatus 8 0.1-0.11 87 W GOA to Central Baja CA
Silvergrey rockfish S. brevispinis 14-18” (unknown age)
82 Mainly North of 40◦10’
Stripetail rockfish S. saxicola 2-9 0.06-0.19 38 15-230 E GOA to Central Baja CA Tiger rockfish S. nigrocinctus 116 N GOA to Southern CA Vermilion rockfish S. miniatus 5-6 60 2700 AK to Baja CA Widow rockfish S. entomelas 3-8 0.14-0.25 60 95-113 AK to Baja CA Yelloweye rockfish S. ruberrimus 15-20 0.04-0.05 118 AI to Northern Baja Yellowtail rockfish S. flavidus 6-10 0.17-0.19 64 50-2000 AI to S CA
*Cowcod S. levis 17” (no age est.) 0.06 55 180-1925 S OR to Baja CA
*Flag rockfish S. rubrivinctus 8 38 N CA to Northern Baja *Greenblotched rock. S. rosenblatti 10-12 0.05-0.06 50 30-655 N CA to Central Baja *Greenspotted rock. S. chlorostictus 6-9 33 759 WA to Central Baja CA *Rosy rockfish S. rosaceus 6-7 14 13-95 WA to Central Baja *Shortbelly rockfish S. jordani 2-3 0.18-0.25 32 50 *Speckled rockfish S. ovalis 4 0.05-0.06 37 61-160 N WA to Baja CA
SeafoodWatch® Rockfish Report June 15, 2009
19
Common name Scientific name Age @ 50% Maturity ‘k’ Max Age
Fecundity (1000s larvae)
Geographical Range in the Eastern North Pacific
*Squarespot rockfish S. hopkinsi 5-6 0.06(m)-0.18(f) 19 6-39 S OR to Central Baja CA
*Starry rockfish S. constellatus 6 (few) – 14 (all) 0.09 32 33-228 N CA to Central Baja CA
Slope species Aurora rockfish S. aurora 5+ 75+ Blackgill rockfish S. melanostomus 17-20 0.04-0.06 87+ 770 S BC to Baja CA Darkblotched rockfish S. crameri 4 (CA) – 8
(OR) 0.16-0.21 105 20-610 AK-CA
Harlequin rockfish S. variegatus 47 AK-BC Longspine thornyhead
Sebastolobus altivelus 14 0.07 45+ 106 E AI to Southern Baja CA
Northern rockfish S. polyspinis 5-7 (BC)–13 (GOA) 0.19 57 AI to N BC
Pacific Ocean perch S. alutus 4-8 (BSAI) – 10.5 (GOA); 7-9 (BC)
0.14-0.17 (AK) –0.19 (OR/WA)
100 10-505 Mainly North of 40◦10’
Redbanded rockfish S. babcocki 4 (CA) – 19 (BC) 106
Rougheye rockfish S. aleutianus 20 (AK/BC) 0.04-0.06 205 AI to S CA Sharpchin rockfish S. zacentrus 7-10 0.05-0.2 58 Shortraker rockfish S. borealis 9-12 (Russia) 157 Mainly north of 40◦10’ Shortspine thornyhead
Sebastolobus alascanus 12-13 0.03 >80, maybe
158 450 Bering Sea to Central Baja CA
Splitnose rockfish S. diploproa 6-9 0.1-0.16 86 14-255 GOA to Baja CA Yellowmouth rockfish S. reedi 0.22-0.25 99 North of 40◦10’ only
*Bank rockfish S. rufus 10(few)– 20+ (most) 0.09-0.13 85 65-610 S BC to Baja CA
Most shelf and slope rockfish are slow growing and late maturing species, while southern California and nearshore species tend to be faster growing and shorter lived (at least for rockfish). Many species exhibit behaviors that increase their vulnerability to fishing, such as site fidelity and obligatory habitat use, forming multispecies aggregations, infrequent recruitment success, almost certain death upon hauling due to air embolism (except thornyheads), and increased spawning potential with age and size. In addition, the range of most species is limited, and many are unique to southern California waters. Thus, all shelf and slope rockfish are deemed to be inherently vulnerable to exploitation. Nearshore species are deemed moderately resilient to fishing due to being faster growing and shorter lived, with the exception of the long-lived quillback rockfish (which is one of the primary targets for nearshore fisheries in BC and Puget Sound). This species is deemed inherently vulnerable to fishing.

SeafoodWatch® Rockfish Report June 15, 2009
20
Conservation Concern: Inherent Vulnerability
Nearshore species except quillback rockfish Moderate (Inherently Neutral)
All shelf and slope species
Quillback rockfish High (Inherently Vulnerable)
Criterion 2: Status of Wild Stocks Guiding Principle: Sustainable wild-caught species have stock structure and abundance sufficient to maintain or enhance long-term fishery productivity.
Alaska According to observer data, Alaskan waters are home to at least 36 species of rockfish, and three species of thornyhead (Fenty 2005). Composition varies by region, but biomass is dominated by Pacific Ocean perch (POP) and northern rockfish. Combined, these two species account for approximately three-quarters of total rockfish biomass in the Gulf of Alaska (GOA), and more than 90% in the less biodiverse (for rockfish species) Bering Sea and Aleutian Islands (BSAI) region (Figure 7). Enough information is available on these two species for them to be managed and assessed individually, whereas all others (with the exception of shortraker and rougheye rockfish, which, since 2004, are now also managed at the species level) are managed in groups or complexes of several (or more) species that share similar characteristics. Longspine and shortspine thornyhead are grouped together into the ‘thornyhead’ complex in the Gulf of Alaska, and remain in the ‘other’ rockfish complex in the Bering Sea and Aleutian Islands.

SeafoodWatch® Rockfish Report June 15, 2009
21
(a) (b)
60%
30%
2%
4% 4%
Pacific Ocean perchNorthern rockfishRougheyeShortrakerOther Slope rockfish
56%
21%
4%
3%
16%
Figure 7: Rockfish composition in the (a) Gulf of Alaska (based on 2004 Allowable Biological Catches), and (b) Bering Sea/Aleutian Islands (based on 2004 biomass) (DiCosimo 2005)
Pacific Ocean perch and northern rockfish Overfishing of Pacific Ocean perch in the 1960s led to sharp population declines, and in 1977 Catch-per-unit-effort (CPUE) dropped 90-95%. With the fishery becoming domestic-only after the passage of the Magnuson-Stevens Act (MSA), overfishing ceased and rebuilding efforts have allowed Pacific Ocean perch to rebound (Figure 8a). Northern rockfish shows a similar trend (Figure 8a). The stocks of both species are now above the management target for biomass (BMSY), and fishing mortality is less than the overfishing threshold (FMSY) (Figure 8b).

SeafoodWatch® Rockfish Report June 15, 2009
22
(a)
(b)
Figure 8: Status of main Alaskan rockfish stocks. (a) Biomass trends for rockfish stocks relative to their mean level, 1978-2004. Stock biomass was probably at or near its lowest point in the history of the fishery in 1978 (author’s note). (b) Relative spawning stock size compared to BMSY (~B35% for all rockfish species) versus relative 2004 catch levels compared to MSY (DiCosimo 2005).
However, even for the relatively well studied Pacific Ocean perch, there is still uncertainty about the life history of the species, unclear stock population structure in Alaskan waters, and little information on habitat requirements. Hence, there is considerable variability in estimates of population status each year (Hanselman et al. 2004; Spencer et al. 2004). There is evidence of age truncation in the GOA POP fishery (Figure 9). The average age and proportion of age 40+ POP in the stock has generally been in decline since at least the early 1980s, and older fish currently make up a smaller proportion of the population than would be expected if fishing mortality was at F40%. According to the National Marine Fisheries Service (NMFS), possible explanations include natural disequilibrium due to highly variable recruitment, high recent recruitment strength leading to higher relative proportions of younger fish, or residual effects of historical overfishing (Hanselman et al. 2005). Recent research on black rockfish suggests age truncation in some rockfish may have “a much greater impact on the

SeafoodWatch® Rockfish Report June 15, 2009
23
reproductive capacity of a population than simple reduction of biomass of mature females. Maintaining a significant proportion of older fish may be critical to long-term replenishment and stability in exploited fish populations” (Berkeley et al. 2004a). Berkeley et al. (2004b) conclude that, in black rockfish, “old-growth age structure, combined with a broad spatial distribution of spawning and recruitment, is at least as important as spawning biomass in maintaining long-term sustainable population levels.” Whether POP show a similar pattern is unknown, but if so, NMFS concludes that there should be a 3% decrease in estimated biomass for the GOA population, and a corresponding 15% reduction in optimal harvest rate (Hanselman et al. 2004). Due to binning all fish older than age 25, it is unknown whether there has been age truncation in BSAI POP (Spencer et al. 2004). There is also some evidence of localized depletion in some Alaskan rockfish stocks in some years. One study that examined large areas for depletion of GOA and Aleutian Islands (AI) POP, northern rockfish, and dusky rockfish, indicated that all three species exhibited some depletion during 1991-2004. Of the 249 area-year-species combinations analyzed, 43 showed signs of depletion. Overall, POP exhibited the most significant depletions in consistent areas (DiCosimo et al. 2005). However, these depletions did not carry over from year to year, perhaps due to replenishment by new fish, or simply that the fishery moved to a new aggregation the following year. POP may also have shown the most significant depletions because it had the most data available and because it is the most targeted of the commercial rockfish fisheries in Alaska (DiCosimo et al. 2005). Other studies suggested the directed AI POP fishery did not exhibit depletion during 2000-2004, and the AI northern rockfish caught in the Atka mackerel fishery also did not show signs of depletion (DiCosimo et al. 2005).
Figure 9: Changes in average age and proportion of 40+ aged fish for Gulf of Alaska Pacific Ocean perch for the NMFS survey and fishery ages (Hanselman et al. 2004).

SeafoodWatch® Rockfish Report June 15, 2009
24
Shortraker and rougheye rockfish Since 2004, shortraker and rougheye rockfish have been managed at the species level in both the GOA and BSAI (DiCosimo 2005). As yet, not enough information exists for most of these stocks to estimate reference biomass levels, and so managers do not know whether the stocks are overfished or not. The single exception is GOA rougheye, for which a full assessment with reference biomass levels was first conducted in 2005 (Shotwell et al. 2005). The estimated biomass of BSAI rougheye and shortraker is declining, while the biomass of GOA rougheye is relatively stable and GOA shortraker is stable or increasing (Figure 10; Figure 11). GOA rougheye is considered not overfished by managers (Shotwell et al. 2005). In addition, if the same pattern of overfishing of POP in the 1960s and 1970s occurred for these species, biomass would likely have already been low in the late 1970s.
(a) (b)
Figure 10: Biomass of BSAI rougheye (a) and shortraker (b) rockfish (Spencer and Reuter 2004; DiCosimo 2005).
(a) (b)
Figure 11: Estimated biomass of GOA rougheye (a) (Shotwell et al. 2005) and shortraker (b) rockfish (Clausen 2005).
Overfishing thresholds are set at the point estimate for F35% for GOA rougheye rockfish (Shotwell et al. 2005), and at the point estimate of natural mortality for BSAI rougheye and all shortraker rockfish (DiCosimo 2005). Fishing mortality in BSAI rougheye rockfish was above (sometimes considerably so) the threshold for most years between 1989 and 2001, but has fallen below it in the last three years (Figure 12). Overfishing has not occurred in the BSAI shortraker

SeafoodWatch® Rockfish Report June 15, 2009
25
rockfish fishery in the last 25 years (Figure 12). The fishing mortality of GOA rougheye rockfish has generally been below the overfishing threshold for the last 20 years, and remains so today (Figure 13). Thus, overfishing is not occurring on rougheye or shortraker rockfish in the GOA or BSAI (NMFS 2005).
Figure 12: Estimated fishing mortality of BSAI rougheye (thick solid line) and shortraker (dotted line) rockfish, including overfishing thresholds for rougheye=F35%=0.025 (thin solid line), and shortraker=natural mortality=0.03 (fine dotted line) (Spencer and Reuter 2004).
Figure 13: Estimated fishing mortality of GOA rougheye rockfish, including overfishing threshold=F35%=0.038 (thin line) (Shotwell et al. 2005).
Overall, fishery managers have successfully reduced levels of fishing mortality for rougheye and shortraker rockfish to levels that appear to be sustainable for the wide management regions of the BSAI and GOA. As part of that process, managers have also increased the accuracy of management measures as more data have become available for individual species. In the BSAI,
SeafoodWatch® Rockfish Report June 15, 2009
26
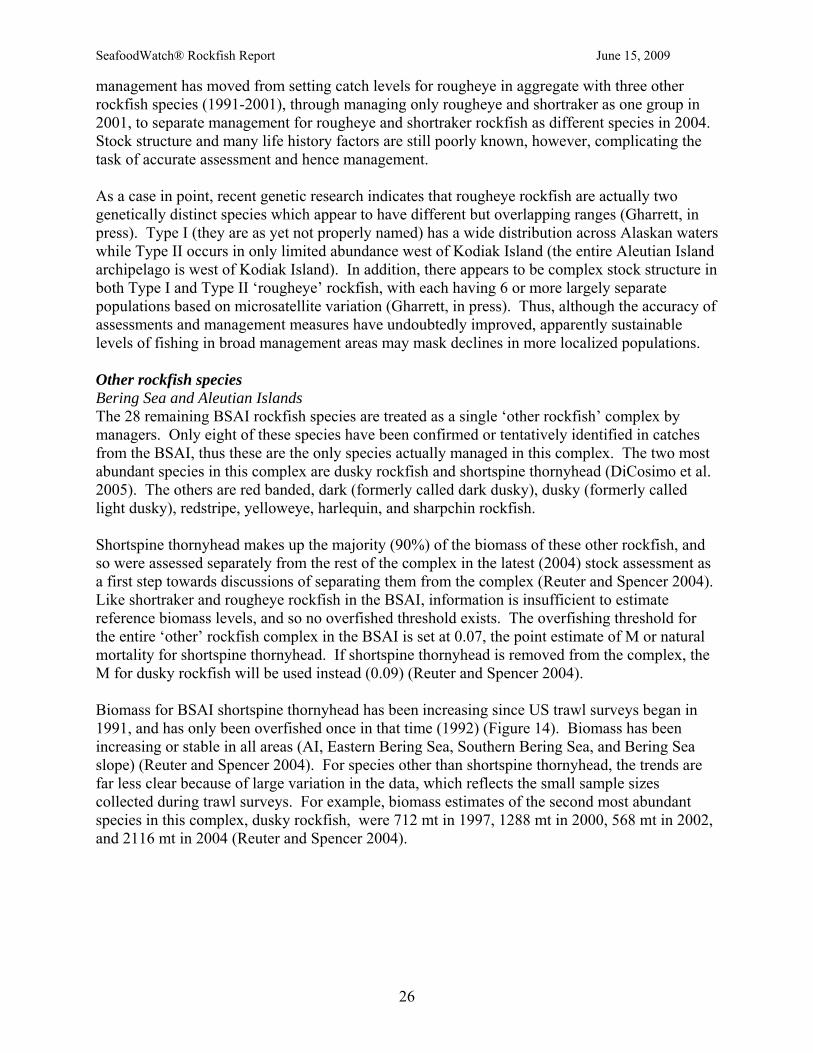
management has moved from setting catch levels for rougheye in aggregate with three other rockfish species (1991-2001), through managing only rougheye and shortraker as one group in 2001, to separate management for rougheye and shortraker rockfish as different species in 2004. Stock structure and many life history factors are still poorly known, however, complicating the task of accurate assessment and hence management. As a case in point, recent genetic research indicates that rougheye rockfish are actually two genetically distinct species which appear to have different but overlapping ranges (Gharrett, in press). Type I (they are as yet not properly named) has a wide distribution across Alaskan waters while Type II occurs in only limited abundance west of Kodiak Island (the entire Aleutian Island archipelago is west of Kodiak Island). In addition, there appears to be complex stock structure in both Type I and Type II ‘rougheye’ rockfish, with each having 6 or more largely separate populations based on microsatellite variation (Gharrett, in press). Thus, although the accuracy of assessments and management measures have undoubtedly improved, apparently sustainable levels of fishing in broad management areas may mask declines in more localized populations. Other rockfish species Bering Sea and Aleutian Islands The 28 remaining BSAI rockfish species are treated as a single ‘other rockfish’ complex by managers. Only eight of these species have been confirmed or tentatively identified in catches from the BSAI, thus these are the only species actually managed in this complex. The two most abundant species in this complex are dusky rockfish and shortspine thornyhead (DiCosimo et al. 2005). The others are red banded, dark (formerly called dark dusky), dusky (formerly called light dusky), redstripe, yelloweye, harlequin, and sharpchin rockfish. Shortspine thornyhead makes up the majority (90%) of the biomass of these other rockfish, and so were assessed separately from the rest of the complex in the latest (2004) stock assessment as a first step towards discussions of separating them from the complex (Reuter and Spencer 2004). Like shortraker and rougheye rockfish in the BSAI, information is insufficient to estimate reference biomass levels, and so no overfished threshold exists. The overfishing threshold for the entire ‘other’ rockfish complex in the BSAI is set at 0.07, the point estimate of M or natural mortality for shortspine thornyhead. If shortspine thornyhead is removed from the complex, the M for dusky rockfish will be used instead (0.09) (Reuter and Spencer 2004). Biomass for BSAI shortspine thornyhead has been increasing since US trawl surveys began in 1991, and has only been overfished once in that time (1992) (Figure 14). Biomass has been increasing or stable in all areas (AI, Eastern Bering Sea, Southern Bering Sea, and Bering Sea slope) (Reuter and Spencer 2004). For species other than shortspine thornyhead, the trends are far less clear because of large variation in the data, which reflects the small sample sizes collected during trawl surveys. For example, biomass estimates of the second most abundant species in this complex, dusky rockfish, were 712 mt in 1997, 1288 mt in 2000, 568 mt in 2002, and 2116 mt in 2004 (Reuter and Spencer 2004).
SeafoodWatch® Rockfish Report June 15, 2009
27
02,0004,0006,0008,000
10,00012,00014,00016,00018,000
1991
1992
1993
1994
1995
1996
1997
1998
1999
2000
2001
2002
2003
Bio
mas
s (m
t)
00.010.020.030.040.050.060.070.080.09
Fish
ing
mor
talit
y
Estimated BiomassFishing mortality
Figure 14: Estimated biomass and fishing mortality of BSAI shortspine thornyhead, 1991-2003. The overfishing threshold is included (dashed line, F=0.07) (Reuter and Spencer 2004).
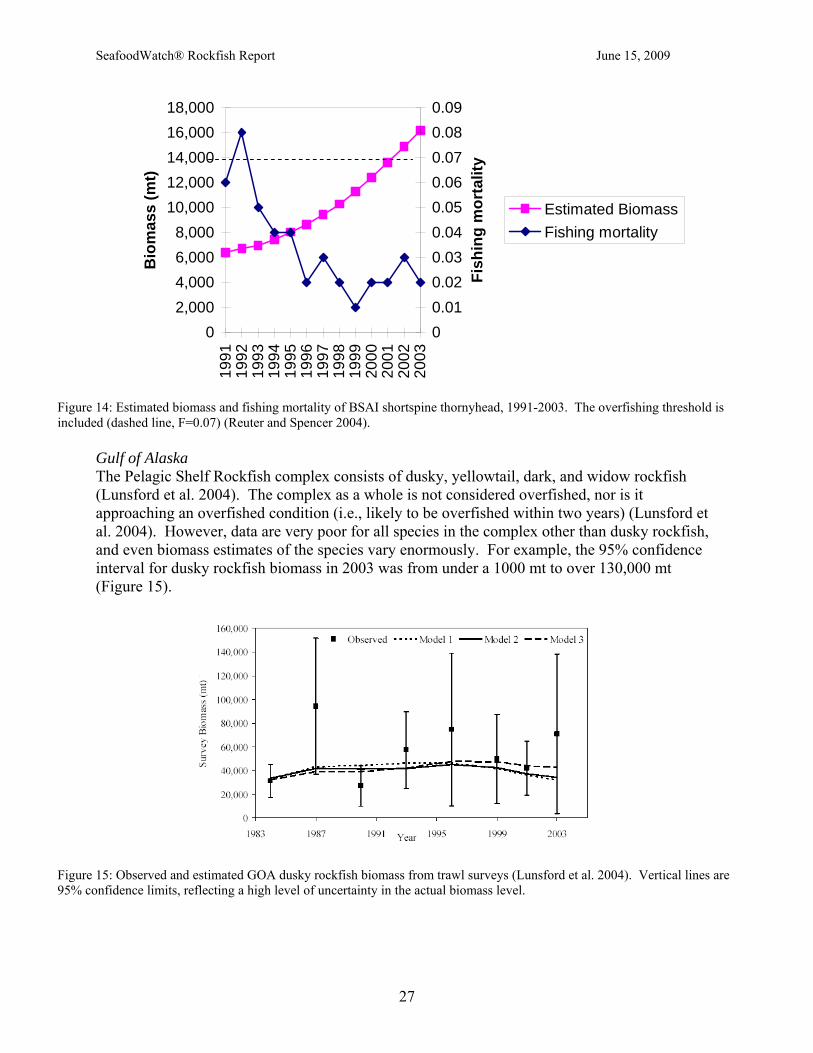
Gulf of Alaska The Pelagic Shelf Rockfish complex consists of dusky, yellowtail, dark, and widow rockfish (Lunsford et al. 2004). The complex as a whole is not considered overfished, nor is it approaching an overfished condition (i.e., likely to be overfished within two years) (Lunsford et al. 2004). However, data are very poor for all species in the complex other than dusky rockfish, and even biomass estimates of the species vary enormously. For example, the 95% confidence interval for dusky rockfish biomass in 2003 was from under a 1000 mt to over 130,000 mt (Figure 15).
Figure 15: Observed and estimated GOA dusky rockfish biomass from trawl surveys (Lunsford et al. 2004). Vertical lines are 95% confidence limits, reflecting a high level of uncertainty in the actual biomass level.

SeafoodWatch® Rockfish Report June 15, 2009
28
The Demersal Shelf Rockfish complex consists of seven species, all nearshore dwellers except yelloweye which is more of a shelf species. The overfishing determination for this complex is based on yelloweye rockfish, which has accounted for 90% of the catch over the last five years (O’Connell et al. 2003). Quillback rockfish accounted for 8% of the catch. Yelloweye is not experiencing overfishing (NMFS 2005), and CPUEs appear stable (Figure 16).
Figure 16: Commercial fishery catch-per-unit-effort trends for GOA Yelloweye rockfish in two GOA management areas (O’Connell et al. 2003).
Both species of thornyhead are managed as a single ‘Thornyheads’ complex, with the overfishing determination being based on shortspine thornyhead abundance. The biomass of shortspine thornyhead has declined slowly since 1970, and stabilized in the early/mid 1990s. Although there is not enough information to estimate reference biomass levels for the complex as a whole, female spawning biomass for shortspine thornyhead is above B35% (Figure 17). Fishing mortality is 31% of the overfishing threshold (FOFL) (Gaichas and Ianelli 2004), so overfishing is not occurring (NMFS 2005).
Figure 17: Female spawner biomass trajectory for GOA shortspine thornyhead (heavy line), including the management target (B35%) (lower thin line) and unfished biomass (upper thin line) (Gaichas and Ianelli 2003).
The Other Slope Rockfish complex consists of 17 species, nearly all of which are at the northern edge of their range (Harlequin rockfish are an exception, being a primarily Alaskan species) (Clausen et al. 2004). The group as a whole is not experiencing overfishing (NMFS 2005); however, data are too limited to define an overfished threshold, and lead to wide variation in biomass estimates. For example, biomass estimates of the five species that comprise the

SeafoodWatch® Rockfish Report June 15, 2009
29
majority of the biomass in this complex are given in Table 2. The lower and higher ends of biomass estimates vary by an order of magnitude or more in some cases.
Table 2: GOA ‘Other Slope Rockfish’ estimates with lower and upper 95% confidence limits, which represent the lower and higher end of population estimates (Clausen et al. 2003)
Species Year Biomass estimate (mt) Lower 95% CI
Higher 95% CI
Sharpchin 1984 6,612 1,693 11,531 1987 80,439 13,859 147,018 2001 34,169 0 85,559 2003 7,064 0 14,338 Redstripe 1984 5,365 922 9,806 1987 26,519 0 53,639 2001 17,564 0 42,415 2003 8,025 2,109 13,942 Harlequin 1984 2,625 972 4,277 1987 72,405 28,945 115,865 2001 14,480 0 34,638 2003 3,545 313 6,776 Silvergrey 1984 4,817 1,336 8,298 1987 5,426 858 9,994 2001 24,032 13,742 34,321 2003 51,916 0 130,981 Redbanded 1984 1,430 531 2,330 1987 1,822 600 3,044 2001 6,409 0 15,063 2003 3,441 1,907 4,974
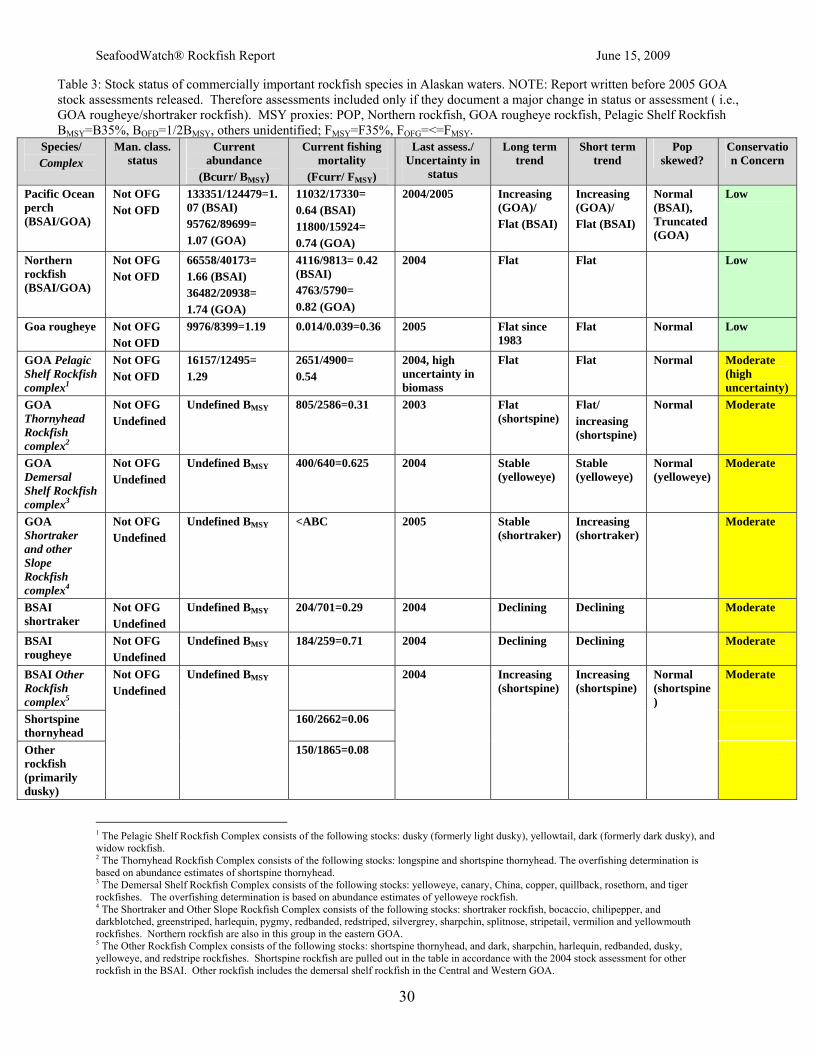
Alaska stock status synthesis Full stock assessments are conducted biannually for Alaskan rockfish stocks in both the GOA and BSAI (all other groundfish are assessed annually). Pacific Ocean perch and northern rockfish comprise the majority of landings of rockfish in both areas. Long and short term biomass in these stocks is increasing (GOA POP) or flat (BSAI POP, all northern rockfish), and above the BMSY proxy of B35%. Overfishing is not occurring in these stocks. There is evidence of localized depletion in POP in some areas, and age truncation in the GOA POP fishery. Managers are well aware of these problems, however, and research continues to examine possible mitigation measures. BMSY for nearly all other species or species complexes is undefined due to a lack of reliable data. Point biomass estimates for the single exception, the GOA Pelagic Shelf Rockfish complex, vary by at least one order of magnitude even for dusky rockfish, the main component of the catch. In addition, while the level of fishing mortality is thought to be below MSY levels for these species and species complexes, concerns remain over the lack of information on fishing mortality of the minor species components of the complexes. Seafood Watch® (SFW) therefore deems the stock status of POP and northern rockfish as a low conservation concern, and that of all other rockfish a moderate conservation concern (Table 3).
SeafoodWatch® Rockfish Report June 15, 2009
30
Table 3: Stock status of commercially important rockfish species in Alaskan waters. NOTE: Report written before 2005 GOA stock assessments released. Therefore assessments included only if they document a major change in status or assessment ( i.e., GOA rougheye/shortraker rockfish). MSY proxies: POP, Northern rockfish, GOA rougheye rockfish, Pelagic Shelf Rockfish BMSY=B35%, BOFD=1/2BMSY, others unidentified; FMSY=F35%, FOFG=<=FMSY.
Species/ Complex
Man. class. status
Current abundance
(Bcurr/ BMSY)
Current fishing mortality
(Fcurr/ FMSY)
Last assess./ Uncertainty in
status
Long term trend
Short term trend
Pop skewed?
Conservation Concern
Pacific Ocean perch (BSAI/GOA)
Not OFG Not OFD
133351/124479=1.07 (BSAI) 95762/89699= 1.07 (GOA)
11032/17330= 0.64 (BSAI) 11800/15924= 0.74 (GOA)
2004/2005 Increasing (GOA)/ Flat (BSAI)
Increasing (GOA)/ Flat (BSAI)
Normal (BSAI), Truncated (GOA)
Low
Northern rockfish (BSAI/GOA)
Not OFG Not OFD
66558/40173= 1.66 (BSAI) 36482/20938= 1.74 (GOA)
4116/9813= 0.42 (BSAI) 4763/5790= 0.82 (GOA)
2004 Flat Flat Low
Goa rougheye Not OFG Not OFD
9976/8399=1.19 0.014/0.039=0.36 2005 Flat since 1983
Flat Normal Low
GOA Pelagic Shelf Rockfish complex1
Not OFG Not OFD
16157/12495= 1.29
2651/4900= 0.54
2004, high uncertainty in biomass
Flat Flat Normal Moderate (high uncertainty)
GOA Thornyhead Rockfish complex2
Not OFG Undefined
Undefined BMSY 805/2586=0.31 2003 Flat (shortspine)
Flat/ increasing (shortspine)
Normal Moderate
GOA Demersal Shelf Rockfish complex3
Not OFG Undefined
Undefined BMSY 400/640=0.625 2004 Stable (yelloweye)
Stable (yelloweye)
Normal (yelloweye)
Moderate
GOA Shortraker and other Slope Rockfish complex4
Not OFG Undefined
Undefined BMSY <ABC 2005 Stable (shortraker)
Increasing (shortraker)
Moderate
BSAI shortraker
Not OFG Undefined
Undefined BMSY 204/701=0.29 2004 Declining Declining Moderate
BSAI rougheye
Not OFG Undefined
Undefined BMSY 184/259=0.71 2004 Declining Declining Moderate
BSAI Other Rockfish complex5
Not OFG Undefined
Undefined BMSY 2004 Increasing (shortspine)
Increasing (shortspine)
Normal (shortspine)
Moderate
Shortspine thornyhead
160/2662=0.06
Other rockfish (primarily dusky)
150/1865=0.08
1 The Pelagic Shelf Rockfish Complex consists of the following stocks: dusky (formerly light dusky), yellowtail, dark (formerly dark dusky), and widow rockfish. 2 The Thornyhead Rockfish Complex consists of the following stocks: longspine and shortspine thornyhead. The overfishing determination is based on abundance estimates of shortspine thornyhead. 3 The Demersal Shelf Rockfish Complex consists of the following stocks: yelloweye, canary, China, copper, quillback, rosethorn, and tiger rockfishes. The overfishing determination is based on abundance estimates of yelloweye rockfish. 4 The Shortraker and Other Slope Rockfish Complex consists of the following stocks: shortraker rockfish, bocaccio, chilipepper, and darkblotched, greenstriped, harlequin, pygmy, redbanded, redstriped, silvergrey, sharpchin, splitnose, stripetail, vermilion and yellowmouth rockfishes. Northern rockfish are also in this group in the eastern GOA. 5 The Other Rockfish Complex consists of the following stocks: shortspine thornyhead, and dark, sharpchin, harlequin, redbanded, dusky, yelloweye, and redstripe rockfishes. Shortspine rockfish are pulled out in the table in accordance with the 2004 stock assessment for other rockfish in the BSAI. Other rockfish includes the demersal shelf rockfish in the Central and Western GOA.

SeafoodWatch® Rockfish Report June 15, 2009
31
British Columbia Inshore (yelloweye, quillback, copper, China, black, and tiger rockfish), shelf (canary, silvergrey, yellowtail, and widow rockfish), and slope (POP and yellowmouth, redstripe, shortraker, and rougheye rockfish) make up the bulk of the rockfish landings in British Columbia (BC). These species were all most recently assessed in 1999-2000 and are managed under quota. The notable exception is redbanded rockfish, a species caught in large numbers in the bottom longline fishery, but which has had neither a separate stock assessment nor a quota established (Yamanaka and Lacko 2001). According to the Department of Fisheries and Oceans, Canada (DFO), assessment and management of the hook-and-line fishery has focused on the “inshore species” (primarily nearshore species that are caught by hook-and-line gear in subsistence, commercial, and recreational fisheries) (DFO 2000). Even for these species, however, data limits assessments to documenting declines rather than providing estimates for future harvest levels that will correct the system (Yamanaka and Lacko 2001). Yelloweye and quillback rockfish are the targeted inshore species, so research and assessment is focused on these species (Yamanaka and Lacko 2001). In their most recent assessment (2000, with a 2001 update), the DFO note that stock assessment of these species is currently hindered by a lack of a reliable stock index, estimate of abundance, and a time series of catch at age information (DFO 2000). The lack of available stock structure and total biomass coastwide currently prevents assessors from recommending sustainable species-specific catch quotas for each of the 5 management regions in BC waters (Yamanaka and Lacko 2001). However, logbook data indicate a decline in CPUE in quillback rockfish over the last decade, and that the fishing fleet is progressively moving farther offshore, the latter suggesting declining stocks in near-port areas (DFO 2000; Yamanaka and Lacko 2001). Overall, the DFO concludes that inshore rockfish coastwide are fully utilized, while those in the Strait of Georgia are overutilized (DFO 2000). Pacific Ocean perch were last assessed in 1999 using fishery dependent data and sporadic research trawl data from different years and areas. Large biomass declines are believed to have occurred in several areas from the mid 1960s to the late 1970s. In the current main fishing areas of Goose Island, Mitchell and Moresby Gullies in Queen Charlotte’s Sound, for example, biomass is thought to have declined by two thirds of the 1965 biomass by 1977. Since then, biomass is thought to have increased, largely because of strong year classes in the late 1970s and early 1980s (particularly 1984 for the main fishing areas mentioned above), as recruitment has been low since that time. The DFO concluded that biomass is likely to continue to decline slowly until recruitment increases (DFO 1999b). An update to that assessment, completed in 2001, suggested that the current (at that time) distribution of quotas among the different management areas appropriately reflected the available biomass levels (Schnute et al. 2001). Yellowtail rockfish are treated as two stocks in BC: the southern (Boundary) stock that ranges from central Vancouver Island south to northern Washington waters; and the northern (Coastal) stock that extends north from central Vancouver Island to the Alaska border. The conclusion of the most recent assessment (1999) was that biomass of both stocks appears to be decreasing largely because of poor recruitment in the 1990s. The southern stock was thought to be at about 25% of unfished biomass, while the northern stock is probably lower than 50% and maybe as low as 25% of unfished biomass (DFO 1999c).

SeafoodWatch® Rockfish Report June 15, 2009
32
Canary, silvergrey, and widow rockfish were last assessed in 1999, using only fishery dependent data (quantity and age/size composition of landings). Actual status is thus unknown, but the stock(s) is considered close to maximum exploitation (DFO 1999d-f). An update on the status of silvergrey rockfish completed in 2002 suggested biomass levels in some areas may have been higher than suggested in the 1999 assessment, but data uncertainty precluded the assessors from concluding that stock status was any different (Stanley and Olsen 2002). Shortspine and longspine thornyhead were assessed in 1999, using only fisheries dependent data. Stock status was therefore uncertain, but declining CPUE indicated the harvest may be too high (DFO 1999g). Longspine thornyhead was assessed again in 2004, using fisheries-independent survey data from 2001, 2002, and 2003 to verify the commercial fisheries data (Schnute et al. 2004). Relative biomass in all four areas for which data was available/collected has declined since the inception of the fishery. The magnitude in declines depends on the model used and the area examined, but vary from not significant to 50% from 2001-2003 in the worst case scenario (Schnute et al. 2004). Redstripe and yellowmouth rockfish were last assessed in 1999. Stock status is unknown, but recent (since the early 1980s) recruitment has been low so the stock is likely to continue to decline slowly until recruitment increases (Redstripe and yellowmouth assessment). The most recent assessments for rougheye and shortraker rockfish were in 1999. Quantitative assessments are not carried out for these species, so stock status is unknown (DFO 1999h-i). In 2002, bocaccio was designated threatened by Canada’s Committee on the Status of Endangered Wildlife in Canada (COSEWIC). Abundance of the species in BC waters is poorly known, as it is not of commercial importance and is typically only caught as bycatch. However, fisheries dependent data suggest declines in abundance of 95% off the west coast of Vancouver Island in the last two decades, and over 90% in the last 10 years (COSEWIC 2002). No trend was detected for the last 5 years. Numbers may also be declining in the Strait of Georgia, but quantitative data are lacking. The trend in abundance of northern and central coasts is unknown (COSEWIC 2002). The declines off the west coast of Vancouver Island would ordinarily result in an “Endangered” rating, but the lack of data from the rest of the coast resulted in COSEWIC upgrading the listing to “Threatened.” A more recent assessment by the DFO suggests the declines are not as great as documented in the COSEWIC assessment (DFO 2004). An earlier (1975-1979) time series of research survey data suggested that biomass at that time was considerably lower than in the early 1980s. Current biomass is thought to be somewhere between 25% and 100% of the biomass in the late 1970s, depending on the data used. Declines also appear to have ceased or at least slowed down since the mid 1990s. The worst case scenario indicates a continued decline in biomass, with levels in 2000 being about half those in 1990 (DFO 2004). It is important to note, however, that no data suggest increases in biomass since the 1990s. The DFO notes that catches of bocaccio have declined considerably in US waters to the south of BC, which may have a positive effect on BC stocks. They conclude that observer levels (100% in the trawl fishery, and 10-20% in the hook-and-line fisheries) are high enough to be certain of the bocaccio catch, and that recent catches of bocaccio are not high enough to put the species in jeopardy (DFO 2004). Several species are candidate species for detailed status assessment under COSEWIC. Silvergrey and yellowtail rockfish and shortspine thornyhead are considered a ‘high priority’ for review by COSEWIC, meaning that they are “suspected to be at high risk of extirpation from

SeafoodWatch® Rockfish Report June 15, 2009
33
Canada.”6 Darkblotched, widow, yellowmouth, rougheye, quillback, canary, and yelloweye rockfish, and longspine thornyhead are all already under review.
British Columbia stock status synthesis BC rockfish assessments suffer significantly from lack of reliable data. Even for the inshore species that management has focused on, data limits assessments to documenting declines rather than providing estimates for future harvest levels that will correct the system. With few exceptions, the most recent assessments for rockfish were conducted in 1999, and data limitations typically precluded conclusive statements on stock status. For the inshore (nearshore) species, assessments were most recently conducted in 2000, at which time the ‘inside’ stocks were considered overexploited, and ‘outside’ stocks fully exploited. Lack of data, the inherent vulnerability of most rockfish species to fishing pressure, and severe declines in some species off the US West Coast has moved COSEWIC to list many shelf and slope species as a high priority for robust assessment (and to start reviewing some). Bocaccio is the only species for which such an assessment has been completed by COSEWIC (2004), and the stocks are thought to be stable with fishing mortality low enough to allow them to begin recovering. Seafood Watch® thus deems all stocks to be of high conservation concern except for the ‘outside’ nearshore rockfishes, and the shelf/slope species POP and shortraker rockfish, which are deemed of moderate concern (Table 4).
6 http://www.cosewic.gc.ca/eng/sct3/sct3_1_e.cfm#4

SeafoodWatch® Rockfish Report June 15, 2009
34
Table 4: Stock status of commercially important rockfish species caught in British Columbia fisheries. *Includes rockfish caught in halibut fishery. *Inside waters refer to the Johnstone Strait, Juan de Fuca Strait, and Strait of Georgia. Not enough information was available to analyze the current age, size, or sex distribution of stocks.
Species Man. class. status
Current abundance
(Bcurr/ BMSY)
Current fishing
mortality (Fcurr/ FMSY)
Last assess./ Uncertainty
in status
Long term trend
Short term trend
Other status (COSEWIC)
Conservation Concern
Inshore/nearshore (quillback, copper, China, tiger, black, and yelloweye rockfish)
Inside* Overutilized 2000 Decline in quillback over last decade; managed under combined TAC
High
Outside* Fully utilized coastwide 2000
Quillback Under review (COSEWIC) Moderate
Offshore, quota Pacific Ocean perch Unknown 1999 Slow decline Moderate
Yellowtail
Unknown (no relative abundance indices)
25-50% of B0
Unknown (no relative abundance indices)
1999 High High priority (COSEWIC) High
Yellowmouth
Unknown (May be at an average level of abundance)
1999 (POP was target species)
Unknown or decline
Under review (COSEWIC)
High
Silvergrey Unknown (probably close to max exploitation - no relative abundance indices) 1999/2002 Unknown High priority
(COSEWIC) High
Shortspine thornyhead Unknown (No quantitative surveys conducted) 1999 CPUE decline High priority
(COSEWIC) High
Longspine thornyhead Unknown 2004 CPUE decline
Under review (COSEWIC)
High
Canary Unknown (probably close to max exploitation - no relative abundance indices) 1999 Unknown High
Widow Unknown (probably close to max exploitation - no relative abundance indices) 1999 Unknown High priority
(COSEWIC) High
Shortraker, rougheye No biomass forecasts 1999 Unknown
Rougheye Under review (COSEWIC)
High
Darkblotched No assessment High priority (COSEWIC) High
Offshore, non quota (non-quota species primarily caught by trawl include aurora, chilipepper, darkblotched, dusky, greenstriped, harlequin, longjaw, redbanded, rosethorn, sharpchin, and splitnose rockfish)
Redstripe Unknown (may be at an average level of abundance)
1999 (POP was target species for assessment)
Unknown or decline High priority (COSEWIC) High
Bocaccio Stable 2004 Low effort (non-target) 2004 Decline
Stable or decline has slowed down since 1990s
Threatened (COSEWIC), Critical (IUCN)
High

SeafoodWatch® Rockfish Report June 15, 2009
35
West Coast Of the 62 species of rockfish managed by the PFMC, stock assessments have been conducted for the 17 most commercially and recreationally important species (15 in PFMC 2004, and gopher and Californian scorpionfish in 2005). The status of the remaining stocks, including some of commercial importance (as judged by 2004 landings data), such as splitnose and bank rockfish, is unknown (NMFS 2005). Of those that have been assessed, several shelf and slope species have been at very low biomass since the 1980s (Figure 18), although technically ‘overfished’ only after the implementation of the Sustainable Fisheries Act (SFA) of 1996 obligated managers to set biomass-based targets and thresholds (Ralston 2002).
Figure 18: Relative abundance of West Coast rockfish (J. Hastie, pers. comm.). The target biomass for West Coast groundfish stocks (40%) is both the BMSY proxy and the rebuilding target. Stocks are considered overfished when they decline to below 25% of the unfished biomass.
Assessments conducted after the SFA was implemented estimated that the stock for darkblotched rockfish was at 14-31% of unfished biomass (Rogers et al. 2000 – FMPp.28), widow rockfish was at 23.6% (Williams et al. 2000; Punt and McCall 2002), Pacific Ocean perch was at 13% (Ianelli and Zimmerman 1998), cowcod was at 7% (Butler et al. 1999), yelloweye rockfish was at 7% in northern California and 13% in Oregon (Wallace 2002), canary rockfish was at 6.6% (Methot and Piner 2002), and the southern stock of bocaccio was at 2.1% (no assessment of the northern stock was conducted at that time) (McCall et al. 1999). All of these species were deemed overfished by the PFMC and consequently put on rebuilding plans as required under the SFA. Given their often extreme longevity and highly variable recruitment success, several are expected to take a half century or more to reach the rebuilding target (Table 5).

SeafoodWatch® Rockfish Report June 15, 2009
36
Table 5: Specified rebuilding plan parameters for rockfish (and lingcod) (PFMC 2004). B0 is unfished biomass; BMSY is biomass at MSY (B40%); Tmin, Tmax, and Ttarget are the earliest, latest, and target years, respectively, that the stock will reach the target biomass with PMAX probability; and the Harvest Control Rule (HCR) is the constant fishing mortality rate that will allow rebuilding to the target biomass by the target date.
Species
Year stock
declared overfished
Year rebuilding
plan Adopted
B0 BMSY TMIN TMAX PMAX TTarget HCR
Darkblotched rockfish 2000 2003 29,044
mt 11,618 mt 2014 2047 80% 2030 F=0.027
POP 1999 2003
60,212 units of spawning output
24,084 units of spawning output
2012 2042 70% 2027 F=0.0082
Canary rockfish 2000 2003 31,550
mt 12,620 mt 2057 2076 60% 2074 F=0.022
Bocaccio 1999 2004 13,387 B eggs in 2003
5,355 B eggs 2018 2032 70% 2023 F=0.0498
Cowcod 2000 2004 3,367 mt 1,350 mt 2062 2099 60% 2090 F=0.009 Widow rockfish 2001 2004 43,580 M
eggs 17,432 M eggs 2026 2042 60% 2038 F=0.0093
Yelloweye rockfish 2002 2004 3,875 mt 1,550 mt 2027 2071 80% 2058 F=0.0153
Several measures have been implemented as part of a wider regulatory framework to reduce bycatch of these overfished species, such as year-round and temporal area closures, gear restrictions and regulations, and very restricted exploitation rates (PFMC 2004). Perhaps as a result of such measures (see Management section), most of these depleted species are showing signs of beginning to recover (Figure 19). For example, 2005 assessments indicate that the spawning biomass of bocaccio and darkblotched rockfish has roughly doubled since 2000. Others (POP, cowcod, and canary and yelloweye rockfish) have also increased in spawning biomass, albeit to a much lesser extent (Figure 19). The spawning biomass of widow rockfish continued to decline until 2003, and then increased slightly in 2004 (biomass of age 3+ widow rockfish has been increasing since 2000) (Figure 21). While these are undoubtedly positive trends, biomass is still at very low levels for most of these species. The depleted species outlined above are all shelf or slope inhabitants. Shelf and slope species make up the vast majority of rockfish landed by commercial fisheries, and are almost entirely (in terms of quantity) landed by trawls. Off the West Coast of the US they are all managed by the PFMC through the Groundfish Fishery Management Plan (FMP) (PFMC 2004). This analysis will examine the stock status of these species in more depth, as well as the stock status of nearshore species.

SeafoodWatch® Rockfish Report June 15, 2009
37
Figure 19: Percentage change in relative abundance (measured as spawning biomass) of depleted West Coast rockfish since 2000 (Hastie, NMFS, pers. comm.). NOTE: At a glance, these positive trends are a little misleading; biomass is still at very low levels for these species, and B40% is not likely to be reached for another 20-90 years or more, depending on species (Table 5).
Continental shelf and slope species Pacific Ocean perch (POP) POP are found almost exclusively off Washington and Oregon on the West Coast, though their range extends north through BC waters into the Gulf of Alaska (GOA) and the Bering Sea/Aleutian Islands (BSAI) where the majority of US landings originate. Overfishing occurred on this stock for virtually all years between 1956 and 1999, with fishing mortality only falling below the threshold in 2000. Fishing mortality is currently well below the overfishing threshold (F2007/FMSY = 0.91) (Figure 20) (Hamel 2007); however, after so many years of being overfished, the stock declined to below BMSY in the late 1960s, and below the overfished threshold in the early 1980s (Figure 20). The stock stabilized in the mid 1990s and has begun recovering. It is now above the overfished threshold of 9,459 mt (SPB2007=10,168 mt) (Hamel 2007). POP stock biomass is estimated at 26,544 mt, 32.3% of unfished biomass, meaning that stock biomass relative to unfished biomass has more than doubled since 2002 (13%) (Figure 20) (Hamel 2007).

SeafoodWatch® Rockfish Report June 15, 2009
38
Figure 20: Estimated spawning biomass and exploitation rate for West Coast Pacific Ocean perch, including SPBMSY (14,793 mt), and overfished (9,459 mt) and overfishing (0.0388) thresholds (dotted lines) (Hamel 2007).
Widow rockfish Widow rockfish are assumed to be single stock for the purposes of management (He et al. 2005). The 2000 and 2003 assessments concluded that widow rockfish was overfished (Williams et al. 2000; Punt and McCall 2002; He et al. 2003), while the most recent assessment includes updated information indicating that the stock has probably not been overfished at any time, and is not today (2003) (Figure 21) (He et al. 2005). However, considerable uncertainty exists, and the possibility that the stock has been overfished (albeit just barely) since the mid 1990s cannot be ruled out (Figure 21). In this worst case scenario, the stock may have improved somewhat in 2003, with biomass increasing enough to bring the stock out of an overfished condition. In all scenarios, the stock is no longer overfished (Figure 21), but remains below B40% (well below in all but the best case scenario). However, due to the uncertainty of the assessments, the PFMC still manages the stock as if it is overfished, so it is still on a rebuilding plan (Steve Ralston, NMFS, pers. comm.). In the most likely scenario age 3+ biomass is thought to have increased

SeafoodWatch® Rockfish Report June 15, 2009
39
since 2000, while spawning biomass is still declining slowly or has stabilized (Figure 21). Landings have been below the allowable biological catch (ABC) for at least the last 10 years, and fishing mortality is currently well below the overfishing threshold (Figure 21) (He et al. 2005).
Figure 21: Spawning output of West Coast widow rockfish (measured as percentage of unfished spawning biomass) including SPBMSY (19,871 millions of eggs) and overfished threshold (12,420 millions of eggs), age 3+ and spawning biomass, and fishing mortality by four fisheries, including overfishing threshold (F=0.1154). Thresholds are marked as dashed lines (He et al. 2005).
Bocaccio The southern stock of bocaccio has been assessed seven times, while the northern stock has not been assessed at any time. The first assessment of the southern stock of bocaccio (1990) concluded that fishing effort was too high, and, despite increasingly restrictive regulations, the 1996 assessment indicated the stock was in severe decline (Ralston et al. 1996). The 1999 assessment concluded the stock was at 2.1% of its unfished spawning biomass and 5.1% of spawning biomass at MSY (McCall et al. 1999). The condition of the stock was so grave that a petition was filed in 1998 to list it as a threatened species under the federal Endangered Species Act (ESA). Although it was not given threatened status by the US federal government, it was designated as “threatened” by the Committee on the Status of Endangered Wildlife in Canada (COSEWIC) in November 2002 (DFO 2004) (although it is still pending public consultation for listing under Canada’s Species at Risk Act) and is currently listed as “critically endangered” by the World Conservation Union (IUCN 2002). Assessments since 1999 suggest the southern bocaccio stock is improving, with spawning biomass increasing from 7.4% of unfished biomass in 2003 (McCall 2003) to 10.7% in 2005 (McCall 2005). The 2004 fishing mortality of 0.0103 is well below the overfishing threshold of

SeafoodWatch® Rockfish Report June 15, 2009
40
0.0632 (Figure 22) (McCall 2005). Landings (including discards) have been below the ABC for six of the last ten years (1995-2004), including the last two years (2003-2004) (McCall 2005).
Figure 22: Estimated spawning biomass (millions of eggs) and exploitation rate of the southern stock of West Coast bocaccio, including BMSY (5,361 mt), overfished (3,350 mt) and overfishing (0.0632) thresholds (dashed lines) (McCall 2005).
Canary rockfish US West Coast canary rockfish are assessed as a single stock from southern California to the US-BC border. The most recent assessment indicates that spawning biomass was at its lowest point in 2000, but has been increasing since that time. The 2007 spawning stock biomass (SSB) has been estimated at 10,544 mt, 32.4% of unfished biomass (Figure 23) (Stewart 2007). Therefore the stock is no longer overfished (Figure 23). Overfishing has not occurred since 1999, and total catch (including estimated discards) was less than the ABC and the more conservative Optimum Yield (OY) in 2004, though above OY in 2000-2003 (Methot and Stewart 2005).
Figure 23: Time series of of percentage of unfished spawning stock biomass (depletion leve)l as estimated in the base case model (round points) with approximate asymptotic 95% confidence interval (2006-2007 only, dashed

SeafoodWatch® Rockfish Report June 15, 2009
41
lines) and alternate states of nature (light lines) (Stewart 2007).. Cowcod The cowcod stock is presently assumed to be a Southern California Bight population, as the species is rare in northern California and Oregon (Piner et al. 2005). The first assessment of the stock (1999) concluded that spawning biomass had declined by 93% from unfished levels (Butler et al. 1999). The latest stock assessment indicates the stock has improved, to 14-21% of unfished spawning biomass (Figure 24) (Piner et al. 2005). Although the stock assessment is subject to considerable uncertainty, even the best case scenario suggests the stock is overfished. The stock has been managed as a no retention fishery since 2001, and recent catches have been less than 1 mt. The stock is therefore not experiencing overfishing (although significant unreported mortality is possible) (Piner et al. 2005).
Figure 24: Estimated spawning biomass and exploitation rate of West Coast cowcod, including SPBMSY (1,218 mt), overfished (761 mt) and overfishing (0.033) thresholds (dashed lines) (Piner et al. 2005).
Darkblotched rockfish West Coast darkblotched rockfish are considered a single stock, stretching from California to Washington (Rogers 2005). The stock was assessed in 2000 and determined to be at 14% to 31% of unfished biomass (the wide range was mainly due to imprecise estimates of catches in the early years of the fishery). As the lower estimate in this range was below the B40% threshold, the stock was declared overfished in 2000. The most recent estimate indicates that the stock has been below the management target since 1984 and below the overfished threshold since 1989 (Rogers 2005). Since 2001, fishing mortality has been below the overfishing threshold, and the spawning biomass has begun to recover (Figure 25) (Rogers 2005). It is now at about 16% of unfished biomass, so the stock is still considered overfished (Rogers 2005).

SeafoodWatch® Rockfish Report June 15, 2009
42
Figure 25: Estimated spawning biomass (measured as a percentage of unfished spawning biomass) of West Coast cowcod, including SPBMSY (10,660 tens of millions of eggs), overfished (6,662 tens of millions of eggs) and overfishing (0.038) thresholds (Rogers 2000).
Yelloweye rockfish Yelloweye rockfish on the West Coast are treated as a single coastwide stock from the Mexican border to the Canadian border. The first stock assessment concluded 2001 stock biomass was about 7% of unexploited biomass off northern California and 13% of unexploited biomass off Oregon (Wallace 2002). As a result of this assessment, yelloweye rockfish was declared overfished in 2002 and is now managed separately from other species. The latest assessment (2005) concluded that the stock has been below the management target since 1990 and overfished since 1995 (Figure 26) (Wallace, Tsou and Jagielo 2005). The stock appears to have stabilized at about 20% of unfished spawning biomass, and may even be slowly increasing (Figure 26). Managers have prohibited commercial retention of yelloweye rockfish except for a 300 lb trip limit in the trawl fishery, and thus landings have been below the 26 mt OY since 2002. However, the quantity of discards, and therefore total fishing mortality, is largely unknown, complicating rebuilding projections (Wallace, Tsou and Jagielo 2005).

SeafoodWatch® Rockfish Report June 15, 2009
43
Figure 26: Estimated spawning biomass of West Coast yelloweye rockfish, including SPBMSY (998 mt) and overfished (952 mt) (dashed line) (Wallace, Tsou and Jagielo 2005).
Shortspine and longspine thornyhead Up until the 1980s shortspine thornyhead comprised the majority of the thornyhead catch off the West Coast, after which the market for smaller (i.e., longspine) thornyhead expanded. Shortspine thornyhead currently make up about 30-50% of the thornyhead catch (Figure 27). Prior to the early 1990s, thornyheads were managed as part of a deepwater complex that included sablefish and Dover sole. They were removed from that complex in 1991, and have since been managed with species specific ABCs and catch limits (Hamel 2005).
Figure 27: Ratio of shortspine thornyhead landings to combined shortspine and longspine landings (Hamel 2005).
Assessments for shortspine thornyhead were carried out throughout the 1990s, and the most recent assessment was conducted in 2005 (Hamel 2005). Genetic studies indicate little evidence of stock structure, so assessments are for the entire stock. The stock was being overfished from 1984-1994, but regulations have severely restricted catch since 1995. The 2005 assessment indicates that overfishing is not occurring (Figure 28) (Hamel 2005). The stock is not thought to

SeafoodWatch® Rockfish Report June 15, 2009
44
have been overfished at any point in its history, and remains that way today (Figure 28). Landings have been below the ABC since 1999, but may have been slightly above it in 2003 (Hamel 2005). There is also no evidence of any change in the size composition of the stock (Hamel 2005).
Figure 28: Estimated spawning biomass and exploitation rate of West Coast shortspine thornyhead relative to BMSY (SPB=52, 258 mt) and FMSY (F=0.0238) thresholds (dashed lines) (Hamel 2005).
Longspine thornyhead off the West Coast are also considered to be a single stock (Fay 2005). Several assessments were conducted in the 1990s, and the latest (currently in draft format) was in 2005 (Fay 2005). Although current biomass is fairly uncertain (as seen in the wide variation in the 95% confidence intervals in Figure 29a), even the worst case scenario is above BMSY (Figure 29). The mean estimate indicates that biomass is currently at about 71% of unfished biomass (64% and 74% for the worst and best case scenarios, respectively) (Fey 2005). The stock is also considered only lightly exploited, with fishing mortality well below FMSY (Fey 2005). Thus, the stock is considered neither overfished nor experiencing overfishing. However, there is some evidence that the size of the fish caught has declined since the 1980s (Figure 30).
Figure 29: Estimated spawning biomass and exploitation rate of West Coast longspine thornyhead, including best and worst case scenarios for biomass (dashed lines) and BMSY threshold (dotted line) (Fey 2005).
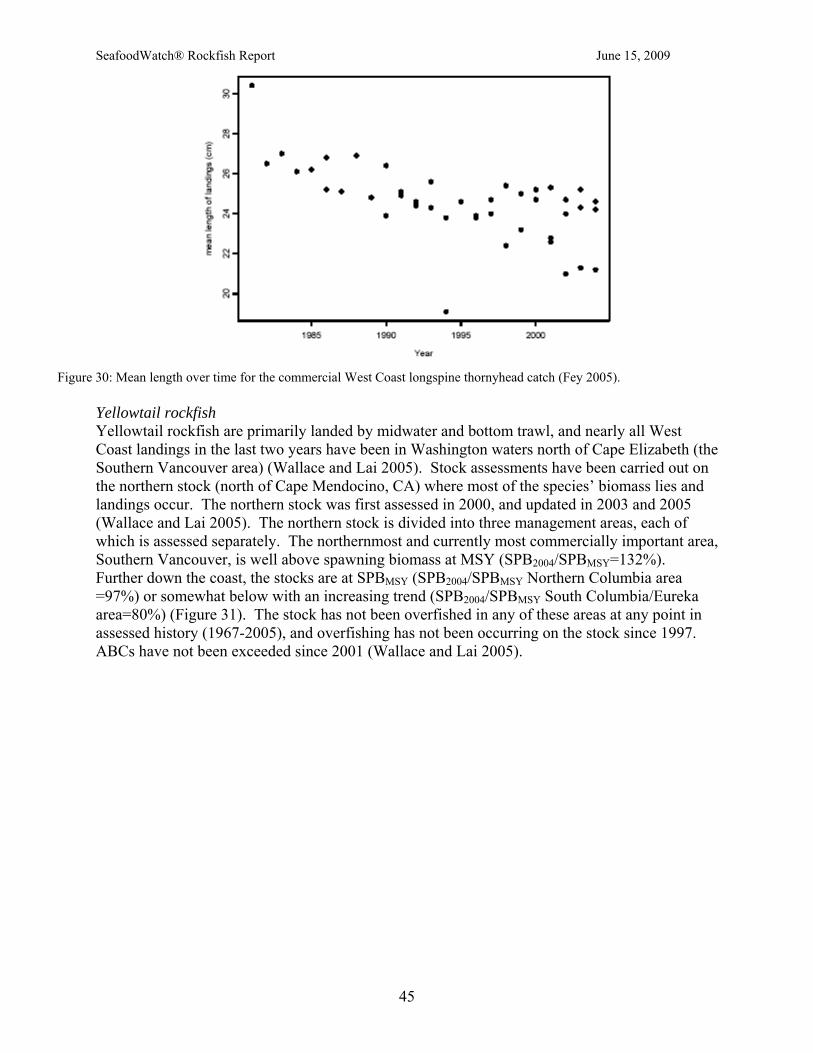
SeafoodWatch® Rockfish Report June 15, 2009
45
Figure 30: Mean length over time for the commercial West Coast longspine thornyhead catch (Fey 2005).
Yellowtail rockfish Yellowtail rockfish are primarily landed by midwater and bottom trawl, and nearly all West Coast landings in the last two years have been in Washington waters north of Cape Elizabeth (the Southern Vancouver area) (Wallace and Lai 2005). Stock assessments have been carried out on the northern stock (north of Cape Mendocino, CA) where most of the species’ biomass lies and landings occur. The northern stock was first assessed in 2000, and updated in 2003 and 2005 (Wallace and Lai 2005). The northern stock is divided into three management areas, each of which is assessed separately. The northernmost and currently most commercially important area, Southern Vancouver, is well above spawning biomass at MSY (SPB2004/SPBMSY=132%). Further down the coast, the stocks are at SPBMSY (SPB2004/SPBMSY Northern Columbia area =97%) or somewhat below with an increasing trend (SPB2004/SPBMSY South Columbia/Eureka area=80%) (Figure 31). The stock has not been overfished in any of these areas at any point in assessed history (1967-2005), and overfishing has not been occurring on the stock since 1997. ABCs have not been exceeded since 2001 (Wallace and Lai 2005).

SeafoodWatch® Rockfish Report June 15, 2009
46
Southern Vancouver area (Washington coast) SPBMSY=6678mt SPB2004/ SPBMSY=132%
North Columbia area SPBMSY=6084mt SPB2004/ SPBMSY=97%
Eureka/South Columbia area SPBMSY=2746mt SPB2004/ SPBMSY=80%
Figure 31: Estimated spawning biomass of West Coast yellowtail rockfish by management area, northernmost and most commercially important area first (Wallace and Lai 2005). Based on three different catch series.
Blackgill rockfish Blackgill rockfish are managed and assessed as a single stock, with the majority of biomass in Californian waters south of Eureka/Cape Mendocino. Over 90% of catches are in this area (Helser 2005). They are managed as part of the Sebastes complex, without species-specific ABCs. The latest stock assessment (2005) indicates that the stock has not been overfished at any point, and remains so today. Biomass declined considerably in the late 1980s, but appears to have stabilized above BMSY in the mid 1990s, at roughly 50% of unfished biomass. However, as with many other rockfish, the lack of information on biological parameters critical to accurate stock assessment leads to a wide range in current biomass estimates. The lowest end of this range suggests that biomass may be below BMSY, but still above the overfished threshold (Figure 32). The exploitation rate has been fairly low for at least the last decade, and remains considerably lower than the overfishing threshold (Figure 32). Thus, the stock is not experiencing overfishing, and is probably not overfished. There is some evidence that trawl catches have shifted towards smaller fish, however, though no evidence exists of a change in size composition of fish taken by the set-net and hook-and-line fisheries (Helser 2005).

SeafoodWatch® Rockfish Report June 15, 2009
47
0
0.5
1
1.5
2
2.5
3
3.5
1995
1996
1997
1998
1999
2000
2001
2002
2003
2004
Expl
oita
tion
rate
(% o
f SPB
0)
Exploitation Rate
OverfishingThreshold
Figure 32: Estimated spawning biomass and exploitation rate of West Coast blackgill rockfish, including 95% confidence intervals (dashed lines), BMSY, and overfished and overfishing thresholds (Helser 2005).
Other shelf/slope species Other shelf and slope rockfish species that have been assessed to date are bank (2000), vermilion (2005), and chilipepper rockfish. Bank rockfish are a slope-dwelling species found from southern California to Washington, and are most abundant only as far north as Oregon. The 2000 assessment focused on the central/northern California region, and concluded that while a reliable estimate of current biomass was impossible given the available data, the population was most likely declining. However, catch data indicted that the females being caught were mature, and the authors concluded the declines may not have been as much as in other rockfish species (Piner et al. 2000). The 2005 assessment of vermilion rockfish assessed two Californian stocks (from which most of the catch is taken), separated at Point Conception. The assessment concluded that the southern stock is at 30-88% of unfished biomass, and the northern stock is at 41-89% of unfished biomass. Although highly uncertain, only the lower estimate of the southern stock is below B40%, and biomass is increasing rapidly due to a strong year class in 1999. The stock may have been experiencing overfishing in the early 1990s but currently is not (McCall 2005). Chilipepper rockfish are primarily a central/southern California species found on deep, rocky reefs in 50-400 m waters. The most recent assessment, conducted in 1998, indicated a biomass of about 35,000 mt or half that of the unexploited level. That healthy status was due to a very strong 1984 year class, but more recent (late 1990s) recruitment events have been lower and the stock was slowly but steadily declining at that time. In response, ABCs were set at relatively low levels (4,100 mt), and TACs were later set considerably lower again (2,000 mt) due to concerns over bocaccio bycatch. Fisheries were not even catching the lower quota in the late 1990s. Thus, the stock is probably not currently overfished, nor experiencing overfishing. However, no assessment has been conducted for the last 7 or 8 years, and observations in 1998 indicated a declining trend (Ralston and Oda 2001). Nearshore species Nearshore rockfish are more commonly landed by hook-and-line gear such as bottom longlines, handlines, and jigs, are faster growing and have shorter longevities. They are also found in shallower, inshore waters and so are managed at least in part by state agencies. Although six species of inshore rockfish have a coastwide range from California to Alaska (black, blue, brown, China, copper, and quillback rockfish), diversity is considerably greater in

SeafoodWatch® Rockfish Report June 15, 2009
48
central/southern California inshore waters (south of Eureka, CA). While these waters harbor 13 Sebastes species, management usually includes the California scorpionfish (Scorpaena gutatta) in the group, bringing the total number of rockfish species managed to 14. The most commercially important of these species, black rockfish, was assessed in 2003 (Ralston and Dick 2003), while gopher rockfish and California scorpionfish were all assessed early this year (2005). Assessments have also been carried out by the Washington Department of Fish and Wildlife (WDFW) for several of the 27 species of rockfish inhabiting Puget Sound (including shelf species). Black rockfish Black rockfish is a nearshore species managed as two separate stocks off the West Coast. The latest assessments were completed in 2003 for the southern stock (Cape Falcon, OR south to northern California), and in 1999 for the northern stock (Cape Falcon, OR north to the Washington/BC border). Most landings in the southern stock are by recreational fishermen and commercial fishermen using hook-and-line gear (Ralston and Dick 2003). The latest assessment indicates that the biomass of the stock was below the management target and approaching an overfished condition in the mid-late 1980s, was stable for the next decade, and rebounded in the late 1990s due to several large recruitment events. Biomass is now roughly 49% of unfished biomass, considerably above BMSY (Figure 33) (Ralston and Dick 2003). The overfishing threshold for the entire southern stock is an exploitation rate that removes more than 7.7% of unfished biomass. None of the major fisheries for the southern stock have exceeded this rate since the 1990s (Figure 33). The stock is therefore neither overfished, nor is overfishing occurring. There is evidence that size distribution in the largest fisheries (the CA and OR recreational fisheries) has become narrower, though the main commercial fisheries do not show the same trend (Ralston and Dick 2003). Estimated 1999 stock biomass of black rockfish in the northern stock was 9,500 mt to 10,100 mt depending on tag-reporting rate. Spawning biomass in 1998 was 178% to 201% of the equilibrium spawning biomass associated with an F45% exploitation rate. Projected biomass was expected to decline over the next five years, but estimated spawning biomass in the year 2001 was still projected to be 130% to 175% of the target biomass. Under the most pessimistic scenario, catch exceeded the estimated average yield over the next three years by about 10-20%. Thus the black rockfish stock in Washington can be characterized as “declining in abundance, but healthy, i.e. displaying abundance levels in excess of those assumed to promote sustainable production” (Wallace et al. 1999).

SeafoodWatch® Rockfish Report June 15, 2009
49
Figure 33: Estimated spawning biomass and exploitation rate of the southern West Coast black rockfish stock, including BMSY and overfished (minimum stock size threshold) and overfishing thresholds (Ralston and Dick 2003). The chart of exploitation rate is for 6 separate black rockfish fisheries. % utilization is the catch divided by the fishery specific biomass. The overfishing threshold for the entire southern stock is roughly 7.7% of unfished biomass (thick solid line).
Other nearshore species The 2005 assessment of gopher rockfish focused on the stock north of Point Conception (Key et al. 2005), where recreational fishers account for the majority (<60-70% since 2000) of landings. Although the stock showed signs of depletion in the late 1970s and early 1980s, it has since recovered, with current spawning biomass roughly equal to when the stock was unfished. Uncertainty in the stock is high, but even in the worst case scenario the stock biomass is roughly equal to that at MSY. Recent landings have been between 20% and 60% of the calculated ABC (Key et al. 2005). California scorpionfish (Scorpaena gutatta) or sculpin are a relative of rockfish and are managed under the Sebastes complex by the PFMC. The species was being overfished in the 1970s but has now rebounded to approximately 150% of the management target B40%. More than 95% of landings are by recreational fishers, and recent landings have not been above the ABC (Maunder et al. 2005). Puget Sound Comprehensive stock assessments for rockfish and other groundfish in Puget Sound have been carried out primarily using data from the commercial and recreational fisheries. Assessments conducted in the late 1990s indicated that the majority of groundfish stocks in Puget Sound were in poor condition. These data led to the filing of a petition to list 18 species of groundfish, including three species of rockfish (copper, quillback, and brown), under the ESA (Wright 1999). Although listing was eventually deemed unnecessary by NMFS (50 CFR Parts 223 and 224; Federal Register, April 3, 2001), the most commonly caught species have shown considerable declines, leading to fishery closures and population rebuilding plans (Palsson 2001). Rockfish are now permitted only as bycatch in the commercial (since 1994) and recreational fisheries, and Tribal fisheries are also minimal (W. Palsson, pers. comm.). According to PacFIN data, less than 5 mt of rockfish have been landed annually in Puget Sound commercial fisheries since 1999 (PacFIN 2005).

SeafoodWatch® Rockfish Report June 15, 2009
50
The most recent assessments were divided into the northern and southern regions of Puget Sound based upon fishery patterns, genetic analysis, and differences in demographic factors. The two most commonly-caught species, copper and quillback rockfish (which combined accounted for 70-90% of the recreational catch from 1996 to 2002), have undergone long-term declines in abundance and size resulting in 78-85% decline in the spawning potential of the vulnerable portion of the populations in both the north and the south (Palsson pers. comm.). Both these species are considered depleted, based on a threshold of 25% SPR (spawning biomass per recruit) or lowest trend values. Data for many minor species not typically harvested are insufficient for assessment, but these minor species have become rarer in catches or surveys. Black rockfish, for example, has accounted for a larger share of the recreational catch in recent years (roughly 20% in 2001 and 2002), but is considered by the WDFW to have an unknown stock status. Populations of species that are not typically landed, such as brown rockfish in the South Sound, and the shelf/slope species redstripe, greenstriped, and splitnose rockfish and shortspine thornyhead, are deemed by the WDFW to be above 50% SPR or have stable, increasing trends (Palsson pers. comm.). U.S. West Coast stock status synthesis Heavy fishing from the 1960s to the 1990s all along the Pacific Coast has depleted many rockfish populations, some severely so. Seven West Coast stocks were declared overfished after the passage of the Sustainable Fisheries Act (SFA) in 1996, some of which were at 10% or less of unfished biomass (bocaccio, cowcod, canary rockfish, and the northern California stock of yelloweye rockfish). If the new biomass-based targets required by the SFA had been implemented two decades earlier, three stocks (bocaccio, cowcod, and canary rockfish) would have dropped below the BMSY proxy in the mid 1970s, and been declared overfished in the early 1980s. POP and darkblotched rockfish would have been declared overfished in the late 1980s, and yelloweye rockfish in 1995 (Figure 18). Overfishing of these species had probably been occurring for at least 20 years before managers were legally obligated to define and prevent overfishing in 1996. Since the SFA was passed, all seven species have been put on rebuilding plans, and all have shown signs of beginning to recover. This positive trend is best viewed with some caution, however, as the biomass of many of these species is still at extremely low levels and is not expected to reach a healthy level for several decades in some cases. The status of these stocks is thus still deemed a high conservation concern by Seafood Watch®. Several other rockfish stocks appear in better condition. In particular, shortspine and longspine thornyhead, yellowtail rockfish (South Vancouver), and black rockfish (northern CA/southern OR) stocks are currently above the BMSY proxy with increasing or flat short term trends and no overfishing occurring. Seafood Watch® deems the status of these stocks a low conservation concern. All others are of moderate concern due to a complete lack of assessment and therefore unknown status (most species), a lack of recent assessment combined with declining trends (chilipepper, bank rockfish), or a close to maximum exploitation rate, sometimes combined with high uncertainty or declining trends (blackgill, vermilion, and gopher rockfish) (Table 6).

SeafoodWatch® Rockfish Report June 15, 2009
51
Table 6: Stock status of commercially important rockfish species on the West Coast. MSY thresholds: BMSY=B40%, BOFD=B25%; FMSY=F50%=FOFD. *The overfished threshold in the current abundance column is 62.5% of B40% (i.e., 25/40%).
Species/ Complex
Man. class. status
Current abundance (Bcurr/ BMSY: OFD threshold =62.5%)
Current fishing
mortality (Fcurr/ FMSY)
Last assess./ Uncertainty
in status
Long term trend
Short term trend
Pop skewed?
Conservation Concern
Shortspine thornyhead
Not OFG Not OFD
150+% <1 2005 Decline Flat No Low
Longspine thornyhead
Not OFG Not OFD
178% <1 2005 Decline Flat Mixed Low
Pacific Ocean perch
Not OFG Not OFD (rebuild.)
10168/14793= 68.7%
<1 2007 Decline Increase Moderate
Widow Not OFG OFD7
15444/19871= 78% millions of eggs)
<1 2005,
considerable uncertainty
Decline Flat/increase (SPB) No Moderate
Sebastes Complex8 - Shelf/slope species
Bank Not OFG Not OFD
Unknown Unknown 2000 Decline Moderate
Blackgill Not OFG Not OFD
Mean estimate 125%, but low estimate <BMSY
<1 2005 Decline Flat/
increase Mixed Moderate
Bocaccio Not OFG OFD
1430/5361= 27% (billions of eggs)
<1 2005 (southern) Decline Flat/decline High
Canary Not OFG Not OFD
10,544 /12211= 86.3%
<1 2007 Decline Increase No Moderate
Chilipepper Not OFG Not OFD
50% of B0 <1 1998 Slowly but steadily declining Moderate
Cowcod
Not OFG (South) OFD (South)
542/1218=45% <1 2005 Decline Flat/
increase Unk. High
Darkblotch. Not OFG OFD
4447/10660= 42% (tens of millions of eggs)
<1 2005 Decline Increase Unk. High
Vermilion Unknown
30-88% B0 (S.CA) 41-89% B0 (N.CA)
<1 2005 Increase since 1989
Increase since 1989 Yes Moderate
Yelloweye Not OFG OFD
Roughly 50% <1 2005 Decline Flat/slight increase Unk. High
Yellowtail Not OFG Not OFD
132% (S. Vancouver), 97% (N. Columbia), 80% (Eureka)
<1 2005
Stable (S. Van and N. Col),
decline (Eureka)
Stable (S. Van and N. Col),
increase (Eureka)
Low
Sebastes Complex - Nearshore species
Black Not OFD Not OFG
125% <1 2003 Decline Increase Mixed Low
Gopher Unknown (South) 100% (North) 20-60% of
ABC 2005 Increase Decline Moderate
Sebastes Complex Others
Unknown, no assessments Moderate
7 Widow rockfish is managed as though it is overfished because of considerable uncertainty and because early assessments suggest the stock was overfished. The most recent assessment suggests the stock has never been overfished, and age 3+ biomass is increasing. 8 The Sebastes complex includes all rockfish managed by the PFMC (including yellowtail) except POP, shortbelly and widow rockfish, and thornyheads.

SeafoodWatch® Rockfish Report June 15, 2009
52
Overall stock status synthesis Of the at least 60 species of rockfish found off the Pacific Coast of the US and Canada, less than a third have been assessed. These species are typically the most commercially or recreationally important species or those deemed to be a conservation concern by managers. The stock status of the majority of rockfish species is therefore unknown and even the stock status of most of those that have been assessed is quite uncertain due to a paucity of basic life history data, stock structure information, and reliable estimates of fishing mortality. Table 3, Table 4, and Table 6 each provide a summary of the status of specific rockfish populations from Alaska, BC, and the US West Coast, respectively. However, most of these species are managed and assessed as part of complexes of several or more species. These complexes are based partly on similarity in life history characteristics, but also on species that are typically caught together. Thus, when analyzing the status of rockfish stocks generally, it is more conservative to make a stock status evaluation for the aggregation rather than for each individual species. In addition, most of the depleted rockfish on the West Coast are managed as incidental-catch species through the use of trip limits for those species. This is the case for POP, bocaccio, and darkblotched, canary, widow, and yelloweye rockfish (cowcod is the exception, as commercial fishers are not permitted to retain this species) (PFMC 2004). There are undoubtedly discards of these species, but those that are landed, utilized, accounted for, and managed, are not considered bycatch by SFW1. Thus, these species will also be included when assessing the stock status of the different assemblages. Slope Rockfish Pacific Ocean perch co-occurs with an assemblage of slope rockfish, including darkblotched, splitnose, yellowmouth, and sharpchin rockfish off the West Coast (darkblotched rockfish assessment, 2005). Darkblotched rockfish are currently overfished, so the stock status of this assemblage is considered a high conservation concern. Little information exists on most BC rockfish stocks, and while POP may be of only moderate concern, serious concerns exist over the status of the co-occurring species yellowmouth and darkblotched rockfish, so the stock status for the assemblage is also of high conservation concern. In the Gulf of Alaska, POP also co-occur with northern, shortraker, and rougheye rockfish (Love et al. 2002). While POP and northern rockfish are both above BMSY with overfishing not occurring, there is evidence of age truncation in GOA POP and localized depletions in some GOA and AI POP stocks. In addition, enough information exists on shortraker and rougheye rockfish and several other slope species to define an overfishing threshold. The Alaskan slope assemblages (other than thornyheads) are thus deemed of moderate conservation concern. Shelf Rockfish The main commercially fished yellowtail rockfish stock off the West Coast (South Vancouver) is well above BMSY and not being overfished. However, the species co-occurs with widow
1 Bycatch is defined as species that are caught but subsequently discarded because they are of undesirable size, sex or species composition. Unobserved fishing mortality associated with fishing gear (e.g., animals passing through nets, breaking free of hooks or lines, ghost fishing, illegal harvest and under or misreporting) is also considered bycatch. Bycatch does not include incidental catch (non-targeted catch) if it is utilized, accounted for, and managed in some way.

SeafoodWatch® Rockfish Report June 15, 2009
53
rockfish, which is overfished, and several other rockfishes (Wallace and Lai 2005). Other overfished species on the West Coast (bocaccio, cowcod—only in central/southern California—and yelloweye rockfish) are also still caught in shelf fisheries including trawls and bottom longlines. The top four shelf species caught in trawl fisheries in BC are yellowtail, silvergrey, widow, and redstripe rockfish, all of which are of high conservation concern. Silvergrey rockfish are also a major rockfish component of the shelf bottom longline fisheries in BC. The stock status of West Coast and BC shelf assemblages are thus deemed a high conservation concern. Shelf species in Alaskan waters are grouped into complexes (mainly the Pelagic Shelf Rockfish complex, but the main component of the Demersal Shelf Rockfish complex, yelloweye, is also a shelf species), in which the stock status of the majority of species is unknown. Though the stocks are not thought to be experiencing overfishing, overfishing thresholds are based only on the most commonly caught species in the complex (dusky and yelloweye rockfish). This approach could mask declines in species that are caught more rarely. Thus, the Alaskan shelf stocks are deemed of moderate conservation concern. Nearshore Rockfish No nearshore species are thought to be overfished off the US West Coast (except in Puget Sound), although most have not been assessed and are therefore in unknown condition. The northern fishery (north of 40°0’) targets primarily black and blue rockfish. The stock of black rockfish (which accounts for the majority of nearshore rockfish landings off the West Coast) has only just recovered from being close to the overfished threshold (from 1985 to the late 1990s), due to several very successful recruitment events. Thus, although it is now considerably above BMSY the black rockfish stock has only just reached that level. In addition, the secondary target in the fishery, blue rockfish, has not been assessed at all. The southern fishery is far more diverse, with species other than rockfish (California sheephead and cabezon) making up the majority of the landings (and discards). Of the rockfish landed in the fishery—primarily brown, gopher, kelp, and grass rockfish and California scorpionfish—only gopher rockfish and scorpionfish have been assessed. Both were estimated to be at (gopher) or above (scorpionfish) the management target of B40%, but the stock assessment for gopher rockfish was highly uncertain. In addition, California scorpionfish are nearly all (95%) caught by recreational fishers. Thus, the nearshore rockfish complexes are deemed of moderate conservation concern. Copper and quillback rockfish comprise the majority of the catch in Puget Sound, and are considered depleted by the WDFW. Thus, the status of Puget Sound rockfish stocks is deemed of serious conservation concern. Fisheries for nearshore rockfish species are separated by management into those inside and those outside the Strait of Georgia. Those in the Strait of Georgia are thought by the DFO to be overexploited, and are hence deemed a high conservation concern by SFW. Those outside are thought by the DFO to be fully exploited, and so are deemed of moderate conservation concern. Gulf of Alaska stocks are managed as part of the Demersal Shelf Rockfish complex (parts of the GOA) and the Other Rockfish complex (BSAI), for which information is insufficient to define the overfished threshold for even the most commonly-caught species. These stocks are deemed of moderate conservation concern.

SeafoodWatch® Rockfish Report June 15, 2009
54
Thornyheads Fisheries that catch shortspine thornyhead (SST) also tend to catch longspine thornyhead (LST), but these species do not tend to aggregate with rockfish of the Sebastes genus. They are most often associated with sablefish (Anoplopoma fimbria) and Dover sole (Microstomus pacificus) on deep, muddy banks and flats of the continental slope (SST assessment, 2005; LST assessment, 2005). Assessments for both species off the West Coast concluded they are well above (150%+) the management target (B40%), not experiencing overfishing, and have had stable biomass over recent years. There is some mixed evidence that the longspine thornyhead stock may be skewed, but the population structure of the shortspine thornyhead stock is normal. These stocks are thus deemed of low conservation concern. Thornyhead stocks in BC have not been assessed, and so their condition is unknown. However, COSEWIC considers shortspine thornyhead to be potentially in danger of extirpation from Canadian waters, and stocks are thus deemed of high conservation concern until assessments have been completed that show otherwise. Thornyheads in Alaska are managed as a single Thornyheads complex in the GOA and part of the much larger Other Rockfish complex in the BSAI. Based on the abundance of shortspine thornyhead, the complexes are not thought to be experiencing overfishing. However, information is insufficient for an overfished threshold to be defined, so the Alaskan thornyhead stocks are deemed of moderate conservation concern.
Conservation Concern: Status of Stocks
U.S. West Coast thornyhead stocks
U.S. West Coast black rockfish Low (Stock Healthy)
All AK stocks, including thornyheads
BC nearshore “Outside” stocks (outside the Strait of Georgia , Juan de Fuca Strait, and Johnstone Strait)
U.S. West Coast nearshore stocks, except Puget Sound
Moderate (Stock Moderate)
All BC and U.S. West Coast continental shelf and slope stocks, excluding thornyheads
Puget Sound stocks
BC nearshore “Inside” stocks
BC thornyhead stocks
High (Stock Poor)

SeafoodWatch® Rockfish Report June 15, 2009
55
Criterion 3: Nature and Extent of Discarded Bycatch1 Guiding Principle: A sustainable wild-caught species is captured using techniques that minimize the catch of unwanted and/or unmarketable species.
The US and Canadian Pacific groundfish fisheries experience a large amount of incidental catch for three reasons: 1) the multispecies nature of the fishery; 2) management measures implemented for a year-round fishery; and 3) almost 100% mortality of captured rockfish. Because rockfishes have a closed air bladder, they suffer air embolism upon ascending and usually die at the surface. This creates a major problem for management in regulating the amount of marketable, non-target catch, as well as in the creation of daily or monthly trip limits, as the ability of vessels to catch fish often surpasses the allowable catch, resulting in wasteful discard (Steve Ralston, NMFS, pers. comm., 2002). Because discarded rockfish are almost always thrown back dead or dying, the unintended catch must be considered part of the yearly total allowable catch (TAC) for those rockfish. West Coast Until recently, there was no federal monitoring program to assess West Coast groundfish discards. The earliest information on discards came from a voluntary observer program conducted primarily off Oregon (Pikitch 1991). Researchers reported that the total discard from all causes was approximately 16-20% of the total catch for species regulated by a trip limit (NWFSC 2003). This level of discard was factored into groundfish quota determinations throughout the 1990s, even as groundfish regulations were modified, possibly altering discard rates (NWFSC 2003). Another study conducted by the Oregon Trawl Commission and Oregon State University in 1995-1999 found that the discard rate for rockfishes was about 27% of the total catch landed (discards / discards + retained catch) (Sampson 2002). More recently, the newly implemented (2001) West Coast Groundfish Observer Program (WCGOP) collects at-sea catch and discard data for the limited entry groundfish trawl and fixed gear fisheries as well as the open access nearshore, prawn, and shrimp fleets (WCGOP 2005). The program also collects data on California and Oregon vessels fishing only in state waters. These data allow management to comply with yearly TACs by providing a more accurate and timely discard estimate. For example, if the combination of landed and discarded catch of a certain species reaches or exceeds quota, the retention of that species may be prohibited for the remainder of the year, if in-season adjustments are used, or the allowable catch may be reduced in the next season (PFMC 2003). Currently, the WCGOP coverage goal is to maintain a minimum of 20% observer coverage of the limited-entry trawl fleet and fixed gear fleets. The WCGOP has continued to expand its pilot project in the open access fisheries. In 2004, the limited-entry bottom trawl trips observed by the WCGOP accounted for 27% of the coastwide tonnage landed on all bottom trawl trips (WGCOP 2005).
1 Bycatch is defined as species that are caught but subsequently discarded because they are of undesirable size, sex or species composition. Unobserved fishing mortality associated with fishing gear (e.g., animals passing through nets, breaking free of hooks or lines, ghost fishing, illegal harvest and under or misreporting) is also considered bycatch. Bycatch does not include incidental catch (non-targeted catch) if it is utilized, accounted for, and managed in some way.

SeafoodWatch® Rockfish Report June 15, 2009
56
The data from the WCGOP is made available to the public in the form of annual reports. The reports only contain data from observed trips; the WCGOP does not extrapolate observed results to estimate discard quantity for the entire fishery (though the PFMC does). The reports also do not provide information on all species likely encountered by the groundfish fisheries, such as sharks, skates, ratfish, grenadiers, and all invertebrates. Nevertheless, they provide a useful minimum estimate of the proportion of the catch that is discarded in the different groundfish fisheries. The rate of discarding, measured as a percentage of retained catch, is shown for the major fisheries that land rockfish off the West Coast in Figure 34.
3328
61
6
47
0
10
20
30
40
50
60
70
Limited Entry,Trawl
Limited Entry,Longline
Limited Entry,Pot
Open AccessNearshore,
North, mixedgears
Open AccessNearshore,
South, mixedgears
%
Figure 34: Discards as a percentage of retained catch for several West Coast groundfish fisheries, 2004 (data from WGCOP 2005). *Observer data for the limited entry trawl fishery was not broken down into bottom trawl and midwater trawl fisheries, so these have been combined in ‘Limited Entry, Trawl.’
Limited entry trawl fishery All groundfish trawls in federal waters are managed under the limited entry program. Total discards, measured as a percentage of retained catch, were roughly 33% in 2004. The summary data provided by the WCGOP does not distinguish between bottom trawls and midwater trawls, so this figure is for all observed trawls combined (rockfish are caught and landed in both fisheries) (PacFIN 2005) (Figure 47). Other recent studies indicate a discard to retained ratio of 74% in 2001/2002 and 45% in 2002/2003 for the bottom trawl fishery only (i.e., excluding midwater trawls and the Pacific hake fishery) (Branch et al. 2004), and 93% in 2002 for the groundfish trawl fishery (likely including some midwater trawl component but excluding the Pacific hake fishery) (Harrington et al. 2005). There is clearly considerable difference in the total discard rate depending on the specific gears and years analyzed, but all fall into the 10-99% range considered of moderate concern by Seafood Watch®. According to the WCGOP data for 2004, flatfish made up the majority of the observed catch—Dover sole (58%), arrowtooth flounder (13%), and petrale sole (12%)—and were retained 95% of the time. Of the roundfish, 75% of sablefish caught (46% of roundfish catch) was retained, while 99% of Pacific hake (34% of roundfish catch) was typically discarded. The small quantities of halibut (nearly all Pacific halibut) and salmon caught were discarded.

SeafoodWatch® Rockfish Report June 15, 2009
57
0
2000000
4000000
6000000
8000000
10000000
12000000
14000000
16000000
Flatfish Roundfish Rockfish Halibut Salmon
Trawl
Limited Entry
RetainedDiscarded
Sum of Total catch (lbs)
Fishery Gear Major Group
Disposition of catch
0%
10%
20%
30%
40%
50%
60%
70%
80%
90%
100%
Flatfish Roundfish Rockfish Halibut Salmon
Trawl
Limited Entry
RetainedDiscarded
Sum of Total catch (lbs)
Fishery Gear Major Group
Disposition of catch
Figure 35: Total observed discards and retained catch in the limited entry West Coast groundfish trawl fishery, 2004 (data from WCGOP 2005).
Rockfish accounted for roughly 12% of the observed trawl catch. Rockfish discards, measured as a percentage of retained rockfish catch, were roughly 32%. Slope species accounted for the majority (90-95%) of the catch, and were typically retained (thornyheads 85-90% retained, darkblotched and POP 80% retained). Blackgill rockfish were all discarded. Approximately 60% of other slope rockfish were retained. Shelf species accounted for roughly 5% of the observed catch. Approximately 75% of yellowtail rockfish was retained, but all other species, including the overfished species (bocaccio, cowcod, widow, and yelloweye rockfish), were discarded more often than not. Of the nearshore rockfish, only black rockfish was typically (85%) retained; 95% of other nearshore rockfish were discarded.
0
200000
400000
600000
800000
1000000
1200000
Long
spin
eTh
orny
head
Shor
tspi
neTh
orny
head
Oth
er S
lope
Roc
kfis
h
Dar
kblo
tche
d
Mix
edTh
orny
head
s
Pac
ific
Oce
an P
erch
Oth
er S
helf
Roc
kfis
h
Yel
low
tail
Can
ary
Wid
ow
Boca
ccio
Bla
ckgi
ll
Oth
erN
ears
hore
Roc
kfis
h
Bla
ck
Cow
cod
Yello
wey
e
Rockfish
Trawl
Limited Entry
RetainedDiscarded
Sum of Total catch (lbs)
Fishery Gear Major Group Species
Disposition of catch
0%
20%
40%
60%
80%
100%
Long
spin
eTh
orny
head
Shor
tspi
neTh
orny
head
Oth
er S
lope
Roc
kfis
h
Dar
kblo
tche
d
Mix
edTh
orny
head
s
Paci
ficO
cean
Per
ch
Oth
er S
helf
Roc
kfis
h
Yel
low
tail
Can
ary
Wid
ow
Boc
acci
o
Bla
ckgi
ll
Oth
erN
ears
hore
Roc
kfis
h
Blac
k
Cow
cod
Yel
low
eye
Rockfish
Trawl
Limited Entry
RetainedDiscarded
Sum of Total catch (lbs)
Fishery Gear Major Group Species
Disposition of catch
Figure 36: Observed rockfish discards and retained catch in the limited entry West Coast groundfish trawl fishery, 2004 (data from WCGOP 2005).
Limited entry fixed gear fishery – longlines Longlines are used in both the limited entry and open access fixed gear groundfish fisheries, though the WCGOP collects data only for the limited entry portion. Total discards, measured as a percentage of retained catch, were roughly 28%. Roundfish accounted for 81% of the observed

SeafoodWatch® Rockfish Report June 15, 2009
58
catch. Sablefish accounted for 99% of the roundfish catch, with 86% being retained. Small quantities of Pacific halibut and other flatfish (primarily arrowtooth flounder) were caught, but most (80-90%) was discarded.
0
100000
200000
300000
400000
500000
600000
Roundfish Rockfish Halibut Flatfish
Longline
Limited Entry
RetainedDiscarded
Sum of Total catch (lbs)
Fishery Gear Major Group
Disposition of catch
0%
10%
20%
30%
40%
50%
60%
70%
80%
90%
100%
Roundfish Rockfish Halibut Flatfish
Longline
Limited Entry
RetainedDiscarded
Sum of Total catch (lbs)
Fishery Gear Major Group
Disposition of catch
Figure 37: Total observed discards and retained catch in the limited entry West Coast groundfish fixed gear (longline) fishery, 2004 (data from WCGOP 2005).
Rockfish accounted for 9% of the observed longline catch. Total rockfish discards, measured as a percentage of retained catch, were roughly 27%. Slope rockfish (primarily thornyheads and slope rockfish other than POP and darkblotched rockfish) made up 85-90% of the catch, with the majority being retained. Darkblotched rockfish and POP made up only a small fraction (<1% combined) of the catch, and were typically discarded. Shelf rockfish comprised approximately 11% of the observed catch. Canary rockfish accounted for more than half of the shelf rockfish caught, and nearly all were discarded. Unspecified other shelf rockfish, yelloweye rockfish, and bocaccio were also typically discarded, while yellowtail rockfish was typically retained and all widow rockfish was retained. Nearshore rockfish comprised roughly 2% of the catch, and were typically (95%) retained.
0
5000
10000
15000
20000
25000
30000
Sho
rtspi
neTh
orny
head
Oth
er S
lope
Roc
kfis
h
Mix
edTh
orny
head
s
Oth
er S
helf
Roc
kfis
h
Can
ary
Long
spin
eTh
orny
head
Oth
erN
ears
hore
Roc
kfis
h
Yel
low
tail
Yel
low
eye
Dar
kblo
tche
d
Pac
ific
Oce
an P
erch
Boca
ccio
Wid
ow
Blac
k
Rockfish
Longline
Limited Entry
RetainedDiscarded
Sum of Total catch (lbs)
Fishery Gear Major Group Species
Disposition of catch
0%
10%
20%
30%
40%
50%
60%
70%
80%
90%
100%
Sho
rtspi
neTh
orny
head
Oth
er S
lope
Roc
kfis
h
Mix
edTh
orny
head
s
Oth
er S
helf
Roc
kfis
h
Can
ary
Long
spin
eTh
orny
head
Oth
erN
ears
hore
Roc
kfis
h
Yello
wta
il
Yello
wey
e
Dar
kblo
tche
d
Paci
ficO
cean
Per
ch
Boca
ccio
Wid
ow
Bla
ck
Rockfish
Longline
Limited Entry
RetainedDiscarded
Sum of Total catch (lbs)
Fishery Gear Major Group Species
Disposition of catch
Figure 38: Observed rockfish discards and retained catch in the limited entry West Coast fixed gear, longline fishery, 2004.
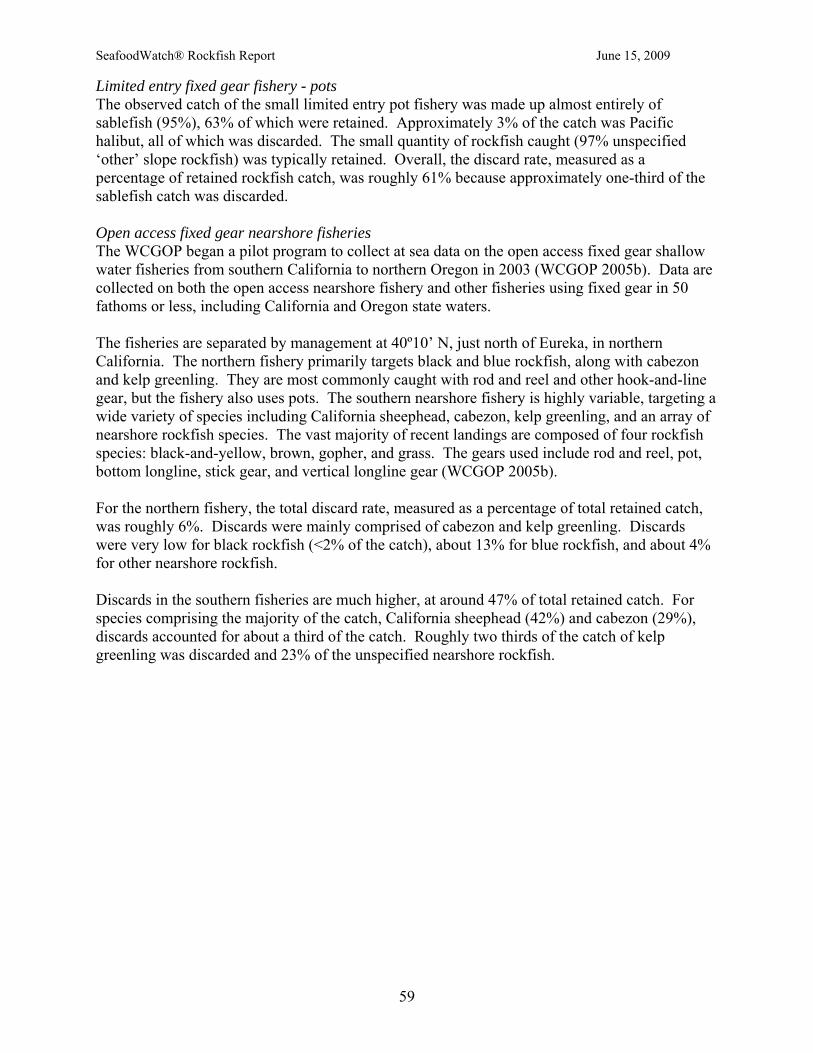
SeafoodWatch® Rockfish Report June 15, 2009
59
Limited entry fixed gear fishery - pots The observed catch of the small limited entry pot fishery was made up almost entirely of sablefish (95%), 63% of which were retained. Approximately 3% of the catch was Pacific halibut, all of which was discarded. The small quantity of rockfish caught (97% unspecified ‘other’ slope rockfish) was typically retained. Overall, the discard rate, measured as a percentage of retained rockfish catch, was roughly 61% because approximately one-third of the sablefish catch was discarded. Open access fixed gear nearshore fisheries The WCGOP began a pilot program to collect at sea data on the open access fixed gear shallow water fisheries from southern California to northern Oregon in 2003 (WCGOP 2005b). Data are collected on both the open access nearshore fishery and other fisheries using fixed gear in 50 fathoms or less, including California and Oregon state waters. The fisheries are separated by management at 40º10’ N, just north of Eureka, in northern California. The northern fishery primarily targets black and blue rockfish, along with cabezon and kelp greenling. They are most commonly caught with rod and reel and other hook-and-line gear, but the fishery also uses pots. The southern nearshore fishery is highly variable, targeting a wide variety of species including California sheephead, cabezon, kelp greenling, and an array of nearshore rockfish species. The vast majority of recent landings are composed of four rockfish species: black-and-yellow, brown, gopher, and grass. The gears used include rod and reel, pot, bottom longline, stick gear, and vertical longline gear (WCGOP 2005b). For the northern fishery, the total discard rate, measured as a percentage of total retained catch, was roughly 6%. Discards were mainly comprised of cabezon and kelp greenling. Discards were very low for black rockfish (<2% of the catch), about 13% for blue rockfish, and about 4% for other nearshore rockfish. Discards in the southern fisheries are much higher, at around 47% of total retained catch. For species comprising the majority of the catch, California sheephead (42%) and cabezon (29%), discards accounted for about a third of the catch. Roughly two thirds of the catch of kelp greenling was discarded and 23% of the unspecified nearshore rockfish.

SeafoodWatch® Rockfish Report June 15, 2009
60
0
5000
10000
15000
20000
25000
30000
35000
40000
45000
Rockfish Roundfish Roundfish Rockfish
Mixed Mixed
Open Access Nearshore, North Open Access Nearshore, South
RetainedDiscarded
Sum of Total catch (lbs)
Fishery Gear Major Group
Disposition of catch
0%
10%
20%
30%
40%
50%
60%
70%
80%
90%
100%
Rockfish Roundfish Roundfish Rockfish
Mixed Mixed
Open Access Nearshore, North Open Access Nearshore, South
RetainedDiscarded
Sum of Total catch (lbs)
Fishery Gear Major Group
Disposition of catch
Figure 39: Total observed discards and retained catch in the shallow water open access West Coast groundfish fisheries, 2004 (data from WCGOP 2005b).
0
5000
10000
15000
20000
25000
30000
35000
Black Blue Other MinorNearshoreRockfish
Cabezon KelpGreenling
CaliforniaSheephead
Cabezon KelpGreenling
All MinorNearshoreRockfish
Rockfish Roundfish Roundfish Rockfish
Mixed Mixed
Open Access Nearshore, North Open Access Nearshore, South
RetainedDiscarded
Sum of Total catch (lbs)
Fishery Gear Major Group Species
Disposition of catch
0%
10%
20%
30%
40%
50%
60%
70%
80%
90%
100%
Black Blue Other MinorNearshoreRockfish
Cabezon KelpGreenling
CaliforniaSheephead
Cabezon KelpGreenling
All MinorNearshoreRockfish
Rockfish Roundfish Roundfish Rockfish
Mixed Mixed
Open Access Nearshore, North Open Access Nearshore, South
RetainedDiscarded
Sum of Total catch (lbs)
Fishery Gear Major Group Species
Disposition of catch
Figure 40: Observed rockfish discards and retained catch in the shallow water open access fixed gear fisheries, 2004 (data from WCGOP 2005b).
British Columbia The BC groundfish trawl fleet is regulated according to where it chooses to fish. A small fleet of 13 vessels fishes in nearshore waters primarily for flatfish and cabezon for the Vancouver live market (groundfish trawl Option B). The rest of the fleet (Option A) fishes in outside waters for others species, including rockfish (DFO 2005b). This fishery has 100% observer coverage (for bottom trawls and most midwater trawls) and 100% dockside monitoring, allowing all catch (landings plus discards) to be enumerated. No retention of Pacific halibut, salmon, Pacific herring, sturgeon, or wolf eel is permitted in the groundfish trawl fleet, and landings of all non-TAC rockfish combined are limited to 15,000 lbs per trip. Observer coverage in the hook-and-line fisheries varies from year to year and between fisheries, but is considerably less than 100% (approximately 5-15% from some estimates). The current dockside monitoring program (DMP) covers 100% of the fleet (DFO 2005b-c).
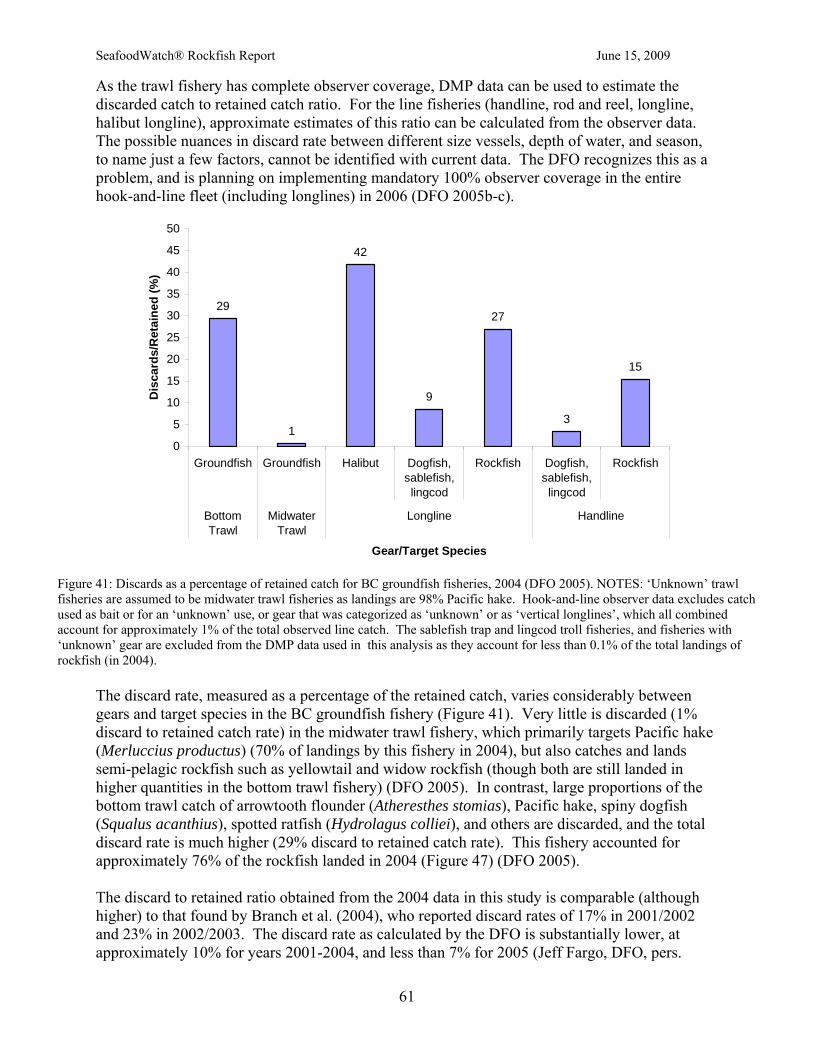
SeafoodWatch® Rockfish Report June 15, 2009
61
As the trawl fishery has complete observer coverage, DMP data can be used to estimate the discarded catch to retained catch ratio. For the line fisheries (handline, rod and reel, longline, halibut longline), approximate estimates of this ratio can be calculated from the observer data. The possible nuances in discard rate between different size vessels, depth of water, and season, to name just a few factors, cannot be identified with current data. The DFO recognizes this as a problem, and is planning on implementing mandatory 100% observer coverage in the entire hook-and-line fleet (including longlines) in 2006 (DFO 2005b-c).
29
1
42
9
27
3
15
0
5
10
15
20
25
30
35
40
45
50
Groundfish Groundfish Halibut Dogfish,sablefish,lingcod
Rockfish Dogfish,sablefish,lingcod
Rockfish
BottomTrawl
MidwaterTrawl
Longline Handline
Gear/Target Species
Dis
card
s/R
etai
ned
(%)
Figure 41: Discards as a percentage of retained catch for BC groundfish fisheries, 2004 (DFO 2005). NOTES: ‘Unknown’ trawl fisheries are assumed to be midwater trawl fisheries as landings are 98% Pacific hake. Hook-and-line observer data excludes catch used as bait or for an ‘unknown’ use, or gear that was categorized as ‘unknown’ or as ‘vertical longlines’, which all combined account for approximately 1% of the total observed line catch. The sablefish trap and lingcod troll fisheries, and fisheries with ‘unknown’ gear are excluded from the DMP data used in this analysis as they account for less than 0.1% of the total landings of rockfish (in 2004).
The discard rate, measured as a percentage of the retained catch, varies considerably between gears and target species in the BC groundfish fishery (Figure 41). Very little is discarded (1% discard to retained catch rate) in the midwater trawl fishery, which primarily targets Pacific hake (Merluccius productus) (70% of landings by this fishery in 2004), but also catches and lands semi-pelagic rockfish such as yellowtail and widow rockfish (though both are still landed in higher quantities in the bottom trawl fishery) (DFO 2005). In contrast, large proportions of the bottom trawl catch of arrowtooth flounder (Atheresthes stomias), Pacific hake, spiny dogfish (Squalus acanthius), spotted ratfish (Hydrolagus colliei), and others are discarded, and the total discard rate is much higher (29% discard to retained catch rate). This fishery accounted for approximately 76% of the rockfish landed in 2004 (Figure 47) (DFO 2005). The discard to retained ratio obtained from the 2004 data in this study is comparable (although higher) to that found by Branch et al. (2004), who reported discard rates of 17% in 2001/2002 and 23% in 2002/2003. The discard rate as calculated by the DFO is substantially lower, at approximately 10% for years 2001-2004, and less than 7% for 2005 (Jeff Fargo, DFO, pers.

SeafoodWatch® Rockfish Report June 15, 2009
62
comm.). Unfortunately, the data used to calculate these very low figures were not available to SFW (or any other private entity) because of confidentiality concerns (Jeff Fargo, pers. comm.), so they remain unvalidated. Until these data become available, SFW will assume a bycatch rate consistent with the data provided by the DFO and the study by Branch et al. (2004). The discard rate in hook-and-line and bottom longline fisheries varies considerably with target species (Figure 41). The directed halibut fishery utilizes bottom longlines only, while the spiny dogfish, sablefish, and lingcod directed fishery (Schedule II license) and the directed rockfish fishery (ZN license) utilize bottom longlines and handlines (including rod and reel gear). Discard rate in the bottom longline fisheries, measured as a percentage of the retained catch, varies from approximately 9% in the dogfish, sablefish, and lingcod directed fishery to approximately 42% in the Pacific halibut fishery. Discard composition also varies between fisheries, with the Pacific halibut fishery discarding halibut (Hippoglossus stenolepis), spiny dogfish, sablefish (Anoplopoma fimbria), skates (Raja spp.), and arrowtooth flounder, and the dogfish, sablefish, and lingcod and rockfish fisheries discarding spiny dogfish, lingcod, halibut, and skates. Discard rate also varies between the handline fisheries, at approximately 3% in the dogfish, sablefish, and lingcod fishery and 15% in the directed rockfish fishery (DFO 2005) (Figure 47). Alaska With the exception of small vessels (<60 feet) and halibut vessels, all groundfish vessels in federal waters in the BSAI and GOA are required to carry observers, at their own expense, for at least some of the time. The largest vessels, generally over 125 feet, are generally required to carry observers 100% of the time. Combined with reporting and weighing requirements, the information collected by observers provides the foundation for in-season management and for tracking species-specific catch and bycatch amounts. The discard rate of finfish for the various directed Alaskan rockfish fisheries, measured as a percentage of the retained catch, is shown in Figure 42. These are minimum estimates of discard rate, as invertebrates and other finfish are not included. Invertebrate bycatch alone can be considerable in trawl fisheries. NMFS estimates that an average of more than one million pounds of corals and sponges (approximately 80% sponges) were caught in commercial fishing gear in Alaskan waters annually between 1997 and 1999, 90% of which was bycatch in bottom trawl nets (NMFS 2001).

SeafoodWatch® Rockfish Report June 15, 2009
63
16
30
0
12
0
5
10
15
20
25
30
35
GOA Trawl GOA Bottom longline GOA Jig BSAI Trawl
%
Figure 42: Discards as a percentage of retained catch for fisheries that catch and land BSAI and GOA rockfish, 2001 (data from FIS 2003). NOTES: The GOA jig fishery has zero discards, and these only count discards of finfish (e.g., no invertebrates). The GOA bottom longline fishery is not a directed rockfish fishery. The data did not distinguish between midwater and bottom trawls, so these are combined here.
The GOA and BSAI groundfish trawl fisheries have an estimated discard to retained catch ratio of 16% and 12%, respectively. These data do not distinguish between the midwater and bottom trawl components of the fishery, which likely have very different discard to retained catch ratios (see BC discussion above). Another recent study estimates that the GOA groundfish fishery (all gears combined) has a discard to retained catch ratio of 33%, while the ratio for the BSAI groundfish fishery is estimated at approximately 9% for all gears combined (Harrington et al. 2005). The BSAI figure in particular is likely heavily influenced downward by the midwater trawl fishery for pollock (the biggest fishery in the US). Most rockfish are caught with bottom trawls (Figure 47). According to WCGOP data, the majority of discards in both the BSAI and GOA directed rockfish trawl fisheries are of roundfish (primarily sablefish in the GOA, and Atka mackerel in the BSAI) and flatfish (mainly arrowtooth flounder).
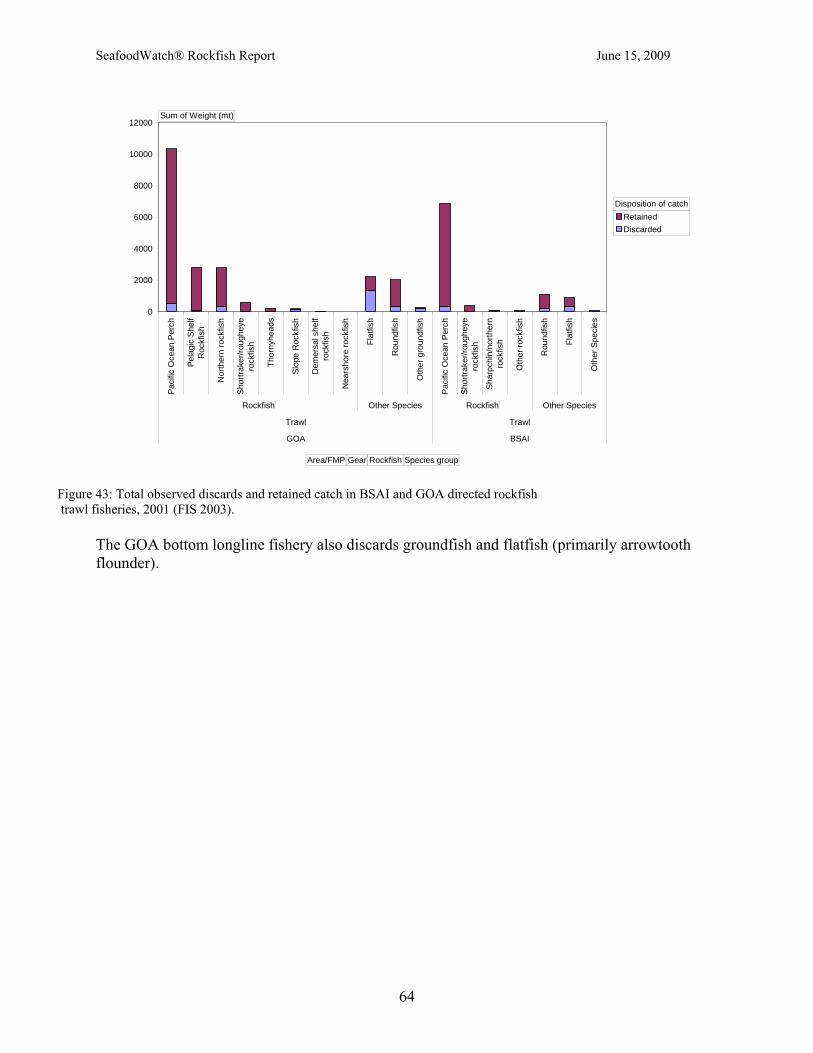
SeafoodWatch® Rockfish Report June 15, 2009
64
0
2000
4000
6000
8000
10000
12000
Paci
fic O
cean
Per
ch
Pela
gic
Shel
fR
ockf
ish
Nor
ther
n ro
ckfis
h
Shor
trake
r/rou
ghey
ero
ckfis
h
Thor
nyhe
ads
Slop
e R
ockf
ish
Dem
ersa
l she
lfro
ckfis
h
Nea
rsho
re ro
ckfis
h
Flat
fish
Rou
ndfis
h
Oth
er g
roun
dfis
h
Paci
fic O
cean
Per
ch
Shor
trake
r/rou
ghey
ero
ckfis
h
Shar
pchi
n/no
rther
nro
ckfis
h
Oth
er ro
ckfis
h
Rou
ndfis
h
Flat
fish
Oth
er S
peci
es
Rockfish Other Species Rockfish Other Species
Trawl Trawl
GOA BSAI
RetainedDiscarded
Sum of Weight (mt)
Area/FMP Gear Rockfish Species group
Disposition of catch
Figure 43: Total observed discards and retained catch in BSAI and GOA directed rockfish trawl fisheries, 2001 (FIS 2003).
The GOA bottom longline fishery also discards groundfish and flatfish (primarily arrowtooth flounder).

SeafoodWatch® Rockfish Report June 15, 2009
65
0
50
100
150
200
250
300
350
400
Shor
trake
r/rou
ghey
ero
ckfis
hD
emer
sal s
helf
rock
fish
Thor
nyhe
ads
Slop
e R
ockf
ish
Nea
rsho
re ro
ckfis
h
Pela
gic
Shel
fR
ockf
ish
Nor
ther
n ro
ckfis
h
Paci
fic O
cean
Per
ch
Oth
er g
roun
dfis
h
Flat
fish
Rou
ndfis
h
Nea
rsho
re ro
ckfis
h
Pela
gic
Shel
fR
ockf
ish
Dem
ersa
l she
lfro
ckfis
h
Slop
e R
ockf
ish
Thor
nyhe
ads
Nor
ther
n ro
ckfis
h
Shor
trake
r/rou
ghey
ero
ckfis
h
Paci
fic O
cean
Per
ch
Rou
ndfis
h
Flat
fish
Oth
er g
roun
dfis
h
Rockfish Other Species Rockfish Other Species
Bottom longline Jig
GOA
RetainedDiscarded
Sum of Weight (mt)
Area/FMP Gear Rockfish Species group
Disposition of catch
Figure 44: Total observed discards and retained catch in GOA longline and jig fisheries that catch and land rockfish, 2001 (FIS 2003).
Endangered species and other species of concern Mammals and turtles The NMFS is obligated to categorize all US commercial fisheries based upon the level of serious injury and mortality of marine mammals caught incidentally in those fisheries. This list of categorized fisheries is published annually, reflecting new knowledge and changes in the incidental injury or death rate of marine mammals. According to the 2004 list, all West Coast and Alaska groundfish fisheries are in the lowest category (Tier 2, Category III), which means that although the fishery might interact with marine mammals, the rate of injury and death are less than 1% of the threshold at which the fishery would be jeopardizing the continued existence of the population (Fed. Reg. 69, 153, August 10, 2004 – 50 CFR Part 229). Turtle bycatch in groundfish bottom trawls, bottom longlines, jigs, and handline gear (e.g., rod and reels, poles, sticks) is also deemed to be of low concern (Chuenpagdee et al. 2003). Seabirds Seabird bycatch in North Pacific longline fisheries, however, is a major concern. This current rockfish report summarizes the far more detailed analysis of this issue in the SFW Pacific Cod report (http://www.mbayaq.org/cr/SeafoodWatch/web/sfw_factsheet.aspx). In the longline fishery, seabirds are hooked on gear when they dive for bait as the lines are being deployed. The most common seabirds that occur in longline fishing grounds are black-footed albatross (Phoebastria nigripes), northern fulmar (Fulmarus glacialis), and shearwaters (Melvin et al. 2004). Laysan albatross (Phoebastria immutabilis) are taken in the BSAI and GOA longline fisheries, while short-tailed albatross (Phoebastria albatrus) have been observed as

SeafoodWatch® Rockfish Report June 15, 2009
66
takes only in the BSAI longline fishery (NMFS 2004). The most common seabird caught as bycatch in both the BSAI and the GOA is the northern fulmar (Livingston 2002). The short-tailed albatross, considered “one of the rarest species on earth” (NMFS 2004), is the only seabird species caught as bycatch in these fisheries that is listed as endangered by the U.S. Endangered Species Act (ESA). However, several of the seabird species are listed on the IUCN Red List of Threatened Species, including the Laysan albatross (Vulnerable), short-tailed albatross (Vulnerable), and black-footed albatross (Endangered) (IUCN 2004). Because the short-tailed albatross is protected under the ESA, several Biological Opinions (BiOps) have been issued to determine whether any federally managed fisheries have an adverse effect on this species. The 1989 Biological Opinion set the incidental take limit for short-tailed albatross at four every two years in the hook-and-line groundfish fishery, and two every five years in the trawl fishery (NMFS 2004). If the take limit is exceeded, the fishery faces possible modifications or closure (NMFS 2004). The most recent BiOp, published in 2003, found that BSAI and GOA groundfish fisheries are not likely to jeopardize the continued existence or recovery of the short-tailed albatross (USFWS 2003). Prior to 1998, the BSAI longline fishery accounted for the majority of the seabird bycatch in Alaska (Figure 45). However, the bycatch rate for all seabird species in longline fisheries in both regions has declined dramatically since 1998, and the total take of seabirds is now roughly equal in the GOA and BSAI. Furthermore, Laysan and blackfooted albatross bycatch in the GOA in 2003 was equivalent to that in the BSAI (178 birds and 177 birds, respectively). These declines are despite increased fishing effort over this period, and are largely due to the implementation of management measures requiring seabird mitigation devices. Longline fisheries occurring in state waters may be a relatively small contribution to albatross bycatch in the U.S.-based fishery, although with no observer coverage this is difficult to quantify (NMFS 2004).
0
0.02
0.04
0.06
0.08
0.1
0.12
0.14
0.16
1993 1994 1995 1996 1997 1998 1999 2000 2001 2002 2003Year
Byc
atch
rate
(bird
s pe
r 1,0
00 h
ooks
)
Bering Sea/Aleutian Islands Gulf of Alaska
Figure 45: Bycatch rates of all seabird species in the BSAI and GOA, 1993-2003 (NMFS 2005b).
Seabirds exhibit life history characteristics that make them vulnerable to increased adult mortality, such as a long life span, late age at maturity, and low reproductive rates (Russell et al. 1999; Saether and Bakke 2000). Due to these life history characteristics, it may take years for a population decline to be detected, and subsequently for the population to show signs of recovery (Moloney et al. 1994). Globally, longline fishing is considered the most serious threat to certain seabird species such as albatrosses (Brothers et al. 1999). Due to a lack of published population

SeafoodWatch® Rockfish Report June 15, 2009
67
data, there is some uncertainty associated with the population consequences of seabird bycatch in the bottom longline fisheries of the BSAI and GOA. Recent assessments suggest that the population of short tailed albatross may be increasing (Fitzgerald et al. 2004) and that the number of breeding pairs of black footed albatross on the Hawaiian Islands has been stable since 1992 and increasing since 2003 (Flint 2005). Additionally, after the number of breeding pairs of Laysan albatross on the Hawaiian Islands declined dramatically from 1997 to 2002, the number has generally increased since 2002 (Flint 2005). Despite the trends observed at these nesting locations, general population trends for seabird colonies in Alaska show a predominantly negative trend in the southeast Bering Sea and Gulf of Alaska (Figure 9) (Dragoo et al. 2003). Recent population declines for both the Laysan albatross and black-footed albatross have been attributed to the bycatch of these species in the longline fisheries of the North Pacific (BirdLife International 2004). The freezer longline Pacific cod fishery has recently been certified by the Marine Stewardship Council, an independent non-profit organization that evaluates the sustainability of a fishery before labeling the product, signifying “…environmentally responsible fishery management and practices” (MSC 2004). They conclude that there is some uncertainty associated with the population consequences of seabird bycatch due to a lack of published population data, but the fishery is “…unlikely to be a major problem” in this regard (MSC 2005).
0
2
4
6
8
10
12
14
16
N Bering/Chukchi
SE Bering SW Bering Gulf of Alaska Southeast
Freq
uenc
y
Negative trend No discernable trend Positive trend
Figure 46: Seabird population trends for some colonies in Alaska, 2001 (Data from Dragoo et al. 2003).
Seabirds are also caught in the BC groundfish longline fisheries (DFO 2005). The DFO has made mandatory bycatch mitigation measures similar to those in use by the Alaska fisheries, but no empirical data are yet available on how effective these measures are. Synthesis U.S. and Canadian North Pacific fisheries have comprehensive observer programs in place to monitor and enumerate bycatch in the groundfish fisheries. The total catch, both retained and

SeafoodWatch® Rockfish Report June 15, 2009
68
discarded, is used in stock assessments in all regions. The overall discard rate (for groundfish fisheries in general in West Coast and BC fisheries, and for directed rockfish fisheries in AK), measured as a percentage of the retained catch, varies considerably between fisheries and gears. Groundfish bottom trawl fisheries have a discard rate of between 12% (BSAI rockfish fishery) and 33% (West Coast limited entry groundfish fisheries) of the retained catch in 2004. Discards include all of the overfished species of rockfish. The shelf species (bocaccio, canary rockfish, yelloweye rockfish, and widow rockfish) are typically discarded, while 80% of the catch of the slope species (POP and darkblotched rockfish) are retained. Thus, bycatch remains a moderate conservation concern in all bottom trawl fisheries. The BC midwater trawl fishery has a very low rate of discards (approximately 1%) and is thus deemed of low concern. Pacific U.S. midwater trawl fisheries also appear to have low discard rates—<1% for the US West Coast Pacific whiting/hake fishery in 2002 (Harrington et al. 2005), and 1-2% for the BSAI pollock fishery (Ianelli et al. 2003)—so discards in midwater trawl fisheries generally are also deemed of low conservation concern. The discard rate in bottom longline fisheries is estimated to be around 30% for Pacific US and BC bottom longline fisheries (30% in the GOA fishery, 28% in the US West Coast fishery, and 9-42% in the BC fisheries). Like the trawl fisheries, the limited entry West Coast longline fisheries catch and discard overfished rockfish (particularly canary rockfish). The bycatch in these fisheries is deemed a moderate conservation concern. Alaskan longline fisheries regularly catch protected seabirds (particularly black-footed and Laysan albatross). Although management measures have been successful at reducing this bycatch, concerns remain over consequences of this bycatch on seabird populations. Thus, this issue remains a moderate conservation concern. Seabirds caught in BC longline fisheries are also of moderate concern, though far less is known about total numbers of seabirds caught or the effectiveness of the management measures. The discard rate when using hook-and-line gear other than bottom longlines is typically very low (0% for the GOA jig fishery, 3-15% for the BC handline fisheries, and 6% for the West Coast northern open access nearshore fishery). However, the open access nearshore mixed gear fishery off central/southern California (south of 40°10’) has a much higher discard rate—47%. This relatively high discard rate is due to high discards of the main species caught (California sheephead and cabezon), although discards of nearshore rockfish are also relatively high (23% of the catch). Thus, the bycatch in the southern fishery is of moderate conservation concern, while that in all others is of low conservation concern.

SeafoodWatch® Rockfish Report June 15, 2009
69
Conservation Concern: Nature and Extent of Bycatch
All hook-and-line (non-bottom longline) and jig fisheries except the southern West Coast nearshore fishery
Midwater trawl fisheries
Low (Bycatch Minimal)
Southern U.S. West Coast mixed gear/hook-and-line fishery
All bottom longline fisheries
All bottom trawl fisheries
Moderate (Bycatch Moderate)
Criterion 4: Effect of Fishing Practices on Habitats and Ecosystems Guiding Principle: Capture of a sustainable wild-caught species maintains natural functional relationships among species in the ecosystem, conserves the diversity and productivity of the surrounding ecosystem, and does not result in irreversible ecosystem state changes.
Many different gears are utilized in catching rockfish off the Pacific coast of North America. Bottom trawls account for the majority of rockfish landings in all areas (94% and 96% of AK and BC landings, respectively, and 66 % of US West Coast landings). Bottom longlines and hook-and-line gear account for only a few percent of landings in Alaska and British Columbia, but a greater percentage of US West Coast landings. Midwater trawls are also used to catch some more pelagic shelf rockfish, especially yellowtail and widow rockfish off Washington State and BC (PacFIN 2005; DFO 2005). Other gears such as pots and dipnets account for less than 1% of landings between them, even in the diverse mixed gear nearshore fisheries off the West Coast (PacFIN 2005).
AK
95%
4%
BC
76%
6%
1%
17%
West Coast
67%10%
9%
14%
Bottom trawl Hook and line* Bottom longline Midwater trawl
Figure 47: Proportion of rockfish catch by region and gear, 2004 (data from PacFIN 2005, ADFG 2005, and DFO 2005). *Hook-and-line gear includes all selective gears that do not tend to touch bottom, such as jigs, handlines, rod and reels, poles and so on.

SeafoodWatch® Rockfish Report June 15, 2009
70
Habitat Effects Fishing types for rockfish Bottom trawls Large areas of the Pacific continental shelf are trawled each year by the groundfish and other fisheries. It has been estimated that during the mid 1990s, an average of 15% of California, 57% of Alaska (that was monitored), and 6% of Oregon and Washington shelf and slope areas fished were swept with trawls more than once a year, while 85-94% of these waters were swept less than once a year (NRC 2002). Bottom trawling gear used for catching groundfish has adverse effects on seafloor integrity, both physically and biologically. Bottom trawling impacts sea-floor communities by scraping the ocean bottom, causing: 1) sediment re-suspension (turbidity) and smoothing; 2) removal of and/or damage to non-target species; and 3) destruction of three-dimensional habitat (biotic and abiotic) (Auster and Langton 1999). Research on the effects of bottom trawl gear deployed in the Bering Sea (off Alaska) has shown that trawls destroy slow-growing, long-lived gorgonian corals (Primnoa spp.), which provide complex habitat to demersal shelf rockfishes (Witherell and Coon 2000). These corals are extremely fragile (Risk et al. 1998), and thus are vulnerable to the physical disturbances caused by fishing. Damage and/or removal of these corals in the North Pacific may severely impact the ecosystem as a whole, including the maintenance of groundfish populations (Auster et al. 1996; Witherell and Coon 2000). Bottom trawl disturbance of the seabed is mainly a function of bottom type—rock, sand, mud, etc.—and gear type—dredge, beam, otter trawl, etc. Some types of trawling gear cause less damage than others, and some sediment types (and their associated ecosystems) are more resilient to disturbances caused by trawling. In a review of fishing effects, Collie et al. (2000) found that fauna associated with sandy (coarser) sediments were less affected by disturbance than those in soft, muddy (biogenic) sediments. Recovery rate appears to be slower in muddy and structurally complex habitats, while mobile sandy sediment communities can withstand 2-3 trawl passes per year without significant (adverse) change (Collie et al. 2000). Numerous studies (Watling and Norse 1998; Auster and Langton 1999; NRC 2002; Collie et al. 2000) have documented and summarized the effects of mobile tending gear, such as bottom trawls, on seafloor habitats, and consistently recognize bottom trawls, including otter trawls, as one of the most damaging gear types in use. In a review of 22 studies of mobile gear on the structural components of habitat such as sand waves, emergent epifauna, sponges, and corals, Auster and Langton (1999) found similar impacts across a wide geographic range. These impacts were categorized as: 1) directly removing or damaging epifauna and leading to mortality; 2) smoothing sedimentary bedforms and reducing bottom roughness; and 3) removing taxa that produce structure (such as burrows and pits). The National Research Council noted that the effects of mobile bottomfishing gear on benthic habitats depend on the susceptibility of the habitat and on the type of gear used. They highlighted several generalities gleaned from various reviews of impact studies: 1) trawling and dredging reduce habitat complexity by crushing, burying, or exposing marine flora and fauna; 2) repeated trawling and dredging results in discernable changes in benthic communities, shifting them from dominance by species with relatively large adult body size towards dominance by abundances of small-bodied organisms, and species richness can decline; 3) bottom trawling reduces the productivity of benthic habitats because of an overall loss of biomass; and 4) fauna that live in low natural disturbance regimes are generally more vulnerable to fishing gear

SeafoodWatch® Rockfish Report June 15, 2009
71
disturbance (NRC 2002). Other reviews confirm that impacts of bottom trawls on habitat generally include alteration of physical structure, suspension of sediment, modifications in water and sediment chemistry, changes to the benthic community, and a reduction in habitat complexity (NEFMC 2003; NRC 2002). Other trawl gear Some rockfish are also caught in midwater or pelagic trawls, which are typically designed to fish for shoaling species that live in the water column as opposed to on or near the seafloor. Thus, the majority of the net in these trawls is not likely in contact with the seabed for much of the time. However, effects from these trawls are probably not completely benign, as the otter doors may come into contact with the seafloor at least intermittently (PFMC 2005). Other fishing gear Although trawls are the gear most often cited as negatively impacting cold-water corals off Alaska, longlines, pots, and jigs also affect this sensitive bottom habitat (NMFS 2004). Groundlines and hooks on bottom longlines snag large branches of corals, and also cause portions of hard corals to be broken off (Breeze et al. 1997; High 1998). Although bottom longlines have limited contact with the seafloor, both the hooks and lines may snag on bottom structure as the gear is set and retrieved (Chuenpagdee et al. 2003). For rougher habitats such as boulders with corals, fixed gear may have an impact, particularly because it is easier to fish fixed gear over rough habitat (NMFS 2004). Pots and traps are set on the seafloor, often with many pots strung together on a long line (longline pots). Damage to the seafloor and benthic communities can thus arise through direct contact and dragging when the gear is being hauled in. Hook-and-line gear, such as jigs, handlines, and rods and reels, do not generally contact the seafloor unless they are set on the bottom, in which case the lines and sinkers may damage organisms such as corals (Chuenpagdee et al. 2003). Similarly, poles and similar handgear are not likely to contact the seafloor. Trawling and biogenic habitat Much of the discussion below is paraphrased from the SFW Pacific cod report (http://www.mbayaq.org/cr/SeafoodWatch/web/sfw_factsheet.aspx), as deep-sea coral and sponge habitat appears particularly concentrated in Alaskan waters, especially around the Aleutian Islands (Roberts and Hirshfield 2004). It is, however, pertinent to the US West Coast and BC as these areas too have biogenic habitat (e.g., PFMC 2005). In the Bering Sea, bottom sediments include sand and gravel, as well as organisms such as soft corals, hydroids, sea pens, tubeworms, tunicates, and sponges (Enticknap 2002); these organisms create structure and habitat (McConnaughey et al. 2000). The GOA is a more open system with weaker currents, and is predominantly gravely-sand, silty-mud, and areas of hard bedrock (NMFS 2001). Corals, sponges and other structure-forming organisms provide shelter for commercial fish species, and are particularly vulnerable to fishing because they are long-lived and easily damaged by fishing gear (Witherell and Coon 2000). Like other stable environments composed of long-lived species, corals recover slowly from damage (Auster and Langton 1999; Witherell and Coon 2000). The largest deep-sea corals occurring in Alaskan waters are Primnoa, which can grow up to 3 m high and 7 m wide (Witherell and Coon 2000). These corals also grow slowly and can live longer than 500 years (Risk et al. 1998). In the waters off Alaska, gorgonians are found along the continental shelf and slope along the Gulf of Alaska and the Aleutian Islands (Witherell and Coon 2000). Soft corals are most

SeafoodWatch® Rockfish Report June 15, 2009
72
common in the Bering Sea, gorgonians are most common in the Aleutian Islands, and gorgonians and cup corals are most common in the Gulf of Alaska (Heifetz 2002). Heifetz (2002) found that rockfish and Atka mackerel (Pleurogrammus monopterygius) were associated with gorgonian, cup, and hydrocorals, while flatfish and gadids were most often associated with soft corals. Ten megafaunal groups have been shown to associate with Primnoa, and rockfish, shrimp, and crabs were observed utilizing Primnoa for shelter (Krieger and Wing 2002). In particular, rockfish were commonly affiliated with corals; although less than 1% of the boulders in the study area contained coral, 85% of the large rockfish were observed next to boulders with corals (Krieger and Wing 2002). There is less known about fishing gear impacts on cold-water corals than there is on sponges and tropical corals (Witherell and Coon 2000); however, cold-water corals have been observed to be vulnerable to damage by fishing gear (Krieger 1998). The removal of deepwater corals may have long-term effects on species that associate with the corals (Krieger and Wing 2002), and it may take as long as 100 years for gorgonians to recover from fishing impacts (Andrews et al. 2002). Krieger and Wing (2002) conclude: “Removal or damage of Primnoa may affect the populations of associated species, especially at depths > 300 m, where species were using Primnoa almost exclusively.” In Norway, fishermen have reported that catches are lower in areas were deepwater corals have been damaged; in addition, these same fishermen were concerned about the reduced ability of reefs to function as nursery habitat for commercial fish species (Fosså et al. 2002). Research conducted in Norway also found that more fish were caught in coral reef habitat than in non-coral reef habitat (Husebo et al. 2002). Fishermen using hook-and-line gear and gillnets have been known to set their gear close to reefs, as these areas are known to be good fishing areas (Fosså et al. 2002). Deepwater corals in other areas of the northeast Atlantic have been observed with trawl scars as a result of otter trawl doors, rockhopper gear, and nets damaging the sensitive habitat (Hall-Spencer et al. 2002). A recent study in the Bering Sea found that heavily fished areas had a patchier distribution of structure-forming organisms such as sponges, anemones, soft corals, and stalked tunicates (McConnaughey et al. 2000). Overall, habitat complexity and diversity were reduced after bottom trawling, accompanied by physical changes to the seafloor habitat itself, which was a sandy, shallow benthic environment (McConnaughey et al. 2000). Research in a different habitat type, dominated by find sand and mud, found that bottom trawling had very little effect on the seafloor habitat (Brown 2001). In the GOA, bottom trawling has also been shown to have negative effects. In one case, an area that was trawled in 1990 had still not recovered by 1997; despite the seven-year time lapse, the coral colonies remained damaged with some missing up to 99% of their branches (Krieger 2001). On hard-bottom habitat in the Gulf of Alaska, bottom trawling has been shown to damage 67% of the epifaunal sponges, and 55% of the sea whips in trawl transects ranging 0.29-0.56 km in length (Freese et al. 1999). Emergent epifauna were removed or damaged, and boulders were displaced after the single pass of a trawl (Freese et al. 1999). It is expected that areas subject to long-term trawling would have a decreased density of such epifauna (Freese et al. 1999). Trawling may also indirectly impact coral habitat by removing fish that consume coral grazers, thereby causing an increase in the abundance of coral grazers (Rogers 1999). Freese et al. (1999) also found that a year after bottom trawling occurred at the study site, none of the damaged sponges had recovered, and it was possible to identify the tracks left by the trawl

SeafoodWatch® Rockfish Report June 15, 2009
73
doors. Organisms such as corals are likely to show a measured population decline in areas that are repeatedly bottom trawled, as they are slow-growing and physically vulnerable to damage by trawl gear (Kaiser 1998). On seamounts in Tasmania, the biomass and diversity of species was higher on unfished seamounts than on heavily fished seamounts (Koslow et al. 2001). Rockfish habitat preferences Little is known about the specific habitat requirements of most rockfishes, although it is known they vary between species and different life stages (Love et al. 2002; PFMC 2005; NMFS 2004). However, with few exceptions, rockfishes tend to inhabit hardbottom habitat (rock ledges, caves, crevices, boulders, cobble fields, shell debris) during at least part of their lives (Love et al. 2002). Many are also associated with complex seafloor structure-forming invertebrates (e.g., corals, sponges, sea whips) and plants (seagrass beds and kelp forests) (Love et al. 2002). A review of rockfish and other groundfish habitat associations by the PFMC, as part of the SFA mandated Essential Fish habitat (EFH) Environmental Impact Statement (EIS) process determined that all 49 of the 54 rockfish species included in the analysis were associated with hardbottom habitat at some point in their lives, including all nearshore and shelf species (Table 7). Most of these are also associated with corals, sponges, sea pens, kelp forests, seabeds, or other biogenic habitat. Those that do occupy soft habitats do so as juveniles (e.g., young cowcod) or are smaller species such as greenstriped, calico, and stripetail rockfish (Love et al. 2002). It is the deeper water slope species that most commonly associate with mud or sand habitat as adults. Even here though, the few species that do occur in muddy and sandy habitat (particularly shortspine and longspine thornyheads, stripetail, and greenstriped rockfish) are usually still associated with structures such as pebbles, shell debris, sponges, sea anemones, and shallow depressions in the mud, all of which give the habitat some level of complexity and vertical relief (Love et al. 2002). Although early studies have indicated that darkblotched rockfish are found on soft bottoms, more recent submersible observations indicate the species is associated with rocks or other bottom structures (W. Wakefield, NMFS, pers. comm., in PFMC 2005). Like those in shallower waters, most of the rockfishes on these substrates are relatively small species or juveniles (Love et al. 2002). Rougheye and shortraker rockfish may be exceptions, as these species are most often observed on muddy substratum adjacent to boulders (Love et al. 2002).

SeafoodWatch® Rockfish Report June 15, 2009
74
Table 7: Habitat associations of rockfish (PFMC 2005).
Habitat SpeciesHard bottom Biogenic Unconsolidated
Black rockfish x xBlack-and-yellow rockfish x xBlue rockfish x xBrown rockfish x xCalico rockfish x xCalifornia scorpionfish x x xChina rockfish x xCopper rockfish x xGopher rockfish x x xGrass rockfish x xKelp rockfish x xOlive rockfish x xQuillback rockfish x x xTotal 13 12 4Bocaccio x x xBronzespotted rockfish xCanary rockfish x xChilipepper x x xCowcod x x xDusky rockfish x xFlag rockfish x xGreenblotched rockfish xGreenspotted rockfish x x xGreenstriped rockfish x xHoneycomb rockfish x xMexican rockfish xPink rockfish x xRedstripe rockfish xRosethorn rockfish x x xRosy rockfish xShortbelly rockfish x x xSilvergray rockfish xSpeckled rockfish x x xSquarespot rockfish xStarry rockfish x xStripetail rockfish x x xTiger rockfish x xVermilion rockfish x x xWidow rockfish x x xYelloweye rockfish x x xYellowtail rockfish x x xTotal 27 17 15Aurora rockfish x xBank rockfish x xBlackgill rockfish x xDarkblotched rockfish xHarlequin rockfish xLongspine thornyhead x xPacific ocean perch x x xRedbanded rockfish xRougheye rockfish x xSharpchin rockfish x x xShortraker rockfish x xShortspine thornyhead x xSplitnose rockfish x xYellowmouth rockfish xTotal 9 5 12
Grand Total 49 34 31
Substrate
Nearshore
Shelf
Slope
Ecosystem Effects Trawling in the waters off Alaska has had documented effects on both the physical and biogenic habitats associated with the seafloor, including changes to community structure and potential effects on prey (NMFS 2004). The large amount of biomass removed from the Bering Sea may have an impact on community structure and be a contributing factor in the recent shift to a pelagic system dominated by pollock (NRC 1996). Fixed gear such as longlines and pots has also been shown to affect the benthos, but it is unlikely that these fisheries have resulted in widespread ecosystem effects (NMFS 2004). Other potential ecosystem effects include the removal of species that are prey for seabirds (NMFS 2004).
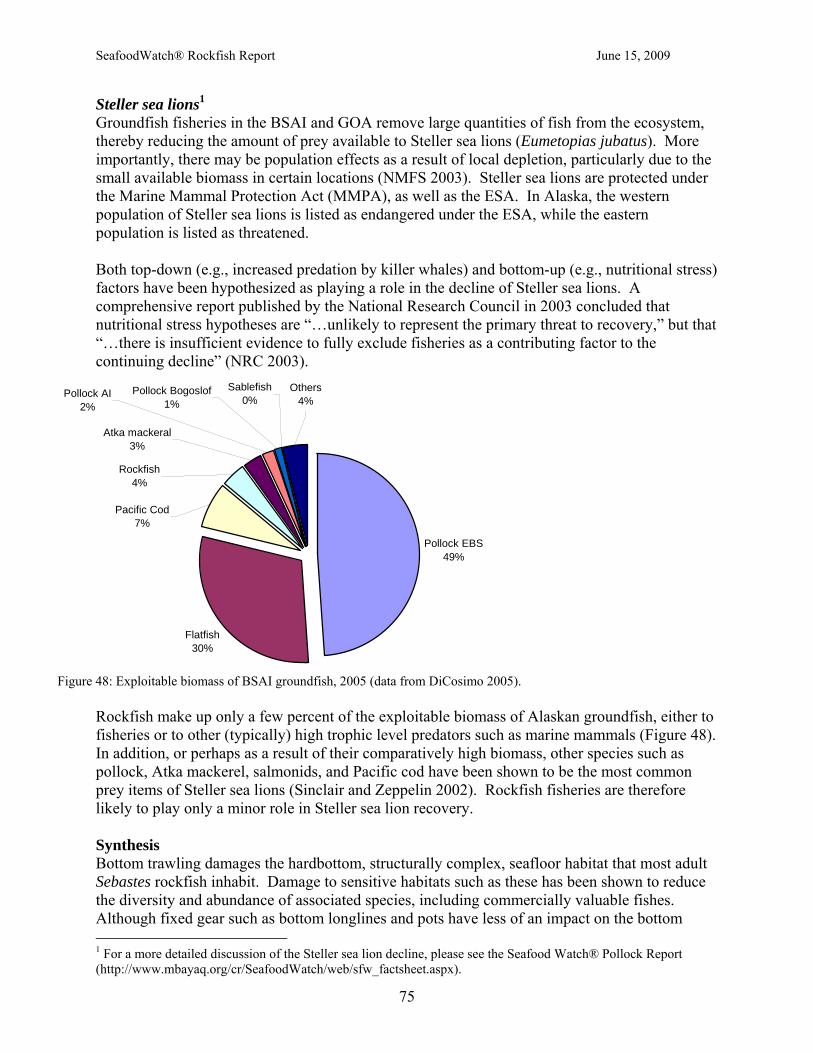
SeafoodWatch® Rockfish Report June 15, 2009
75
Steller sea lions1 Groundfish fisheries in the BSAI and GOA remove large quantities of fish from the ecosystem, thereby reducing the amount of prey available to Steller sea lions (Eumetopias jubatus). More importantly, there may be population effects as a result of local depletion, particularly due to the small available biomass in certain locations (NMFS 2003). Steller sea lions are protected under the Marine Mammal Protection Act (MMPA), as well as the ESA. In Alaska, the western population of Steller sea lions is listed as endangered under the ESA, while the eastern population is listed as threatened. Both top-down (e.g., increased predation by killer whales) and bottom-up (e.g., nutritional stress) factors have been hypothesized as playing a role in the decline of Steller sea lions. A comprehensive report published by the National Research Council in 2003 concluded that nutritional stress hypotheses are “…unlikely to represent the primary threat to recovery,” but that “…there is insufficient evidence to fully exclude fisheries as a contributing factor to the continuing decline” (NRC 2003).
Pollock EBS49%
Flatfish30%
Pollock AI2%
Rockfish4%
Pacific Cod7%
Pollock Bogoslof1%
Sablefish0%
Others4%
Atka mackeral3%
Figure 48: Exploitable biomass of BSAI groundfish, 2005 (data from DiCosimo 2005).
Rockfish make up only a few percent of the exploitable biomass of Alaskan groundfish, either to fisheries or to other (typically) high trophic level predators such as marine mammals (Figure 48). In addition, or perhaps as a result of their comparatively high biomass, other species such as pollock, Atka mackerel, salmonids, and Pacific cod have been shown to be the most common prey items of Steller sea lions (Sinclair and Zeppelin 2002). Rockfish fisheries are therefore likely to play only a minor role in Steller sea lion recovery. Synthesis Bottom trawling damages the hardbottom, structurally complex, seafloor habitat that most adult Sebastes rockfish inhabit. Damage to sensitive habitats such as these has been shown to reduce the diversity and abundance of associated species, including commercially valuable fishes. Although fixed gear such as bottom longlines and pots have less of an impact on the bottom 1 For a more detailed discussion of the Steller sea lion decline, please see the Seafood Watch® Pollock Report (http://www.mbayaq.org/cr/SeafoodWatch/web/sfw_factsheet.aspx).

SeafoodWatch® Rockfish Report June 15, 2009
76
habitat, they do come into contact with the seafloor, and likely still have a moderate impact on most rockfish habitat. Similarly, midwater trawls, although designed to fish in the water column, do likely come into contact with the seabed at least some of the time in some fisheries. This gear is thus deemed to have moderate impacts on habitat. Gears that are rarely in contact with the ocean bottom, such as hook-and-line gear, cause minimal habitat damage. The ecosystem effects of removing large quantities of groundfish from the BSAI and GOA have been explored, but there is not sufficient evidence that this factor alone has resulted in the decline of Steller sea lions. In addition, the relatively large fisheries for pollock and Pacific cod more likely impact Steller sea lions than those for rockfish. Overall, trawls are considered to have severe habitat and ecosystem effects. Bottom longlines and pots are deemed to have moderate habitat and ecosystem effects, and poles, hook-and-line gears other than longlines, and midwater trawls are deemed to have benign habitat and ecosystem effects.
Conservation Concern: Habitat and Ecosystem Impacts
Poles and hook-and-line gears other than bottom longlines Low (Fishing Effects Benign)
Bottom longlines
Midwater trawls Moderate (Fishing Effects Moderate)
Bottom trawls High (Fishing Effects Severe)
Criterion 5: Effectiveness of the Management Regime Guiding Principle: The management regime of a sustainable wild-caught species implements and enforces all local, national and international laws and utilizes a precautionary approach to ensure the long-term productivity of the resource and integrity of the ecosystem.
US Rockfishes and their associated fisheries are managed by the states within coastal waters out to three miles. From 3 to 200 miles offshore (the US exclusive economic zone—EEZ), management of rockfish falls under the jurisdiction of the National Marine Fisheries Service (NMFS). In conjunction with NMFS, the Pacific Fishery Management Council (PFMC) regulates federal fisheries off California, Oregon and Washington, and the North Pacific Fishery Management Council (NPFMC) manages Alaska’s federal resources. In the Gulf of Alaska, the Alaska Department of Fish & Game (ADFG) manages some rockfish species, even though they may occupy federal waters. Generally, the state and federal governments attempt to impose consistent regulations, as many stocks straddle the 3-mile boundary. State regulations usually reflect federal regulations, and when in question, can be subjected to preemption by NMFS. Due to their nearshore distribution, recreational and live fish fisheries most often fall under state management.

SeafoodWatch® Rockfish Report June 15, 2009
77
West Coast Rockfish (including relatives of Sebastes such as thornyheads and California scorpionfish) comprise 64 of the 82 species managed by the PFMC under the Groundfish Fishery Management Plan (FMP). Under the FMP, species are generally managed using a number of measures including harvest guidelines, quotas, trip and landing limits, area restrictions, seasonal closures, and gear restrictions (such as minimum mesh size for nets and small trawl footrope requirements for landing shelf rockfish). The Groundfish FMP was implemented in 1982, and had been amended 17 times as of November 2005. Amendments 18 and 19 are currently in draft form. The West Coast groundfish fishery described in the FMP recognizes four distinct components: limited entry, open access, recreational, and tribal, the latter only in Washington State. Recreational fisheries do not supply fish to the market and so are outside of the scope of this report (except in terms of the stock status of species that are landed commercially). The only rockfish species for which a formal tribal allocation exists is black rockfish, with other allocations decided by annual Council action. The two most important components of the commercial fishery (in terms of overall West Coast quantity and value of landings) are the limited entry and open access fisheries. The limited entry fishery accounts for the vast majority of rockfish catch, as trawlers (both bottom and pelagic) targeting groundfish must have a permit to do so. The program allows the Council to limit the number of vessels in the fishery. Fishers using gear other than trawls (such as longlines and traps) can be part of either the limited entry or the open access sector – groundfish allocations are split between them. The PFMC breaks the West Coast fishing regions geographically into two major management areas: Vancouver-Columbia port complexes in the north, and Eureka-Monterey-Conception complexes in the south. All species but Pacific Ocean perch, widow rockfish, shortbelly rockfish and thornyheads are managed in a single complex, simply called the Sebastes complex. Those species outside of the complex, as well as several others of commercial importance (black, chilipepper, and splitnose rockfish) or of conservation concern (bocaccio, cowcod, yelloweye, and darkblotched rockfish) in the complex, are managed with species-specific landings limits. They must also be separated and identified on fish tickets (receipts). The remaining species in the Sebastes complex are further grouped according to their preferred habitat, and given a group trip limit. For example, bocaccio, chilipepper rockfish, and cowcod are included in the trip limits for ‘minor shelf rockfish,’ which consists of roughly 30 species (28-30 depending on region). Thus, these species are not managed on a species-specific level. Each of the three sectors—limited entry, open access, and recreational—have separate trip limits for the groupings above. Stock assessments Individual and multi-species quotas are imposed based on stock assessment and fishery evaluation reports, which consist of fishery-dependent and/or independent (NMFS surveys) data and published by the regional councils. Once an estimate of biomass is obtained, the allowable biological catch (ABC) and harvest guidelines (HG) are set based upon existing harvest policies. However, stock assessments have only been carried out on the 17 most important (to the fisheries or as a conservation concern) species. Few data are collected on more than 40 of the species, and assessments that are conducted on the others are often still lacking in data, leading to a wide range in biomass estimates. Harvest policy

SeafoodWatch® Rockfish Report June 15, 2009
78
The current harvest policy of F50% for non-overfished rockfish on the US West Coast was set in 2000. It is a precautionary level intended to ensure stocks do not decline below the management threshold of B40%. Harvest rates were considerably higher than this during the 1990s (F35% until 1996 with the passage of the SFA, and F40% in 1998 and 1999), and likely so in the 1980s when ABCs were based simply on the amount of historical catch (Ralston 2002). However, in addition to adopting a scientifically-based harvest policy for the last 15 years, catch has rarely exceeded the ABCs during this time (Figure 49) (Ralston 2002). Thus, the severely depleted state of several rockfish species at the current time may be more to do with a failure of science than of management. As Ralston (2002) points out, “the PFMC used an established ‘rule of thumb’ to set ABCs when they were dealing with stocks that were statistical outliers.”
Figure 49: The relationship between the ABC and the total catch of canary rockfish from 1990 through 2001. Points mark the completion of stock assessments, which resulted in a scientific change in the ABC (Ralston 2002)
Rockfish conservation/rebuilding measures. All seven species of rockfish that have been declared overfished are now on rebuilding plans, a process that is expected to take a half century or more for some species (Table 5). Allowable landings of the overfished species have been drastically reduced (harvest reductions began long before the stocks were put onto rebuilding plans), and are now close to zero for most species (Figure 50). Overall groundfish harvest has been significantly reduced too, to the point that the Council now recognizes the need for sharp reductions in fleet capacity across the entire industry (Groundfish Fishery Strategic Plan, Transition to Sustainability1).
1 http://www.pcouncil.org/groundfish/gfprimer.html
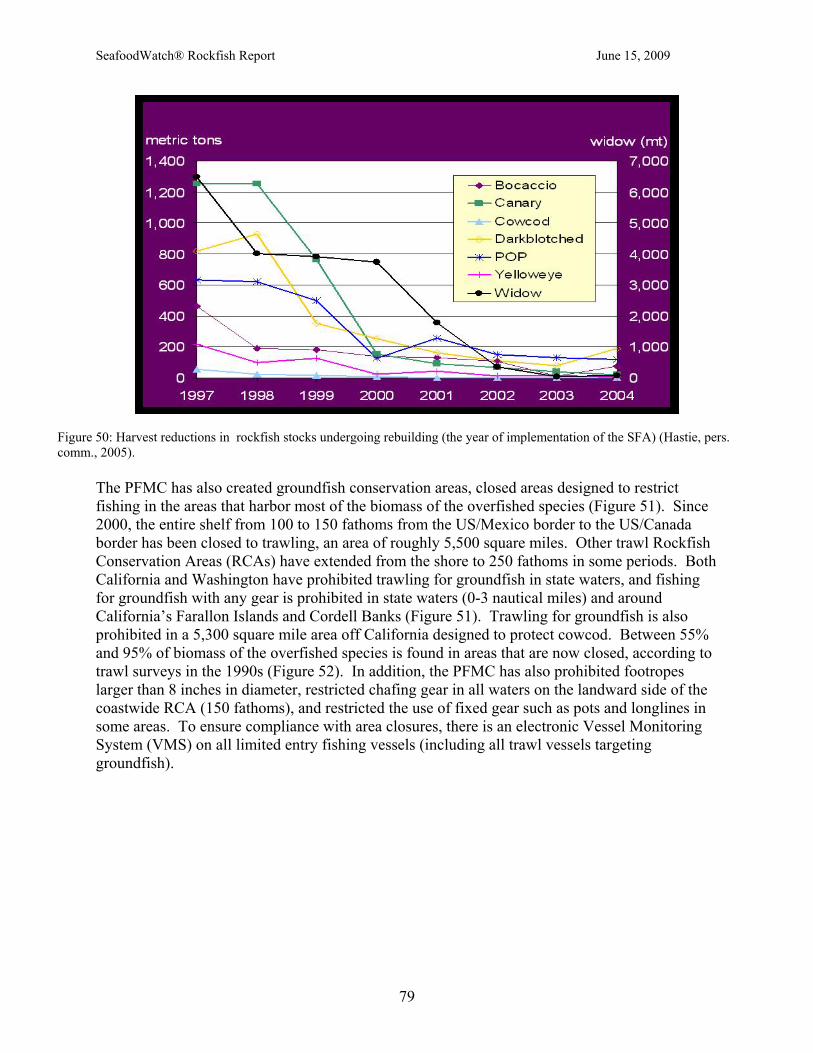
SeafoodWatch® Rockfish Report June 15, 2009
79
Figure 50: Harvest reductions in rockfish stocks undergoing rebuilding (the year of implementation of the SFA) (Hastie, pers. comm., 2005).
The PFMC has also created groundfish conservation areas, closed areas designed to restrict fishing in the areas that harbor most of the biomass of the overfished species (Figure 51). Since 2000, the entire shelf from 100 to 150 fathoms from the US/Mexico border to the US/Canada border has been closed to trawling, an area of roughly 5,500 square miles. Other trawl Rockfish Conservation Areas (RCAs) have extended from the shore to 250 fathoms in some periods. Both California and Washington have prohibited trawling for groundfish in state waters, and fishing for groundfish with any gear is prohibited in state waters (0-3 nautical miles) and around California’s Farallon Islands and Cordell Banks (Figure 51). Trawling for groundfish is also prohibited in a 5,300 square mile area off California designed to protect cowcod. Between 55% and 95% of biomass of the overfished species is found in areas that are now closed, according to trawl surveys in the 1990s (Figure 52). In addition, the PFMC has also prohibited footropes larger than 8 inches in diameter, restricted chafing gear in all waters on the landward side of the coastwide RCA (150 fathoms), and restricted the use of fixed gear such as pots and longlines in some areas. To ensure compliance with area closures, there is an electronic Vessel Monitoring System (VMS) on all limited entry fishing vessels (including all trawl vessels targeting groundfish).

SeafoodWatch® Rockfish Report June 15, 2009
80
Figure 51: Trawl closure areas off the US West Coast (Hastie, pers. comm., 2005). RCA=Rockfish Conservation Area. Trawling is now prohibited in California and Washington state waters, in the coastwide continental shelf RCA (in red) and the Cowcod Conservation Area off California. Trawl ground gear shoreward of the shelf RCA is limited to 8”, that seaward of the RCA is unrestricted.
0%20%40%60%80%
100%
Ling
cod
Wid
ow
Can
ary
POP
Dar
kbltc
h.
Cow
cod
Boc
acci
o
70-170 fm
100-150 fm
Figure 52: Percentage of 1990s trawl survey biomass (CPUE) of depleted rockfish and lingcod within closed depths (Hastie, pers. comm., 2005).
Other measures that have been put into place to reduce bycatch in other fisheries include mandatory bycatch reduction devices in shrimp trawls (pink and ridgeback shrimp trawls managed by state Fish and Game agencies), prohibiting trawl fisheries for spot prawns, and more selective flatfish gear in federal waters. Additional monitoring efforts have also been initiated

SeafoodWatch® Rockfish Report June 15, 2009
81
through the creation of a West Coast (WA/OR/CA) Groundfish Observer Program in 2001, which collects at-sea data on the limited entry trawl and fixed gear fleets, as well as open access nearshore, prawn and shrimp fleets. Vessels that only fish in California or Oregon state waters are also required to have observers under the program (WCGOP 2005). The program provides estimates of discards of rockfish and other groundfish for the purposes of stock assessment and to identify any discard hotspots (50 CFR Part 660 of PFMC 2004). The programs target coverage is 20% of the entire groundfish fishery. Overall, current coverage is about 10-20% (NOP website1), with higher coverage (27% of landings in 2004) in the groundfish trawl fishery (WCGOP 2005). In addition to reducing bycatch, the PFMC (and all other Councils) are required under the SFA to minimize adverse effects on Essential Fish Habitat (EFH) caused by fishing (Fluharty 2000). The PFMC recently (July 5, 2005) set the preferred alternative to be analyzed in the EFH Final Environmental Impact Statement (EIS) (PFMC 20052). If accepted, the alternative would lead to the prohibition of bottom trawl gear in all waters from 0-200 nautical miles (nm) offshore, deeper than 700 fathoms, to curtail the continued expansion of fishing into largely unfished waters. The alternative also limits the use of roller/rockhopper gear to 19 inches, and 8 inches shoreward of 100 fathoms (this regulation is currently in place to reduce bycatch of overfished rockfish, but the alternative would make it permanent and for the purposes of habitat protection). Dredge gear and beam trawls would also be prohibited. It would also encompass and expand areas already restricted to fishing (e.g., currently designated Habitat Areas of Particular Concern) including seamounts, banks, islands, and canyons, and restrict or prohibit bottom gear in these areas. Nearshore rockfish fisheries off the West Coast are regulated by the states. Virtually all nearshore rockfish from commercial fisheries are landed in California and Oregon (2004 data, Appendix 3). Commercial rockfish fishing in Puget Sound has been prohibited since 1994, though tribal and recreational fishing continues (Palsson pers. comm.). Management in California, like federal groundfish management, is separated at 40°10’ North latitude. The nearshore fishery north of this latitude (including Oregon waters) is primarily a black and blue rockfish fishery, whereas the southern fishery is far more diverse. The California Department of Fish and Game (CDFG) manages nearshore rockfish landings through cumulative trip limits, 90-95% of which are allotted to the limited entry and open access fixed gear fisheries (the remainder is a bycatch allotment in the limited entry selective flatfish trawl fishery in the north and the limited entry small footrope trawl fishery in the south). These trip limits are not species-specific, with limits being placed instead on groups of species (i.e., black and blue rockfish, shallow nearshore rockfish, and deeper nearshore rockfish). Additional regulations include localized gear restrictions, area and time closures (the latter only for the southern fishery), and minimum size limits3. The Oregon Department of Fish and Game (ODFG) manages nearshore rockfish fisheries through a limited entry permit program. The diversity of nearshore rockfish caught off Oregon is
1 http://www.st.nmfs.gov/st4/nop/regions/WestcoastGroundfish.html 2 The full title of this document is the Pacific Coast Groundfish Fishery Management Plan (FMP) Essential Fish Habitat (EFH) Designation and Minimization of Adverse Impacts Final Environmental Impact Statement (FEIS), available at http://www.pcouncil.org/groundfish/gfefheis/pfmc_efheis_pa.pdf 3 http://www.dfg.ca.gov/mrd/bfregs2005commercial.html; http://www.dfg.ca.gov/licensing/commercial/CommercialDigest.htm

SeafoodWatch® Rockfish Report June 15, 2009
82
considerably less than off California, with black rockfish comprising nearly 90% of the nearshore rockfish catch in 2004 (Appendix 3). Permits are thus separated into black-blue permits with very limited allowed landings of other nearshore rockfish, and black-blue permits with a nearshore endorsement allowing higher landings of cabezon, greenling and other nearshore rockfish. Catch is regulated through cumulative two-month trip limits, separated between these different permit types. Enforcement in the fishery is provided through a logbook program and the West Coast Groundfish Observer Program (WCGOP). Additional regulations include gear restrictions and size limits for some species1. Alaska Alaskan groundfish stocks, including rockfish, are managed under two separate groundfish FMPs. All BSAI finfish stocks except salmonids are managed under the BSAI Groundfish FMP, which has been updated 70 times since being implemented in 1982, most recently in January 2005 (NPFMC 2005a). Gulf of Alaska (GOA) groundfish are managed under the 1978 GOA Groundfish FMP, which was also most recently updated in January 2005 (NPFMC 2005b). The GOA and BSAI differ in their history of fishery development, bathymetry, oceanography, target species, and composition of commercial catch. Stocks of common groundfish species in the GOA and BSAI are believed to be distinct from each other (DiCosimo et al. 2005); however, such large management areas may not correspond to the proper spatial scale of rockfish populations (AMCC 2004). Within the BSAI and GOA regions, rockfish are generally grouped together in complexes or assemblages based on their habitat, distribution, and commercial catch composition (DiCosimo et al. 2005). In both regions the four most valuable and highly sought after slope species—POP, and northern, shortraker and rougheye rockfish—are managed separately (NPFMC 2005a-b), while all other slope species are managed in complexes. In the BSAI, all other slope species (28 including thornyheads, though only eight are actually managed) are grouped into a single ‘Other Rockfish’ complex. In the GOA, shortspine and longspine thornyhead are grouped into a single ‘Thornyheads’ complex, and the remaining rockfish into the three groupings of Slope Rockfish, Demersal Shelf Rockfish, and Pelagic Shelf Rockfish, as shown in Table 8.
Table 8: Species assemblages for rockfish species in the GOA.
Slope Rockfish* Demersal Shelf Rockfish Pelagic Shelf Rockfish Aurora Blackgill Boccacio Chilipepper Darkblotched Greenstriped Harlequin Pygmy
Redstripe Sharpchin Shortbelly Silvergrey Splitnose Stripetail Vermilion Yellowmouth
Canary China Copper Quillback Redbanded Rosethorn Tiger Yelloweye
Dusky Dark Widow Yellowtail
*Slope rockfish also include northern rockfish in the eastern GOA and Demersal Shelf Rockfish in the western and central GOA.
1 http://www.dfw.state.or.us/MRP/regulations/commercial_fishing/blackblue_factsheet121003.pdf; http://www.dfw.state.or.us/fish/commercial/2005_commercial.pdf

SeafoodWatch® Rockfish Report June 15, 2009
83
Stock assessments are conducted regularly for rockfish using both fisheries-dependent and independent data from the rockfish fisheries and bycatch data from other fisheries. Species-specific age-structured assessments are conducted for POP, and northern, dusky and rougheye rockfish or based on the abundance of the species that comprises the majority of the catch in each of the complexes. For example, biomass estimates are based on shortspine thornyhead for the GOA Thornyheads complex and BSAI Other Rockfish complex, and on yelloweye rockfish for the GOA Demersal Shelf Rockfish complex (NPFMC 2005a-b). However, information is so limited on most species that it is not possible to determine overfished thresholds for any rockfish populations except POP and northern rockfish, in both the BSAI and GOA, and dusky (part of the Pelagic Shelf Rockfish complex) and rougheye rockfish, only in the GOA1. In lieu of reference biomass levels, ABCs for other species are calculated from the average biomass estimates from recent trawl surveys. They are then set for the entire complex (e.g., GOA pelagic shelf rockfish other than dusky rockfish and GOA slope rockfish other than thornyheads), or based on the ABC for the main component of the complex (e.g., the total ABC for the Demersal Shelf Rockfish complex is 110% of the ABC for yelloweye rockfish). The NPFMC then recommends annual harvest levels (TACs) based on the ABCs for each species or assemblage after considering other factors such as bycatch and economics (DiCosimo et al. 2005). Harvest levels are apportioned between the East, Central and West GOA for GOA POP, northern rockfish, and pelagic shelf rockfish, and for the entire GOA for shortraker, rougheye, and other slope rockfish, and demersal shelf rockfish (Hanselman et al. 2004; Courtney et al. 2004; Lunsford et al. 2004). In the BSAI, rockfish are primarily assessed and managed at the BSAI level, although some species are assigned harvest quotas in the eastern Bering Sea and Aleutian Islands region (NPFMC 2005a). The Demersal Shelf Rockfish complex is managed by the state of Alaska, but the NPFMC still sets the GOA-wide TAC for the complex (NPFMC 2005b). The PFMC, NMFS, and the ADFG regulate harvests and discards through the use of time/area closures and maximum retention allowances to ensure that TACs have not been exceeded. Logbooks and a mandatory observer program for vessels over 60 feet allow managers to monitor catch. Once catches of any given species reaches the TAC, all fisheries catching that species are closed. Full retention of demersal shelf rockfish was recently implemented to ascertain bycatch rates (DiCosimo et al. 2005). State regulations are in addition to and stricter than federal regulations, and can include in-season adjustments, seasonal apportionment of quotas, gear specifications and trip limits (NPFMC 2005b). The Sustainable Fisheries Act (SFA) of 1996 requires fishery management councils to minimize adverse effects on EFH caused by fishing (Fluharty 2000). Although bottom trawling continues across much of the continental shelf and slope, there are some efforts to reduce damage to some habitats, particularly that of deep-sea corals in the North Pacific. Due to their patchy and largely unknown distribution in the northeast Pacific, as well as their importance to groundfish populations (for habitat use), Alaskan fishers proposed a ban on trawling in a 97,415 km2 area around southeast Alaska (Witherell and Coon 2000). This regulation was adopted by the NPFMC as part of the Groundfish FMP and has been in effect since 1998. In addition, a marine reserve near Sitka, Alaska prohibits all bottom-fishing gear types in a 5.7 km2 area, which has been shown to contain high relief habitat for rockfish and lingcod (Witherell and Coon 2000). 1 The BMSY proxy for POP, northern rockfish and the Pelagic Shelf Rockfish complex is B35%, and the overfished threshold is half of B35%. The overfishing threshold for these stocks is F35%.

SeafoodWatch® Rockfish Report June 15, 2009
84
In February 2005, the NPFMC voted to close much wider swathes of habitat to bottom gear as part of the EFH protection requirements of the SFA. In the Aleutians, the NPFMC has designated core fishing grounds as open to bottom trawling while closing areas that are currently of no commercial importance to the fleet, to prevent continued expansion of the trawl fleet into areas not yet fished in earnest. The closures include 60% of fishable waters (less than 1000 m depth) closed to bottom trawlers, and six sites encompassing an area totaling 110 nm2 to all bottom fishing, including longlines, pots, and trawls. These six sites have been identified as having highly complex coral and sponge gardens, which are important to the biodiversity of the area (NMFS 2004). In the Gulf of Alaska (GOA), ten sites along the GOA slope will be closed. These sites span depths from 200 to 1000 m and are thought to be important to rockfish, corals, and other seafloor organisms. The total closure encompassed by these sites is 2086 nm2. No EFH measures have yet been taken for the Bering Sea, but the NPFMC did vote to initiate a new analysis of approaches to protect and conserve EFH in the region (NMFS 2004). Black and blue rockfish were removed from the GOA Pelagic Shelf Rockfish complex in 1998. Since that time, fisheries for these species in both state and federal waters (except the Aleutian Islands where the state manages these fisheries out to 3 nm) have been regulated by the State of Alaska, ostensibly to provide for more responsive management and to prevent localized overfishing of these stocks (DiCosimo et al. 2005). Measures currently in place include gear restrictions (only hand troll and mechanical jigs are permitted), logbook requirements, area closures (including in-season, and short notice closures), and bycatch retention restrictions. In addition, guideline harvest limits (GHLs) have been set at 75% of the average production from 1978-1995. These GHLs combine black and blue rockfish in the Southeast Alaska directed black rockfish fishery (not in other Alaskan black rockfish fisheries), which could potentially mask declines in blue rockfish. Once GHLs are met (they have been exceeded in some localities in the past few years) the fisheries are closed. Trip limits are also used in some black rockfish fisheries (Mattes and Failor-Rounds 2005; ADFG 2005). However, no assessment has been conducted on black rockfish since 1997 (i.e., before the state started managing the stocks). An updated assessment is due to be conducted in 2006, but no assessment of blue rockfish is planned. Canada Canadian rockfish fisheries are managed by the Department of Fisheries and Oceans, Canada (DFO) under integrated multi-species groundfish fishery management plans, consistent with national policies provided by the Oceans Act, the Fisheries Act, the Department of Fisheries and Oceans Act and other applicable laws. The department monitors the fishery, conducts stock assessments, and, where possible, collects fisheries-independent data. Assessments are reviewed through the Pacific Scientific Advice Review Committee (PSARC) process. Biological and fishery data collection is carried out through fishery dependent measures (fisher logs, observer logs, dockside monitoring, and unloading receipts) and fishery independent surveys (DFO 2005b). TAC levels are based on DFO’s scientific advice and management advice provided by the industry through the Groundfish Trawl Advisory Committee (GTAC). Total landed annual harvest of groundfish in the commercial fishery is to be plus or minus 30% of established TACs. TACs are species-specific for the 12 most commercially-valuable species, and complex-specific

SeafoodWatch® Rockfish Report June 15, 2009
85
for nearshore rockfish (quillback, copper, China, tiger). Landings of all non-TAC rockfish combined are limited to 15,000 lbs per trip. Since 2001, the trawl and hook-and-line fisheries (including the Pacific halibut fishery) have allocated the total TACs and trip limits between themselves, based on those species caught most often with the different gears and allowing for a certain level of rockfish bycatch in the different fisheries. Most of the TAC for nearshore rockfish is given to the hook-and-line fisheries, while most of the TAC for slope species is given to the trawl fishery. The total TAC is also divided up by management area. Total catch is managed so that it falls within plus or minus 30% of established TACs. Trawl vessels that exceed catch by 30% of their area-specific quota are restricted to mid-water trawling in that area for the remainder of the year or until sufficient quota from another vessel has been transferred to cover the overages. Catch reporting and validation is carried out through the mandatory use of vessel logbooks, a 100% coverage dock monitoring program, and a comprehensive at-sea observation program (DFO 2005b). The groundfish trawl fishery is managed under an annually-updated Groundfish Trawl FMP using a fully transferable Individual Vessel Quota (IVQ) system. The vessels are regulated according to where they choose to fish. A small fleet of 13 vessels fishes in nearshore waters primarily for flatfish and cabezon for the Vancouver live market (groundfish trawl Option B), while the rest of the fleet fishes in outside waters for others species, including rockfish (Option A) (DFO 2005b). Landings in groundfish trawl Option B are 100% verified through the dockside management program, and the fleet is subject to 10% observer coverage (DFO 2005b). The Option A fishery has 100% observer coverage (for bottom trawls and most midwater trawls) and 100% dockside monitoring, allowing all catch (landings plus discards) to be enumerated. No retention of Pacific halibut, salmon, Pacific herring, sturgeon, or wolf eel is permitted for the groundfish trawl fleet. All groundfish bottom trawls are subject to gear restrictions, including minimum mesh sizes, escape hatches for the release of unwanted fish, and size limitations on chafing gear (DFO 2005b). The overall discard rates in the BC bottom trawl fishery appear considerably lower than for the US West Coast fishery, despite the two fisheries generally catching the same suite of species (Branch et al. 2004; DFO 2005). Branch et al. (2004), in a direct comparison of BC and US West Coast bottom trawl fisheries, reported discard rates of 74% and 45% for the US West Coast fishery in 2001/2002 and 2002/2003, respectively. The discard rate in the BC fishery may be half (or even less) that observed in the US West Coast fishery (although the WCGOP and DFO data obtained by SFW suggest far more comparable discard rates between the two fisheries in 2004). Several reasons have been put forward to explain this apparent better discard rate in the BC fishery. The first is the mandatory 100% observer coverage in the BC groundfish trawl fishery, which allows for better accounting and has slowly removed illegal elements from the fishery (partly as a result, total catch has also declined considerably). Additionally, improvements in at-sea processing and the creation of new markets have led to fishers being able to make use of a larger proportion of the catch, so species like arrowtooth flounder are now landed more often (arrowtooth flounder are now used as food fish) (Jeff Fargo, DFO, pers. comm.). The fishery has also become more selective, and is likely to continue to become so through the use of technologies such as in-trawl video monitoring of the catch and associated automatic-opening codend technologies, which allow fishers to monitor what is being caught at any given time and release it before it is brought to the surface. Only a handful of the approximately 70-80 vessels

SeafoodWatch® Rockfish Report June 15, 2009
86
actually fishing use the technologies at the moment, but a larger proportion of the fleet is likely to adopt these technologies in the future (Jeff Fargo, DFO, pers. comm.). However, the biggest reason discard rates have declined in the BC fishery and are now (probably) substantially lower than in the US West Coast fishery is likely the Individual Vessel Quota system in place in the BC groundfish trawl fleet. This system not only sets quotas for target species, but also for commercially-important incidental catch species (Branch et al. 2004; Jeff Fargo, DFO, pers. comm.). The requirement that fishers stop fishing if bycatch quotas are met has provided additional incentive to ensure the catch is as clean as possible (at least for commercially important species), and by removing the direct at-sea competition for fish, the system has also allowed fishers to take more time to be more selective (by moving to a different area, for example) (Jeff Fargo, DFO, pers. comm.). Hook-and-line fisheries (including bottom longlines) are separated into those inside the Strait of Georgia, Juan de Fuca Strait, and Johnstone Strait (“Inside” fisheries), and all other fisheries outside these straits (“Outside” fisheries). The DFO is also planning on implementing mandatory 100% observer coverage in the entire hook-and-line fleet (including longlines) in 2006. The current dockside monitoring program also covers 100% of the fleet (DFO 2005c-d). Both Canada and the US collaborate to manage straddling groundfish stocks through the Canada-U.S. Groundfish Committee1. The purpose of the committee is to exchange information on the status of groundfish stocks of mutual concern, coordinate, whenever possible, desirable programs of research, and implement recommended management measures (DFO 2005b). To protect critical habitat, the DFO has designated certain areas off limits to fishing (Marine Protected Areas) and implemented measures to preserve four unique sponge reefs located in waters off central and northern BC2. These sponge reefs provide habitat for a variety of invertebrate and fish species and cover nearly 1,000 km2 of seabed in eastern Queen Charlotte Sound and Hecate Strait (DFO 2005b). Due to the fragile skeleton nature of the reefs, sponge skeletons are likely damaged or destroyed by trawling activity. Effective July 19, 2002, groundfish trawl fishing around the four sponge reef areas was closed by the DFO, a move supported by the industry (DFO 2005b). To provide protected areas for inshore groundfish, the DFO also restricted fishing in 89 other areas in August 2004. Any fishing activity that causes rockfish mortality is restricted in these Rockfish Conservation Areas (RCAs). In particular, all bottom trawling (except for scallops) and bottom longlining is prohibited (DFO 2005b). In all, approximately 20% of nearshore rockfish habitat in outside waters has been protected, and 30% of nearshore rockfish habitat in inside waters is currently being considered by the DFO (to be in effect beginning April 1, 2006). Synthesis Management of rockfish stocks on the West Coast is carried out by the Pacific Fishery Management Council (PFMC) and in Alaska by the North Pacific Fishery Management Council (NPFMC). State management of commercial rockfish fisheries is typically designed to complement federal regulations. BC rockfish stocks are managed by the Department of Fisheries and Oceans, Canada (DFO). While assessment and monitoring is carried out by all authorities 1 http://www.psmfc.org/tsc/ 2 http://www.pgc.nrcan.gc.ca/marine/sponge/index_e.htm

SeafoodWatch® Rockfish Report June 15, 2009
87
on the most commercially-important stocks, little information is gathered on the majority of the remaining stocks, so stock status is unknown for the majority of rockfish species. In addition, BC stocks have generally not been assessed since 1999/2000 (bocaccio in 2004 and an update for silvergrey rockfish in 2002 are the exceptions), despite several stocks showing declines when assessments were last conducted. Several West Coast/BC shelf and slope stocks are at extremely low biomass after decades of overfishing. The PFMC implemented severe (in terms of their effects on fishing communities) management measures after the passage of the SFA in 1996 to rebuild these stocks, but even so they are not likely to be back at the BMSY proxy target for many decades. Quotas of many groundfish species have been severely reduced due to bycatch of depleted rockfish, and fishing has been restricted in some of the largest areas ever in US waters to protect these overfished populations. Gear restrictions are in place on the entire West Coast continental shelf, including California and Washington state waters. Quotas and trip limits are enforced with a logbook program and the West Coast Groundfish Observer Program (WCGOP), the latter of which also allows managers to better measure discards and thus improve stock assessments. As a result (perhaps in combination with an improvement in recruitment rates due to beneficial changes in environmental conditions) the depleted rockfish stocks are beginning to show signs of recovery. Such trends are clearly encouraging, but are very short-term (3 or 4 years) for these extremely long lived species whose stock biomass remains under 10% of unfished biomass for some stocks. A management rank of fully effective would be premature in these cases, especially when combined with concerns over the lack of assessments for many other rockfish stocks. Thus, US West Coast shelf and slope rockfish management is deemed moderately effective by Seafood Watch®. US West Coast nearshore rockfish fishery management is primarily conducted by the states, although the PFMC conducts stock assessments. Nearshore landings are primarily made in Oregon and California; both these states regulate their fisheries through cumulative trip limits with logbook and observer programs (i.e., WCGOP) in place for enforcement purposes. Additional regulations include localized gear restrictions, size limits for some species, and area/time closures. Assessments have been conducted for only a few commercially-important stocks, including black and gopher rockfish. The status of the remaining Sebastes populations (there are over 60 Sebastes species in southern California waters) is unknown, though few are landed in large quantities by the commercial fishery, and all (except quillback rockfish) are relatively fast-growing and resilient to fishing pressure. None of the seven depleted rockfish species off the West Coast are nearshore species. Management of the nearshore West Coast fisheries is therefore deemed highly effective by Seafood Watch®. The BC fishery has traditionally been managed with cumulative landings limits similar to those still in place for the US West Coast groundfish fishery. Full mortality accounting (whereby discard mortality of marketable fish was deducted from landing limits) and 100% observer coverage (for the bottom trawl fishery) were implemented in 1996. The DFO then moved the fishery to a full Individual Vessel Quota system in 1997. Under this system, all vessels have individual catch limits, known as Individual Transferable Quotas (ITQs), which can be bought or sold and include discard mortality of marketable fish. Some ITQs are coastwide, while others are subdivided among smaller management areas. Fishers who have met their quota in target or discard species (of the 24 species and one species group covered by the ITQ system) are restricted to midwater trawling for the remainder of the year unless they can trade for additional quota with other fishers. The system (along with other factors like the creation of new markets)
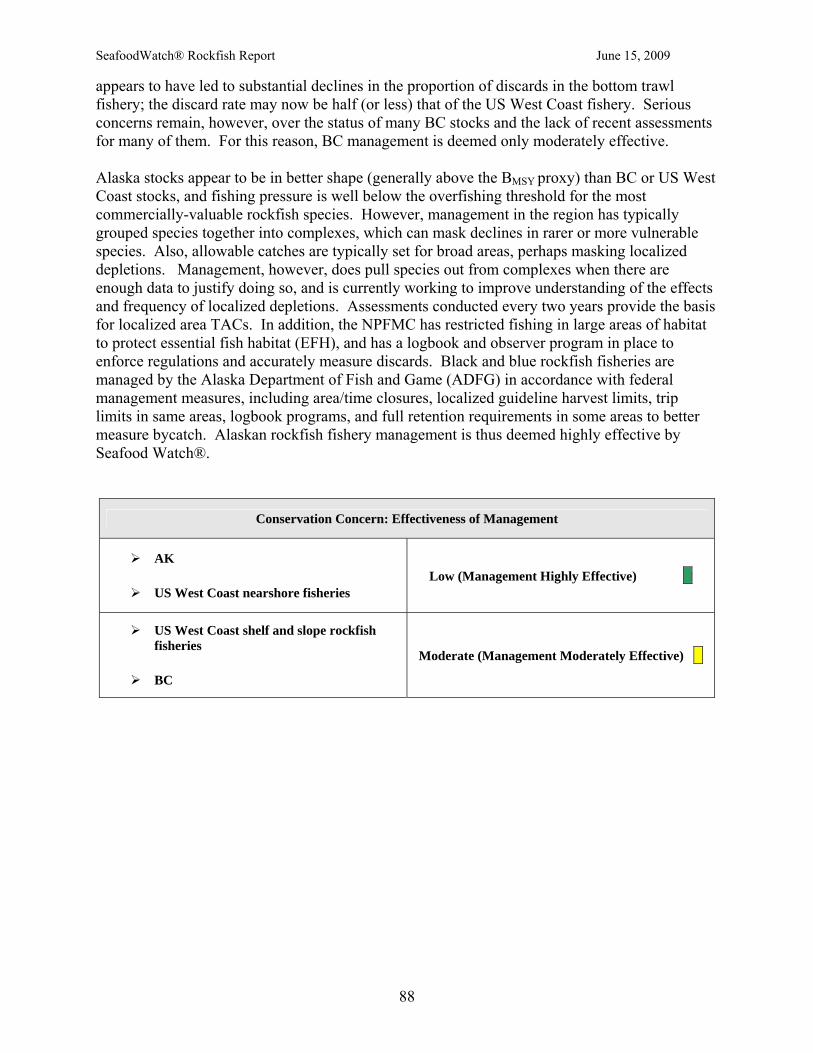
SeafoodWatch® Rockfish Report June 15, 2009
88
appears to have led to substantial declines in the proportion of discards in the bottom trawl fishery; the discard rate may now be half (or less) that of the US West Coast fishery. Serious concerns remain, however, over the status of many BC stocks and the lack of recent assessments for many of them. For this reason, BC management is deemed only moderately effective. Alaska stocks appear to be in better shape (generally above the BMSY proxy) than BC or US West Coast stocks, and fishing pressure is well below the overfishing threshold for the most commercially-valuable rockfish species. However, management in the region has typically grouped species together into complexes, which can mask declines in rarer or more vulnerable species. Also, allowable catches are typically set for broad areas, perhaps masking localized depletions. Management, however, does pull species out from complexes when there are enough data to justify doing so, and is currently working to improve understanding of the effects and frequency of localized depletions. Assessments conducted every two years provide the basis for localized area TACs. In addition, the NPFMC has restricted fishing in large areas of habitat to protect essential fish habitat (EFH), and has a logbook and observer program in place to enforce regulations and accurately measure discards. Black and blue rockfish fisheries are managed by the Alaska Department of Fish and Game (ADFG) in accordance with federal management measures, including area/time closures, localized guideline harvest limits, trip limits in same areas, logbook programs, and full retention requirements in some areas to better measure bycatch. Alaskan rockfish fishery management is thus deemed highly effective by Seafood Watch®.
Conservation Concern: Effectiveness of Management
AK
US West Coast nearshore fisheries Low (Management Highly Effective)
US West Coast shelf and slope rockfish fisheries
BC
Moderate (Management Moderately Effective)

SeafoodWatch® Rockfish Report June 15, 2009
89
Overall Evaluation and Seafood Recommendation Inherent vulnerability Most shelf and slope rockfish are slow-growing and late-maturing, while southern Californian and nearshore species tend to be faster-growing and shorter-lived (at least for rockfish). Many rockfish species exhibit behaviors that increase their vulnerability to fishing, such as site fidelity and obligatory habitat use, the formation of multispecies aggregations, poor recruitment cycles of many years, almost certain death upon hauling due to air embolism (except for thornyheads), and increased spawning potential with age and size. In addition, the range of most rockfish is limited, and many are unique to southern California waters. With the exception of the long-lived quillback rockfish (especially in more northern waters), nearshore species tend to be faster-growing and shorter-lived than shelf and slope species, and so are relatively more resilient to fishing. Following this analysis, all shelf and slope rockfish and quillback rockfish are deemed inherently vulnerable to fishing, while all other nearshore species are deemed inherently neutral. Stock status Of the at least 60 species of rockfish found off the Pacific coast of the US and Canada, less than a third have had their stocks assessed. Those that have been assessed are typically the most commercially or recreationally-important species or those deemed to be a conservation concern by managers. The stock status of the majority of rockfish species is therefore unknown, and even the stock status of most of those that have been assessed is quite uncertain due to a paucity of basic life history and stock structure information. Of those stocks off the US West Coast and British Columbia for which assessments have been completed, many are depleted due to decades of heavy fishing pressure and 20 years of poor recruitment. Seven West Coast shelf and slope stocks were declared overfished after the passage of the SFA, some of which were at 10% or less of unfished biomass (bocaccio, cowcod, and the northern California stock of yelloweye rockfish). All of these species were put on rebuilding plans in the last few years, and all have shown small increases in biomass. The only stocks on the West Coast that have been assessed and are currently above the BMSY proxy and thus deemed healthy are the main stock for yellowtail rockfish and the stocks for shortspine and longspine thornyhead. Several commercially important shelf and slope rockfish stocks in BC fisheries are also of serious concern, with six species (silvergrey, darkblotched, widow, yellowtail, and yellowmouth rockfish and shortspine thornyhead) currently on the highest priority list for analysis by COSEWIC. In contrast, Alaskan stocks appear to be in better condition than those in BC and US West Coast waters. The two main rockfish species targeted in Alaska, POP and northern rockfish, are currently above the BMSY proxy and not experiencing overfishing. With the exception of Strait of Georgia/Juan de Fuca Strait stocks (BC) and Puget Sound stocks (WA), the few assessments conducted on nearshore rockfish indicate that they are in better condition than most shelf and slope stocks. However, rockfish species tend to co-occur with other rockfish species, making catching a single species very difficult. For example, Pacific Ocean perch co-occurs with other slope rockfish, including darkblotched, splitnose, yellowmouth, and sharpchin rockfish off the West Coast, as well as northern, shortraker, and rougheye rockfish in the GOA. Similarly, yellowtail rockfish co-occurs with canary, widow, and several other rockfishes. Thornyheads are

SeafoodWatch® Rockfish Report June 15, 2009
90
an exception to this rule, however, as shortspine and longspine thornyheads occur together but not with Sebastes rockfish species. Following the above analysis, Seafood Watch® has constrained stock status ranking by the status of the stock in worst condition in a complex. As such, thornyhead rockfish stocks and black rockfish off the West Coast are deemed a low conservation concern; all Alaskan stocks, BC nearshore stocks outside of the Strait of Georgia/Juan de Fuca Strait, and US nearshore stocks other than in Puget Sound are ranked a moderate conservation concern; and all other rockfish stocks are deemed a high conservation concern. Bycatch Groundfish trawl fisheries off Alaska, BC, and the US West Coast have a discard rate of 12% (BSAI rockfish fishery) to 33% (West Coast limited entry groundfish fisheries) of the retained catch. Bycatch rates in the midwater trawl component of these fisheries (or separate midwater trawl fisheries) appear to be far lower than in the bottom trawl fisheries. Data indicate a discard rate of approximately 1% for the BC midwater trawl fishery, and other studies indicate comparable rates for other US and Canadian Pacific fisheries. The broad-scale bycatch rate in bottom longline fisheries is approximately 30% for groundfish longline fisheries. In addition, concerns remain over the regular bycatch of seabirds in Alaskan bottom longline fisheries, and to a lesser extent, the BC bottom longline fisheries. Fisheries using hook-and-line gear (including handlines, jigs, and rod-and-reel gear) typically have a low discard rate, although the actual rate varies considerably between fisheries (0-15% of the retained catch for the fisheries examined in this report). However, the open access nearshore fishery off central/southern California (south of 40°10’ N. latitude) has a much higher rate of discard, at approximately 47% of the retained catch. Bycatch is therefore deemed a low conservation concern in all hook-and-line fisheries except the central/southern California fishery, for which it is deemed a moderate conservation concern. Bycatch is also a low conservation concern in the midwater trawl fishery. Bycatch in all longline and bottom trawl fisheries is ranked a moderate conservation concern. Habitat and ecosystem impacts Bottom trawling damages the hardbottom, structurally complex, seafloor habitat that most adult Sebastes rockfish inhabit. Damage to sensitive habitats such as these has been shown to reduce the diversity and abundance of associated species, including commercially valuable fishes. The impacts of bottom trawling on the deep water, muddy habitats, in which dwell shortspine and longspine thornyheads, are still severe, albeit less so than in hard bottom habitat. Although fixed gear such as bottom longlines and pots have less of an impact on the bottom habitat, they do come into contact with the seafloor, and still likely have a moderate impact on most rockfish habitat. Midwater trawls also likely have moderate habitat impacts, due to the intermittent dragging of the otter doors over the seabed. Gears, such as hook-and-line, that are typically not in contact with the ocean bottom cause minimal habitat damage. The ecosystem effects of removing large quantities of groundfish from the BSAI and GOA have been examined, although there is not sufficient evidence that this factor alone has resulted in the decline of Steller sea lions. In addition, the relatively large fisheries for pollock and Pacific cod more likely impact Steller sea lions than those for rockfish.

SeafoodWatch® Rockfish Report June 15, 2009
91
Overall, bottom trawls are thought to have severe habitat and ecosystem effects; bottom longlines, pots, and midwater trawls have moderate habitat and ecosystem effects; and hook-and-line gears other than longlines have minimal habitat effects. Management Management of rockfish stocks is carried out by the Pacific Fishery Management Council on the West Coast and the North Pacific Fishery Management Council in Alaska. State management of commercial rockfish fisheries is typically designed to complement federal regulations. The Department of Fisheries and Oceans, Canada manages the BC stocks. While assessment and monitoring is carried out by all authorities on the most commercially-important stocks, little information is gathered on the majority of the remaining stocks, so stock status is unknown for the majority of rockfish species. In addition, BC stocks have generally not been assessed since 1999/2000 (bocaccio in 2004 and an update for silvergrey rockfish in 2002 are the exceptions), despite several stocks showing declines when assessments were last conducted. Several West Coast/BC shelf and slope stocks are at extremely low biomass after decades of overfishing. These stocks are showing signs of improvement after the severe (in terms of their effects on fishing communities) management measures implemented to rebuild these stocks were implemented after the passage of the SFA, but they are still not likely to be back at the BMSY proxy target for many decades. It is too early to tell if these trends are set to continue, and until then US West Coast shelf and slope rockfish management is deemed moderately effective by Seafood Watch®. BC management is through an IVQ system and 100% observer coverage, which allows very accurate accounting of landings and discards. Discard rates for BC fisheries appear to have declined substantially with the new system and may be much lower than off the US West Coast; however, the poor status of many of the stocks and the lack of recent stock assessments in particular is a serious concern. BC management is thus also deemed moderately effective. US West Coast nearshore rockfish landings are primarily made in Oregon and California; both of these states regulate their fisheries through cumulative trip limits with logbook and observer programs (i.e., WCGOP) in place for enforcement purposes. Assessments have been conducted for only a few commercially important stocks, including black rockfish and gopher rockfish. The status of the remaining Sebastes populations (there are over 60 Sebastes species in southern California waters) is unknown. None of the seven depleted rockfish species off the West Coast are nearshore species. Management of the nearshore West Coast fisheries is therefore deemed highly effective by Seafood Watch®. Alaska stocks appear to be in better shape (generally above the BMSY proxy) than those in BC or the US West Coast, and fishing pressure is well below the overfishing threshold for the most commercially-valuable species; however, management in the region has typically grouped species together into complexes, which can mask declines in rarer or more vulnerable species. Also, allowable catches are typically set for broad areas, perhaps masking localized depletions. Management does, however, pull out species from complexes when there are enough data to justify doing so, and is currently working to improve understanding of the effects and frequency of localized depletions. Assessments conducted every two years provide the basis for localized area TACs. Black and blue rockfish fisheries are managed by the Alaska Department of Fish and Game in accordance with federal management measures. Alaskan rockfish fishery management is thus deemed highly effective by Seafood Watch®.

SeafoodWatch® Rockfish Report June 15, 2009
92
Synthesis The rankings for each criterion are summarized below, in separate tables for shelf and slope fisheries and nearshore fisheries. Rankings are made based on the species landed as detailed in Appendix 1 through Appendix 3. For example, the Puget Sound fishery landed very little rockfish in 2004, and the “Inside” Strait of Georgia fishery accounts for only about 20% of nearshore rockfish landings in BC. These are thus omitted from the summary ranking tables below. Also, the BC nearshore rockfish fishery targets primarily quillback and copper rockfish, the former of which has a life history more similar to the shelf and slope species than the faster growing nearshore species. Shelf and slope species Shelf and slope species include Pacific Ocean perch, northern rockfish, yelloweye rockfish, yellowtail rockfish, blackgill rockfish, darkblotched rockfish, rougheye rockfish, shortraker rockfish, canary rockfish, chilipepper rockfish, and bocaccio. Trawls account for the vast majority of shelf and slope rockfish landings. Bottom longlines targeting shortraker rockfish, rougheye rockfish, thornyheads, redbanded rockfish, and silvergrey rockfish account for almost all of the remaining landings. Pelagic species (primarily yelloweye rockfish) are also landed with mechanical jigs in Alaska.
Conservation Concern Sustainability Criteria Low Moderate High Critical Inherent Vulnerability √
Status of Stocks √ WC thorny-heads √ AK
√ WC except thornyheads
√ BC
Nature of Bycatch √ Midwater trawl √ AK Jig
√ Bottom trawl √ Bottom longline
Habitat Effects √ AK Jig √ Bottom longline √ Midwater trawl √ Bottom trawl
Management Effectiveness √ AK √ WC
√ BC
Nearshore species Nearshore fisheries are typically distinct from those targeting shelf and slope species, and management is at least partly conducted by the states. Nearshore species include black rockfish, blue rockfish, brown rockfish, China rockfish, copper rockfish, gopher rockfish and quillback rockfish. Bottom longlines are used almost exclusively to land nearshore rockfish in Alaska. The main gears used to land nearshore rockfish in BC are bottom longlines (30% in 2004) and other hook-and-line gears (60% in 2004). A major component (44% in 2004) of the landed catch in BC is quillback rockfish, a species with a life history more akin to a shelf or slope species than many other nearshore species. Bottom trawls also account for a substantial portion of black rockfish landings in BC (10% of total nearshore rockfish landings in 2004). The northern US West Coast nearshore rockfish fishery primarily targets black rockfish with hook-and-line gear other than bottom longlines, while the southern fishery is far more diverse, both in terms of the species caught and the gears used.

SeafoodWatch® Rockfish Report June 15, 2009
93
Conservation Concern Sustainability Criteria Low Moderate High Critical
Inherent Vulnerability √ all nearshore species except
quillback √ quillback
Status of Stocks √ WC Black rockfish
√ US except black rockfish and Puget
Sound stocks √ BC nearshore “outside” stocks
√ BC nearshore “inside” stocks √ Puget Sound stocks
Nature of Bycatch
√ All hook and line (not bottom longline) except southern WC nearshore
fishery √ Midwater trawl
√ Southern WC hook and line √ Bottom trawl
√ Bottom longline
Habitat Effects √ Hook-and-line √ Bottom longline √ Midwater trawl
√ Bottom trawl
Management Effectiveness √ US √ BC
US = US West Coast and Alaska; BC = British Columbia; AK = Alaska; WC = West Coast; Southern WC = Nearshore mixed gear fishery south of 40º10”. About the Overall Seafood Recommendation:
• A seafood product is ranked “Avoid” if two or more criteria are of High Conservation Concern (red) OR if one or more criteria are of Critical Conservation Concern (black) in the table above.
• A seafood product is ranked “Good Alternative” if the five criteria “average” to yellow (Moderate Conservation Concern) OR if the “Status of Stocks” and “Management Effectiveness” criteria are both of Moderate Conservation Concern.
• A seafood product is ranked “Best Choice” if three or more criteria are of Low Conservation Concern (green) and the remaining criteria are not of High or Critical Conservation Concern.

SeafoodWatch® Rockfish Report June 15, 2009
94
Overall Seafood Recommendation for Rockfish
US West Coast black rockfish
AK hook and line caught nearshore rockfish (except quillback)
Best Choice
AK jig, bottom longline, or midwater trawl slope/shelf rockfish and quillback rockfish
AK nearshore rockfish, except quillback (all gear)
Quillback rockfish from BC outside waters and US West Coast (except bottom trawl)
US West Coast nearshore (except Puget Sound and quillback) and BC nearshore outside waters rockfish, bottom-trawl caught
US West Coast thornyheads (except bottom trawled)
Hook-and-line, bottom longline, and midwater trawl-caught nearshore rockfish (other than US West Coast black rockfish, AK nearshore rockfish, and BC quillback in inside waters)
Puget Sound stocks (except bottom trawled)
Good Alternative
All bottom trawl-caught slope/shelf rockfish and thornyheads
Bottom longline, midwater trawl, and hook-and-line caught caught slope/shelf BC rockfish
Bottom-longline, midwater trawl, and hook-and-line caught US West Coast slope/shelf rockfish other than thornyheads
Bottom-trawl caught stocks from Puget Sound
Bottom-trawl caught quillback rockfish
Bottom-trawl caught BC nearshore rockfish from inside waters
BC inside waters quillback rockfish (all gears)
Avoid

SeafoodWatch® Rockfish Report June 15, 2009
95
As trawl-caught rockfish account for over 80% of US West Coast landings and over 90% of BC and Alaskan landings, Seafood Watch® recommends that consumers avoid rockfish unless the species and gear used are known. Acknowledgements Seafood Watch® thanks the following experts for their technical review of relevant parts of this document for scientific accuracy and clarity: Dr. Steve Ralston, SWFSC Santa Cruz; Dr Milton Love, Marine Science Institute at UCSB; Dr. Scott Wallace, Blue Planet Research and Education (BC); and two anonymous reviewers. Scientific review does not constitute an endorsement of Seafood Watch® on the part of the reviewing scientists; the Seafood Watch® staff is solely responsible for the conclusions reached in this report.

SeafoodWatch® Rockfish Report June 15, 2009
96
References ADFG. 2005. Discards and retained data 2004. ADFG. 2005. Commercial Fisheries News Release: Regulations for the Southeast Alaska
Directed Black Rockfish Fishery. AMCC. 2005. Conservation and Management of North Pacific Rockfishes. Auster, P. J., and R. W. Langton. 1999. The effects of fishing on fish habitat. American Fisheries
22:150-187. Berkeley, S. A., C. Chapman, and S. M. Sogard. 2004a. Maternal age as a determinant of larval
growth and survival in a marine fish, Sebastes melanops. Ecology 85:1258-1264. Berkeley, S. A., M. A. Hixon, R. J. Larson, and M. S. Love. 2004b. Fisheries sustainability via
protection of age structure and spatial distribution of fish populations. Fisheries 29. BirdLife International. 2004. Phoebastria immutabilis and Phoesbastria nigripes. In: IUCN
2004. IUCN Red List of Threatened Species. Accessed January 4, 2005. Available at: http://www.redlist.org.
Bloeser, J. A. 1999. Diminishing Returns: The Status of West Coast Rockfish. Pacific Marine Conservation Council.
Boehlert, G. W., and M. M. Yoklavich. 1984. Reproduction, embryonic energetics, and the maternal-fetal relationship in the viviparous genus Sebastes (Pisces: Scorpaenidae). Biol. Bull. (Woods Hole) 167:354-370.
Branch, T. A., K. Rutherford, and R. Hilborn. 2005. Replacing trip limits with individual transferable quotas: implications for discarding. Marine Policy.
Breeze, H., D. S. Davis, M. Butler, and K. Vladimir. 1997. Distribution and status of deep sea corals off Nova Scotia. Marine Issues Committee Special Publication Number 1. Ecology Action Centre, Halifax, NS.
Brothers, N., J. Cooper, and S. Lokkeborg. 1999 NEED TO GET. The incidental catch of seabirds by longline fisheries: worldwide review and technical guidelines for mitigation. FAO Fisheries Circular 937. FAO, Rome.
Brown, E. 2001. Commercial flatfish fishing in the Bering Sea: impacts to sediment structure from experimental trawling. submitted to the National Academy of Sciences, Anchorage, AK.
Butler, J. L., L. D. Jacobson, J. T. Barnes, H. G. Moser, and R. Collins. 1999. Butler, J. L., L. D. Jacobson, J. T. Barnes, H. G. Moser, and R. Collins. 1999. Stock assessment of cowcod. in PFMC, editor. Appendix to Status of the Pacific Coast groundfish fishery through 1998 and recommended acceptable biological catches for 1999 (SAFE Report).
Cailliet, G., A. H. Andrews, E. J. Burton, D. L. Watters, D. E. Kline, and L. A. Ferry-Graham. 2001. Age determination and validation studies of marine fishes: do deep-dwellers live longer? Exp. Gerontology 36:739-764.
CDFG. 2001. Appendix G. Description, History, and Landings of Port Complexes. California Department of Fish and Game.
Chuenpagdee, R., L. E. Morgan, S. Maxwell, E. A. Norse, and D. Pauly. 2003. Shifting gears: Assessing collateral impacts of fishing methods in the U.S. waters. Frontiers in Ecology and the Environment 1:517-524.
Clausen, D. M., D. Hanselman, J. T. Fujioka, and J. Heifetz. 2004. Shortraker/Rougheye and
SeafoodWatch® Rockfish Report June 15, 2009
97
other slope rockfish. in NPFMC, editor. Gulf of Alaska SAFE, Anchorage, AK 99501. Clausen, D. M. 2005. Shortraker and Other Slope Rockfish. in NPFMC, editor. Gulf of Alaska
SAFE, Anchorage, AK 99501. Collie, J. S., S. J. Hall, M. J. Kaiser, and I. R. Poiner. 2000. A quantitative analysis of fishing
impacts on shelf-sea benthos. Journal of Animal Ecology 69:785-798. COSEWIC. 2002. COSEWIC assessment and status report on the Bocaccio Sebastes paucispinis
in Canada. Committee on the Status of Endangered Wildlife in Canada., Ottawa. vii + 43. Courtney, D., D. Hanselman, J. Heifetz, J. T. Fujioka, J. Ianelli, and D. M. Clausen. 2004.
Northern rockfish. in NPFMC, editor. Gulf of Alaska SAFE, Anchorage, AK 99501. DFO. 1999a. Rockfish & Thornyhead Stock Assessments. DFO Science Stock Status. DFO. 1999b. Pacific Ocean Perch British Columbia Coast Stock Status Report. A6-11. DFO. 1999c. Yellowtail Rockfish Stock Status Report. A6-07-99. DFO. 1999d. Canary Rockfish Stock Status Report. A6-08-99. DFO. 1999e. Widow Rockfish Stock Status Report. A6-10-99. DFO. 1999f. Silvergrey Stock Status Report. A6-09-99. DFO. 1999g. Thornyheads Stock Status Report. A6-12-99. DFO. 1999h. Shortraker rockfish Stock Status Report. A6-14-99. DFO. 1999i. Rougheye rockfish Stock Status Report. A6-15-99. DFO. 2000. Inshore rockfish assessment. A6-16 2000. DFO. DFO. 2004. Allowable harm assessment for bocaccio. 2004/043. DFO. DFO. 2005. Commercial landings data 2004. DFO request. DFO. 2005b. Pacific Region Integrated Fisheries Management Plan Groundfish Trawl April 1,
2005 to March 31, 2006. DFO. 2005c. Pacific Region Integrated Fisheries Management Plan Groundfish Hook-and-line
Outside April 1/2005 to March 31/2006. DFO. 2005c. Pacific Region Integrated Fisheries Management Plan Groundfish Hook-and-line
Inside April 1/2005 to March 31/2006. DiCosimo, J., P. D. Spencer, D. Hanselman, R. Reuter, and B. Stockhausen. 2005. BSAI and
GOA rockfishes, their fisheries and management. Dragoo, D. E., G. V. Byrd, and D. B. Irons. 2003. Breeding status, population trends and diets of
seabirds in Alaska, 2001. AMNWR 03/05. US Fish and Wildlife Service. Enticknap, B. 2002. Trawling the North Pacific: understanding the effects of bottom trawl
fisheries on Alaska's living seafloor. Alaska Marine Conservation Council, Anchorage, AK.
Erickson, D. L., and E. K. Pikitch. 1993. A histological description of the shortspine thornyhead, Sebastolobus alascanus, ovaries: structures associated with the production of gelatinous egg masses. Environ. Biol. Fish. 36:273-282.
Eschmeyer, W. N., E. S. Herald, and H. Hammann. 1983. A Field Guide to Pacific Coast fishes of North America. Houghton Mifflin Co., Boston.
Fargo, J. 2006. Personal communication. February 24th 2006. Fenty, B. 2005. An analysis of rockfish diversity and density in the North Pacific using available
Groundfish Fisheries Observer data. Prepared for: The Ocean Conservancy (in press). Fey, G. 2005. Stock Assessment and Status of Longspine Thornyhead (Sebastolobus altivelis)

SeafoodWatch® Rockfish Report June 15, 2009
98
off California, Oregon and Washington in 2005 DRAFT. FIS. 2003. Discards in the North Pacific groundfish fisheries 2001. Fisheries Information
Service, prepared for the Alaska Marine Conservation Council, Juneau Alaska. Fitzgerald, S., K. Kuletz, M. Perez, K. Rivera, and D. Dragoo. 2004. Ecosystem considerations:
seabirds. in J. Boldt, editor. Ecosystem considerations for 2005. NPFMC, Available at: http://www.afsc.noaa.gov/refm/docs/2004/BSAIGOA_Ecosystem_2004.pdf.
Flint, E. N. 2005. Annual nest counts through hatch year 2005. USFWS Administrative Report, Hawaiian Pacific Islands National Wildlife Refuge Complex, Honolulu, Hawaii.
Fluharty, D. 2000. Habitat protection, ecological issues, and implementation of the Sustainable Fisheries Act. Ecological Applications 10:325-337.
Fossa, J. H., P. B. Mortensen, and D. M. Furevik. 2002. The deep-water coral Lophelia pertusa in Norwegian waters: distribution and fishery impacts. Hydrobiologia 471:1-12.
Freese, L., P. J. Auster, J. Heifetz, and B. L. Wing. 1999. Effects of trawling on seafloor habitat and associated invertebrate taxa in the Gulf of Alaska. Marine Ecology Progress Series 182:119-126.
Gaichas, S., and J. Ianelli. 2003. Thornyheads. in NPFMC, editor. Gulf of Alaska SAFE, Anchorage, AK 99501.
Gaichas, S., and J. Ianelli. 2004. Thornyheads. in NPFMC, editor. Gulf of Alaska SAFE, Anchorage, AK 99501.
Gharrett, A. J. (in press). Distribution and population genetic structure of sibling species of rougheye rockfish based on microsatellite and mitochondrial variation. Transactions of the American Fisheries Society.
Gunderson, D. R., P. Callahan, and B. Goiney. 1980. Maturation and fecundity of four species of Sebastes. Mar. Fish. Rev. 42:74-79.
Haight, R. E., and J. T. Schnute. 2003. The longspine thornyhead fishery along the West Coast of Vancouver Island, British Columbia, Canada: Portrait of a developing fishery. North American Journal of Fisheries Management 23:120-140.
Haldorson, L., and M. S. Love. 1991. Maturity and fecundity in the rockfishes, Sebastes spp., a review. Mar. Fish. Rev. 53:25-31.
Hall-Spencer, J., V. Allain, and J. H. Fossa. 2002. Trawling damage to Northeast Atlantic ancient coral reefs. Proceedings of the Royal Society of London B 269:507-511.
Hamel, O. 2005. Status and Future Prospects for the Pacific Ocean Perch Resource in Waters off Washington and Oregon as Assessed in 2005. NWFSC/PFMC, Seattle Washington.
Hamel, O. 2007. Status and Future Prospects for the Pacific Ocean Perch Resource in Waters off Washington and Oregon as Assessed in 2005. NWFSC/PFMC, Seattle Washington.
Hamel, O. 2005. Status and Future Prospects for the Shortspine Thornyhead Resource in Waters off Washington, Oregon, and California as Assessed in 2005. NWFSC, Seattle, WA.
Hanselman, D., J. Heifetz, J. T. Fujioka, and J. Ianelli. 2004. Pacific Ocean Perch. in NPFMC, editor. Gulf of Alaska SAFE, Anchorage, AK 99501.
Hanselman, D. 2005. Personal communication. 10/18/2005. Hanselman, D., J. Heifetz, J. T. Fujioka, and J. Ianelli. 2005. Pacific Ocean Perch. in NPFMC,
editor. Gulf of Alaska SAFE, Anchorage, AK 99501. Harrington, J. M., R. A. Myers, and A. A. Rosenberg. 2005. Wasted fishery resources: discarded
by-catch in the USA. Fish and Fisheries 6:350-361.

SeafoodWatch® Rockfish Report June 15, 2009
99
Hastie, J. D. 2005. Personal communication. 10/18/04. Hastie, J.D. 2008. Personal communication. 2/25/08 He, X., D. Pearson, E. J. Dick, J. C. Field, S. Ralston, and A. D. MacCall. 2005. Status of the
widow rockfish resource in 2005. NWFSC/PFMC, Seattle Washington. Heifetz, J., J. Ianelli, D. M. Clausen, and J. T. Fujioka. 1999. Slope rockfish in Stock assessment
and fishery evaluation report for the 2000 Gulf of Alaska groundfish fishery. North Pacific Fishery Management Council,, Anchorage, AK.
Heifetz, J. 2002. Coral in Alaska: distribution, abundance, and species associations. Hydrobiologia 471:19-28.
Helser, T. 2005. Stock Assessment of the Blackgill Rockfish (Sebastes melanostomus) Population off the West Coast of the United States in 2005. NWFSC, Seattle, WA.
High. 1998. Observations of a scientist/diver on fishing technology and fisheries biology. Report 98-01. Alaska Fisheries Science Center, Seattle, WA.
Husebo, A., L. Nottestad, J. H. Fossa, D. M. Furevik, and S. B. Jorgensen. 2002. Distribution and abundance of fish in deep-sea coral habitats. Hydrobiologia 471:91-99.
Ianelli, J., and M. Zimmerman. 1998. Status and future prospects for the Pacific ocean perch resource in waters off Washington and Oregon as assessed in 1998. Pacific Fishery Management Council,, Portland, OR.
Ianelli, J. N., S. J. Barbeaux, G. Walters, T. Honkalehto, and N. Williamson. 2004. Eastern Bering Sea walleye pollock stock assessment. in Stock assessment and fishery evaluation report for the groundfish resources of the Bering Sea/Aleutian Islands regions. North Pacific Fishery Management Council, Anchorage, AK.
IUCN. 2004. 2004 IUCN Red List of Threatened Species. International Union for Conservation of Nature and Natural Resources. Accessed January 4, 2005. Available at: http://www.redlist.org/.
Karpov, K. A., D. P. Albin, and W. Van Buskirk. 1995. The marine and recreational fishery in northern and central California. CDFG Fish Bulletin 176.
Key, M., A. D. MacCall, T. Bishop, and B. Leos. 2005. Stock assessment of the gopher rockfish (Sebastes carnatus). CDFG/SWFSC.
Koslow, J. A., K. Gowlett-Holmes, J. K. Lowry, T. O'Hara, G. C. B. Poore, and A. Williams. 2001. Seamount benthic macrofauna off southern Tasmania: community structure and impacts of trawling. Marine Ecology Progress Series 213:111-125.
Kramer, D. E., and V. M. O'Connell. 1995. Guide to Northeast Pacific rockfishes: Genera Sebastes and Sebastolobus.
Krieger, K. J. 1998. Primnoa spp. observed inside and outside a bottom trawl path from a submersible. in 10th Western Groundfish Conference.
Krieger, K., J. Heifetz, and D. Ito. 2001. Rockfish Assessed Acoustically and Compared to Bottom-Trawl Catch Rates. Alaska Fishery Research Bulletin [Alaska Fish. Res. Bull.] 8:71-77.
Krieger, K. J., and B. L. Wing. 2002. Megafauna associations with deepwater corals (Primnoa spp.) in the Gulf of Alaska. Hydrobiologia 471:83-90.
Leet, W. S., C. M. Dewees, R. Klingbeil, and E. Larson. 2001. California's living marine resources: A Status Report. California Department of Fish & Game, Davis CA.
Lenarz, W. H. 1987. A history of California rockfish fisheries. 87-2. Alaska Sea Grant Report,

SeafoodWatch® Rockfish Report June 15, 2009
100
Anchorage. Lenarz, W. H., and T. Wyllie Echeverria. 1991. Sexual dimorphism in Sebastes. Livingston, P. A. 2002. Ecosystem considerations for 2003. North Pacific Fishery Management
Council, Anchorage, AK. Love, M. S., P. Morris, M. McCrae, and R. Collins. 1990. Life history aspects of 19 rockfish
species (Scorpaenidae: Sebastes ) from the southern California Bight. NOAA-TR-NMFS-87.
Love, M. S., J. E. Caselle, and K. Herbinson. 1998. Declines in nearshore rockfish recruitment and populations in the southern California Bight as measured by impingement rates in coastal electrical power generating stations. Fishery Bulletin [Fish. Bull.] 96:492-501.
Love, M. S., M. Yoklavich, and L. Thorsteinson. 2002. The Rockfishes of the Northeast Pacific. Lunsford, C. R., D. Hanselman, K. Shotwell, and D. M. Clausen. 2004. Pelagic Shelf Rockfish.
in NPFMC, editor. Gulf of Alaska SAFE, Anchorage, AK 99501. MacCall, A. D., S. Ralston, D. Pearson, and E. H. Williams. 1999. Status of bocaccio off
California in 1999 and outlook for the next millennium. in PFMC, editor. Appendix to Status of the Pacific Coast groundfish fishery through 1999 and recommended acceptable biological catches for 2000 (Stock Assessment and Fishery Evaluation). Portland, OR.
MacCall, A. D. 2003. Status of bocaccio off California in 2003. SWFSC/PFMC, Santa Cruz, CA. MacCall, A. D. 2005. Status of bocaccio off California in 2005. SWFSC/PFMC, Santa Cruz, CA. MacCall, A. D. 2005. Assessment of Vermilion Rockfish in Southern and Northern California.
SWFSC, Santa Cruz, CA. Mahoney, M. M., and N. Schueneman. 2001. Market Survey of West Coast. Monterey Bay
Aquarium, Monterey CA. Mason, J. E. 1998. Declining rockfish lengths in Monterey Bay, California, Recreational Fishery,
1959-94. Mar. Fish. Rev. 60:15-28. Mattes, L., and B. Failor-Rounds. 2005. Fishery Management Plan for the commercial black
rockfish fisheries of the Westward region, 2005. Fishery Management Report 05-37. Maunder, M. N., J. T. Barnes, D. Aseltine-Neilson, and A. D. MacCall. 2005. The Status of
California Scorpionfish (Scorpaena guttata) off Southern California in 2004. SWFSC. McConnaughey, R. A., K. L. Mier, and C. B. Dew. 2000. An examination of chronic trawling
effects on soft-bottom benthos of the eastern Bering Sea. ICES Journal of Marine Science 57:1377-1388.
Melvin, E., K. Dietrich, K. Van Wormer, and T. Geernaert. 2004. The distribution of seabirds on Alaskan longline fishing grounds: 2002 data report. WSG-TA 04-02. Washington Sea Grant Program, Seattle, WA.
Methot, R. D., and K. Piner. 2002. Status of the canary rockfish resource off California, Oregon and Washington in 2001. in PFMC, editor. Volume 1 Status of the Pacific Coast groundfish fishery through 2002 and recommended acceptable biological catches for 2003 (Stock Assessment and Fishery Evaluation). Portland, OR.
Methot, R. D., and I. J. Stewart. 2005. Status of the US canary rockfish resource in 2005. NWFSC/PFMC, Seattle, WA.
Moloney, C. L., J. Cooper, P. G. Ryan, and W. R. Siegfried. 1994 NEED TO GET. Use of a population model to assess the impact of longline fishing on wandering albatross Diomedea exulans populations. Biological Conservation 70:195-203.
SeafoodWatch® Rockfish Report June 15, 2009
101
Moser, H. G., and G. W. Boehlert. 1991. Ecology of pelagic larvae and juveniles of the genus Sebastes.
Moser, H. G., and G. W. Boehlert. 1991. Ecology of pelagic larvae and juveniles of the genus Sebastes.
Moser, H. G., R. L. Charter, W. Watson, D. A. Ambrose, J. L. Butler, S. R. Charter, and E. M. Sandknop. 2000. Abundance and distribution of rockfish (Sebastes) larvae in the southern California Bight in relation to environmental conditions and fishery exploitation. Reports of California Cooperative Oceanic Fisheries Investigations [Calcofi Rep.] 41:132-147.
MSC. 2004. About MSC. Marine Stewardship Council. MSC. 2005. BSAI Pacific cod freezer longline. Marine Stewardship Council. Munk, K. M. 2001. Maximum Ages of Groundfishes in Waters off Alaska and British Columbia
and Considerations of Age Determination. Alaska Fishery Research Bulletin [Alaska Fish. Res. Bull.] 8:12-21.
Musick, J. A., G. Burgess, G. M. Cailliet, M. Camhi, and S. Fordham. 2000. Management of sharks and their relatives (Elasmobranchii). American Fisheries Society Policy Statement.
NMFS. 2001. Alaska Draft Programmatic Groundfish Supplemental Environmental Impact Statement. Tables 4.7-4 and 4.7-5.
NMFS. 2001. Draft Programmatic Groundfish Supplemental EIS. NMFS. 2003. Supplement to the Endangered Species Act - section 7 consultation: biological
opinion and incidental take statement of October 2001. National Marine Fisheries Service. Accessed March 4, 2005. Available at: http://www.fakr.noaa.gov/protectedresources/stellers/biop2002/703remand.pdf.
NMFS. 2004. Alaska groundfish fisheries final programmatic supplemental environmental impact statement. National Marine Fisheries Service, Juneau, AK.
NMFS. 2005. Fisheries of the United States, 2004. NMFS. 2005b. Summary of seabird bycatch in Alaskan groundfish fisheries, 1993 through 2003.
National Marine Fisheries Service. Accessed March 11, 2005. Available at: http://www.afsc.noaa.gov/refm/reem/doc/Seabird%20bycatch%20tables%201993-2003.pdf.
NPFMC. 2001. Groundfish Stock Assessment and Fishery Evaluation Reports. North Pacific Fishery Management Council., Anchorage, AK.
NPFMC. 2005a. Fishery Management Plan for Groundfish of the Bering Sea and Aleutian Islands Management Area. NPFMC, Anchorage, AK.
NPFMC. 2005b. Fishery Management Plan for Groundfish of the Gulf of Alaska. NPFMC, Anchorage, AK.
NRC. 1996. The Bering Sea ecosystem. National Research Council. National Academies Press, Washington, DC.
NRC. 2002. Effects of trawling and dredging on seafloor habitat. National Research Council, Washington DC.
NRC. 2003. The decline of the Steller sea lion in Alaskan waters: untangling food webs and fishing nets. National Research Council, Washington, DC.
NWFSC. 2003. West Coast Groundfish Observer Program: Initial data report and summary analyses. Northwest Fisheries Science Center/NOAA/NMFS.

SeafoodWatch® Rockfish Report June 15, 2009
102
O'Connell, V. M., F. C. Funk, and B. R. Melteff. 1987. Age and growth of yelloweye rockfish (Sebastes ruberrimus) landed in southeastern Alaska. AK-SG-87-02.
PacFIN. 2005. Catch Reports. Pacific Fisheries Information Network. http://www.psmfc.org/pacfin/data.html.
Palsson, W. 2001. Survey-based stock trends for Puget Sound Groundfishes: Monitoring the road to recovery. Puget Sound Research 2001.
Palsson, W. 2005. Personal communication. 12/19/05. Parker, S. J., S. A. Berkeley, J. T. Golden, D. R. Gunderson, J. Heifetz, M. A. Hixon, R. Larson,
B. M. Leaman, M. S. Love, J. A. Musick, V. M. O’Connell, S. Ralston, H. J. Weeks, and M. Yoklavich. 2000. AFS Policy Statement #31d: Management of Pacific Rockfish.
Pearson, D. E., and J. E. Hightower. 1991. Spatial and temporal variability in growth of widow rockfish (Sebastes entomelas). NOAA-TM-NMFS-SWFSC-167.
PFMC. 2000. Status of the Pacific Coast Groundfish Fishery through 2000 and Recommended Biological Catches for 2001: Stock Assessment and Fishery Evaluation. Pacific Fishery Management Council., Portland OR.
PFMC. 2004. Pacific Coast Groundfish Fishery Management Plan for the California, Oregon and Washington Groundfish fishery, as amended through Amendment 17. PFMC, Portland Oregon.
PFMC. 2005. Pacific Coast Groundfish Fishery Management Plan Essential Fish Habitat DEIS. Pikitch, E. K. 1991. Technological interactions in the US west coast groundfish trawl fishery and
their implications for management. ICES journal of marine science. 193:253-263. Piner, K., M. Schirripa, T. L. Builder, J. B. Rogers, and R. D. Methot. 2000. Bank Rockfish
Stock Assessment for The Eureka and Monterey INPFC Areas. NWFSC. Piner, K., and R. D. Methot. 2001. Stock Status of Shortspine thornyhead off the Pacific West
Coast of the United States in 2001. IN: Appendix to the status of the Pacific Coast Groundfish fishery through 2001 and recommended acceptable biological catches for 2002.SAFE. Pacific Fishery Management Council, Portland OR.
Piner, K., and R. D. Methot. 2001. Stock Status of Shortspine thornyhead off the Pacific West Coast of the United States in 2001. IN: Appendix to the status of the Pacific Coast Groundfish fishery through 2001 and recommended acceptable biological catches for 2002.SAFE. Pacific Fishery Management Council, Portland OR.
Piner, K., E. J. Dick, and J. C. Field. 2005. 2005 Stock Status of Cowcod in the Southern California Bight and Future Prospects. SWFSC/PFMC, La Jolla, CA.
Punt, A. E., and A. D. MacCall. 2002. Revised rebuilding analysis for widow rockfish for 2002. Unpublished report to the Pacific Fishery management Council,, Portland, OR.
Ralston, S., and D. F. Howard. 1995. On the development of year-class strength and cohort variability in two northern California rockfishes. Fishery Bulletin [Fish. Bull.] 93:710-720.
Ralston, S., J. Ianelli, D. Pearson, M. Wilkins, R. A. Miller, and D. Thomas. 1996. Status of bocaccio in the Conception/Monterey/Eureka INPFC areas in 1996 and recommendations for management in 1997. in PFMC, editor. Appendix Vol. 1: Status of the Pacific Coast groundfish fishery through 1996 and recommended acceptable biological catches for 1997 (Stock Assessment and Fishery Evaluation). Portland, OR.
Ralston, S., and D. Pearson. 1997. Status of the widow rockfish stock in 1997. Appendix to: Status of the Pacific Coast groundfish fishery through 1997 and recommended acceptable

SeafoodWatch® Rockfish Report June 15, 2009
103
biological catches for 1998. PFMC. Ralston, S., and K. T. Oda. 2001. Chilipepper. in W. S. Leet, editor. California's living marine
resources: A Status Report. CDFG. Ralston, S. 2002. The Groundfish Crisis: What Went Wrong? (from Ecosystem Observations for
the Monterey Bay National Marine Sanctuary). Ralston, S., and E. J. Dick. 2003. The status of black rockfish (Sebastes melanops) off Oregon
and Northern California. SWFSC, Santa Cruz, CA. Ralston, S. 2005. Personal communication. 10/21/05. Randolph, S., and M. Snyder. 1993. The Seafood List: FDA's Guide to acceptable market names
for seafood sold in Interstate Commerce. FDA, Washington DC. Reuter, R., and P. D. Spencer. 2004. Other rockfish. in NPFMC, editor. Appendix A: Stock
Assessment and Fishery Evaluation Report for the Groundfish Resources of the Bering Sea/Aleutian Islands Regions, Anchorage, AK 99501.
Risk, M. J., D. E. McAllister, and L. Behnken. 1998. Conservation of cold and warm-water seafans: threatened ancient gorgonian groves. Sea Wind 10:20-22.
Roberts, S., and M. Hirshfield. 2004. Deep-sea corals: out of sight, but no longer out of mind. Frontiers in Ecology and the Environment: 2:123-130.
Rogers, A. D. 1999. The biology of Lophelia pertusa (Linnaeus 1758) and other deep-water reef-forming corals and impacts from human activities. International Review of Hydrobiology 84:315-406.
Rogers, J. B., R. D. Methot, T. L. Builder, K. Piner, and M. Wilkins. 2000. Status of the darkblotched rockfish (Sebastes crameri) resource in 2000. in PFMC, editor. Appendix to Status of the Pacific coast groundfish fishery through 2000 and recommended acceptable biological catches for 2001 (Stock Assessment and Fishery Evaluation). Portland, OR.
Rogers, J. B. 2005. Status of the Darkblotched Rockfish (Sebastes crameri) Resource in 2005. SWFSC/PFMC, Newport, OR.
Russell, R. W., N. M. Harrison, and G. L. Hunt, Jr. 1999. Foraging at a front: hydrography, zooplankton, and avian planktivory in the northern Bering Sea. Marine Ecology Progress Series 182:77-93.
Saether, B., and O. Bakke. 2000. Avian life history variation and contribution of demographic traits to the population growth rate. Ecology 81:642-653.
Sampson, D. B. 2002. Analysis of data from the at-sea data collection project. Final report to the Oregon Trawl Commission. Oregon State University.
Schnute, J. T., R. E. Haigh, B. B. Krishka, and P. Starr. 2001. Pacific Ocean perch assessment for the West Coast of Canada in 2001 Stock Assessment for the West Coast of Canada and Recommendations for Management. Canadian Science Advisory Secretariat Research Document - 2001/138. DFO.
Schnute, J. T., R. E. Haight, B. B. Krishka, and P. Starr. 2001. Pacific Ocean Perch Assessment for the West Coast of Canada in 2001. 2001/138. Fisheries & Oceans Canada (DFO).
Schnute, J. T., R. E. Haigh, B. Krishka, A. Sinclair, and P. Starr. 2004. The British Columbia longspine thornyhead fishery: analysis of survey and commercial data (1996-2003). Canadian Science Advisory Secretariat Research Document - 2004/59. DFO.
Shotwell, K., D. Hanselman, and D. M. Clausen. 2005. Rougheye. in NPFMC, editor. Gulf of Alaska SAFE, Anchorage, AK 99501.

SeafoodWatch® Rockfish Report June 15, 2009
104
Spencer, P. D., J. Ianelli, and H. Zenger. 2004. Pacific Ocean Perch. in NPFMC, editor. Appendix A: Stock Assessment and Fishery Evaluation Report for the Groundfish Resources of the Bering Sea/Aleutian Islands Regions, Anchorage, AK 99501.
Spencer, P. D., J. Ianelli, and Y.-W. Lee. 2004. Northern rockfish. in N. P. F. M. Council, editor. Appendix A: Stock Assessment and Fishery Evaluation Report for the Groundfish Resources of the Bering Sea/Aleutian Islands Regions, Anchorage, AK 99501.
Stanley, R. D., and N. Olsen. 2002. Update assessment for Silvergrey Rockfish. Canadian Science Advisory Secretariat Research Document 2002/128. DFO.
Starr, R. M. J., J. Cope, and L. Kerr. 2002. Trends in fisheries and fisheries resources associated with the Monterey Bay National Marine Sanctuary from 1981-2000. California Sea Grant.
Stewart, I. J. 2007. Status of the U.S. canary rockfish resource in 2007. NWFSC/NMFS, Seattle WA.
USFWS. 2003. Programmatic biological opinion on the effects of the fishery management plans (FMPs) for the Gulf of Alaska (GOA) and Bering Sea/Aleutian Islands (BSAI) groundfish fisheries on the endangered short-tailed albatross (Phoebastria albatrus) and threatened Steller's eider (Polysticta stelleri). US Fish and Wildlife Service, Anchorage, AK.
Wallace, F. R., A. Hoffman, and J. V. Tagart. 1999. Status of the black rockfish resource in 1999. in PFMC, editor. Appendix to the Status of the Pacific Coast Groundfish Fishery Through 1999 and Recommended Acceptable Biological Catches for 2000, Stock Assessment and Fishery Evaluation., Portland, OR.
Wallace, F. R. 2002. Status of the yelloweye rockfish resource in 2001 for northern California and Oregon waters. in PFMC, editor. Appendix to the Status of the Pacific Coast Groundfish Fishery Through 2001 and Acceptable Biological Catches for 2002 (Stock Assessment and Fishery Evaluation). Portland, OR.
Wallace, F. R., T.-T. Tsou, and T. H. Jagielo. 2005. Status of yelloweye rockfish off the U.S. West Coast in 2005 (Sebastes ruberrimus). WDFW, Olympia WA.
Wallace, F. R., and H.-L. Lai. 2005. Status of Yellowtail rockfish in 2004 DRAFT. WCGOP. 2005. West Coast Groundfish Observer Program Data Report and Summary Analyses,
September 2005. WCGOP. 2005b. Data Report and Summary Analyses of Open Access Fixed-Gear Fisheries in
Waters Less than 50 Fathoms, May 2005. Williams, E. H., S. Ralston, A. D. MacCall, D. Woodbury, and D. Pearson. 1999. Stock
assessment of the canary rockfish resource in the waters off southern Oregon and California in 1999. in Pacific Fishery Management Council, editor. Status of the Pacific coast groundfish fishery through 1999 and recommended acceptable biological catches for 2000 (Stock Assessment and Fishery Evaluation). Portland, OR.
Witherell, D., and C. Coon. 2000. Protecting gorgonian corals off Alaska from fishing impacts. Proceedings of the Nova Scotia Institute of Science in press.
Wourms, J. P. 1991. Reproduction and development of Sebastes in the context of the evolution of piscine viviparity. Environ. Biol. Fish. 30:111-126.
Wright, S. 1999. Petition to the Secretary of Commerce to list as threatened or endangered 18 species/populations of Puget Sound marine fishes and to designate critical habitat. Petition to the US National Marine Fisheries Service, February 1999, 32p.

SeafoodWatch® Rockfish Report June 15, 2009
105
Wyllie Echeverria, T. 1987. Thirty-four species of California rockfishes: maturity and seasonality of reproduction. Fish. Bull. 85:229-249.
Wyllie Echeverria, T. 1987. Relationship of otolith length to total length in rockfishes from northern and Central California. Fishery Bulletin [Fish. Bull.] 85:383-387.
Yamanaka, K. L., and A. R. Kronlund. 1997. Inshore rockfish stock assessment for the west coast of Canada in 1996 and recommended yields for 1997.
Yamanaka, K. L., and L. C. Lacko. 2001. Inshore Rockfish (Sebastes ruberrimus, S. malliger, S. caurinus, S. melanops, S. nigrocinctus, and S. nebulosus) Stock Assessment for the West Coast of Canada and Recommendations for Management. Canadian Science Advisory Secretariat Research Document - 2001/139. DFO.
Yoklavich, M. M., V. J. Loeb, M. Nishimoto, and B. Daly. 1996. Nearshore assemblages of larval rockfishes and their physical environment off Central California during an extended El Nino event, 1991-1993. Fishery Bulletin [Fish. Bull.] 94:766-782.

SeafoodWatch® Rockfish Report June 15, 2009
106
Appendix 1: Alaska rockfish landings 2004, by habitat, region and gear type. Round weight equivalent in mt (PacFIN 2005) Year 2004Complex ROCKRegion/state AK
Sum of Landings (round-weight equivalent in metric-tons) Gear type
Area ID Habitat Species Bottom trawlBottom longline
Midwater trawl
Pole/Jig/ Hook and line/Troll Grand Total
GOA Slope PACIFIC OCEAN PERCH 10604 35 10639Shortraker/rougheye 348 512 20 880
Shelf Northern rockfish 4724 9 4733Pelagic shelf rockfish 2355 27 1 40 2423
Mixed OTHER ROCKFISH 702 111 3 816ThornyheadsThornyhead 441 338 779Nearshore Demersal shelf rockfish 256 3 259
GOA Total 19174 1253 56 46 20529BSAI Slope PACIFIC OCEAN PERCH 10826 4 380 11210
Shortraker (BSAI) 85 75 51 211Rougheye (BSAI) 160 39 1 200
Shelf Northern rockfish 4200 32 48 4280Slope/Shelf OTHER ROCKFISH 396 212 15 623
BSAI Total 15667 362 495 16524Grand Total 34841 1615 551 46 37053
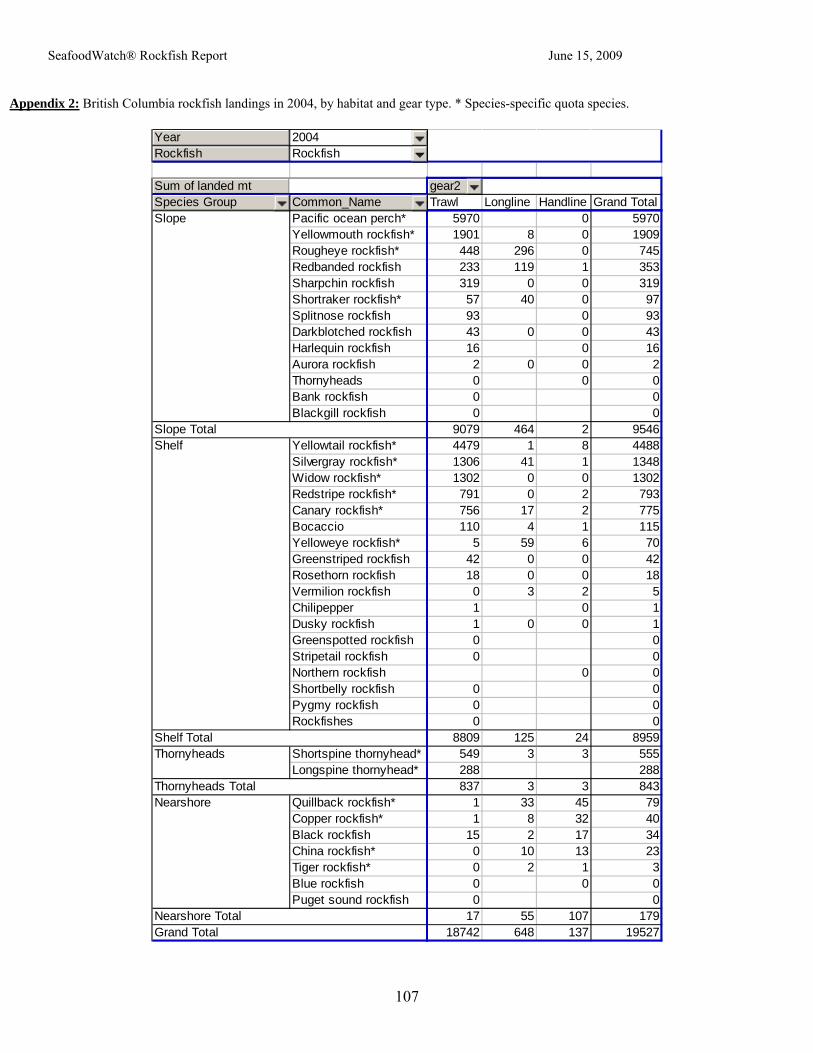
SeafoodWatch® Rockfish Report June 15, 2009
107
Appendix 2: British Columbia rockfish landings in 2004, by habitat and gear type. * Species-specific quota species.
Year 2004Rockfish Rockfish
Sum of landed mt gear2Species Group Common_Name Trawl Longline Handline Grand TotalSlope Pacific ocean perch* 5970 0 5970
Yellowmouth rockfish* 1901 8 0 1909Rougheye rockfish* 448 296 0 745Redbanded rockfish 233 119 1 353Sharpchin rockfish 319 0 0 319Shortraker rockfish* 57 40 0 97Splitnose rockfish 93 0 93Darkblotched rockfish 43 0 0 43Harlequin rockfish 16 0 16Aurora rockfish 2 0 0 2Thornyheads 0 0 0Bank rockfish 0 0Blackgill rockfish 0 0
Slope Total 9079 464 2 9546Shelf Yellowtail rockfish* 4479 1 8 4488
Silvergray rockfish* 1306 41 1 1348Widow rockfish* 1302 0 0 1302Redstripe rockfish* 791 0 2 793Canary rockfish* 756 17 2 775Bocaccio 110 4 1 115Yelloweye rockfish* 5 59 6 70Greenstriped rockfish 42 0 0 42Rosethorn rockfish 18 0 0 18Vermilion rockfish 0 3 2 5Chilipepper 1 0 1Dusky rockfish 1 0 0 1Greenspotted rockfish 0 0Stripetail rockfish 0 0Northern rockfish 0 0Shortbelly rockfish 0 0Pygmy rockfish 0 0Rockfishes 0 0
Shelf Total 8809 125 24 8959Thornyheads Shortspine thornyhead* 549 3 3 555
Longspine thornyhead* 288 288Thornyheads Total 837 3 3 843Nearshore Quillback rockfish* 1 33 45 79
Copper rockfish* 1 8 32 40Black rockfish 15 2 17 34China rockfish* 0 10 13 23Tiger rockfish* 0 2 1 3Blue rockfish 0 0 0Puget sound rockfish 0 0
Nearshore Total 17 55 107 179Grand Total 18742 648 137 19527

SeafoodWatch® Rockfish Report June 15, 2009
108
Appendix 3: US West Coast rockfish landings in 2004, by state, habitat, and gear. Round weight equivalent in mt. The top eight species for each state-habitat combination are shown, accounting for 99.1% of total landings.
Year 2004Complex ROCKRegion/state West Coast
Sum of Landings (round-weight equivalent in metric-tons) Gear type
Area ID Habitat Species Bottom trawlMidwater trawl
Pole/Jig/ Hook and line/Troll
Bottom longline Grand Total
CA ThornyheadsLONGSPINE THORNYHEAD 515 8 523SHORTSPINE THORNYHEAD 220 1 128 349THORNYHEADS (MIXED) 1 1 24 26
Slope SPLITNOSE ROCKFISH 170 0 0 170BLACKGILL ROCKFISH 100 34 34 168BANK ROCKFISH 109 0 1 110DARKBLOTCHED ROCKFISH 46 0 0 46AURORA ROCKFISH 33 0 1 33UNSP. SLOPE ROCKFISH 1 6 7REDBANDED ROCKFISH 1 1 1 3PACIFIC OCEAN PERCH 1 1
Nearshore BLACK ROCKFISH 0 60 2 62BROWN ROCKFISH 21 3 24GOPHER ROCKFISH 12 3 15BLUE ROCKFISH 12 0 13GRASS ROCKFISH 9 4 13BLACK-AND-YELLOW ROCKFISH 9 1 10COPPER ROCKFISH 3 2 5CALIF. SCORPIONFISH 2 1 0 4
Shelf CHILIPEPPER 38 3 0 41VERMILION ROCKFISH 12 2 14BOCACCIO 6 4 2 12UNSP. REDS RCKFSH (assumed shelf) 0 5 3 8WIDOW ROCKFISH 4 0 4YELLOWTAIL ROCKFISH 1 1 0 3UNSP. SHELF ROCKFISH 2 0 2UNSP. ROCKFISH 0 1 0 2
CA Total 1246 194 227 1667OR ThornyheadsSHORTSPINE THORNYHEAD 287 0 0 288
LONGSPINE THORNYHEAD 224 0 0 224Slope DARKBLOTCHED ROCKFISH 138 0 0 138
PACIFIC OCEAN PERCH 95 0 96ROUGHEYE ROCKFISH 45 45SHARPCHIN ROCKFISH 17 17SHORTRAKER ROCKFISH 17 17SPLITNOSE ROCKFISH 12 12YELLOWMOUTH ROCKFISH 10 10NOR. UNSP. SLOPE ROCKFISH 3 2 3 7
Nearshore BLACK ROCKFISH 1 116 1 118CHINA ROCKFISH 7 0 7BLUE ROCKFISH 6 6QUILLBACK ROCKFISH 0 1 0 1NOR. UNSP. NEAR-SHORE ROCKFISH 0 0 0 1COPPER ROCKFISH 1 0 1GRASS ROCKFISH 1 1BLACK-AND-YELLOW ROCKFISH 0 0
Shelf YELLOWTAIL ROCKFISH 56 34 7 0 98WIDOW ROCKFISH 2 12 0 15CANARY ROCKFISH 3 1 4NOR. UNSP. SHELF ROCKFISH 1 1 0 0 2VERMILION ROCKFISH 2 2GREENSTRIPED ROCKFISH 1 1YELLOWEYE ROCKFISH 0 0REDSTRIPE ROCKFISH 0 0
OR Total 914 50 140 4 1108WA Shelf YELLOWTAIL ROCKFISH 37 411 15 3 466
WIDOW ROCKFISH 30 30NOR. UNSP. SHELF ROCKFISH 0 2 0 6 8CANARY ROCKFISH 3 2 0 1 6YELLOWEYE ROCKFISH 0 3 3GREENSTRIPED ROCKFISH 2 0 2BOCACCIO 1 1REDSTRIPE ROCKFISH 0 0
Slope NOR. UNSP. SLOPE ROCKFISH 53 53PACIFIC OCEAN PERCH 21 1 21ROUGHEYE ROCKFISH 7 7DARKBLOTCHED ROCKFISH 6 0 0 6REDBANDED ROCKFISH 4 4SHARPCHIN ROCKFISH 2 0 2SHORTRAKER ROCKFISH 1 1SPLITNOSE ROCKFISH 1 0 1
ThornyheadsSHORTSPINE THORNYHEAD 18 11 28LONGSPINE THORNYHEAD 8 8
Nearshore NOR. UNSP. NEAR-SHORE ROCKFISH 0 0WA Total 110 445 16 76 647Grand Total 2270 495 350 308 3422

SeafoodWatch® Rockfish Report June 15, 2009
109
Appendix 4: Prior to 2007, NMFS designated US west coast stocks of Pacific Ocean perch and canary rockfish as overfished. According to NWFSC 2007 stock assessments, these stocks are no longer overfished. However, slope and shelf rockfish aggregate in mixed species schools and therefore targeting a single species is impossible. Because some of these species are overfished, Seafood Watch® ranks stock status of west coast slope and shelf rockfish, with the exception of thornyheads, as a “high” conservation concern. The overall seafood recommendation for US west coast slope and shelf rockfish (excluding thornyheads) remains “AVOID.”