Rock lobster amateur harvest estimates for CRA1 in ...
35
Rock lobster amateur harvest estimates for CRA1 in Northland, New Zealand 2013–14 New Zealand Fisheries Assessment Report 2014/70 J.C. Holdsworth ISSN 1179-5352 (online) ISBN 978-0-477-10519-4 (online) December 2014
Transcript of Rock lobster amateur harvest estimates for CRA1 in ...

Rock lobster amateur harvest estimates for CRA1 in Northland, New Zealand 2013–14 New Zealand Fisheries Assessment Report 2014/70 J.C. Holdsworth ISSN 1179-5352 (online) ISBN 978-0-477-10519-4 (online) December 2014

Requests for further copies should be directed to: Publications Logistics Officer Ministry for Primary Industries PO Box 2526 WELLINGTON 6140 Email: [email protected] Telephone: 0800 00 83 33 Facsimile: 04-894 0300 This publication is also available on the Ministry for Primary Industries websites at: http://www.mpi.govt.nz/news-resources/publications.aspx http://fs.fish.govt.nz go to Document library/Research reports © Crown Copyright - Ministry for Primary Industries
TABLE OF CONTENTS Executive Summary ......................................................................................................................... 1 1 INTRODUCTION ................................................................................................................... 2
1.1 Existing amateur harvest estimates ..................................................................................... 2 1.2 Characterisation of amateur harvest from off-site surveys ................................................. 4
2 METHODS ............................................................................................................................... 6 2.1 Survey days by strata .......................................................................................................... 6 2.2 Additional sources of information ...................................................................................... 8 2.3 Interviewer training ............................................................................................................. 8 2.4 Survey assumptions ............................................................................................................. 9 2.5 Estimating Total Harvest - main ramp (and marina) expansion ......................................... 9 2.6 Estimating Total Harvest - bus route direct expansion ..................................................... 10 2.7 Expanding harvest estimates to all of CRA 1 ................................................................... 12
3 RESULTS ............................................................................................................................... 13 3.1 Boats intercepted ............................................................................................................... 13 3.2 Unscaled harvest and length frequency ............................................................................ 14 3.3 Expanded harvest estimates for the survey area ............................................................... 18 3.4 Expanded harvest estimates for CRA 1 and East Northland ............................................ 21 3.5 Expanded harvest estimates by month .............................................................................. 22 3.6 Amateur harvest taken inside areas closed to commercial rock lobster fishing ............... 23
4 CONCLUSIONS .................................................................................................................... 25 5 ACKNOWLEDGEMENTS .................................................................................................. 27 6 REFERENCES ...................................................................................................................... 27 7 APPENDIX 1 .......................................................................................................................... 29 8 APPENDIX 2 .......................................................................................................................... 30


Ministry for Primary Industries CRA 1 Amateur harvest 2013–14 1
EXECUTIVE SUMMARY
Holdsworth, J.C. (2014). Rock lobster amateur harvest estimates for Northland, New Zealand in 2013–14. New Zealand Fisheries Assessment Report 2014/70. 31 p. This survey was an on-site survey of recreational fishers using boats and access points between Rangiputa and Mangawhai Heads in East Northland in 2013–14. The main purpose was to estimate boat based amateur harvest for rock lobster as precisely as possible using onsite interviews at most access points and to expand these out to estimate the harvest by amateur fishers for 2013–14 in the whole CRA 1 quota management area. The spatial scale of the survey, spread along 500 km of coastal roads that are often not well connected, presented some challenges. A random stratified design was used with 60 survey days in the year from 1 April 2013, with strata for summer and winter and week day and weekend/holiday. Mean daily harvest within each strata and each location type (main ramp, bus stop ramp, and marina) is used to estimate total harvest from recreational vessels in the area by fishing year. Harvest estimates are also calculated for kahawai, trevally and red gurnard to aid comparison with existing amateur harvest surveys, some of which do not estimate rock lobster harvest. Expansion of observed harvest at the main ramps and marinas is straightforward, with most boats intercepted and adjustments made for vessels that were missed or for those that refused to be interviewed (1%). The direct expansion method used in the bus route component of the survey is described. A total of 12 174 boat trips were observed in 2013–14, including vessels not intercepted and trailers at the end of survey days at main ramps. Completed interviews show that 68% of trips involved some fishing activity and 1.4% of fishers refused to be interviewed. Greenweight harvest estimates for boat based amateur fishers in the survey area are: rock lobster 25.4 t; kahawai 167 t; trevally 41 t; red gurnard 4 t; and 5 t packhorse rock lobster. CVs for the number of fish harvested range from 9% for kahawai to 30% for packhorse calculated using bootstraps of harvest by day by stratum. The results from the National Panel survey have been used to expand the boat based harvest estimates of rock lobster from within the survey area to account for harvest in the whole QMA and by land based fishers. The amateur harvest estimate for CRA 1 is 37 t (CV 0.17). Adding in the 4.4 tonnes of recreational harvest by commercial fishers reported under s111 in 2013–14 gives a total of 42 tonnes for CRA 1. The rock lobster fishery in CRA 1 outside our survey area has low participation rates and the harvest of a few diarists in the National Panel Survey may be unduly influential so these expanded estimates should be treated with caution. Finfish harvest estimates are expanded to the East Northland region for comparison with estimates from the 2011–12 Panel Survey. There are two areas closed to commercial fishing but open to amateur fishing in CRA 1. No data was collected on the Mimiwhangata Marine Park. The Te Puna Mataitai Reserve was established on 27 August 2013, 5 months after the start of this survey. The expanded harvest in this area for the 7 months covered by this survey was 1709 rock lobster (CV 0.37) or 1.25 t using the survey wide mean weight. Rock lobster is an important component of amateur harvest in Northland, probably fifth in harvest weight behind snapper, kahawai, yellowtail kingfish and trevally. In 2013–14 it was taken mainly by SCUBA and free diving from October to January. Easterly quarter winds may have reduced fishing effort and harvest for all species surveyed in February 2014. Areas close to the population centres around Whangarei and Bay of Islands had the most fishing effort and amateur harvest. Overall the harvest rate for rock lobster fishers in this survey was 1.6 per person per trip including unsuccessful trips.

2 CRA 1 Amateur harvest 2013–14 Ministry for Primary Industries
1 INTRODUCTION The primary purpose of this research was to design and implement an on-site survey to estimate the amateur rock lobster harvest from Northland (CRA 1) for the 01 April 2013 to 31 March 2014 fishing year. The Northland rock lobster fishery is highly valued by commercial, recreational and customary fishers. The commercial catch of the two rock lobster species has been managed under the QMS since 1990. The red rock lobster (Jasus edwardsii) Total Allowable Commercial Catch (TACC) in quota management area CRA 1 is 131 t (Figure 1). The packhorse rock lobster (Sagmariasus verreauxi) has a single quota management area (PHC 1) for all of New Zealand with most of the commercial catch taken in the CRA 1 management area. The PHC 1 TACC is 40 t and annual landed catch is about 35 t. The allowances for recreational and customary non-commercial fishing interests have not been set, as no adjustment to the TACC has been made since the Fisheries Act 1996 was implemented. During the design phase the Marine Amateur Fisheries Working Group and contractor agreed that in addition to the rock lobster objectives, data on kahawai (Arripis trutta and Arripis xylabion) trevally (Caranx georgianus) and red gurnard (Chelidonichthys kumu) should be collected and amateur harvest estimated for the survey area. The coastal settlements of Northland are popular holiday destinations within a few hours’ drive from Auckland. The rocky coastline and numerous reefs found in East Northland provide good habitat for rock lobster. The amateur fishery is managed by minimum size limits (for red rock lobster, tail width of 54 mm for male fish and 60 mm for female fish; for packhorse rock lobster, tail length of 216 mm), daily bag limits (6 rock lobster per person), and pot limits (3 per person). In addition, taking rock lobster with a soft shell or with eggs is prohibited.
Figure 1: Rock lobster area CRA 1 on the east and west coast of Northland with the survey area shaded. 1.1 Existing amateur harvest estimates Amateur harvest has historically been estimated from regional and national off-site telephone-diary surveys. These used telephone or face to face interviews to estimate the proportion of the population who fished in the previous 12 months and to recruit diarists. Each survey estimated the New Zealand amateur harvest by scaling up the number of rock lobster reported with a weighting for each diarist to the total estimated New Zealand population. The harvest in numbers was converted to harvest in weight using mean weights of lobsters observed in catch sampling or voluntary logbook programmes during the survey years. Results for rock lobster from each of these recreational surveys North Region (1993–94), the 1996, 1999–00 and 2000–01 National Diary Surveys are presented in Table 1. In previous rock lobster stock assessments, the RLFAWG has not accepted the results from the 1999–2000 national survey and the subsequent “roll-over” survey, both of which tended to have much higher harvest estimates in most of the QMAs when compared to the earlier surveys (with the
Ministry for Primary Industries CRA 1 Amateur harvest 2013–14 3
exception of CRA 7 and CRA 8) (Ministry of Fisheries 2011). In 2011–12 a national panel survey was undertaken (Wynne-Jones et al. 2014) using a modern off-site survey (Heinemann et al. 2014). The results are presented in Table 1 (noting that where sample size is adequate, the Rock Lobster Fisheries Assessment Working Group has accepted these results). An aerial overflight and access point method of estimating amateur finfish harvest in the Hauraki Gulf and FMA 1 was developed by NIWA in the mid-2000s (Hartill et al. 2007). In 2004–05 they extended flights to East Cape, the boundary of the CRA 2 quota management area and were asked to estimate rock lobster harvest (Table 1). With limited rock lobster harvest data from their access point surveys they used data from the 2001 diary survey to scale their rock lobster estimate (Hartill 2008). A pilot access point survey to estimate rock lobster and scallop harvest by amateur fishers using boats was conducted over the summer of 2007–08 in the Mercury Bay area of Coromandel (Holdsworth & Walshe 2014). This was expanded to cover all access points in the Western Bay of Plenty in 2010–11 and 2011–12 using a combination of all day surveys at fixed points and bus route surveys with roving interviewers (Holdsworth & Walshe in prep.). The tail width and sex of rock lobster encountered was recorded and converted to a mean weight for the survey area. The boat based harvest for the Western Bay of Plenty in 2010–11 and 2011–12 was scaled up to the whole of CRA 2 using the proportions of harvest by method and area from the 2011–12 National Panel Survey (Table 1). Rock lobster harvest in the Tauranga area during 2011–12 was adversely affected by the grounding of the ship Rena in October 2011 and the oil spill and exclusion zone that followed.

4 CRA 1 Amateur harvest 2013–14 Ministry for Primary Industries
Table 1: Estimates of amateur rock lobster harvest in numbers and in tonnes from diary surveys in 1994, 1996, 2000 and 2001 for CRA 1 and CRA 2. Also included is an estimate based on snapper:rock lobster ratio from data collected for the 2004–05 aerial overflight survey, access point surveys in CRA 2 in 2010–11 and 2011–12, and the results of the 2011–12 National Panel Survey.
QMA Number CV (%) Nominal point
estimate (t)1993–94 Northern Region Survey CRA1 56 000 29 38CRA2 133 000 29 821996 National Survey CRA1 74 000 18 51CRA2 223 000 10 1382000 National Survey CRA1 107 000 59 102.3CRA2 324 000 26 235.92001 National Roll Over Survey CRA1 161 000 68 153.5CRA2 331 000 27 241.4 2004–05 Aerial Overflight Survey CRA1 23.6CRA2 30.2 2010–11 Access Point Survey of western Bay of Plenty scaled to all of CRA 2 CRA2 55 260 46 40.9 2011–12 National Panel Survey CRA1 29 700 30 24.0 CRA2 58 500 24 40.86 2011–12 Access Point Survey of western Bay of Plentyscaled to all of CRA 2 CRA2 31 602 47 22.1
1.2 Characterisation of amateur harvest from off-site surveys The off-site surveys provide the only real estimate of harvest and effort across all methods for a random subsample of fishers. The 2001 National off-site survey had the highest harvest estimate in CRA 1, with almost all that harvest (95%) coming from divers on private or charter boats (Table 2). It is possible that a small sample size of fishers in Northland did not capture a representative sample across all methods as no rock lobster were recorded for shore divers or taken by pots. These methods take 5% and 18% of the harvest respectively in CRA 2 (Boyd & Reilly 2004). Potting in CRA 1 and CRA 2 is almost exclusively a boat based method (Table 2). Several reports have been written on potential survey methods that could be used to estimate amateur harvest of rock lobster. The distribution of the amateur rock lobster fishery around New Zealand from the 1996 National Survey is illustrated in Figure 2 (Bradford & George 2002). The authors caution that the sample sizes involved are small and the distribution should be interpreted with care. However, the representation of regions of higher and lower recreational rock lobster harvest should be correct.

Ministry for Primary Industries CRA 1 Amateur harvest 2013–14 5
Table 2: Number of rock lobster harvested by diarists in the 2001 National Survey by fishing method and fish stock. Data from the south region was weighted down because of the higher sampling fraction.
Figure 2: The distribution of (unscaled) rock lobster harvest by diarists in the 1996 National Survey binned by location with the Quota Management Areas numbered.

6 CRA 1 Amateur harvest 2013–14 Ministry for Primary Industries
2 METHODS An area on the Northland east coast from Rangiputa in the north to the southern boundary of CRA 1 was selected as a region where fishing effort for rock lobster is relatively high close to population centres and holiday destinations. This decision was taken in discussion with the Marine Amateur Fisheries Working Group and MPI. To expand the survey to include the remote areas in the Far North and Northland West Coast would require a significant increase in resources to capture very few fishing trips for the main species of interest. Data from previous surveys described above shows that most rock lobster amateur harvest is coming from boat based fishing methods. There are a large number of small access points for boats on the East Northland coast spread along 500 km of coastal roads that are often not well connected. The survey approach used small trailer boat launch sights, main trailer boat ramps and marinas and followed the method developed in the western Bay of Plenty access point surveys (Holdsworth & Walshe in prep.). In this implementation, bus route roving creel surveys (Pollock et al. 1994) covered 67 ramps identified from local knowledge, aerial photographs and a Regional Council guide for boaties in Northland. The survey area was split into 8 separate routes of between 4 and 11 access points. Surveys started at 7:00 am or 7:30 am at a randomly selected access point. Interviewers were provided with the route (clockwise or anticlockwise selected at random) and wait times at each ramp by the survey coordinator. The survey finished at dusk requiring two interviewers working half day shifts of up to seven hours. Crews on returning vessels were interviewed to determine if they had been fishing, their time on the water, methods used and harvest of survey species. All-day coverage was undertaken on three main boat ramps using two interviewers on each ramp working half day shifts. These busy ramps at Waitangi, Tutukaka and Parua Bay have been surveyed before and showed rock lobster as one of the top five species landed. There are five marinas in the survey area with good access to the open coast (Whangaroa, Doves Bay, Opua, Tutukaka, and Marsden Cove). These were covered by stationary interviewers seven hours per day in the afternoon and evening when launches and yachts often return. At Tutukaka the return time and number of boats returning to the marina before 12:30 pm was recorded by interviewers stationed on the all-day trailer boat ramp during the peak five months of the survey (November to March). 2.1 Survey days by strata Fishing effort changes with season and at weekends and holidays. The convention used in previous estimates of amateur harvest of four temporal strata is repeated here (Hartill et al. 2007). These are defined as summer, seven months (1 October to 30 April) and winter, five months (1 May to 30 September) and within these weekdays were separated from weekends and holidays. The number of days in these temporal strata for the 2013–14 survey are given in Table 3. Those strata are aligned to the main commercial fishing year used in New Zealand which starts on 1 October. This survey is aligned with the commercial rock lobster fishing year which starts 1 April. The decision made in the working group was to include April 2013 in the summer strata of 2013–14 to retain the seasonal split of other harvest estimates. Another peculiarity of 2013–14 rock lobster fishing year was that there was no Easter holiday. Easter fell in late March 2013 and mid-April 2014, both events being outside the fishing year surveyed.

Ministry for Primary Industries CRA 1 Amateur harvest 2013–14 7
Table 3: Number of days in 2013–14 rock lobster fishing year in each temporal stratum.
Summer Winter
Weekday Weekend/Holiday Weekday Weekend/Holiday
2013–14 139 73 108 45
This survey was conducted on 60 days within the fishing year. Allocation of the number of survey days within each stratum was informed by a bootstrap analysis of rock lobster harvest from a recent survey on some East Northland boat ramps. Data from the 2011–12 aerial overflight survey was made available by the Ministry for Primary Industries (MPI) and provided by Bruce Hartill (NIWA). The mean harvest in each temporal stratum was expanded by the number of days in that stratum in 2011–12 and summed to give an annual harvest estimate for those five ramps. CVs were derived from a random sample from bootstrap populations of size 45, 73, 108 and 139 constructed by repeating the observed values as many times as necessary, then sampled without replacement for each strata. These were resampled 20 000 times (Table 4). Resampling from a bootstrap population of the same size as the days available in each stratum allows for the finite population correction. This reduces the variance and CV a little because the observed sample days are a fraction of the total number of days. Table 4: Harvest estimates and estimated bootstrapped CVs based on data from five East Northland ramps scaled to the whole year for a range of sampling distributions.
Summer Winter Number
Week WE/Hol Week WE/Hol of CRA % CV
24 20 8 8 3468 15.3
24 18 8 10 3471 15.5
22 22 8 8 3472 15.6
20 20 10 10 3474 15.9
19 21 10 10 3474 16.2
18 24 10 8 3474 16.4
18 24 8 10 3473 16.7
18 18 12 12 3473 16.7
10 34 8 8 3460 20.7
34 10 8 8 3458 15.9
The estimated CVs tend to be lower as the number of summer midweek days increases. However, the summer in 2011–12 was not typical in East Northland. The usual peak of summer holiday effort and harvest was not evident in the Northland survey. Our experience surveying ramps in the western Bay of Plenty is that there is typically greater variance in daily effort and harvest in the summer weekend/holiday strata than the summer midweek strata. Therefore to sample a typical year the number of summer weekend/holidays surveyed should be equal to or greater than the summer midweek days. The Easter holiday period typically is a popular with fishers with high effort days encountered at access points. Easter was in March 2013 and April 2014 which is outside the survey period. A sample distribution of 20 : 20 : 10 : 10 was selected for this survey as it gives reasonable coverage across all strata and was expected to have an acceptable CV. The sampling fractions that result range from 0.093 for winter weekdays to 0.274 for summer weekends and holidays (Table 5).

8 CRA 1 Amateur harvest 2013–14 Ministry for Primary Industries
Table 5: Number of days in each temporal strata for the 2013–14 survey. Season 2013–14 Stratum Total days % of fishing year Survey days Sampling fraction
Summer Weekday 139 38% 20 0.144
Weekend/holiday 73 20% 20 0.274
Winter Weekday 108 30% 10 0.093
Weekend/holiday 45 12% 10 0.222
Care was taken not to survey the same days as the boat ramp surveys for a concurrent project MAF2012/02 (NIWA) in support of the web camera project monitoring recreational fishing effort from trailer boats. Interviewee burden is a problem if two surveys with different objectives and survey requirements operate at the same time. Survey days were selected at random from available days in each stratum. Once selected, days were fixed and the survey proceeded in all weather conditions. The survey for fishers not targeting or catching rock lobster was deliberately kept short to minimise the chance of missing boats that may have caught rock lobster. 2.2 Additional sources of information The operators of charter boats used to take people fishing are required to register and report activity as well as the harvest of some species. An extract of rock lobster harvest within the survey area and period was provided by the database managers at MPI. Recreational charter boat skippers are not required to record harvest of kahawai, trevally and gurnard. Commercial fishers are able to keep up to six rock lobster per person per day for their own use under the provisions of Section 111 of the Fisheries Act (1996). An extract of rock lobster declared under Section 111 was provided for CRA 1 by MPI. Data from the National Panel Survey (NPS) in 2011–12 contains the only available record of recent land based harvest for rock lobster and harvest from boats outside the survey area. The ratio of boat based harvest within the survey area from the NPS to the total NPS harvest estimate for CRA1 was used to scale up the access point survey data to a total CRA 1 harvest estimate for 2013–14. 2.3 Interviewer training Successful applicants for interviewer positions were provided with a contract and survey manual which defined the purpose of the survey, session dates and times, interview technique, data management, health and safety requirements and survey codes. Interviewers had a training session which included each section of manual interview technique and forms. A paid survey day in March for all interviewers at their survey locations was used as a pre-survey trial. Survey coordinators travelled to each location and observed interviews where possible. Data from the trial day was not used in the survey estimates.
Interviewers collected data on the launch time and return time of vessels, whether they were fishing or not, and what they targeted and caught, using paper forms. Details of fishing method and time spent fishing were collected if rock lobster were targeted on that trip. Interviewers were asked to measure the tail width and sex of all red rock lobster using a modified ruler or vernier callipers. Tail length and sex was collected for packhorse rock lobster. Interviewers on Waitangi, Tutukaka and Parua Bay ramps were supplied with digital scales (Terraillon T1040, 5 kg capacity) and a container for holding rock lobster. When time allowed red rock lobster and packhorse were weighed to the nearest gram.

Ministry for Primary Industries CRA 1 Amateur harvest 2013–14 9
Counts of empty boat trailers were made at the start and the finish of each survey session. The two data sheets used are in Appendix 2. Data was entered into a MS Access relational database using field names and codes compatible with the MPI rec_data database. The boat ramp at Waitangi was closed on 6 February for Waitangi Day celebrations. This was a survey day. The Waitangi Ramp was surveyed on the next available day in the weekend/holiday stratum. The data collected on that substitute day were not used in estimating harvest as it is likely that fishing effort was displaced to other available launching locations that were surveyed on 6 February. 2.4 Survey assumptions The key assumptions made in undertaking this survey were:
That the stratified random sampling design adequately captures the mean daily harvest at each access point;
Those fishers who refuse to be interviewed or who return to the main ramps after the survey finishes for the day (numbers estimated by trailer counts at the end of the day) have the same mean harvest of the survey species per trip as the fishers interviewed that day at that location;
Roving wait times are roughly in proportion to expected effort at each location (this was adjusted after the April 2013 data was collected) with the exception that for some less-used ramps a minimum wait time of 20 minutes was used so that some interview data is collected;
Vessels using marinas land almost all harvest of survey species in the afternoon and evening when interviewers are present and no adjustment has been made for vessels that return from fishing in the morning;
The length of the fishing day equals the length of the survey time for bus route harvest expansion; and
Mean weights for kahawai, trevally and gurnard in 2013–14 are the same as the estimates from project MAF2011/03 in 2011–12 (Hartill & Davey 2014).
2.5 Estimating Total Harvest - main ramp (and marina) expansion Main ramps have all day coverage and we interview most groups of fishers returning via these access points and count the groups that are not interviewed (M) or refuse (R). We also count the number of boat trailers left at the end of the survey session (B). Combined this gives an estimate of total effort and harvest for the species surveyed at each site. For sample day j in a stratum let:
Bij Boat trailers in the car park at the end of day j at the ith site
Cij Total harvest of all interviewed boat trip groups at the ith site on day j
Dj Total harvest for all sites on day j
Dm Mean daily harvest in the stratum
H Total harvest Iij Boat trip groups interviewed at the ith site on day j
Mij Boat trip groups not interviewed (missed) at the ith site on day j
n Number of sampled days N Total number of days in the stratum Rij Boat trip groups who refused to be interviewed at the ith site on day j

10 CRA 1 Amateur harvest 2013–14 Ministry for Primary Industries
For each stratum (season, day type and type of site) we scale the observed mean harvest per boat trip
(Cij/Iij) for non-interviewed trips by multiplying by (Iij+ Mij+ Rij+ Bij)/Iij and then summed over
sites to give harvest on day j
Dj = ∑i (Cij/Iij)(Iij+ Mij+ Rij+ Bij) (1)
Within each stratum the estimated mean daily harvest Dm is
Dm = ∑ Dj/n (2)
and the estimated daily variance is
Var(D) = ∑j(Dj - Dm)2/(n - 1) (3)
Then the estimated variance of the mean harvest within each stratum is
Var(Dm) = (Var(D)/ √n)√(1 – n/N) (4)
where N is the total number of fishing days in the stratum, and 1 – n/N is the finite population correction that takes into account the fraction of the fishing days that are sampled (Manly 2009, Section 2.3).
The estimated total harvest for the stratum is
H = N.Dm, (5)
with estimated variance
Var(H) = N.Var(Dm) (6)
2.6 Estimating Total Harvest - bus route direct expansion
For rock lobster we use the sum of the number of trips at each ramp because the number of rock lobster kept is often determined by the bag limit, dive time or number of pots rather than time on the water. The following definitions are used for bus route rock lobster harvest expansion. However for expansion of the observed finfish harvest, trip duration and number of fishers is used as a measure of fishing effort so that eij is the sum of trip minutes for all fishers for the ith ramp on day j and Ej is the total estimated effort in minutes for the bus route on day j.
Ej Total estimated effort (trips) for the bus route on day j
Dj Total estimated harvest for the bus route on day j
Dm Mean estimated harvest per day
Tj Length of the fishing day in minutes on day j
eij Observed fishing effort (trips) for the ith ramp on day j
Cij Total observed harvest for the ith ramp on day j
wij is the observation (wait) time in minutes for the ith site on day j

Ministry for Primary Industries CRA 1 Amateur harvest 2013–14 11
At ramp i on day j in a stratum the total number of boat trips observed per minute of wait time is eij/wij. The estimated total number of trips for the whole of fishing day j at that ramp is therefore the length of the fishing day (in minutes) times the trips per minute Tj eij/wij and the estimated total number of trips for all ramps for each bus route on that day is
Ej = Tj ∑i (eij/wij), (7)
To estimate the total harvest on day j it can be noted that for all ramps combined the mean harvest per trip is ∑Cij/∑eij on that day, where the summations are over the m ramps. This then provides an
estimate of the total harvest for each bus route on day j by multiplying by the expanded total number of trips on day j, i.e.
Dj = Ej ∑Cij/∑eij (8)
The mean harvest per day, Dm, is the sum of harvest for all bus routes on day j divided by the days sampled ∑Dj/n within each stratum, with estimated variance of
Var(Dm) = (Var(D)/ √n)√(1 – n/N) (9)
where there are n observed days in the stratum, N is the total number of days in the stratum, and 1 – n/N is the finite population correction. The standard error of the mean daily harvest is then SE(Dm) = √Var(Dm) while the estimated total harvest for the bus route for the N fishing days in the stratum is therefore H = N.Dm with a variance given by
Var(H) = N.Var(Dm) (10)
The total harvest was estimated by summing the harvest for each day type/access type/season strata. Overall harvest variance was derived from bootstrap resampling of the daily harvest within each stratum to give estimates of the daily mean (equation 2 for main ramps and marinas and equation 8 for bus routes) multiplied by the number of days in each stratum and summed for the survey year. This was resampled 1000 times and the standard error and coefficient of variation calculated from those results.
Harvest estimates in number of fish are converted to total harvest weight by multiplying by mean weight estimates. Interviewers on the main ramps were issued with digital scales and a container for weighing rock lobster. The tail width to weight regression for male and female red rock lobster were calculated using a nonlinear function (Hartill et al. 2013) and the standard residuals were plotted (Appendix 1). There is a tail width to weight regression that has been used for some time for red rock lobster in CRA 1, 2, 3, 4 and 5 (Ministry of Fisheries 2011). Rock lobster tail widths were converted to individual weights using these regressions for male and female fish in each 1 mm size class. Almost all rock lobster were measured so these weights were summed and divided by the number of measured fish to derive the mean weight.

12 CRA 1 Amateur harvest 2013–14 Ministry for Primary Industries
Table 6: Rock lobster length weight regressions used to estimate total harvest weight.
Red rock lobster Weight = a TWb (weight in kg, TW tail width in mm)
Females Males
a b a b East Northland boat ramp data 2013–14 2.015 E-05 2.459 1.732 E-06 3.119 Ministry of Fisheries (2011) 1.30 E-05 2.5452 4.16 E-06 2.9354
Packhorse rock lobster Weight = a TLb (weight in kg, TL tail length in mm)
Females Males
a b a b East Northland commercial catch sampling 2014 4.875 E-07 2.785 3.562 E-08 3.290
The tail length to weight regression for packhorse rock lobster was generated from a sample of 80 commercially caught fish which were graded and binned for transport, so that excess water had drained. They were weighed on scales with 10 gram resolution and measured with a hand held ruler in a similar way to what interviewers did in this survey. This may underestimate the true length of these packhorse rock lobster but is fit for the purpose for converting tail lengths collected by interviewers to weights.
Mean weights for kahawai, trevally and gurnard caught by recreational fishers were estimated in the project MAF2011/03. The all year estimates for East Northland are used as mean harvest weights for this survey to estimate total harvest in tonnes.
2.7 Expanding harvest estimates to all of CRA 1 The best available information on recent recreational harvest for all methods, in all of CRA1, is from the NRB National Panel Survey in 2011–12 (Wynne-Jones et al. 2014). The proportion of all CRA 1 harvest taken by boat based methods in the survey area in the NPS was used to scale up the harvest estimate from the 2013–14 survey estimate for all of CRA 1. This was derived by scaling up the daily harvest in CRA 1 for each of the panellists by the weighting factor calculated by NRB for that person. The sum of all 90 CRA 1 rock lobster harvest records was resampled 1000 times. The sum of the 64 NPS records for boat based harvest between Rangiputa and Mangawhai only was resampled 1000 times and the proportion of harvest from that subset of data calculated 1000 times to give the BTR prop.(CRA 1)n. This includes all trips that are in the sample frame for the current survey. The 2013–14 Access Survey harvest was also bootstrapped 1000 times to give the BTR Surveyn (equation 11).
The number of rock lobster harvested in CRA 1 was estimated from the mean of the bootstrapped 2013–14 survey harvest divided by the proportion of the National Panel Survey CRA 1 harvest that was in the sample frame for the 2013–14 Access Survey.
BTR Surveyn
CRA 1n = BTR prop.(CRA 1)n (11)
Ministry for Primary Industries CRA 1 Amateur harvest 2013–14 13
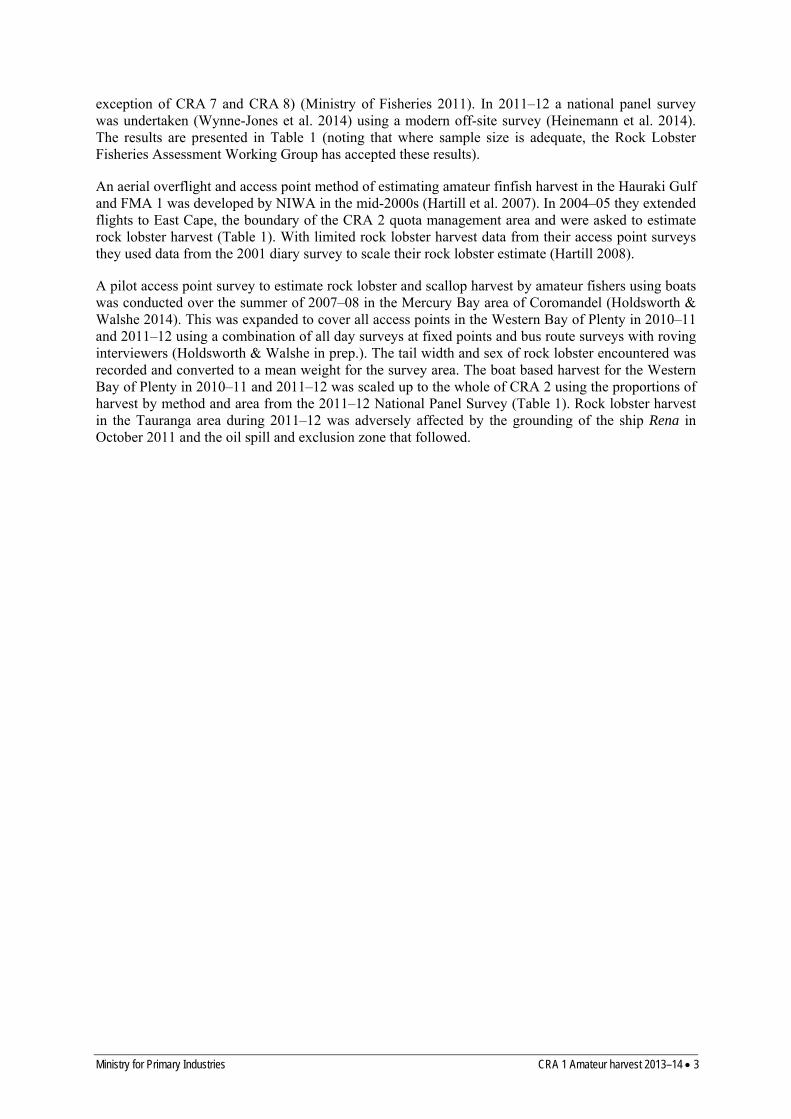
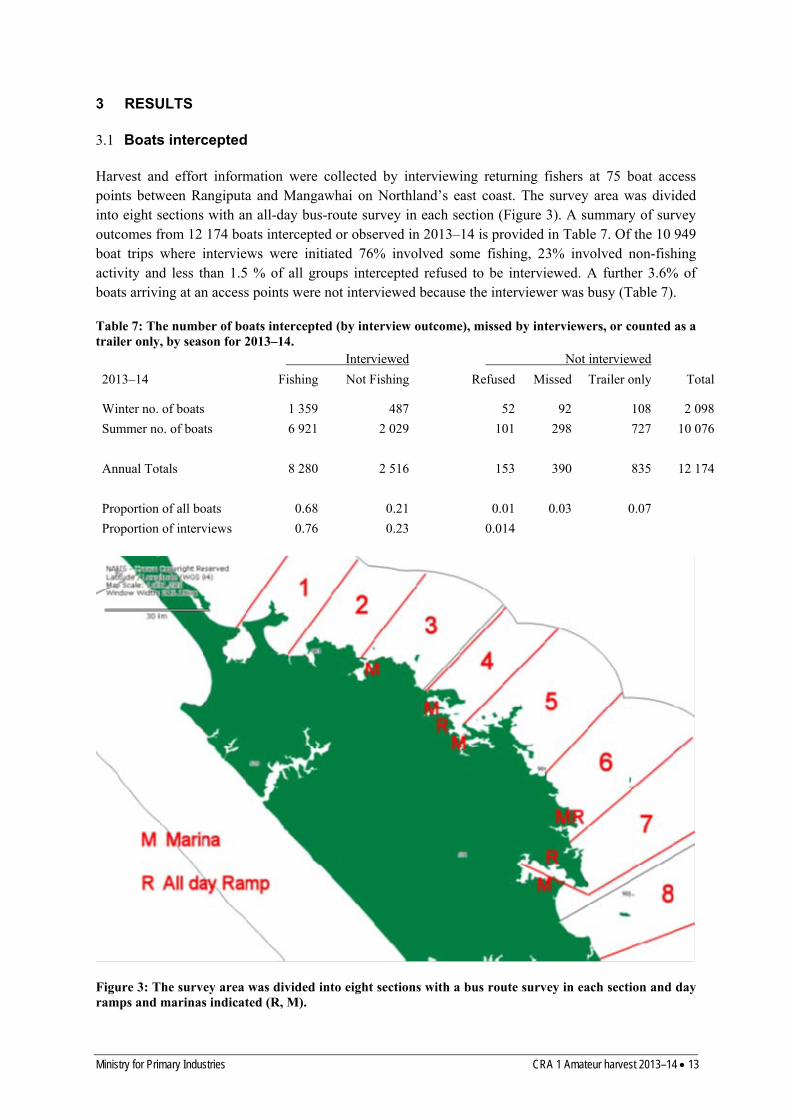
3 RESULTS 3.1 Boats intercepted Harvest and effort information were collected by interviewing returning fishers at 75 boat access points between Rangiputa and Mangawhai on Northland’s east coast. The survey area was divided into eight sections with an all-day bus-route survey in each section (Figure 3). A summary of survey outcomes from 12 174 boats intercepted or observed in 2013–14 is provided in Table 7. Of the 10 949 boat trips where interviews were initiated 76% involved some fishing, 23% involved non-fishing activity and less than 1.5 % of all groups intercepted refused to be interviewed. A further 3.6% of boats arriving at an access points were not interviewed because the interviewer was busy (Table 7). Table 7: The number of boats intercepted (by interview outcome), missed by interviewers, or counted as a trailer only, by season for 2013–14.
Interviewed Not interviewed
2013–14 Fishing Not Fishing Refused Missed Trailer only Total
Winter no. of boats 1 359 487 52 92 108 2 098
Summer no. of boats 6 921 2 029 101 298 727 10 076
Annual Totals 8 280 2 516 153 390 835 12 174
Proportion of all boats 0.68 0.21 0.01 0.03 0.07
Proportion of interviews 0.76 0.23 0.014
Figure 3: The survey area was divided into eight sections with a bus route survey in each section and day ramps and marinas indicated (R, M).

14 CRA 1 Amateur harvest 2013–14 Ministry for Primary Industries
3.2 Unscaled harvest and length frequency The number of rock lobsters on vessels intercepted at boat ramps peaked in mid-afternoon. Fewer rock lobsters were encountered in marinas, with a peak in the late afternoon (Figure 4). Survey session length varied with season, starting at 07:00 or 07:30 throughout the year but finishing between 17:00 hours in July and 20:30 hours in December/January. The length of the fishing day is an important parameter for expanding the observed bus route harvest. The length of the survey day was used as an estimate of the number of hours in the fishing day.
Figure 4: Unscaled rock lobster harvest for the three access point types by hour of the day. Large marinas are challenging to survey. We used two interviewers working together, one to keep a record of the vessels entering the marina and one to interview crews on their return. Session times at marinas varied from 10:00 to 17:00 in winter to 13:30 to 18:30 in summer. Some harvest from vessels returning early to marinas may have been missed. During the survey design phase the proportion of vessels returning early to marinas was considered to be small. At Tutukaka the return time and number of boats returning to the marina before 12:30 pm was recorded by interviewers stationed on the all-day trailer boat ramp adjacent to the marina during the peak five months of the survey (November to March). In total, 56 boats returned to the marina before the marina interviewers arrived, over the 30 survey days in that period. Of these, twelve were yachts which, in this survey, were seldom found to be targeting rock lobster. Therefore fewer than two boats per survey day were missed, representing about 8% of all marina traffic at Tutukaka. The split of trips and harvest encountered in each survey section shows that section 4 (the northern Bay of Islands), which includes the all-day Waitangi ramp and the Doves Bay and Opua marinas, encountered the most boat trips and the most kahawai harvest (Table 7). The Tutukaka Coast, section 6, had 40% fewer boat trips encountered than section 4 but more red rock lobster than the other sections. Vessels in section 8, mainly from Whangarei Harbour and Mangawhai Harbour, recorded more trevally and gurnard than other sections (Table 8). Overall, kahawai was the most common species in the survey, followed by rock lobster, trevally, and gurnard. Total harvest will be higher in sections where there was more fishing effort and more vessels encountered. The average harvest per fishing trip (ratio of means) by section shows that section 5, southern Bay of Islands and Whangaruru, had the highest catch rate for kahawai, trevally and gurnard and equal highest for red rock lobster with section 6 (Table 9). Rock lobster and gurnard harvest were above the overall average per trip in Doubtless Bay and Taupo Bay.

Ministry for Primary Industries CRA 1 Amateur harvest 2013–14 15
Table 8: The unscaled observed harvest by species and boat numbers from all access points in each survey section.
North South
Section number 1 2 3 4 5 6 7 8 Total
Boats and trailers 405 890 946 3 624 568 2 203 2 075 1 463 12 174
Rock lobster kept 44 212 92 429 167 554 129 271 1 905
Packhorse kept 0 2 12 13 11 2 23 7 70
Kahawai kept 285 452 925 1 530 604 457 534 656 5 472
Trevally kept 95 48 185 325 248 244 198 429 1 773
Gurnard kept 15 76 34 21 61 27 102 164 500 Table 9: The average harvest per interviewed fishing trip for each section by species.
North South
Section number 1 2 3 4 5 6 7 8 All
sections
Rock lobster kept 0.12 0.28 0.13 0.22 0.40 0.40 0.09 0.22 0.23
Packhorse kept 0.000 0.003 0.017 0.006 0.026 0.001 0.017 0.006 0.01
Kahawai kept 0.75 0.60 1.31 0.78 1.45 0.33 0.38 0.54 0.66
Trevally kept 0.25 0.06 0.26 0.16 0.59 0.17 0.14 0.35 0.21
Gurnard kept 0.04 0.10 0.05 0.01 0.15 0.02 0.07 0.13 0.06 The size distribution of red rock lobster in 2013–14 was quite broad with a mode at 60 mm for males and 64 mm for females (Figure 5). There were more males harvested across the size range, and no females larger than 91 mm tail width. There were a few female rock lobster under the 60 mm minimum legal size (MLS). These undersized female fish appear to have been accurately measured. They were recorded by several interviewers including some of the most reliable. Tail length was measured for 63 packhorse rock lobster with most males and females between 220 mm and 270 mm (Figure 6). Eight packhorse under the minimum size of 216 mm were encountered. However, subsequent experience at a commercial pack house showed that measuring rock lobster tail length while holding it in one hand under estimated tail length compared with laying the tail flat on a surface with the ruler underneath. Lengths were not collected for finfish species. Rock lobster tail widths were plotted for three sub areas; Far North, Bay of Islands, and from Cape Brett south to reveal any spatial differences in size distribution that may be present (Figure 7). The proportion of small females (60 to 65 mm) was higher in the southern area, but otherwise the size distribution was similar.

16 CRA 1 Amateur harvest 2013–14 Ministry for Primary Industries
Figure 5: Tail width frequency (2 mm size classes) for measured rock lobster by sex with minimum legal size for males (54 mm) and females (60 mm) indicated.
Figure 6: Tail width frequency (5 mm) for packhorse rock lobster by sex (MLS 216 mm).

Ministry for Primary Industries CRA 1 Amateur harvest 2013–14 17
Figure 7: Rock lobster proportion of harvest by tail width (2 mm) by sub area and sex (top) and plotted as cumulative proportions (bottom).
Figure 8: Rock lobster weight by tail width and sex from East Northland recreational harvest and the non-linear regressions used to estimate mean weight.
18 CRA 1 Amateur harvest 2013–14 Ministry for Primary Industries
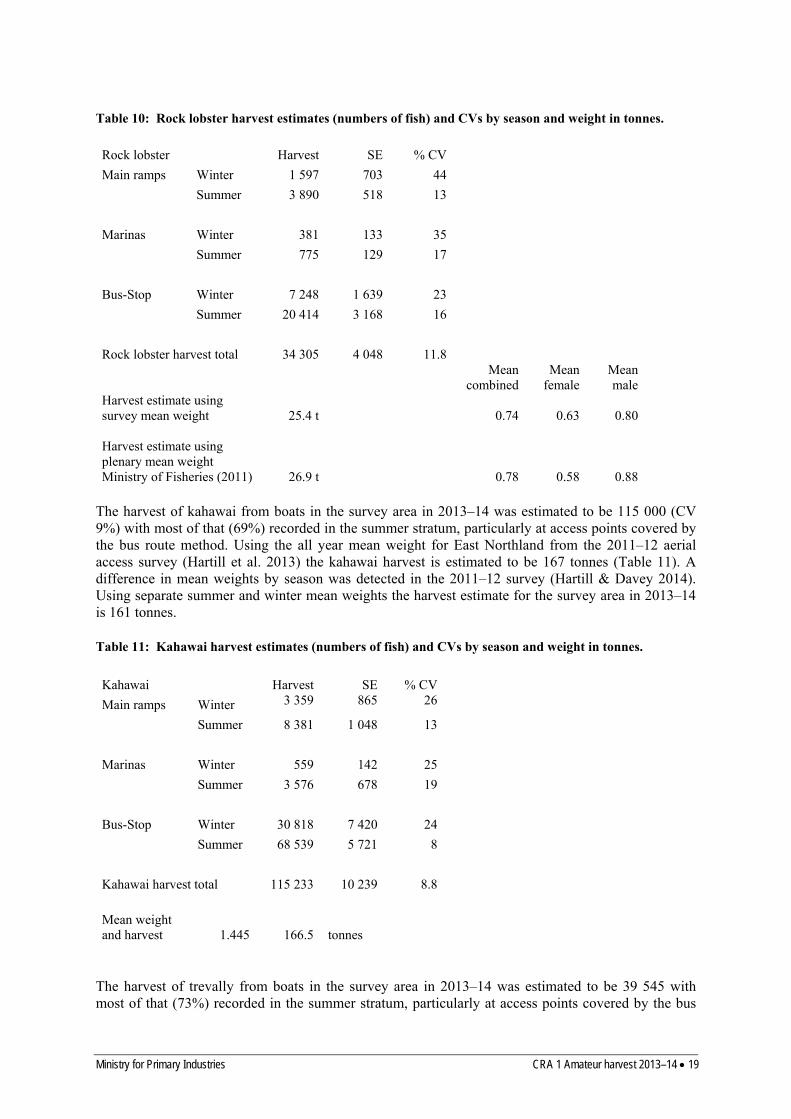
Tail width and weight of rock lobster were recorded by interviewers on the all-day ramps at Waitangi, Tutukaka and Parua Bay using digital scales. A container for holding rock lobster was placed on the scales, which were tared to read zero. There were some problems getting stable weight readings if the scales were on an uneven surface or when the wind blew against the tall container. The original container weighed 244 g and some weights for small rock lobster appear to be heavy by about that amount, suggesting that the scale was not tared correctly. The scales can weigh in grams or ounces (to one decimal place) and some weights that are much smaller than expected match the weight in ounces for a rock lobster of that size. Often these errors were consistent for all rock lobster in a landing. The 51 records that appeared to have one of these errors were not used in the length weight regressions. (Figure 8). Some of these may not be whole weights, as rock lobster were weighed even if they had legs missing. 3.3 Expanded harvest estimates for the survey area The mean harvest per day within each stratum is used to estimate the total harvest by species in numbers of fish for the fishing year using the expansion methods described above (adapted from Pollock et al. 1994). The variance is calculated between survey days within stratum as described in the methods section. There are effectively six strata for each species in each season (2 day types × 3 access point types). The expanded harvest estimates and variance in numbers of fish for species for each season and access point type are provided in Tables 10 to 14. The harvest of rock lobster from boats in the survey area in 2013–14 was estimated to be 34 305 (CV 11.8%) with most of that (74%) recorded in the summer stratum (October to end of April). When the mean weight calculated from the tail width to weight regressions (Figure 8) is applied to the tail width frequencies by sex (Figure 5) the mean weight is 0.74 kg. Thus the boat based harvest estimate for the survey area is 25.4 t (Table 10). There is a tail width to weight regression that has been used for some time for rock lobster in CRA 1,2,3,4 and 5 (Ministry of Fisheries (2011). Using this regression the mean weight for rock lobster measured in this survey is 0.78 kg and the harvest estimate is 26.9 t for the year (Table 10). The largest difference between these two conversion regressions is for males. The mean weight used to convert rock lobster harvest to weight in the National Panel Survey in CRA 1was 0.81 kg.
Ministry for Primary Industries CRA 1 Amateur harvest 2013–14 19
Table 10: Rock lobster harvest estimates (numbers of fish) and CVs by season and weight in tonnes. Rock lobster Harvest SE % CV
Main ramps Winter 1 597 703 44
Summer 3 890 518 13
Marinas Winter 381 133 35
Summer 775 129 17
Bus-Stop Winter 7 248 1 639 23
Summer 20 414 3 168 16
Rock lobster harvest total 34 305 4 048 11.8
Mean combined
Mean female
Mean male
Harvest estimate using survey mean weight 25.4 t 0.74
0.63
0.80
Harvest estimate using plenary mean weight Ministry of Fisheries (2011) 26.9 t 0.78
0.58
0.88 The harvest of kahawai from boats in the survey area in 2013–14 was estimated to be 115 000 (CV 9%) with most of that (69%) recorded in the summer stratum, particularly at access points covered by the bus route method. Using the all year mean weight for East Northland from the 2011–12 aerial access survey (Hartill et al. 2013) the kahawai harvest is estimated to be 167 tonnes (Table 11). A difference in mean weights by season was detected in the 2011–12 survey (Hartill & Davey 2014). Using separate summer and winter mean weights the harvest estimate for the survey area in 2013–14 is 161 tonnes. Table 11: Kahawai harvest estimates (numbers of fish) and CVs by season and weight in tonnes. Kahawai Harvest SE % CV
Main ramps Winter 3 359 865 26
Summer 8 381 1 048 13
Marinas Winter 559 142 25
Summer 3 576 678 19
Bus-Stop Winter 30 818 7 420 24
Summer 68 539 5 721 8
Kahawai harvest total 115 233 10 239 8.8
Mean weight and harvest 1.445 166.5 tonnes
The harvest of trevally from boats in the survey area in 2013–14 was estimated to be 39 545 with most of that (73%) recorded in the summer stratum, particularly at access points covered by the bus

20 CRA 1 Amateur harvest 2013–14 Ministry for Primary Industries
route method. Using the all year mean weight for East Northland from the 2011–12 aerial access survey (Hartill & Davey 2014) the trevally harvest is estimated to be 41 tonnes (Table 12). Table 12: Trevally harvest estimates (numbers of fish) and CVs by season and weight in tonnes. Trevally Harvest SE % CV
Main ramps Winter 1 486 649 44
Summer 2 450 362 15
Marinas Winter 559 142 25
Summer 1 570 306 19
Bus-Stop Winter 8 805 1 902 22
Summer 24 675 3 157 13
Trevally harvest total 39 545 3 911 9.8
Mean weight and harvest 1.045 41.3 tonnes
The harvest of red gurnard from boats in the survey area in 2013–14 was estimated to be 9 883 with most of that (70%) recorded in the summer stratum, particularly at access points covered by the bus route method. Using the all year mean weight for East Northland from the 2011–12 aerial access survey (Hartill & Davey 2014) the gurnard harvest is estimated to be 4.0 tonnes (Table 13). Table 13: Gurnard harvest estimates (numbers of fish) and CVs by season and weight in tonnes. Gurnard Harvest SE % CV
Main ramps Winter 177 45 25
Summer 569 134 24
Marinas Winter 73 43 59
Summer 156 36 23
Bus-Stop Winter 2 669 1 080 40
Summer 6 238 1 032 17
Gurnard harvest total 9 883 1 571 15.8
Mean weight and harvest 0.408 4.0 tonnes
The harvest of packhorse rock lobster from boats in the survey area in 2013–14 was estimated to be 2040 with about half of that recorded in the summer stratum (October to end of April). The mean weight was calculated from the length weight data collected in this survey. Only eleven packhorse were measured and weighed in this survey. Additional length weight data were collected from a commercial pack house to generate a length weight relationship for each sex. This was used to convert the tail length measurements collected by interviews to weights. The average weight of packhorse in this survey was 2.41 kg and the boat based harvest estimate for the survey area is 4.9 tonnes (Table 14).

Ministry for Primary Industries CRA 1 Amateur harvest 2013–14 21
Table 14: Packhorse harvest estimates (numbers of fish) and CVs by season and weight in tonnes.
Packhorse Harvest SE % CV
Main ramps Winter 12 11 88
Summer 74 24 33
Marinas Winter 5 5 88
Summer 0 0 0
Bus-Stop Winter 970 439 45
Summer 978 362 37
Packhorse harvest total 2 040 615 30
Mean weight and harvest 2.412 4.9 tonnes
3.4 Expanded harvest estimates for CRA 1 and East Northland The harvest estimates in the the tables above are for boat based harvest for vessels returning to access points in the survey area only. The best available information on recent recreational harvest for all methods, in all of CRA 1, is from the NRB National Panel Survey (NPS) in 2011–12 (Wynne-Jones et al. 2014). The proportion of all CRA 1 harvest taken by boat based methods in the survey area in the NPS was used to scale up the harvest estimate from the 2013–14 survey estimate for all of CRA 1. This assumes that the proportions of harvest by method and area in the NPS was representative of the actual harvest, even though the sample size of Northland rock lobster harvest was quite low. It also assumes that harvest by area and method are similar in 2013–14 to those in 2011–12. Using bootstrapped estimates described in the methods section the total rock lobster harvest estimate in CRA 1 is 50 430 rock lobster or 37.3 tonnes (Table 15). Adding in the 4.4 tonnes of recreational harvest by commercial fishers reported under s111 in 2013–14 gives a total of 42 tonnes for CRA 1. Table 15: Rock lobster harvest estimates in the survey area expanded to all of CRA 1 and weight in tonnes.
Harvest SE % CV
Red rock lobster harvest this survey 34 305 4 048 12 Proportion of LSMS rock lobster from boats inside the survey area 0.69 0.084 12
Amateur harvest estimate for all CRA 1 50 430 8 582 17
Amateur harvest using 0.74 kg mean weight
37.3 t
Recreational harvest by commercial fishers reported under s111
4.4 t
Total recreational harvest 41.7 t
The MPI charterboat reporting programme requires the reporting of rock lobster harvest on recreational fishing charter trips. A total of 67 rock lobster were reported from seven charter days in 2013–14 for CRA 1. Charter boats were included in the access point survey area. The 64 rock lobster

22 CRA 1 Amateur harvest 2013–14 Ministry for Primary Industries
reported on the charter forms were estimated to weigh 41 kg (mean 0.64 kg) taken in charter trips outside the survey area. Including this harvest will not change the CRA 1 amateur harvest estimate. There is considerable uncertainty about the the representativeness of the packhorse rock lobster harvest reported in the National Panel Survey. From a total of 48 packhorse nationally (PCH 1) in 2011–12 there were 12 reported from the East Northland survey area, all taken from boats. No expansion was attempted from the small amount of data available. The National Panel Survey data for kahawai, trevally and gurnard in East Northland were bootstrapped to estimate the proportion of harvest recorded in the same sample frame as the 2013–14 Access Survey. These were used as above to expand harvest estimates for that region and compared to harvest estimates in 2011–12 (Table 16). The kahawai and trevally estimates from the 2013–14 Access Survey were significantly higher than the National Panel Survey and Aerial Access Survey estimates, while the red gurnard estimate was in the middle of the range (Table 16). Table 16: Harvest estimates for finfish surveyed in 2013–14 expanded for the East Northland region and compared with the NRB National Panel Survey and the NIWA Aerial Access Survey for the same area in 2011–12.
East Northland East Northland East Northland
2013–14 Access Survey 2011–12 Panel Survey 2011–12 Aerial Access
Species Weight (t) % CV Weight (t) % CV Weight (t) % CV
Kahawai 349 15 204 12 191 16
Trevally 88 19 53 22 30 25
Gurnard 6 28 9 42 3 30 3.5 Expanded harvest estimates by month The average expanded harvest per survey day by month shows a reasonably consistent seasonal pattern aross the species surveyed (Figure 10). There is a declining trend from April to August and then harvest increases to a peak in January. There were several survey days with strong winds in February which reduced observed harvest in that month. Kahawai numbers are about double those of other species and are plotted agrainst the right hand vertical axis. Rock lobster harvest is fairly consistent from March to September and is greater from October to January but did not show the same peak in January seen in other species (Figure 9).

Ministry for Primary Industries CRA 1 Amateur harvest 2013–14 23
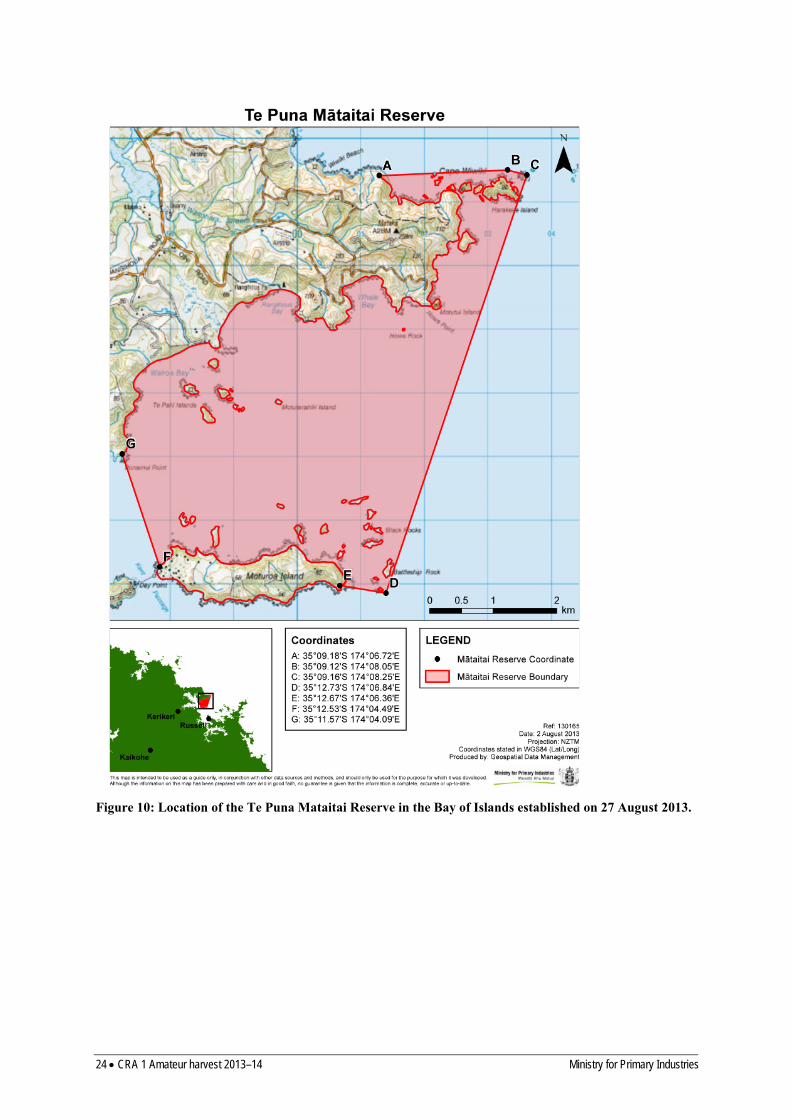
Figure 9: Average expanded number of fish harvested per survey day by month and species. 3.6 Amateur harvest taken inside areas closed to commercial rock lobster fishing There are two areas in CRA 1 that are closed to commercial rock lobster fishing which allow amateur harvest. These areas are the Mimiwhangata Marine Park and the Te Puna Mataitai Reserve in the eastern Bay of Islands. In the Bay of Islands there is also a seasonal closure to commercial fishing inside the Islands from 1 October to 30 April but rock lobster potting is allowed under permit. Data was not collected on harvest from inside and outside the Mimiwhangata Marine Park. This was an oversight during the survey set up. The Te Puna Mataitai Reserve was established on 27 August 2013, mid way through the Access Survey (Figure 10). This area is covered by a single fishing area on the location maps shown to fishers. The expanded harvest in the Te Puna Mataitai Reserve for the seven months covered by this survey was 1709 rock lobster (CV 0.37) or 1.25 t using the survey wide mean weight. Other areas in CRA 1 that are closed to commercial rock lobster potting are also closed to recreational fishing. These areas are the rahui on all fishing except for harvesting kina in Maunganui Bay, (Deep Water Cove) Bay of Islands. This is supported by a closure under Section 186A of the Fisheries Act (1996). Also the Poor Knights Islands Marine Reserve which includes the islands of the High Peak Rocks and Sugarloaf. There is a three nautical mile buffer zone around these marine reserves which excludes all commercial fishing except by longline. This water is over 80 meters deep and no recreational fishing for rock lobster occurs there (pers comm. Peter Saul, recreational charter boat opperator).
24 CRA 1 Amateur harvest 2013–14 Ministry for Primary Industries
Figure 10: Location of the Te Puna Mataitai Reserve in the Bay of Islands established on 27 August 2013.
Ministry for Primary Industries CRA 1 Amateur harvest 2013–14 25
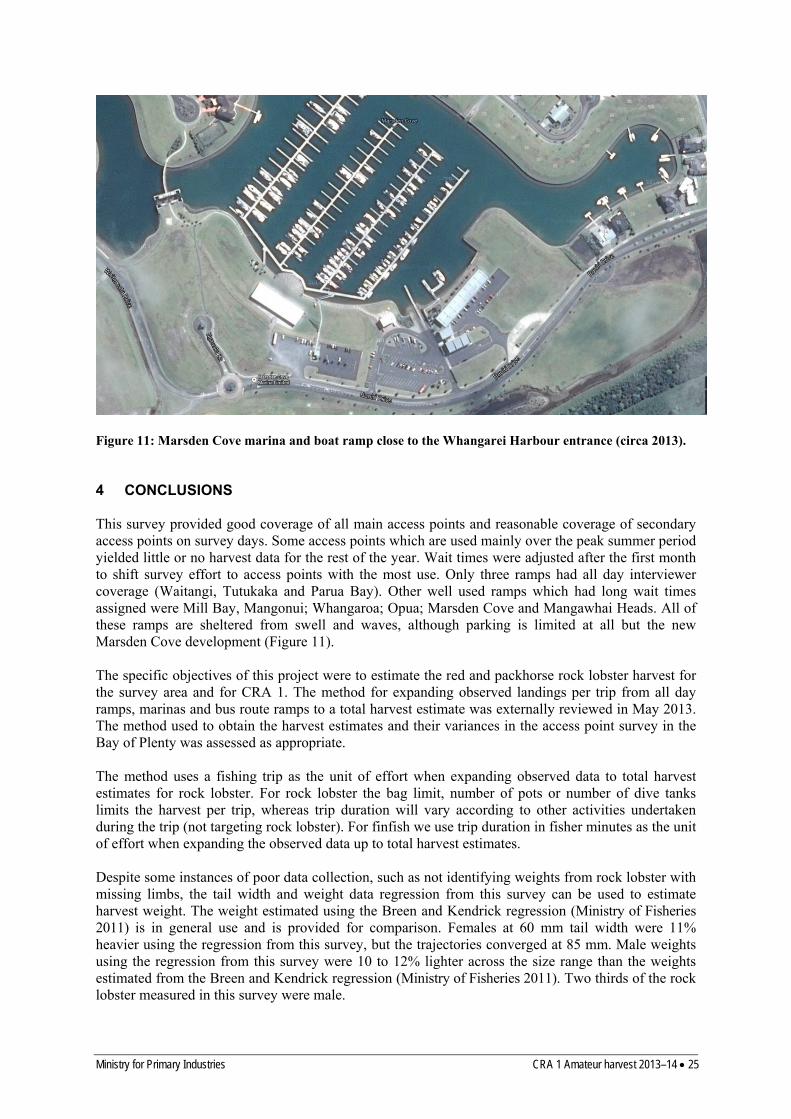
Figure 11: Marsden Cove marina and boat ramp close to the Whangarei Harbour entrance (circa 2013). 4 CONCLUSIONS This survey provided good coverage of all main access points and reasonable coverage of secondary access points on survey days. Some access points which are used mainly over the peak summer period yielded little or no harvest data for the rest of the year. Wait times were adjusted after the first month to shift survey effort to access points with the most use. Only three ramps had all day interviewer coverage (Waitangi, Tutukaka and Parua Bay). Other well used ramps which had long wait times assigned were Mill Bay, Mangonui; Whangaroa; Opua; Marsden Cove and Mangawhai Heads. All of these ramps are sheltered from swell and waves, although parking is limited at all but the new Marsden Cove development (Figure 11). The specific objectives of this project were to estimate the red and packhorse rock lobster harvest for the survey area and for CRA 1. The method for expanding observed landings per trip from all day ramps, marinas and bus route ramps to a total harvest estimate was externally reviewed in May 2013. The method used to obtain the harvest estimates and their variances in the access point survey in the Bay of Plenty was assessed as appropriate. The method uses a fishing trip as the unit of effort when expanding observed data to total harvest estimates for rock lobster. For rock lobster the bag limit, number of pots or number of dive tanks limits the harvest per trip, whereas trip duration will vary according to other activities undertaken during the trip (not targeting rock lobster). For finfish we use trip duration in fisher minutes as the unit of effort when expanding the observed data up to total harvest estimates. Despite some instances of poor data collection, such as not identifying weights from rock lobster with missing limbs, the tail width and weight data regression from this survey can be used to estimate harvest weight. The weight estimated using the Breen and Kendrick regression (Ministry of Fisheries 2011) is in general use and is provided for comparison. Females at 60 mm tail width were 11% heavier using the regression from this survey, but the trajectories converged at 85 mm. Male weights using the regression from this survey were 10 to 12% lighter across the size range than the weights estimated from the Breen and Kendrick regression (Ministry of Fisheries 2011). Two thirds of the rock lobster measured in this survey were male.

26 CRA 1 Amateur harvest 2013–14 Ministry for Primary Industries
There is no published tail length to weight regression for packhorse rock lobster available. We measured and weighed a sample of eighty packhorse from a commercial pack house to derive the mean weight used in this report. However, this regression is not recommended for use elsewhere due the measurement method and the relatively small sample size. Customised measuring equipment for obtaining accurate tail length measures of packhorse is recommended should harvest estimates be required in future. Rock lobster is an important component of amateur harvest in Northland, probably fifth in harvest weight behind snapper, kahawai, yellowtail kingfish and trevally. In 2013–14 it was taken mainly by SCUBA and free diving from October to January. Easterly quarter winds may have reduced fishing effort and harvest for all the species surveyed in February 2014. Areas close to the population centres around Whangarei and Bay of Islands had the most fishing effort and amateur harvest. Overall the harvest rate for rock lobster fishers in this survey was 1.6 per person per trip including unsuccessful trips. There are two areas closed to commercial fishing but open to amateur fishing in CRA1. No data was collected on the Mimiwhangata Marine Park. The Te Puna Mataitai Reserve was establish on 27 August 2013 5 months after the start of this survey. The expanded harvest in this area for the seven months covered by this survey was 1709 rock lobster (CV 0.37) or 1.25 t using the survey wide mean weight. Harvest estimates from this survey will underestimate the true boat based harvest from the survey area because not all boats were readily accessible on survey days. Harvest and effort was not collected from boats on swing moorings or returning to private waterways at Marsden Cove. Harvest from boats returning to marinas in the morning or staying out overnight on survey days would not be taken into account. The northeast coast, and the Bay of Islands and Whangaroa Harbour in particular, is a popular cruising destination for launches and yachts over summer. Harvest from vessels that fished on survey days but did not return to marinas or boat ramp will not be included in these estimates. While 75 access points were covered there are many possible launch sites which may occasionally be used. This included coverage of seldom used ramps or beach launch sites. Several access points were covered where little or no fishing effort was encountered. When harvest is recorded at access points assigned short wait times the expanded harvest can be quite large. An example is nine rock lobster landed at Bland Bay which had a 70 minute wait time on 26 October 2013 expanded to 90 rock lobster. The average harvest recorded over the 40 survey days in the summer stratum was 7.7 rock lobster per day and less that one per day over the winter stratum at Bland Bay. The harvest from rock lobster pots may be underestimated in this survey if fishers check them early in the morning and return before interviewers arrive at access points. This behaviour is not common at Tutukaka or Whangarei (Pers Comm. Peter Saul, Charter boat operator) but may occur at other locations. Amateur charter vessel skippers are required to complete activity and harvest logbooks for selected species including rock lobster. However, only 67 rock lobster were reported by charter skippers in CRA 1 during the 2013–14 survey period. While rock lobster may not be a common target for charter vessels in CRA 1, it may also be that the logbook data are not robust or complete. This may bias the harvest estimate downwards. The mean weight used for this harvest estimate may also have a small negative bias as damaged rock lobster, with missing legs for instance, were not excluded from the tail width and weight sample collected. Despite those potential negative biases, the 2013–14 Access Survey estimated the same or larger harvest from the survey area alone than the National Panel Survey did for all of CRA 1. Expanding the Access Survey harvest by the proportion of National Panel Survey harvest outside the Access Survey sample frame and adding in the 4.4 tonnes of s111 harvest reported by commercial fishers

Ministry for Primary Industries CRA 1 Amateur harvest 2013–14 27
gives a total for CRA 1 of 42 t (0.17) in 2013–14 compared to the total for amateur fishers in the National Panel Survey of 24 t (0.13). The 2013–14 Access Survey harvest estimates for kahawai and trevally were also higher than the 2011–12 National Panel Survey by a similar proportion, about 70%. The opposite is true for the small East Northland gurnard fishery with the Access Survey estimate of 6 t (0.28) compared with 9 t (0.48) in the National Panel Survey. Accordingly this Access Survey estimate of recreational harvest in CRA 1 of 42 t (0.17) for 2013–14 is considered to be robust but more likely to be an underestimate than an overestimate. 5 ACKNOWLEDGEMENTS This work was funded by the Ministry for Primary Industry through project MAF2012/06. Many thanks to Dr Bryan Manly for assisting in the survey design and analysis. Many thanks also to Bruce Hartill for calculating the tail width to weight regression for rock lobster data collected in this survey using a nonlinear function. Thanks also to Alan Brierley for building the relational database. Thanks to all the interviewers on boat ramps and marinas who engaged with fishers and recorded their harvest, in particular Steve Sangster for his excellent help maintaining full coverage on survey days. The cooperation and assistance from Leigh Fisheries Limited and staff in obtaining the length – weight relationship for packhorse rock lobster was greatly appreciated. Thanks to Neville Smith and the Marine Amateur Fisheries Working Group for assisting in the design and review of this project. 6 REFERENCES Boyd, R.O.; Reilly, J.L. (2004). 2000–2001 national marine recreational fishing survey: diary results
and harvest estimates. Draft New Zealand Fisheries Assessment Report. 81 p. (Unpublished report held by Ministry for Primary Industries, Wellington.)
Bradford, E.; George, K. (2002). Feasibility of annual surveys for estimating recreational harvest in
CRA 1 to CRA 5. New Zealand Fisheries Assessment Report 2002/8. 18 p. Hartill, B. (2008). Estimating recreational harvest of rock lobster. New Zealand Fisheries Assessment
Report 2008/11. 20 p Hartill, B.; Bian, R.; Armiger,H.; Vaughan, M.; Rush, N. (2007). Recreational marine harvest
estimates of snapper, kahawai and kingfish in QMA 1 in 2004–05. New Zealand Fisheries Assessment Report 2007/26. 44 p.
Hartill, B.; Bian, R.; Rush, N.; Armiger, H. (2013). Aerial-access recreational harvest estimates for
snapper, kahawai, red gurnard, tarakihi and trevally in FMA 1 in 2011–12. New Zealand Fisheries Assessment Report 2013/70. 44 p.
Hartill, B; Davey, N. (2014). Mean weight estimates for recreational fisheries in 2011–12. New
Zealand Fisheries Assessment Report 2014/xx. 41 p. Hartill, B.W.; Watson, T.G.; Bian, R. (2011). Use of a modified maximum count aerial-access design
to survey a large scale recreational fishery in New Zealand. North American Journal of Fisheries Management 31:6. 1197–1210.
Heinemann, A.; Wynne-Jones, J.; Gray, A.; Hill, L. (2014). National panel survey of marine
recreational fishers 2011–12. Rationale and Methods. New Zealand Fisheries Assessment Report 2014/xx. Xx p.

28 CRA 1 Amateur harvest 2013–14 Ministry for Primary Industries
Holdsworth, J.C.; Walshe. K.A.R. (2014). Amateur harvest estimates for scallop and rock lobster fisheries from the eastern Coromandel, New Zealand 2007–08. New Zealand Fisheries Assessment Report 2014/56. 31 p.
Holdsworth, J.C.; Walshe K.A.R. (In Prep.). Amateur harvest estimates from an access point survey
in the eastern Coromandel and Bay of Plenty, New Zealand in 2010–11 and 2011-12. Draft New Zealand Fisheries Assessment Report held by MPI Wellington.
Manly, B.F.J. (2009). Statistics for Environmental Science and Management, 2nd Edition. Chapman
and Hall/CRC, Boca Raton. Ministry of Fisheries (2011). Report from the Fisheries Assessment Plenary May 2011: stock assessments
and yield estimates. Compiled by the Fisheries Science Group, Ministry of Fisheries, Wellington, New Zealand.
Pollock, K.H.; Jones, C.M.; Brown, T.L. (1994). Angler survey methods and their applications in
Fisheries Management. American Fisheries Society Special Publication 25. Bethesda, Maryland United States.
Wynne-Jones, J.; Gray, A.; Hill, L.; Heinemann, A. (2014). National panel survey of marine
recreational fishers 2011–12: Harvest Estimates. New Zealand Fisheries Assessment Report 2014/67. 147 p.

Ministry for Primary Industries CRA 1 Amateur harvest 2013–14 29
Males
Tail width (mm)
Fre
quen
cy
50 60 70 80 90 100 110
05
1015
2025
30
50 60 70 80 90 100 110
0.0
0.5
1.0
1.5
2.0
2.5
3.0
3.5
Tail width (mm)
Wei
ght
(kg)
nonlinear regression bias = -0.05 %
log-log regression bias = -0.92 %
50 60 70 80 90 100 110
-4-2
02
4
Log-log regression
Tail width (mm)
Sta
ndar
dise
d re
sidu
als
50 60 70 80 90 100 110
-4-2
02
4
Nonlinear regression
Tail width (mm)
Sta
ndar
dise
d re
sidu
als
7 APPENDIX 1 Rock Lobster length weight regressions. Weight = a TWb (weight in kg, TW tail width in mm)
Females.
Males. a b a b
East Northland boat ramp data 2013–14 2.015 E-05 2.459 1.732 E-06 3.119
Females
Tail width (mm)
Fre
quen
cy
50 60 70 80 90
05
1015
20
50 60 70 80 90
0.0
0.5
1.0
1.5
Tail width (mm)
Wei
ght
(kg)
nonlinear regression bias = -0.14 %
log-log regression bias = -0.83 %
50 60 70 80 90
-4-2
02
4
Log-log regression
Tail width (mm)
Sta
ndar
dise
d re
sidu
als
50 60 70 80 90
-4-2
02
4
Nonlinear regression
Tail width (mm)
Sta
ndar
dise
d re
sidu
als

30 CRA 1 Amateur harvest 2013–14 Ministry for Primary Industries
Harvest Survey Kahawai,Trevally, Gurnard, and Rock Lobster Session Form Catch per Tr ip Page of
Interview Ramp Code Date Start Time Finish Time
Count of Trailers Start
Count of Trailers End
Session Number Interviewer Name
Wind Strength Knots Wind Direction Intercept codes: I Fishing & interviewed; O Interviewed not fishing; N Not interviewed unknown; R Refused
Start Finish Start Finish Fishing for: SNA Snapper KAH Kahawai CRA Rock lobster TRE Trevally TAR Tarakihi GUR Gurnard HPB Hapuku KIN Kingfish GAF Gamefish GEN General
Boat codes: T Trailer; L Launch; CR Charter reporting; CN Charter not reporting; Y Yacht; K Kayak; J Jet ski
Sea state tick Calm Choppy Rough Storm KAH fishing methods: BA Line bait; BJ Bait and jig; TL Trolled lure; JI Rod jig; LL Longline; SN Set net; PL Soft bait
CRA fishing methods: SC Scuba; SK Snorkel; PT Pot; PTR Pot and telephone reporting
Boat #Intercept
CodeReturn Time
Launch Time
Boat Code
Fishing Y/N
Main Target, Fishing
ForFishing for CRA
# of People Fishing
KAH Method Code
# KAH Kept
# TRE Kept
# GUR Kept
Main Fishing
Loc
CRA Method Code
# of People Fishing for CRA
# of SCUBA Tanks Used
Combined Total Time (m) Diving for CRA
# of pots lifted
# CRA Kept
CRA Fishing
Location
# CRA Nthland Outside Survey
8 APPENDIX 2 Survey forms used in the 2013–14 Access Survey

Ministry for Primary Industries CRA 1 Amateur harvest 2013–14 31
Recreational Harvest Survey for Rock Lobster
Catch Sampling Sheet Page of
Ramp Code Date Session # Interviewer Name
Boat # # Divers Boat # # Divers
Comment Comment
Measure tail width for Red rock lobster and tail length for Packhorse (green) rock lobster
Fisher CRA tail Pack Weight Fisher CRA tail Pack Weight# mm Sex horse g # mm Sex horse g