
ARMA-91-1115_Comparison of Direct Shear and Hollow Cylinder Tests on Rock Joints

Rock joints submitted to direct shear tests under low normal stress: evaluation of apparent cohesion values and key parameters RULLIÈRE Adrien, RIVARD Patrice, Département de génie civil, Université de Sherbrooke, Sherbrooke, Québec PEYRAS Laurent, RECOVER, IRSTEA Aix-en-Provence, Aix-en-Provence, France BREUL Pierre, Université Clermont Auvergne, CNRS, SIGMA Clermont, Institut Pascal, F-63000 Clermont-Ferrand, France ABSTRACT Shear behavior of rock joints is governed by joint surface roughness and many theoretical criteria have been developed over decades that consider the rock joint conditions and a potential value for the cohesion between both walls of the joint. However, in practice, most of civil engineering guidelines are still suggesting to use the Mohr-Coulomb (M-C) friction criterion that relies on a friction angle and a cohesion values determined from lab test or literature. For unbounded rough rock joints, no true cohesion can be considered since walls are not physically linked. Yet, a value of apparent cohesion, resulting from joint roughness and interlocking conditions is authorized to be used with M-C. But currently, no consensus exists to set or evaluate the apparent cohesion to consider. That is why a direct-shear test experimental program based on natural rock replicas was developed to investigate the roughness effect on apparent cohesion. For a joint submitted to low normal stress range conditions (0.1 to 1MPa), results show that higher Barton’s JRC is and more the apparent cohesion value associated is high: a joint with a JRC of 8.9 shows an apparent cohesion value of 80kPa versus 470kPa for a rougher joint (JRC=18.6). RÉSUMÉ Le comportement au cisaillement des joints rocheux est influencé par la rugosité du joint et de nombreux modèles de résistance au cisaillement ont été développés, prenant en considération l’état de la discontinuité et l’existence ou non d’une valeur de cohésion entre les épontes. Cependant en pratique, les règlements professionnels du génie civil proposent le modèle de Mohr-Coulomb (M-C) en s’appuyant sur des valeurs de cohésion et d’angle de frottement issus d’essais expérimentaux ou de la littérature. Pour les joints rocheux rugueux non liés, aucune valeur de cohésion réelle ne peut être utilisée puisque les épontes du joint ne sont pas physiquement liées entre elles. Néanmoins, une valeur de cohésion apparente, issue de la rugosité de la discontinuité et de conditions d’emboitement est autorisée avec le critère de M-C. Mais à l’heure actuelle, aucun consensus n’existe pour choisir et évaluer la valeur de cohésion apparente à prendre en compte. C’est pourquoi un programme expérimental d’essais de cisaillement direct sur des répliques naturelles de discontinuités a été développé pour évaluer l’effet de la rugosité sur la cohésion apparente. Pour une discontinuité soumise à de faibles contraintes normales (0.1 à 1MPa), les résultats montrent que plus le JRC de Barton est élevé pour une discontinuité et plus la cohésion apparente associée l’est : une discontinuité présentant un JRC de 8.9 résulte ainsi en une cohésion apparente de 80kPa contre près de 470kPa pour une discontinuité de JRC 18.6. 1 INTRODUCTION The mechanical behavior of rock masses is strongly affected by the discontinuities (such as joints) running through them. Unbounded rock joints are sensitive to shear forces and several criteria have been developed over the decades to assess the shear behavior of joints (Patton 1966, Ladanyi and Archambault 1969, Barton and Choubey 1977, Zhao 1997a, 1997b, Grasselli and Egger 2003).
The joint surface roughness and its effect on the shear behavior have been extensively studied. Patton (1966), from his work conducted on artificial saw tooth, showed the role of asperities on the shear behavior. Later, Barton and Choubey (1977) developed an empirical criterion for natural rock joints, describing the effects of the roughness (JRC) and the mechanical properties of rock joints (JCS) on their shear strength. Known as the JRC-JCS criterion, it was corrected and extended by Bandis et al. (1981)
towards scale effects and Zhao (1997a, 1997b) with regards to joint interlocking.
Widely used, the determination of JRC is yet based on a visual comparison with 10 standard profiles, and thus so inclined to subjectivity (Beer et al. 2002). Recently, with the progress of non-contact laser scanners and computers, researchers have worked on various methods to determine the joint roughness with surface analysis. Either 2D directional statistical parameters such as Z2, Z3, Z4, RP, SF or 3D statistical parameters such as θ*max or even fractals and these methods are now well known in rock mechanics (Tse and Cruden 1979, Lee et al. 1990, Maerz et al. 1990, Grasselli et al. 2002, Tatone and Grasselli 2010, Li and Huang 2015, Fathi et al. 2016b). Despite its subjectivity, Barton’s JRC is still the most common and understandable parameter to deal with roughness; many papers cited above developed formulas to convert their roughness parameters into a JRC value (Tse and Cruden 1979, Maerz et al. 1990, Yu and Vayssade 1991,
Yang et al.2001, Tatone and Grasselli 2010, Jang et al. 2014).
Several other parameters also affect the shear strength of a joint. As discussed above, in the JRC-JCS shear criterion, the mechanical properties of the material surrounding the joint come into play. The shear strength decreases significantly in the case where the material is damaged (micro-cracks for example), weathered or simply poor in terms of uniaxial compressive strength (Barton and Choubey 1977, Özvan et al. 2014). The effect of the material stiffness on the shear behavior has also been reported by Amiri Hossaini et al. (2014): the asperities of a rigid material are unable to deform during the shear displacement, leading to a brittle and an early breakage in terms of shear displacement. Moreover, authors also wanted to cite other papers reporting on the effects of the normal load, infilling material, normal loading rates and cycles on the shear behavior of rock joints (Lama 1978, Yang and Chiang 2000, Atapour and Moosavi 2014, Fathi et al. 2016a).
The input parameters of all these criteria are difficult to evaluate in practice. Therefore, a great number of standards related to civil engineering works are still using the Mohr-Coulomb friction criterion without cohesion in order to assess the shear strength of rock joints. Relying on experimental data from lab tests, the friction angle is then evaluated with a linear regression made from increasing normal loads. Thus, it is possible to consider an intercept, known as the apparent cohesion, generally obtained from a linear extrapolation of the failure curve in the Mohr-Coulomb plane for a range of normal stress on shear strength (Hencher and Richards 2015). Also called instantaneous or residual cohesion (Wyllie and Mah 2004, Hoek 2007), it does not physically represent a bond of the interface. The apparent cohesion come from the roughness and the imbrication of asperities at high normal stress (Amitrano 2002, Geertsema 2003, Eberhardt et al. 2004). Due to its definition, the apparent cohesion is likely influenced by the same factors as for the shear strength: the roughness of the joint, the interlocking and the level of normal stress, the material mechanical properties, presence of an infilled material and the scale.
Although the concept of apparent cohesion can be found in some papers (Maksimovic 1996, Amitrano 2002, Barton 2013, Hencher and Richards 2015), to the authors’ knowledge, only few researches have been conducted on the parameters affecting it. Geertsema (2003) found apparent cohesion values after conducting large scale direct shear tests on natural rocks. A trend was hard to identify because the samples were not identical (in terms of roughness or mechanical properties) and they were subjected to several shear tests. After conducting direct shear tests on CPB-CPB (Cemented Paste Backfill) and CPB-rock interfaces for mining work, Koupouli et al. (2016) concluded that the apparent cohesion was affected by the materials in contact during shearing.
To enlighten the effects of roughness on apparent cohesion parameters, an experimental protocol was developed at Université de Sherbrooke, based on 32 direct shear tests (replicas made from 4 natural rocks joints and under 7 levels of normal stresses). This set-up allows setting identical roughness parameter between each test.
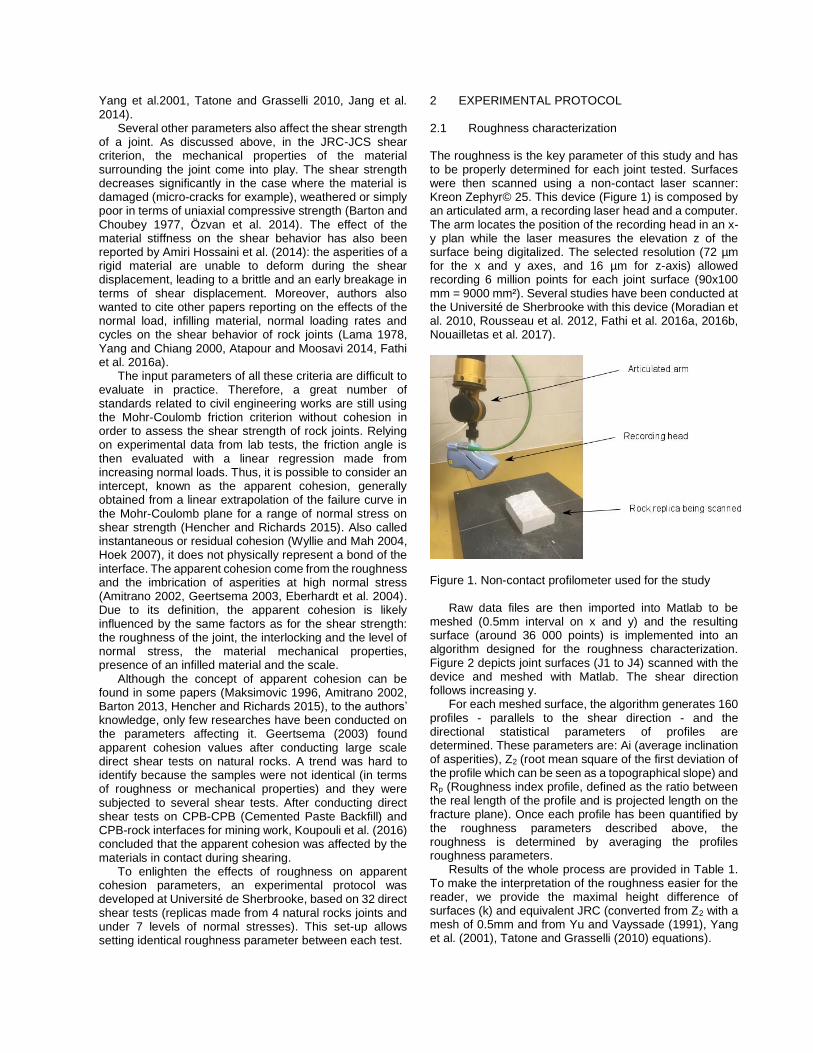
2 EXPERIMENTAL PROTOCOL 2.1 Roughness characterization The roughness is the key parameter of this study and has to be properly determined for each joint tested. Surfaces were then scanned using a non-contact laser scanner: Kreon Zephyr© 25. This device (Figure 1) is composed by an articulated arm, a recording laser head and a computer. The arm locates the position of the recording head in an x-y plan while the laser measures the elevation z of the surface being digitalized. The selected resolution (72 µm for the x and y axes, and 16 µm for z-axis) allowed recording 6 million points for each joint surface (90x100 mm = 9000 mm²). Several studies have been conducted at the Université de Sherbrooke with this device (Moradian et al. 2010, Rousseau et al. 2012, Fathi et al. 2016a, 2016b, Nouailletas et al. 2017).
Figure 1. Non-contact profilometer used for the study
Raw data files are then imported into Matlab to be meshed (0.5mm interval on x and y) and the resulting surface (around 36 000 points) is implemented into an algorithm designed for the roughness characterization. Figure 2 depicts joint surfaces (J1 to J4) scanned with the device and meshed with Matlab. The shear direction follows increasing y.
For each meshed surface, the algorithm generates 160 profiles - parallels to the shear direction - and the directional statistical parameters of profiles are determined. These parameters are: Ai (average inclination of asperities), Z2 (root mean square of the first deviation of the profile which can be seen as a topographical slope) and Rp (Roughness index profile, defined as the ratio between the real length of the profile and is projected length on the fracture plane). Once each profile has been quantified by the roughness parameters described above, the roughness is determined by averaging the profiles roughness parameters.
Results of the whole process are provided in Table 1. To make the interpretation of the roughness easier for the reader, we provide the maximal height difference of surfaces (k) and equivalent JRC (converted from Z2 with a mesh of 0.5mm and from Yu and Vayssade (1991), Yang et al. (2001), Tatone and Grasselli (2010) equations).
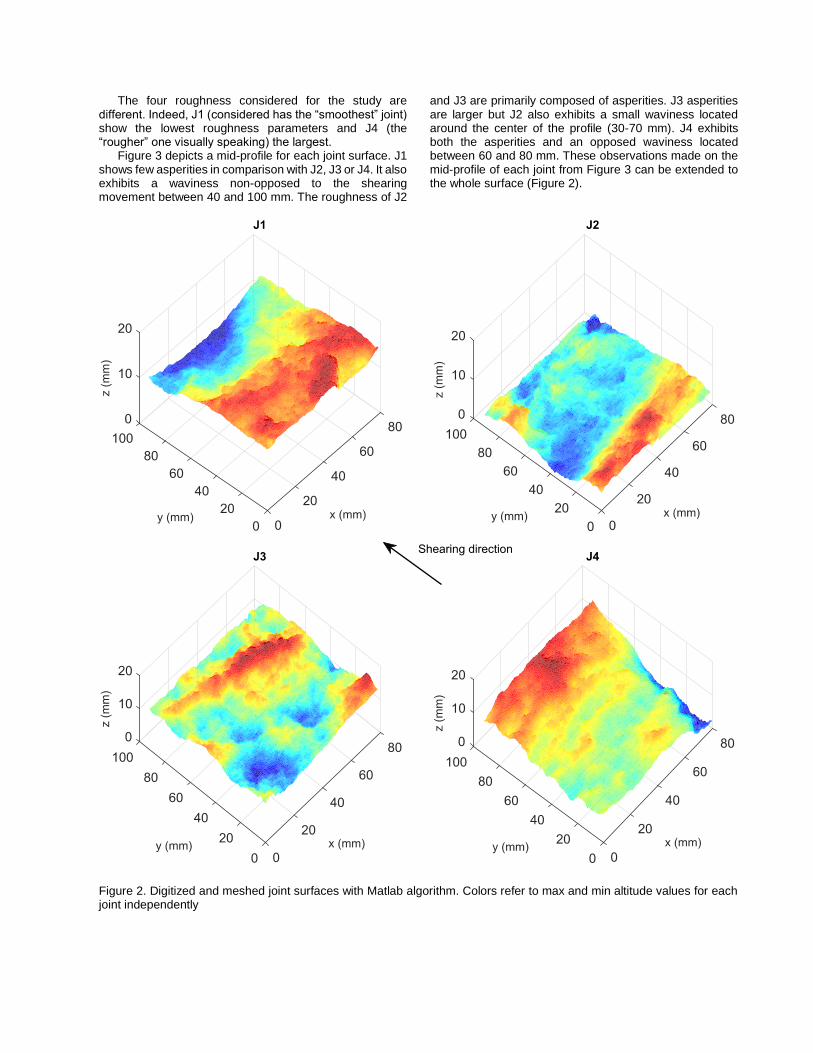
The four roughness considered for the study are different. Indeed, J1 (considered has the “smoothest” joint) show the lowest roughness parameters and J4 (the “rougher” one visually speaking) the largest.
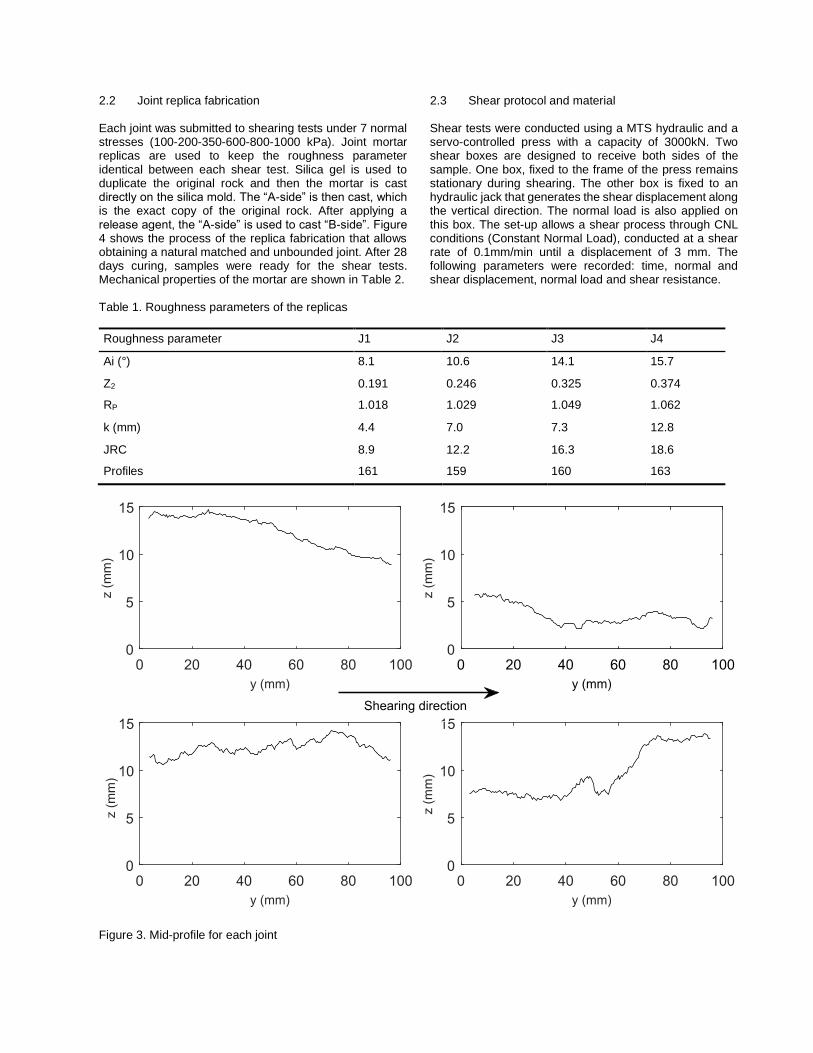
Figure 3 depicts a mid-profile for each joint surface. J1 shows few asperities in comparison with J2, J3 or J4. It also exhibits a waviness non-opposed to the shearing movement between 40 and 100 mm. The roughness of J2
and J3 are primarily composed of asperities. J3 asperities are larger but J2 also exhibits a small waviness located around the center of the profile (30-70 mm). J4 exhibits both the asperities and an opposed waviness located between 60 and 80 mm. These observations made on the mid-profile of each joint from Figure 3 can be extended to the whole surface (Figure 2).
Figure 2. Digitized and meshed joint surfaces with Matlab algorithm. Colors refer to max and min altitude values for each joint independently
2.2 Joint replica fabrication Each joint was submitted to shearing tests under 7 normal stresses (100-200-350-600-800-1000 kPa). Joint mortar replicas are used to keep the roughness parameter identical between each shear test. Silica gel is used to duplicate the original rock and then the mortar is cast directly on the silica mold. The “A-side” is then cast, which is the exact copy of the original rock. After applying a release agent, the “A-side” is used to cast “B-side”. Figure 4 shows the process of the replica fabrication that allows obtaining a natural matched and unbounded joint. After 28 days curing, samples were ready for the shear tests. Mechanical properties of the mortar are shown in Table 2.
2.3 Shear protocol and material Shear tests were conducted using a MTS hydraulic and a servo-controlled press with a capacity of 3000kN. Two shear boxes are designed to receive both sides of the sample. One box, fixed to the frame of the press remains stationary during shearing. The other box is fixed to an hydraulic jack that generates the shear displacement along the vertical direction. The normal load is also applied on this box. The set-up allows a shear process through CNL conditions (Constant Normal Load), conducted at a shear rate of 0.1mm/min until a displacement of 3 mm. The following parameters were recorded: time, normal and shear displacement, normal load and shear resistance.
Table 1. Roughness parameters of the replicas
Roughness parameter J1 J2 J3 J4
Ai (°) 8.1 10.6 14.1 15.7
Z2 0.191 0.246 0.325 0.374
RP 1.018 1.029 1.049 1.062
k (mm) 4.4 7.0 7.3 12.8
JRC 8.9 12.2 16.3 18.6
Profiles 161 159 160 163
Figure 3. Mid-profile for each joint
Seven levels of normal stresses - corresponding to stresses that can be found in civil engineering works - were applied: 100-200-350-600-800-1000 kPa. Shear tests were also repeated for one normal load in order to evaluate the variability of the results. 600kPa normal load was chosen for this purpose.
In order to obtain ϕb (basic friction angle) and the behavior of a smooth surface under shearing, shear tests were conducted on a perfect smooth surface under 4 normal stresses: 100, 200, 350 and 600kPa. The whole protocol resulting in 32 tests.
Figure 4. Replicas making protocol Table 2. Mortar mechanical properties 2.4 Data processing
The maximum shear stress value - also called τpeak - and
the end-test shear stress value - also called τresidual - were
determined from the shear stress vs shear displacement
curve generated for each test. τresidual value was
determined by averaging the shear strength between 1.5 and 3 mm of shear displacement.
3 RESULTS 3.1 Direct shear test results The peak and residual shear strength values are provided in Table 3. Peak shear strength depends on both the normal load applied on the joint and the roughness. Figure 5 depicts this trend. Under 600kPa, J1 peak shear strength is a slightly below 1MPa while J4 exhibits a peak around 2.2MPa.
Table 4 provides the variability of 600kPa shear results. The variation of the peak shear strength of J2 was 22%. Other joints show lower variations: 7%, 1% and 14% for J1, J3 and J4, respectively. At the residual state, the variation for J1 and J3 were 26%, respectively. The differences between peaks shear strengths of joints decreased above 800kPa. As one can notice, J3 peak shear strength was close to J2 for both 800 and 1000kPa normal stresses. 3.2 Apparent cohesion and friction angle value
obtained from experimentation
τpeak and τresidual values versus normal stress were plotted
for each rough joint and for the smooth joint. Apparent cohesion and friction angles were determined through a linear regression made in the interval 100-1000kPa (Figure 6). The trend confirms the effects of the roughness on the shear strength. Figure 6 and Table 5 also show the role of the joint roughness on the apparent cohesion and friction angle: both are increasing with roughness parameters determined previously. 4 DISCUSSION 4.1 Roughness and shear resistance Peak shear strength value depends on both the normal load and the roughness characteristics of the joint. Residual shear strength exhibits the same trend. Therefore, higher roughness leads to an increase in the shear strength (peak and residual). These results are consistent with previous publications (Patton 1966, Barton and Choubey 1977, Grasselli and Egger 2003, Park et al. 2013).
The variation of J3 peak shear strength value (22%) might be related to several parameters such as: the good orientation of samples in shear boxes or the well casting of replicas (some samples were showing bubbles). At the residual stage, variations of the shear strength are due to the presence of break-off asperities and material, which could affect the shear behavior.
J3 peak value for 800kPa and 1000kPa are in the same order of magnitude as J2. It is suggested that above 800kPa, J2 and J3 asperities are directly sheared off but the waviness of J2 is not. This waviness provides a little increase of shear strength before walls starts to slide on each other.
Mechanical parameters
Density (kg/m³) 2200
UCS (MPa) 58.1
E (GPa) 26.0
σt (MPa) 4.0
ϕb (°) 27.0

Figure 5. Shear strength versus shear displacement curves for 600kPa “bis” test. Table 3. Peak and residual shear strength for each joint and each normal stress
Normal stress (kPa)
J1 J2 J3 J4
τpeak
(MPa)
τresidual
(MPa)
τpeak
(MPa)
τresidual
(MPa)
τpeak
(MPa)
τresidual
(MPa)
τpeak
(MPa)
τresidual
(MPa)
100 0.241 0.106 0.312 0.114 0.394 0.222 0.613 0.206
200 0.410 0.199 0.515 0.215 0.597 0.366 1.018 0.432
350 0.518 0.377 0.683 0.429 1.000 0.610 1.220 0.506
600 1.010 0.465 1.338 0.731 1.420 0.957 1.930 0.936
600bis 0.938 0.587 1.045 0.752 1.406 0.756 2.190 1.062
800 1.391 0.824 1.563 0.880 1.532 1.184 2.452 1.364
1000 1.502 1.010 1.907 1.200 1.850 1.427 2.770 1.450
Table 4. Variability of results at 600kPa normal load
Joint τpeak variation (%) τresidual variation (%)
J1 7 26
J2 22 3
J3 1 21
J4 14 14

4.2 “Peak outlook” Table 5 shows that a rougher surface leads to an increase in both the apparent cohesion and the friction angle. For instance, the apparent cohesion of J1 was 82 kPa while J4 has a value of 470 kPa and J0, the smooth joint, obtained 0 kPa. It infers that the roughness is a key parameter of the apparent cohesion.
The same trend was observed for the friction angles: J1 obtained a friction angle of 56.1° while J4 and J0 obtained 67.8° and 28.8°, respectively. 4.3 “Residual” outlook After a shear displacement of about 3 mm, the sample reach a quasi-plateau, increasing with the applied shear load. The apparent cohesion values at the residual stage for each joint (J1 to J4) are smaller than those obtained during the peak stage (Figure 6, Table 5). Although joints are subjected to damage during the shear process, the main explanation of the decrease of the apparent cohesion lies in the interlocking of samples.
For J1 and J2, the residual apparent cohesion value is zero, despite the roughness characteristics calculated earlier (for instance, JRC of 8.9 and 12.2 respectively).
During the shear displacement, the “B-side” of the sample is moving on the “A-side” and major asperities are broken (steepest ones, opposed to shear displacement). However, for J1 and J2, these major asperities are small and not as steep as for J3 or J4. Joints are then unmatched and remaining small asperities are not well interlocked, leading to a sliding residual behavior and an apparent cohesion value of 0 kPa.
On the other hand, J3 and J4 show low residual apparent cohesion value, suggesting some interlocking between walls during the residual shearing state. It can be explained by the high roughness coefficient calculated early (JRC of 16.3 and 18.6, respectively). Even though major asperities are broken off during the shearing, remaining asperities can interact each other and yield a little increase in the shear strength, resulting in a non-zero apparent cohesion value at the residual state.
These results indicate that the interlocking of the samples is the main parameter influencing the apparent cohesion, even more than the roughness as shown above.
Similar conclusions can be drawn for the friction angle behavior at residual state.
Figure 6. Mohr-Coulomb linear regression at peak and residual state Table 5. Apparent cohesion and friction angle at peak and residual state
Joint Peak apparent cohesion (kPa)
Peak friction angle (°)
R² Residual apparent cohesion (kPa)
Residual friction angle (°)
R²
J1 82.0 56.1 0.98 0.0 44.6 0.97
J2 123.0 61.0 0.98 0.0 49.8 0.99
J3 338.7 58.0 0.96 100.0 52.9 0.98
J4 467.7 67.8 0.97 90.0 56.1 0.97
Smooth joint 0.0 28.8 0.99 0.0 28.8 0.99

5 CONCLUSION The main goal of the study was to investigate the roughness effect on the apparent cohesion values using replicas of natural rock exhibiting 4 levels of roughness. Direct shear tests (32) were conducted at 7 levels of normal loads. The following conclusions can be drawn for the experimental procedure:
1) It was confirmed that the peak shear strength value depends on the roughness properties of the joint and on the normal load applied.
2) The roughness affects the apparent cohesion
associated with the joint. A rougher surface, in terms of the statistical parameters investigated here, leads to higher the apparent cohesion values.
3) Comparison between the peak and the residual apparent cohesion values suggests that the sample interlocking is the main parameter governing the apparent cohesion value. When the samples were non-interlocked, as for the residual stage, the apparent cohesion value strongly decreased, in some cases down to zero.
Taking into account an apparent cohesion value in a
stability analysis against shear conditions may allow engineers to optimize the stability factor. Such apparent cohesion value can be used in several geotechnical works as: dam foundations, slope stability, mining or underground works.
The work presented here is a part of a global project investigating different parameters that could affect the apparent cohesion. Future work, including the effects of the material properties, the contact properties or the presence of infilled materials in joints are in progress. These experimental results will be valued and integrated in a numerical modeling to assess precisely the behavior of rock discontinuities. 6 ACKNOWLEDGMENTS Authors are grateful to the Natural Sciences and Engineering Research Council of Canada (NSERC) for funding the project. Danick Charbonneau is acknowledged for his technical help during the experimental project. 7 REFERENCES Amiri Hossaini, K., Babanouri, N., and Karimi Nasab, S.
2014. The influence of asperity deformability on the mechanical behavior of rock joints. International Journal of Rock Mechanics and Mining Sciences, 70: 154–161.
Amitrano, D. 2002. Fracture roughness and gouge distribution of a granite shear band. Journal of Geophysical Research, 107(B12): 1–16.
Atapour, H., and Moosavi, M. 2014. The influence of shearing velocity on shear behavior of artificial joints. Rock Mechanics and Rock Engineering, 47(5): 1745–1761.
Bandis, S., Lumsden, A.C., and Barton, N. 1981. Experimental studies of scale effects on the shear behaviour of rock joints. International Journal of Rock Mechanics and Mining Sciences & Geomechanics, 18(1): 1–21.
Barton, N. 2013. Shear strength criteria for rock, rock joints, rockfill and rock masses: Problems and some solutions. Journal of Rock Mechanics and Geotechnical Engineering, 5(4): 249–261.
Barton, N., and Choubey, V. 1977. The shear strength of rock joints in theory and practice. Rock Mechanics, 10(1–2): 1–54.
Beer, A.J., Stead, D., and Coggan, J.S. 2002. Estimation of the Joint Roughness Coefficient (JRC) by visual comparison. Rock Mechanics and Rock Engineering, 35(1): 65–74.
Eberhardt, E., Stead, D., and Coggan, J.S. 2004. Numerical analysis of initiation and progressive failure in natural rock slopes-the 1991 Randa rockslide. International Journal of Rock Mechanics and Mining Sciences, 41(1): 69–87..
Fathi, A., Moradian, Z., Rivard, P., and Ballivy, G. 2016a. Shear mechanism of rock joints under pre-peak cyclic loading condition. International Journal of Rock Mechanics and Mining Sciences, 83: 197–210.
Fathi, A., Moradian, Z., Rivard, P., Ballivy, G., and Boyd, A.J. 2016b. Geometric Effect of Asperities on Shear Mechanism of Rock Joints. Rock Mechanics and Rock Engineering, 49(3).
Geertsema, A.J. 2003. The shear strength of rock joints with special reference to dam foundations (PhD thesis) University of Pretoria, South Africa.
Grasselli, G., and Egger, P. 2003. Constitutive law for the shear strength of rock joints based on three-dimensional surface parameters. International Journal of Rock Mechanics and Mining Sciences, 40(1): 25–40.
Grasselli, G., Wirth, J., and Egger, P. 2002. Quantitative three-dimensional description of a rough surface and parameter evolution with shearing. International Journal of Rock Mechanics and Mining Sciences, 39(6): 789–800.
Hencher, S.R., and Richards, L.R. 2015. Assessing the Shear Strength of Rock Discontinuities at Laboratory and Field Scales. Rock Mechanics and Rock Engineering, 48(3): 883–905.
Hoek, E. 2007. Practical Rock Engineering. In Rocscience.
Rocscience website // https://www.rocscience.com/learning/hoek-s-corner/books // 2017/07/31.
Jang, H.S., Kang, S.S., and Jang, B.A. 2014. Determination of Joint Roughness Coefficients Using Roughness Parameters. Rock Mechanics and Rock Engineering, 47(6): 2061–2073.

Koupouli, N.J.F., Belem, T., Rivard, P., and Effenguet, H. 2016. Direct shear tests on cemented paste backfill-rock wall and cemented paste backfill-backfill interfaces. Journal of Rock Mechanics and Geotechnical Engineering, 8(4): 472–479.
Ladanyi, B., and Archambault, G. 1969. Simulation of shear behavior of jointed rock mass. 11th U.S. Symposium on Rock Mechanics, Berkeley, CA, USA 7(January 1969): 105–125.
Lama, R. 1978. Influence of clay fillings in shear behaviour of joints. Conf. Int. Association of Engineering Geology. Madrid, Spain. pp. 27–34.
Lee, Y.H., Carr, J.R., Barr, D.J., and Haas, C.J. 1990. The fractal dimension as a measure of the roughness of rock discontinuity profiles. International Journal of Rock Mechanics and Mining Sciences and, 27(6):
Li, Y., and Huang, R. 2015. Relationship between joint roughness coefficient and fractal dimension of rock fracture surfaces. International Journal of Rock Mechanics and Mining Sciences, 75: 15–22.
Maerz, N.H., Franklin, J.A., and Bennett, C.P. 1990. Joint roughness measurement using shadow profilometry. International Journal of Rock Mechanics and Mining Sciences, 27(5): 329–343.
Maksimovic, M. 1996. The Shear Strength Rock Joint Components of a Rough. International Journal of Rock Mechanics and Mining Sciences & Geomechanics Abstracts, 33(8): 769–783.
Moradian, Z.A., Ballivy, G., Rivard, P., Gravel, C., and Rousseau, B. 2010. Evaluating damage during shear tests of rock joints using acoustic emissions. International Journal of Rock Mechanics and Mining Sciences, 47(4): 590–598.
Nouailletas, O., Perlot, C., Rivard, P., Ballivy, G., and La Borderie, C. 2017. Impact of Acid Attack on the Shear Behaviour of a Carbonate Rock Joint. Rock Mechanics and Rock Engineering, 50(6): 1439–1451.
Özvan, A., Dinçer, I., Acar, A., and Özvan, B. 2014. The effects of discontinuity surface roughness on the shear strength of weathered granite joints. Bulletin of Engineering Geology and the Environment, 73(3):
801–813. Park, J.W., Lee, Y.K., Song, J.J., and Choi, B.H. 2013. A
constitutive model for shear behavior of rock joints based on three-dimensional quantification of joint roughness. Rock Mechanics and Rock Engineering,
46(6): 1513–1537. Patton, F.D. 1966. Multiple Modes of Shear Failure In
Rock. In 1st ISRM Congress. International Society for Rock Mechanics, Lisbon, Portugal.
Rousseau, B., Rivard, P., Marache, A., Ballivy, G., and Riss, J. 2012. Limitations of laser profilometry in measuring surface topography of polycrystalline rocks. International Journal of Rock Mechanics and Mining Sciences, 52: 56–60.
Tatone, B.S.A., and Grasselli, G. 2010. A new 2D discontinuity roughness parameter and its correlation with JRC. International Journal of Rock Mechanics and Mining Sciences, 47(8): 1391–1400.
Tse, R., and Cruden, D.M. 1979. Estimating joint roughness coefficients. International Journal of Rock Mechanics and Mining Sciences, 16(5): 303–307.
Wyllie, D.C., and Mah, C.W. 2004. Rock Slope Engineering - Civil and mining. In 4th. Spon press. New York, NY,
USA. Yang, Z.., and Chiang, D.. 2000. An experimental study on
the progressive shear behavior of rock joints with tooth-shaped asperities. International Journal of Rock Mechanics and Mining Sciences, 37(8): 1247–1259.
Yang, Z.Y., Lo, S.C., and Di, C.C. 2001. Reassessing the joint roughness coefficient (JRC) estimation using Z2. Rock Mechanics and Rock Engineering, 34(3):
243–251. Yu, X., and Vayssade, B. 1991. Joint profiles and their
roughness parameters. International Journal of Rock Mechanics and Mining Sciences, 28(4): 333–336.
Zhao, J. 1997a. Joint surface matching and shear strength. Part A: joint matching coefficient (JMC). International Journal of Rock Mechanics and Mining Sciences & geomechanics abstracts, 34(2): 173–178.
Zhao, J. 1997b. Joint surface matching and shear strength. Part B: JRC-JMC shear strength criterion. International Journal of Rock Mechanics and Mining Sciences & geomechanics abstracts, 34(2): 179–
185.


![IS 12608 (1989): rock joints-direct shear strength ...IS 12608 (1989): rock joints-direct shear strength-laboratory method of determination [CED 48: Rock Mechanics] METHODFOR ... 3.1.1](https://static.fdocuments.in/doc/165x107/5e6de58548a3964b42128b08/is-12608-1989-rock-joints-direct-shear-strength-is-12608-1989-rock-joints-direct.jpg)


