Roche Holdings, Inc. Annual Report 20107d43f4ab-bdfa-49c8-b25a-a0af33d79… · Roche Holdings, Inc....
87
r Roche Holdings, Inc. Annual Report 2010
Transcript of Roche Holdings, Inc. Annual Report 20107d43f4ab-bdfa-49c8-b25a-a0af33d79… · Roche Holdings, Inc....

1
r
Roche Holdings, Inc. Annual Report 2010
Annual Report 2010 - Roche Holdings, Inc. Consolidated Financial Statements 1
Roche Holdings, Inc. Annual Report 2010
Management Report and
Consolidated Financial Statements
for the year ended on December 31, 2010

2 Annual Report 2010 - Roche Holdings, Inc. Consolidated Financial Statements
Management Report
1. Review of the twelve months ended December 31, 2010
Important events In 2010 the Roche Holdings, Inc. (RHI) Group achieved a solid operating performance. Sales increased by 1% to $17.1 billion as the underlying growth of both the Pharmaceuticals and Diagnostics Division compensated for the expected decline in Tamiflu sales and the initial impacts of the U.S. healthcare reforms. Effective March 26, 2009 the RHI Group obtained full ownership of Genentech, Inc. and substantially completed the relating integration and restructuring activities in 2010. Restructuring expenses of $0.4 billion (2009: $1.9 billion) were incurred. In 2010, the RHI Goup continued to pay down the debt which had been issued to finance the Genentech transaction. A total of $8.2 billion of debt was repaid, which includes the early redemption of 2.5 billion of notes in September 2010. In addition, the RHI Group resolved to early redeem $1.0 billion of notes maturing in March 2014. These notes will be redeemed on March 24, 2011. On November 17, 2010 the Roche Group announced the details of its global ‘Operational Excellence’ program, which is a proactive and comprehensive initiative to reinforce the Roche Group’s long-term innovation capability in the face of increased business challenges including pricing pressures in the United States and elsewhere. In the United States, implementation plans include reducing the work force by 3,550 positions and the main areas affected are in manufacturing, sales and marketing, product development as well as research and early development. This initiative is scheduled to be implemented in 2011 and 2012. Initial charges of $0.4 billion were included in the 2010 results, mainly relating to employee severance costs and intangible asset impairments in the Pharmaceutical Division. Further disclosures are made in Note 7 to the Consolidated Financial Statements.
The effect of the U.S. healthcare reforms on the Pharmaceuticals Division in 2010 was a reduction in sales of $0.25 billion. Effective December 29, 2010 the Pharmaceuticals Division acquired the U.S. biopharmaceutical company Marcadia Biotech, Inc., (‘Marcadia’), based in Carmel, Indiana. Marcadia is a biopharmaceutical company whose research programs focus on new peptide therapies for the treatment of metabolic diseases such as Type 2 diabetes and obesity. The total purchase consideration was $377 million, of which $287 million was paid in cash and $90 million arises from a contingent consideration arrangement. The assets and liabilities and the amounts allocated to the purchase price are provisional based on preliminary information and valuations and are subject to adjustment during 2011, if new information is obtained about the facts and circumstances that existed at the acquisition date. Effective September 3, 2010 the Diagnostics Division acquired the U.S. company BioImagene based in Sunnyvale, California. BioImagene is engaged in the digital pathology workflow and analysis. The acquisition complements and strengthens the RHI Group’s portfolio in image analysis and information management. In 2010, there was another minor business combination in the Diagnostics Division. The total purchase consideration of these acquisitions was $87 million in cash. Further disclosures are made in Note 6. Presentational changes During 2010 the RHI Group has made certain presentational changes to the income statement, as commented in Note 1 to the Consolidated Financial Statements 2010. These have been made in light of current international and industry practice and taking into account the latest regulatory guidance. These changes have been applied retrospectively. The term ‘exceptional items’ is no longer used in the financial statements. Therefore, the term ‘Operating profit before exceptional items’ is deleted and income and expenses previously shown separately as ‘Major legal cases’ and ‘Changes in RHI Group organization’ are included as part of ’General and administration’. Likewise ‘Exceptional financing costs’ are included as part of ‘Financial income’ or ‘Financing costs’, as appropriate and ‘Income taxes on exceptional items’ are included as part of ‘Income taxes’. Further disclosures are made in Notes 4, 5, 7 and 24 respectively.
Annual Report 2010 - Roche Holdings, Inc. Consolidated Financial Statements 3
Financial performance In 2010 the RHI Group’s total sales increased by $0.1 billion to $17.1 billion, with the Pharmaceuticals Division representing 83% of total sales and the Diagnostics Division contributing 17%. Sales in the Pharmaceuticals Division remained stable at $14.2 billion. There was strong growth in the key oncology products, especially Mabthera/Rituxan and Herceptin as well as Lucentis in ophthalmology. These increased sales were partly offset by the expected sharp decline in Tamiflu sales, the reduction in CellCept sales in transplantation due to the post-patent expiry in the United States in May 2009 and the initial impacts of the U.S. healthcare reforms. Pharmaceutical sales excluding Tamiflu increased 4%. The Diagnostics Division increased sales to $2.9 billion in 2010, growing 5%. Major growth areas were Professional Diagnostics and Molecular Diagnostics. The RHI Group’s operating profit increased by $2.3 billion to $6.1 billion. The increase in profitability was driven by synergies from the Genentech integration, resource prioritization and further productivity improvements, despite the initial costs for the Operational Excellence program. The operating profit margin increased by 13.3 percentage points to reach 35.9%. In the Pharmaceuticals Division the operating profit increased by $2.2 billion to $5.9 billion, driven primarily by synergies from the Genentech integration in all functions, higher positive effects of cost-sharing agreements with related parties and resource prioritization, notably in marketing and distribution, despite the initial costs for the Operational Excellence program of $0.4 billion. Cost of sales decreased in comparison to 2009, as a result of lower royalty expenses and lower expenses for collaboration and profit-sharing agreements in 2010, further to an amended agreement with GlaxoSmithKline in the U.S. for Bonviva/Boniva. 2010 also includes the impacts of productivity improvements in technical operations, offset by unfavorable product mix effects. The comparative period includes the one-time impact of the inventory write-off for the voluntary withdrawal of Raptiva. Research and development costs, excluding intangible assets impairments, decreased by 4% mainly due to the positive impact of cost sharing agreements with related parties, resource prioritization and synergies. Research and development expenses also included the immediate recognition of the remaining costs of $53 million necessary to cover the termination of the ocrelizumab rheumatoid arthritis development program and the payment received from Novartis for opting in the Lucentis study on the treatment of macular edema following retina/vein occlusion. The majority of the costs that were recorded as part of the Operational Excellence program relate to research and development. The $0.3 billion costs in research and development related to impairments of intangible assets due to project terminations and to termination costs. General and administration costs in the Pharmaceuticals Division include $0.4 billion of costs relating to employee-related costs and other reorganization expenses arising from the Genentech transaction (2009: $1.9 billion). The operating profit in the Diagnostics Division increased to $0.2 billion. The operating profit margin improvement of 2.9 percentage points was driven by sales growth mainly in Professional Diagnostics and Molecular Diagnostics as well as higher royalty income. Furthermore, there was a favorable development of operating expenses, partly due to the non-recurrence of restructuring expenses recorded in 2009. Overall this led to an increase of the RHI Group’s operating profit to $6.1 billion compared to $3.8 billion in the same period of 2009. In 2009, the RHI Group financed the Genentech transaction by a combination of own funds, bonds, notes and commercial paper. The RHI Group raised net proceeds of $40.3 billion through a series of debt offerings. All newly issued debt is senior, unsecured and has been guaranteed by Roche Holding Ltd, the parent of the RHI Group. As a consequence, the underlying dynamics of the RHI Group’s treasury results changed significantly, with a substantial increase in interest expenses. The reporting period of 2010 includes full twelve months of these interest expenses compared to only ten months in 2009. This effect was largely offset by lower interest expenses due to the debt repayments in 2009 and 2010. In addition the RHI Group incurred losses on early debt redemption of $0.2 billion. Along with the bonds and notes issuances in 2009 the RHI Group entered into derivative contracts to hedge the foreign exchange risk arising from bonds and notes issued in currencies other than U.S. dollars. The losses on these derivative contracts are offset by foreign exchange gains on the bonds and notes issued in currencies other than U.S. dollars. The financing costs from related parties increased to $1.0 billion mainly reflecting twelve months of financing costs in 2010 compared to only nine months in 2009 arising from the additional related-party debt taken on to fund the Genentech transaction. The RHI Group’s effective tax rate increased to 37.4% from 13.1% in the comparative period, mainly due to a lower impact from U.S. research development and other manufacturing tax credits in 2010 compared to 2009 as well as the tax impact from equity compensation plans, which varies according to the price of the underlying equity. The impact from equity compensation plans on the effective tax rate 2010 was an increase of

4 Annual Report 2010 - Roche Holdings, Inc. Consolidated Financial Statements
1.8%, while in 2009 it was a benefit of 7.6%. This is mainly due to the one-time impact of the accelerated vesting of Genentech plans in 2009. Overall net income increased by $0.9 billion to $2.1 billion. This increase primarily results from a strong operating performance in spite of significantly lower Tamiflu sales, as well as from strong cost containments despite initial charges from the Operational Excellence program. Charges incurred in respect of the Genentech transaction in 2010 compared to 2009 were significantly lower. The cash flow from operating activities decreased by $1.9 billion to $6.2 billion. This is mainly a result of higher tax payments, as 2009 included the one-time $0.9 billion tax benefit on the settlement of stock options with Genentech employees upon closing the transaction in March 2009. Cash from operating activities before tax payments decreased by $0.8 billion, as higher cash generation from operations was more than offset principally by payments of certain large year-end 2009 accruals including the payment of the employee retention/severance schemes and high royalty payments relating to strong Tamiflu sales in the second half of 2009. The cash flow from investing activities decreased by $6.6 billion as the comparative period contained $7.3 billion proceeds from liquidation of certain debt securities to fund the Genentech transaction. The cash outflow from financing activities of $5.3 billion was mainly due to the repayment of $8.2 billion of notes as well as $1.7 billion interest payments for the new debt issued in 2009, partly offset with a net inflow from related party financing of $6.0 billion, including cash pool. The financing cash outflow of $16.6 billion in 2009 included payments of $47 billion for the Genentech transaction and proceeds of $40.3 billion from issuance of bonds and notes. Furthermore, it included an outflow of $2.9 billion into the Roche Group cash pool outside the United States. In 2010, the total decrease in cash was $0.1 billion. Financial position The decrease in total assets mainly results from a decrease in related party receivables compared to December 31, 2009. The carrying value of debt, mainly from the financing of the Genentech transaction, at the end of 2010 was $45.2 billion, compared to $48.8 billion at the end of 2009. This reduction reflects the redemption on due dates in 2010 of the $3 billion and 1.5 billion euro-denominated floating rate notes, the $0.5 billion Genentech senior notes and the early redemption of notes on September 9, 2010 with a principal value of $2.5 billion that were due March 1, 2012 as well as the decrease in the carrying value of the outstanding bonds denominated in foreign currencies due to the strengthening of the U.S. dollar. The decrease in bonds and notes was partly offset by an increase in related party debt of $5.4 billion. In 2009 the Genentech transaction was accounted for in full as an equity transaction. As a consequence, the carrying amount of the consolidated equity of the RHI Group was significantly reduced. In 2010, the negative equity was reduced by $2.2 billion to $28.1 billion. The capacity of the RHI Group to generate positive cash flows and operating profit is not affected by this accounting treatment. In addition, bonds and notes with a carrying value of $28.1 billion are guaranteed by Roche Holding Ltd, the parent company of the Roche Group.
2. Principal risks and uncertainties
Risks The RHI Group is exposed to various financial risks arising from its underlying operations and corporate finance activities. The RHI Group’s financial risk exposures are predominantly related to changes in interest rates, equity prices and to an extent, foreign exchange rates, as well as the creditworthiness and the solvency of the RHI Group’s counterparties. The RHI Group’s financial risk management is described in Note 30 to the Consolidated Financial Statements for the year ended December 31, 2010. Uncertainties As well as being the holding company for the Roche Group’s U.S. operations, a further activity of Roche Holdings, Inc. is to provide finance to other members of the RHI Group and to refinance this on the bond or loan markets. The RHI Group’s provisions and contingent liabilities are described in Note 24 to the Consolidated Financial Statements for the year ended December 31, 2010. In addition, key assumptions and sources of estimation uncertainty in the preparation of the financial statements are described in Note 1 to these Financial Statements. The difficulties in the financial markets and the economy have had a limited impact on the RHI Group’s businesses so far. The effect of the U.S. healthcare reforms in 2010 was $0.25 billion, reducing sales in the Pharmaceuticals Division. However, the developments are being closely monitored, including credit risk from three major U.S. wholesalers that account for 65% of the RHI group’s third party trade accounts receivable. As outlined above, the Operational

Annual Report 2010 - Roche Holdings, Inc. Consolidated Financial Statements 5
Excellence program announced on November 17, 2010 further aims at facing proactively and effectively external pressures. Various known and unknown risks, uncertainties and other factors could lead to substantial differences between the future results, financial situation development or performance of the RHI Group and the historical results given in the Management Report and the Financial Statements for the year ended 2010.
3. Responsibility statement
The directors of Roche Holdings, Inc. confirm that, to the best of their knowledge as of the date of their approval of the audited consolidated financial statements as at January 26, 2011:
• the audited consolidated financial statements as at December 31, 2010, which have been prepared in accordance with the applicable set of accounting standards, give a true and fair view of the assets, liabilities, financial position and profit or loss of Roche Holdings, Inc. and the undertakings included in the consolidation taken as a whole and that
• the management report gives a true and fair view of the development and performance of the business and the position of Roche Holdings, Inc. and the undertakings included in the consolidation taken as a whole, together with a description of the principal risks and uncertainties that they face.
Franz B. Humer Erich Hunziker Severin Schwan Chairman of the Board Vice Chairman of the Board Member of the Board
Frank J. D’Angelo Frederick C. Kentz III David P. McDede Bruce Resnick Member of the Board Member of the Board Member of the Board Member of the Board
6 Annual Report 2010 – Roche Holdings, Inc. Consolidated Financial Statements
Roche Holdings, Inc. Consolidated Financial Statements
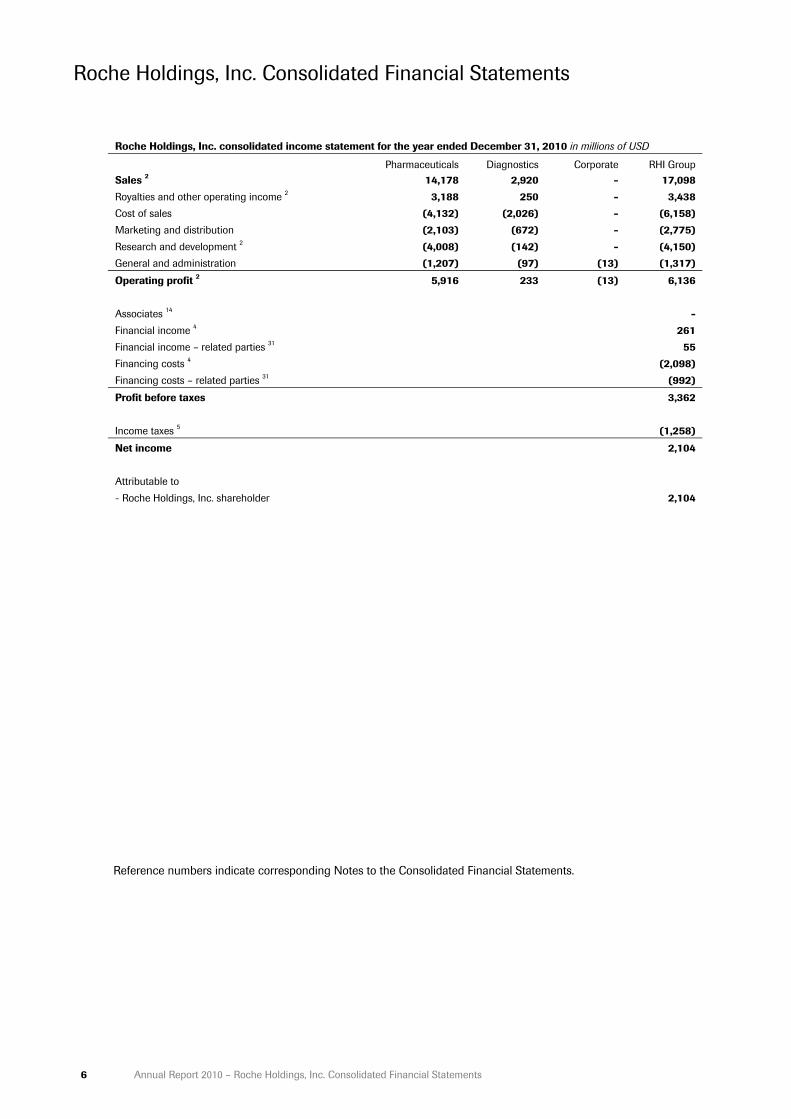
Roche Holdings, Inc. consolidated income statement for the year ended December 31, 2010 in millions of USD
Pharmaceuticals Diagnostics Corporate RHI Group Sales 2 14,178 2,920 - 17,098 Royalties and other operating income 2 3,188 250 - 3,438 Cost of sales (4,132) (2,026) - (6,158)Marketing and distribution (2,103) (672) - (2,775)Research and development 2 (4,008) (142) - (4,150)General and administration (1,207) (97) (13) (1,317)
Operating profit 2 5,916 233 (13) 6,136 Associates 14 -Financial income 4 261 Financial income – related parties 31 55 Financing costs 4 (2,098)Financing costs – related parties 31 (992)
Profit before taxes 3,362 Income taxes 5 (1,258)
Net income 2,104 Attributable to - Roche Holdings, Inc. shareholder 2,104
Reference numbers indicate corresponding Notes to the Consolidated Financial Statements.

Annual Report 2010 – Roche Holdings, Inc. Consolidated Financial Statements 7
Roche Holdings, Inc. consolidated income statement for the year ended December 31, 2009 in millions of USD
Pharmaceuticals Diagnostics Corporate RHI Group Sales 2 14,221 2,793 - 17,014 Royalties and other operating income 2 3,236 221 - 3,457 Cost of sales (4,335) (1,939) - (6,274)Marketing and distribution (2,418) (683) - (3,101)Research and development 2 (4,174) (119) - (4,293)General and administration (2,803) (130) (23) (2,956)
Operating profit 2 3,727 143 (23) 3,847 Associates 14 -Financial income 4 (724)Financial income – related parties 31 979 Financing costs 4 (1,884)Financing costs – related parties 31 (848)
Profit before taxes 1,370 Income taxes 5 (179)
Net income 1,191 Attributable to - Roche Holdings, Inc. shareholder 816 - Non-controlling interests 375
As disclosed in Note 1, the income statement for 2009 has been restated following the accounting policy changes which were adopted
in 2010. A reconciliation to the previously published income statement is provided in Note 1.
8 Annual Report 2010 – Roche Holdings, Inc. Consolidated Financial Statements
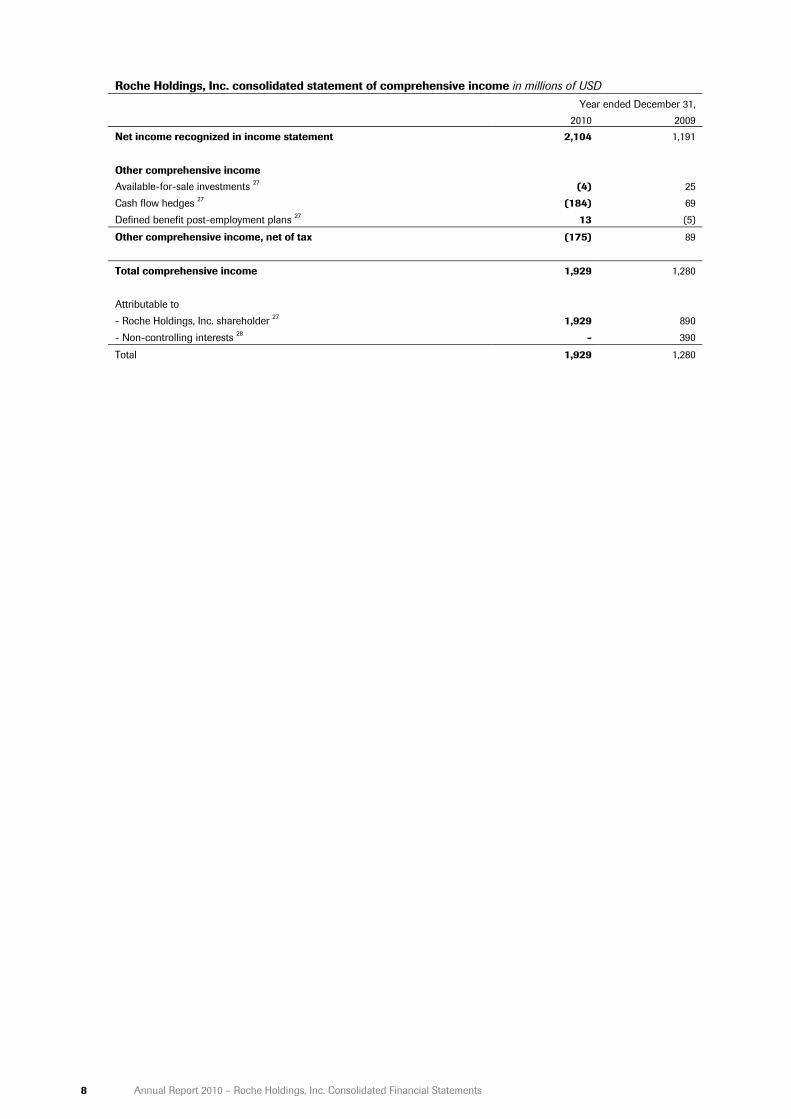
Roche Holdings, Inc. consolidated statement of comprehensive income in millions of USD
Year ended December 31, 2010 2009
Net income recognized in income statement 2,104 1,191
Other comprehensive income Available-for-sale investments 27 (4) 25 Cash flow hedges 27 (184) 69 Defined benefit post-employment plans 27 13 (5)
Other comprehensive income, net of tax (175) 89
Total comprehensive income 1,929 1,280 Attributable to - Roche Holdings, Inc. shareholder 27 1,929 890 - Non-controlling interests 28 - 390
Total 1,929 1,280
Annual Report 2010 – Roche Holdings, Inc. Consolidated Financial Statements 9
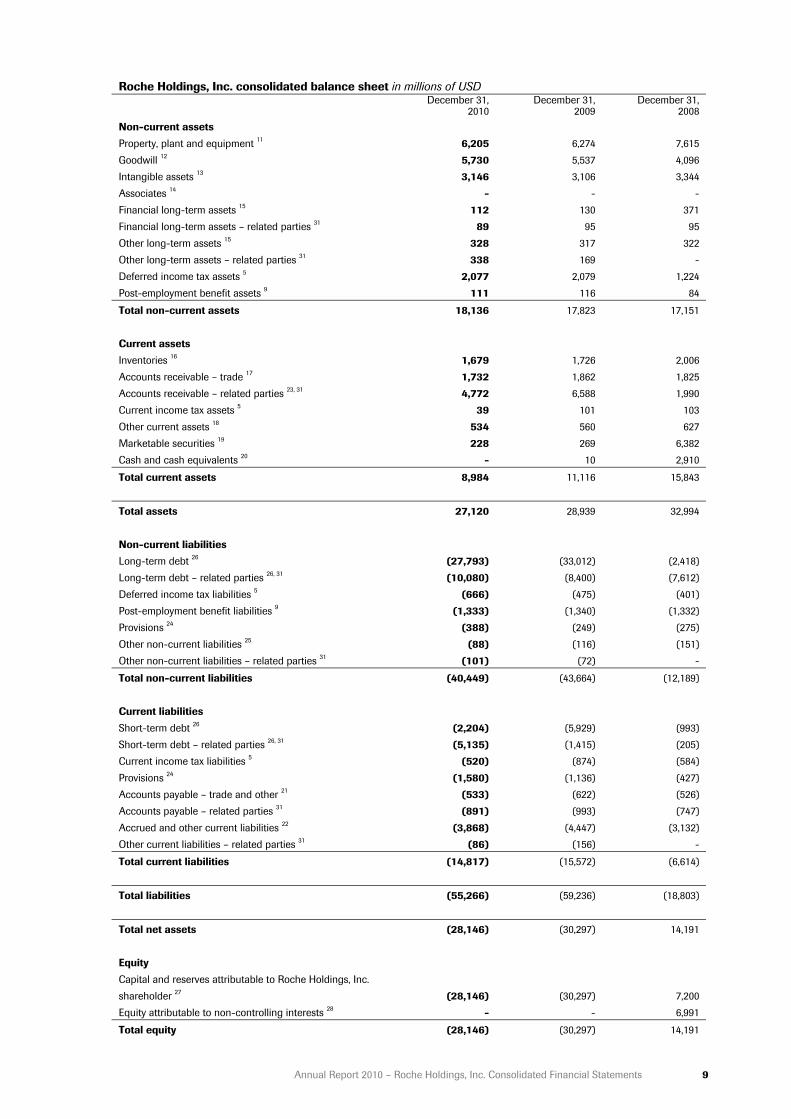
Roche Holdings, Inc. consolidated balance sheet in millions of USD
December 31,
2010 December 31,
2009 December 31,
2008 Non-current assets Property, plant and equipment 11 6,205 6,274 7,615 Goodwill 12 5,730 5,537 4,096 Intangible assets 13 3,146 3,106 3,344 Associates 14 - - - Financial long-term assets 15 112 130 371 Financial long-term assets – related parties 31 89 95 95 Other long-term assets 15 328 317 322 Other long-term assets – related parties 31 338 169 - Deferred income tax assets 5 2,077 2,079 1,224 Post-employment benefit assets 9 111 116 84
Total non-current assets 18,136 17,823 17,151 Current assets Inventories 16 1,679 1,726 2,006 Accounts receivable – trade 17 1,732 1,862 1,825 Accounts receivable – related parties 23, 31 4,772 6,588 1,990 Current income tax assets 5 39 101 103 Other current assets 18 534 560 627 Marketable securities 19 228 269 6,382 Cash and cash equivalents 20 - 10 2,910
Total current assets 8,984 11,116 15,843
Total assets 27,120 28,939 32,994 Non-current liabilities Long-term debt 26 (27,793) (33,012) (2,418) Long-term debt – related parties 26, 31 (10,080) (8,400) (7,612) Deferred income tax liabilities 5 (666) (475) (401) Post-employment benefit liabilities 9 (1,333) (1,340) (1,332) Provisions 24 (388) (249) (275) Other non-current liabilities 25 (88) (116) (151) Other non-current liabilities – related parties 31 (101) (72) -
Total non-current liabilities (40,449) (43,664) (12,189) Current liabilities Short-term debt 26 (2,204) (5,929) (993) Short-term debt – related parties 26, 31 (5,135) (1,415) (205) Current income tax liabilities 5 (520) (874) (584) Provisions 24 (1,580) (1,136) (427) Accounts payable – trade and other 21 (533) (622) (526) Accounts payable – related parties 31 (891) (993) (747) Accrued and other current liabilities 22 (3,868) (4,447) (3,132) Other current liabilities – related parties 31 (86) (156) -
Total current liabilities (14,817) (15,572) (6,614)
Total liabilities (55,266) (59,236) (18,803)
Total net assets (28,146) (30,297) 14,191 Equity Capital and reserves attributable to Roche Holdings, Inc. shareholder 27 (28,146) (30,297) 7,200 Equity attributable to non-controlling interests 28 - - 6,991
Total equity (28,146) (30,297) 14,191
10 Annual Report 2010 – Roche Holdings, Inc. Consolidated Financial Statements
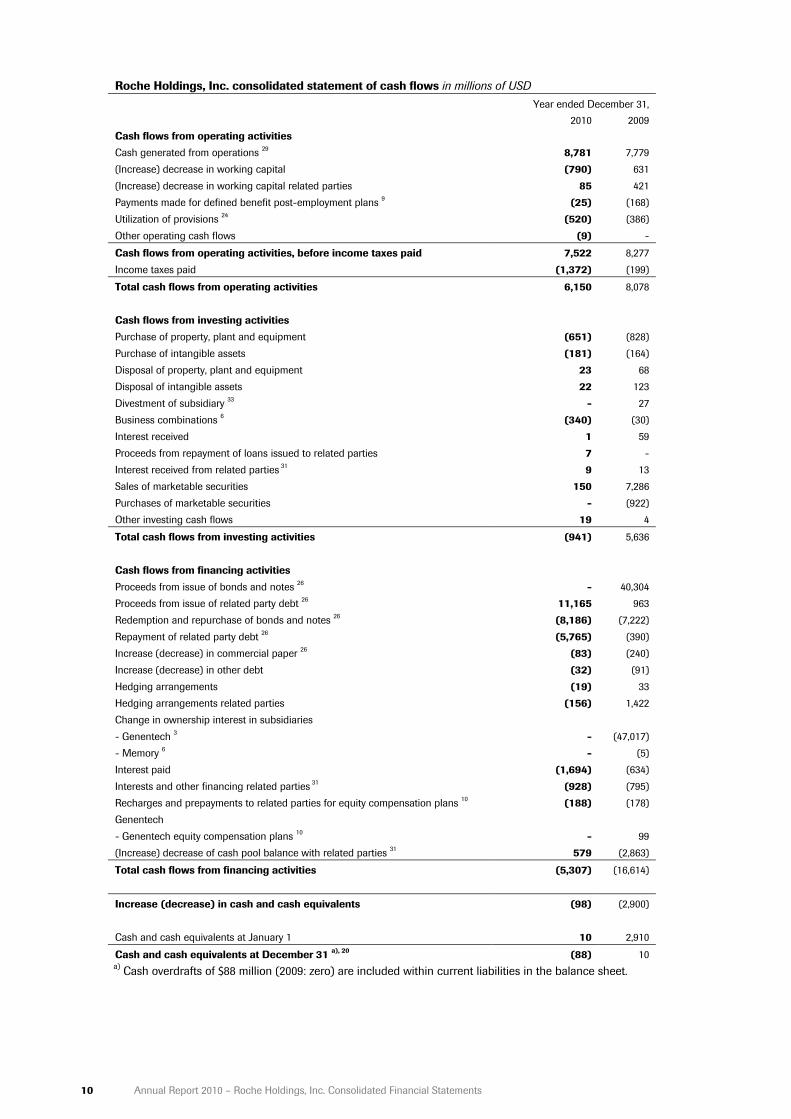
Roche Holdings, Inc. consolidated statement of cash flows in millions of USD
Year ended December 31, 2010 2009
Cash flows from operating activities Cash generated from operations 29 8,781 7,779 (Increase) decrease in working capital (790) 631 (Increase) decrease in working capital related parties 85 421 Payments made for defined benefit post-employment plans 9 (25) (168) Utilization of provisions 24 (520) (386) Other operating cash flows (9) -
Cash flows from operating activities, before income taxes paid 7,522 8,277 Income taxes paid (1,372) (199)
Total cash flows from operating activities 6,150 8,078 Cash flows from investing activities Purchase of property, plant and equipment (651) (828) Purchase of intangible assets (181) (164) Disposal of property, plant and equipment 23 68 Disposal of intangible assets 22 123 Divestment of subsidiary 33 - 27 Business combinations 6 (340) (30) Interest received 1 59 Proceeds from repayment of loans issued to related parties 7 - Interest received from related parties 31 9 13 Sales of marketable securities 150 7,286 Purchases of marketable securities - (922) Other investing cash flows 19 4
Total cash flows from investing activities (941) 5,636 Cash flows from financing activities Proceeds from issue of bonds and notes 26 - 40,304 Proceeds from issue of related party debt 26 11,165 963 Redemption and repurchase of bonds and notes 26 (8,186) (7,222) Repayment of related party debt 26 (5,765) (390) Increase (decrease) in commercial paper 26 (83) (240) Increase (decrease) in other debt (32) (91) Hedging arrangements (19) 33 Hedging arrangements related parties (156) 1,422 Change in ownership interest in subsidiaries - Genentech 3 - (47,017) - Memory 6 - (5) Interest paid (1,694) (634) Interests and other financing related parties 31 (928) (795) Recharges and prepayments to related parties for equity compensation plans 10 (188) (178) Genentech - Genentech equity compensation plans 10 - 99 (Increase) decrease of cash pool balance with related parties 31 579 (2,863)
Total cash flows from financing activities (5,307) (16,614)
Increase (decrease) in cash and cash equivalents (98) (2,900) Cash and cash equivalents at January 1 10 2,910
Cash and cash equivalents at December 31 a), 20 (88) 10 a) Cash overdrafts of $88 million (2009: zero) are included within current liabilities in the balance sheet.

Annual Report 2010 – Roche Holdings, Inc. Consolidated Financial Statements 11
Roche Holdings, Inc. consolidated statement of changes in equity in millions of USD
Share
capital Retained earnings
Fair value reserves
Hedging reserve Total
Non-controlling
interests Total equity Year ended December 31, 2009 At January 1, 2009 1 7,127 65 7 7,200 6,991 14,191 Net income recognized in income statement - 816 - - 816 375 1,191 Available-for-sale investments - - 23 - 23 2 25 Cash flow hedges - - - 56 56 13 69 Defined benefit post-employment plans - (5) - - (5) - (5)
Total comprehensive income - 811 23 56 890 390 1,280 Business combinations 6 - - - - - 4 4 Capital contribution related parties 27 - 382 - - 382 - 382 Dividends 27, 28 - - - - - - - Equity compensation plans 27, 28 - 297 - - 297 154 451 Changes in ownership interests in subsidiaries - Genentech 3 - (39,050) - - (39,050) (7,550) (46,600) - Memory 6 - (1) - - (1) (4) (5) Changes in non-controlling interests 27, 28 - (15) - - (15) 15 -
At December 31, 2009 1 (30,449) 88 63 (30,297) - (30,297) Year ended December 31, 2010 At January 1, 2010 1 (30,449) 88 63 (30,297) - (30,297) Net income recognized in income statement - 2,104 - - 2,104 - 2,104 Available-for-sale investments - - (4) - (4) - (4)Cash flow hedges - - - (184) (184) - (184) Defined benefit post-employment plans - 13 - - 13 - 13
Total comprehensive income - 2,117 (4) (184) 1,929 - 1,929 Dividends 27, 28 - - - - - - - Equity compensation plans 27, 28 - 222 - - 222 - 222 Other movements - (75) 53 22 - - -
At December 31, 2010 1 (28,185) 137 (99) (28,146) - (28,146)

12 Annual Report 2010 – Roche Holdings, Inc. Consolidated Financial Statements
Notes to the Roche Holdings, Inc. Consolidated Financial Statements
Reference numbers indicate corresponding Notes to the Consolidated Financial Statements.
1. Summary of significant accounting policies
Basis of preparation of the consolidated financial statements These financial statements are the consolidated financial statements of Roche Holdings, Inc., a company incorporated in the State of Delaware, and its subsidiaries (‘RHI’ or ‘the RHI Group’). RHI is 100% indirectly owned by Roche Holding Ltd, a public company registered in Switzerland and parent company of the Roche Group. Roche Holdings, Inc. and its subsidiaries are therefore members of the Roche Group. The consolidated financial statements of the RHI Group have been prepared in accordance with International Financial Reporting Standards (IFRS). They have been prepared using the historical cost convention except that, as disclosed in the accounting policies below, certain items, including derivatives and available-for-sale investments, are shown at fair value. They were approved for issue by the Board of Directors on January 26, 2011. The preparation of the consolidated financial statements requires management to make estimates and assumptions that affect the reported amounts of revenues, expenses, assets and liabilities, and the disclosure of contingent liabilities at the date of the financial statements. If in the future such estimates and assumptions, which are based on management’s best judgment at the date of the financial statements, deviate from the actual circumstances, the original estimates and assumptions will be modified as appropriate in the year in which the circumstances change. Effective March 26, 2009, the purchase of the non-controlling interests in Genentech was completed (see Note 3). Based on the revised International Accounting Standard 27 ‘Consolidated and Separate Financial Statements’ (IAS 27), which was adopted by RHI in 2008, this transaction was accounted for in full as an equity transaction. As a consequence, the carrying amount of the consolidated equity of the RHI Group was reduced by approximately $47 billion and at December 31, 2010 the RHI Group had a negative equity of $28.1 billion. The capacity of the RHI Group to generate positive cash flows and operating profit is not affected by this accounting treatment. In addition, bonds and notes with a carrying value of $28.1 billion are guaranteed by Roche Holding Ltd, the parent company of the Roche Group. Accordingly, management has assessed that it remains appropriate to prepare the RHI Group’s financial statements on a going concern basis. In 2010, the RHI Group generated an operating profit of $6,136 million and a positive operating cash flow of $6.2 billion. Changes in accounting policies that arise from the application of new or revised standards and interpretations are applied retrospectively, unless otherwise specified in the transitional requirements of the particular standard or interpretation. Retrospective application requires that the results of the comparative period and the opening balances of that period are restated as if the new accounting policy had always been applied. In some cases the transitional requirements of the particular standard or interpretation specify that the changes are to be applied prospectively. Prospective application requires that the new accounting policy only be applied to the results of the current period and the comparative period is not restated. In addition comparatives have been reclassified or extended from the previously reported results to take into account any presentational changes. Consolidation policy These financial statements are the consolidated financial statements of Roche Holdings, Inc., a company incorporated in the State of Delaware, and its subsidiaries. The subsidiaries are those companies controlled, directly or indirectly, by Roche Holdings, Inc., where control is defined as the power to govern the financial and operating policies of an enterprise so as to obtain benefits from its activities. This control is normally evidenced when Roche Holdings, Inc. owns, either directly or indirectly, more than 50% of the voting rights or currently exercisable potential voting rights of a company’s share capital. Special Purpose Entities are consolidated where the substance of the relationship is that the Special Purpose Entity is controlled by the RHI Group. Companies acquired during the year are consolidated from the date on which control is transferred to the RHI Group, and subsidiaries to be divested are included up to the date on which control passes from the RHI Group. Inter-company balances, transactions and resulting unrealized income are eliminated in full. Changes in ownership interests in subsidiaries are accounted for as equity transactions if they occur after control has already been obtained and if they do not result in a loss of control.

Annual Report 2010 – Roche Holdings, Inc. Consolidated Financial Statements 13
Investments in associates are accounted for using the equity method. These are companies over which the RHI Group exercises, or has the power to exercise, significant influence, but which it does not control. This is normally evidenced when the RHI Group owns 20% or more of the voting rights or currently exercisable potential voting rights of the company. Balances and transactions with associates that result in unrealized income are eliminated to the extent of the RHI Group’s interest in the associate. Interests in joint ventures are reported using the line-by-line proportionate consolidation method. Segment reporting The determination of the RHI Group’s operating segments is based on the organization units for which information is reported to the RHI Group’s management. The RHI Group has two divisions, Pharmaceuticals and Diagnostics. Revenues are primarily generated from the sale of prescription pharmaceutical products and diagnostic instruments, reagents and consumables, respectively. Both divisions also derive revenue from the sale or licensing of products or technology to third parties. Certain corporate activities that cannot be reasonably allocated to the other reportable business segments based on RHI’s management and organizational structure are reported as ‘Corporate’. Previously within the Pharmaceuticals Division there had been two sub-divisions, Roche Pharmaceuticals and Genentech. Following the completion of the Genentech transaction (see Note 3), the Genentech sub-division was merged into the Pharmaceuticals Division in these consolidated financial statements. Transfer prices between operating segments are set on an arm’s length basis. Operating assets and liabilities consist of property, plant and equipment, goodwill and intangible assets, trade receivables/payables, inventories and other assets and liabilities, such as provisions, which can be reasonably attributed to the reported operating segments. Non-operating assets and liabilities mainly include current and deferred income tax balances, post-employment benefit assets/liabilities and financial assets/liabilities such as cash, marketable securities, investments and debt. Foreign currency translation RHI and its subsidiaries use the U.S. dollar as the functional and presentation currency. Local transactions in other currencies are initially reported using the exchange rate at the date of the transaction. Gains and losses from the settlement of such transactions and gains and losses on translation of monetary assets and liabilities denominated in other currencies are included in income, except qualifying cash flow hedges, which are recorded in equity. Revenues Sales represent amounts received and receivable for goods supplied to customers after deducting trade discounts, cash discounts and volume rebates, and exclude sales taxes and other taxes directly linked to sales. Revenues from the sale of products are recognized upon transfer to the customer of significant risks and rewards. Trade discounts, cash discounts and volume rebates are recorded on an accrual basis consistent with the recognition of the related sales. Estimates of expected sales returns, charge-backs and other rebates, including Medicaid in the United States, are also deducted from sales and recorded as accrued liabilities or provisions or as a deduction from accounts receivable. Such estimates are based on analyses of existing contractual or legislatively mandated obligations, historical trends and RHI’s experience. If the circumstances are such that the level of sales returns, and hence revenues, cannot be reliably measured, then sales are only recognized when the right of return expires, which is generally upon prescription of the products to patients. Other revenues are recorded as earned or as the services are performed. Where necessary, single transactions are split into separately identifiable components to reflect the substance of the transaction. Conversely, two or more transactions may be considered together for revenue recognition purposes, where the commercial effect cannot be understood without reference to the series of transactions as a whole. Cost of sales Cost of sales includes the corresponding direct production costs and related production overheads of goods sold and services rendered. Royalties, alliance and collaboration expenses, including all collaboration profit-sharing arrangements are also reported as part of cost of sales. Start-up costs between validation and the achievement of normal production capacity are expensed as incurred. Research and development Internal research costs are those costs incurred for the purpose of gaining new scientific or technical knowledge and understanding. These costs are expensed as incurred. Internal development costs are those costs incurred for the application of research findings or other knowledge to plan and develop new products for commercial production. Such costs would qualify for capitalization as intangible assets only if all of the following criteria can be demonstrated:

14 Annual Report 2010 – Roche Holdings, Inc. Consolidated Financial Statements
• The technical feasibility of completing the development project successfully so that it will be available for use or
sale. • The intention to complete the development project. • The ability to use or sell the results of the development project. • That the development project would generate economic benefits. This would normally be evidenced by the
existence and size of a market for the results of the project itself or the products that would result from the project. • The availability of adequate technical, financial and other resources to complete the development project. • The ability to measure the development expenditure reliably that would qualify for capitalization as an intangible
asset. The development projects undertaken by the RHI Group are subject to technical, regulatory and other uncertainties, such that, in the opinion of management, the criteria for capitalization are not met prior to obtaining marketing approval by the regulatory authorities in major markets. Internal development costs that do not meet these criteria are therefore expensed as incurred. Post-marketing studies after regulatory approval, such as Phase IV costs in the pharmaceuticals business, are expensed as incurred. They generally involve safety surveillance and ongoing technical support of a drug after it receives marketing approval to be sold. They may be required by regulatory authorities or may be undertaken for safety or commercial reasons. The safety surveillance is designed to detect any rare or long-term adverse effects over a much larger patient population and longer time period than was possible during earlier stages of development. The costs of such post-marketing studies are not capitalized as intangible assets, as in the opinion of management, they do not generate separately identifiable incremental future economic benefits that can be reliably measured. In addition to its internal research and development activities, the RHI Group is also party to in-licensing and similar arrangements with its alliance partners. The RHI Group may also acquire in-process research and development assets, either through business combinations or through purchases of specific assets. In-process research and development resources acquired either through in-licensing arrangements, business combinations or separate purchases are capitalized as intangible assets if they are controlled by the RHI Group, are separately identifiable and are expected to generate future economic benefits, even if uncertainty exists as to whether the research and development will ultimately result in a marketable product. Consequently, upfront and milestone payments to third parties for pharmaceutical products or compounds before regulatory marketing approval are recognized as intangible assets. Assets acquired through such arrangements are measured on the basis set out below in the ‘Intangible assets’ policy and are reviewed for impairment as set out below in the ‘Impairment of property, plant and equipment and intangible assets’ policy. Once available for use, such intangible assets are amortized on a straight-line basis over the period of the expected benefit and are reviewed for impairment at each reporting date. If research and development are embedded in contracts for strategic alliances, the RHI Group carefully assesses whether upfront or milestone payments constitute funding of research and development work or acquisition of an asset. Licensing, milestone and other upfront receipts Royalty income is recognized on an accrual basis in accordance with the substance of the respective licensing agreements. If the collectability of a royalty amount is not reasonably assured, those royalties are recognized as revenue when the cash is received. Certain RHI Group companies receive from third parties upfront, milestone and other similar payments relating to the sale or licensing of products or technology. Revenue associated with performance milestones is recognized based on achievement of the deliverables as defined in the respective agreements. Upfront payments and license fees for which there are subsequent deliverables are initially reported as deferred income and are recognized in income as earned over the period of the development collaboration or the manufacturing obligation. Employee benefits Wages, salaries, social security contributions, paid annual leave and sick leave, bonuses, and non-monetary benefits are accrued in the year in which the associated services are rendered by employees of the RHI Group. Where the RHI Group provides long-term employee benefits, the cost is accrued to match the rendering of the services by the employees concerned. Liabilities for long-term employee benefits are discounted to take into account the time value of money, where material.
Annual Report 2010 – Roche Holdings, Inc. Consolidated Financial Statements 15
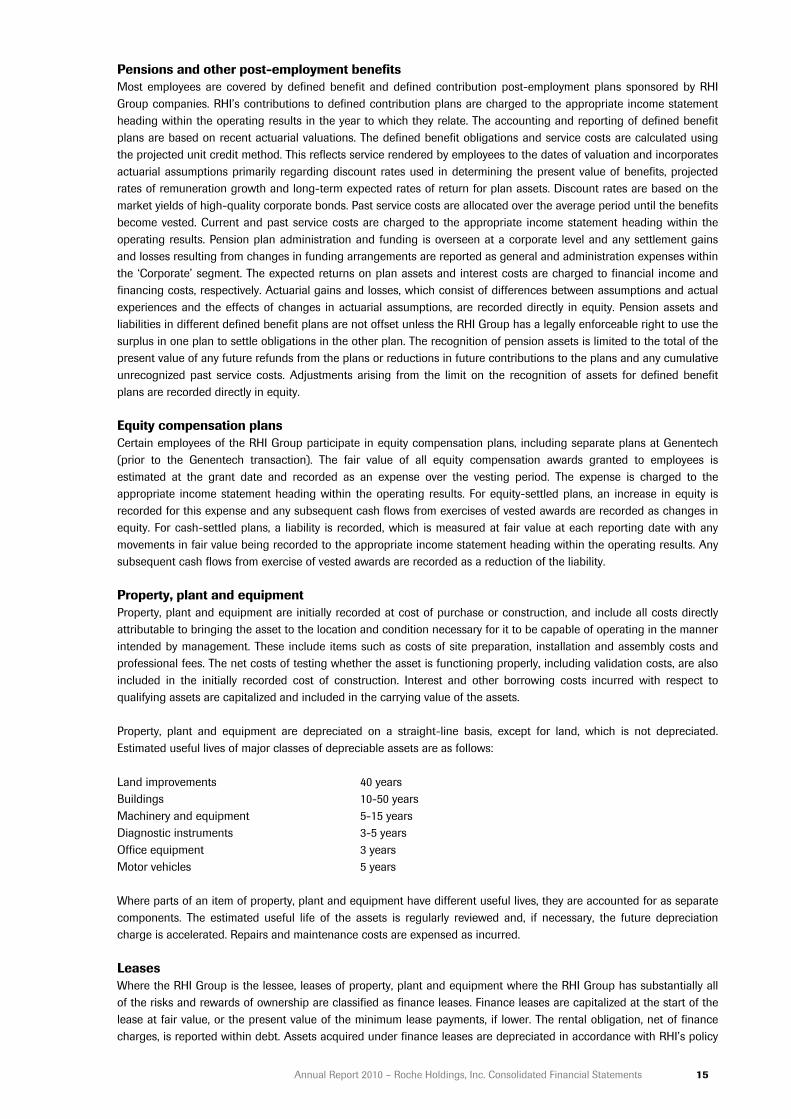
Pensions and other post-employment benefits Most employees are covered by defined benefit and defined contribution post-employment plans sponsored by RHI Group companies. RHI’s contributions to defined contribution plans are charged to the appropriate income statement heading within the operating results in the year to which they relate. The accounting and reporting of defined benefit plans are based on recent actuarial valuations. The defined benefit obligations and service costs are calculated using the projected unit credit method. This reflects service rendered by employees to the dates of valuation and incorporates actuarial assumptions primarily regarding discount rates used in determining the present value of benefits, projected rates of remuneration growth and long-term expected rates of return for plan assets. Discount rates are based on the market yields of high-quality corporate bonds. Past service costs are allocated over the average period until the benefits become vested. Current and past service costs are charged to the appropriate income statement heading within the operating results. Pension plan administration and funding is overseen at a corporate level and any settlement gains and losses resulting from changes in funding arrangements are reported as general and administration expenses within the ‘Corporate’ segment. The expected returns on plan assets and interest costs are charged to financial income and financing costs, respectively. Actuarial gains and losses, which consist of differences between assumptions and actual experiences and the effects of changes in actuarial assumptions, are recorded directly in equity. Pension assets and liabilities in different defined benefit plans are not offset unless the RHI Group has a legally enforceable right to use the surplus in one plan to settle obligations in the other plan. The recognition of pension assets is limited to the total of the present value of any future refunds from the plans or reductions in future contributions to the plans and any cumulative unrecognized past service costs. Adjustments arising from the limit on the recognition of assets for defined benefit plans are recorded directly in equity. Equity compensation plans Certain employees of the RHI Group participate in equity compensation plans, including separate plans at Genentech (prior to the Genentech transaction). The fair value of all equity compensation awards granted to employees is estimated at the grant date and recorded as an expense over the vesting period. The expense is charged to the appropriate income statement heading within the operating results. For equity-settled plans, an increase in equity is recorded for this expense and any subsequent cash flows from exercises of vested awards are recorded as changes in equity. For cash-settled plans, a liability is recorded, which is measured at fair value at each reporting date with any movements in fair value being recorded to the appropriate income statement heading within the operating results. Any subsequent cash flows from exercise of vested awards are recorded as a reduction of the liability. Property, plant and equipment Property, plant and equipment are initially recorded at cost of purchase or construction, and include all costs directly attributable to bringing the asset to the location and condition necessary for it to be capable of operating in the manner intended by management. These include items such as costs of site preparation, installation and assembly costs and professional fees. The net costs of testing whether the asset is functioning properly, including validation costs, are also included in the initially recorded cost of construction. Interest and other borrowing costs incurred with respect to qualifying assets are capitalized and included in the carrying value of the assets. Property, plant and equipment are depreciated on a straight-line basis, except for land, which is not depreciated. Estimated useful lives of major classes of depreciable assets are as follows: Land improvements 40 years Buildings 10-50 years Machinery and equipment 5-15 years Diagnostic instruments 3-5 years Office equipment 3 years Motor vehicles 5 years Where parts of an item of property, plant and equipment have different useful lives, they are accounted for as separate components. The estimated useful life of the assets is regularly reviewed and, if necessary, the future depreciation charge is accelerated. Repairs and maintenance costs are expensed as incurred. Leases Where the RHI Group is the lessee, leases of property, plant and equipment where the RHI Group has substantially all of the risks and rewards of ownership are classified as finance leases. Finance leases are capitalized at the start of the lease at fair value, or the present value of the minimum lease payments, if lower. The rental obligation, net of finance charges, is reported within debt. Assets acquired under finance leases are depreciated in accordance with RHI’s policy
16 Annual Report 2010 – Roche Holdings, Inc. Consolidated Financial Statements
on property, plant and equipment. If there is no reasonable certainty that the RHI Group will obtain ownership by the end of the lease term, the asset is depreciated over the shorter of the lease term and its useful life. The interest element of the lease payment is charged against income over the lease term based on the effective interest rate method. Leases where substantially all of the risks and rewards of ownership are not transferred to the RHI Group are classified as operating leases. Payments made under operating leases are charged against income on a straight-line basis over the period of the lease. Where the RHI Group is the lessor, which primarily occurs in the Diagnostics Division, assets subject to finance leases are initially reported as receivables at an amount equal to the net investment in the lease. Assets subject to operating leases are reported within property, plant and equipment. Lease income from finance leases is subsequently recognized as earned income over the term of the lease based on the effective interest rate method. Lease income from operating leases is recognized over the lease term on a straight-line basis. Business combinations and goodwill Business combinations are accounted for using the acquisition method of accounting. The consideration transferred in a business combination is measured at fair value at the date of acquisition. This consideration includes the cash paid plus the fair value at the date of exchange of assets given, liabilities incurred or assumed and equity instruments issued by the RHI Group. The fair value of the consideration transferred also includes contingent consideration arrangements at fair value. Directly attributable acquisition-related costs are expensed in the current period and reported within general and administration expenses. At the date of acquisition the RHI Group recognizes the identifiable assets acquired, the liabilities assumed and any non-controlling interest in the acquired business. The identifiable assets acquired and the liabilities assumed are initially recognized at fair value. Where the RHI Group does not acquire 100% ownership of the acquired business non-controlling interest are recorded as the proportion of the fair value of the acquired net assets attributable to the non-controlling interest. Goodwill is recorded as the surplus of the consideration transferred over the RHI Group’s interest in the fair value of the acquired net assets. Any goodwill and fair value adjustments are recorded as assets and liabilities of the acquired business in the functional currency of that business. When the initial accounting for a business combination is incomplete at the end of a reporting period, provisional amounts are used. During the measurement period, the provisional amounts are retrospectively adjusted and additional assets and liabilities may be recognized, to reflect new information obtained about the facts and circumstances that existed at the acquisition date which would have affected the measurement of the amounts recognized at that date, had they been known. The measurement period does not exceed twelve months from the date of acquisition. Goodwill is not amortized, but is assessed for possible impairment at each reporting date and is additionally tested annually for impairment. Goodwill may also arise upon investments in associates, being the surplus of the cost of investment over the RHI Group’s share of the fair value of the net identifiable assets. Such goodwill is recorded within investments in associates. Changes in ownership interests in subsidiaries are accounted for as equity transactions if they occur after control has already been obtained and if they do not result in a loss of control. Intangible assets Purchased patents, licenses, trademarks and other intangible assets are initially recorded at cost. Where these assets have been acquired through a business combination, this will be the fair value allocated in the acquisition accounting. Intangible assets are amortized over their useful lives on a straight-line basis beginning from the point when they are available for use. Estimated useful life is the lower of the legal duration and the economic useful life. The estimated useful life of intangible assets is regularly reviewed. Impairment of property, plant and equipment and intangible assets An impairment assessment is carried out when there is evidence that an asset may be impaired. In addition intangible assets that are not yet available for use are tested for impairment annually. When the recoverable amount of an asset, being the higher of its fair value less costs to sell and its value in use, is less than its carrying value, then the carrying value is reduced to its recoverable amount. This reduction is reported in the income statement as an impairment loss. Value in use is calculated using estimated cash flows, generally over a five-year period, with extrapolating projections for subsequent years. These are discounted using an appropriate long-term pre-tax interest rate. When an impairment loss arises, the useful life of the asset in question is reviewed and, if necessary, the future depreciation/amortization charge is accelerated. The impairment of financial assets is discussed below in the ‘Financial assets’ policy. Impairment of goodwill Goodwill is assessed for possible impairment at each reporting date and is additionally tested annually for impairment. Goodwill is allocated to cash-generating units as described in Note 12. When the recoverable amount of the cash-generating unit, being the higher of its fair value less costs to sell or its value in use, is less than its carrying value, then

Annual Report 2010 – Roche Holdings, Inc. Consolidated Financial Statements 17
the carrying value of the goodwill is reduced to its recoverable amount. This reduction is reported in the income statement as an impairment loss. The methodology used in the impairment testing is further described in Note 12. Inventories Inventories are stated at the lower of cost and net realizable value. The cost of finished goods and work in process includes raw materials, direct labor and other directly attributable costs and overheads based upon the normal capacity of production facilities. Cost is determined using the weighted average method. Net realizable value is the estimated selling price less cost to completion and selling expenses. Accounts receivable Accounts receivable are carried at the original invoice amount less allowances made for doubtful accounts, trade discounts, cash discounts, volume rebates and similar allowances. An allowance for doubtful accounts is recorded for the difference between the carrying value and the recoverable amount where there is objective evidence that the RHI Group will not be able to collect all amounts due. Trade discounts, cash discounts, volume rebates and similar allowances are recorded on an accrual basis consistent with the recognition of the related sales, using estimates based on existing contractual obligations, historical trends and RHI’s experience. Long-term accounts receivable are discounted to take into account the time value of money, where material. Cash and cash equivalents Cash and cash equivalents include cash on hand and time, call and current balances with banks and similar institutions. Such balances are only reported as cash if they are readily convertible to known amounts of cash, are subject to insignificant risk of changes in value and have a maturity of three months or less from the date of acquisition. This definition is also used for the statement of cash flows. Cash overdrafts that are repayable on demand and form an integral part of the RHI Group’s cash management are included as a component of cash and cash equivalents for the purpose of the consolidated statement of cash flows. Provisions Provisions are recognized where a legal or constructive obligation has been incurred which will probably lead to an outflow of resources that can be reasonably estimated. In particular, restructuring provisions are recognized when the RHI Group has a detailed formal plan that has either commenced implementation or been announced. Provisions are recorded for the estimated ultimate liability that is expected to arise, taking into account the time value of money, where material. A contingent liability is disclosed where the existence of the obligation will only be confirmed by future events or where the amount of the obligation cannot be measured with reasonable reliability. Contingent assets are not recognized, but are disclosed where an inflow of economic benefits is probable. Fair values Fair value is the amount for which a financial asset, liability or instrument could be exchanged between knowledgeable and willing parties in an arm’s length transaction. It is determined by reference to quoted market prices or by the use of established valuation techniques such as option pricing models and the discounted cash flows method if quoted prices in an active market are not available (‘fair value hierarchy’). Valuation techniques will incorporate observable market data about market conditions and other factors that are likely to affect the fair value of a financial instrument. Valuation techniques are typically used for derivative financial instruments. The fair values of financial assets and liabilities at the reporting date are not materially different from their reported carrying values unless specifically mentioned in the Notes to the Consolidated Financial Statements. Information on fair value hierarchy is included in Note 30 on risk management. Financial assets Financial assets, principally investments, including marketable securities, are classified as either ‘Fair-value-through-profit-or-loss’, ‘Available-for-sale’, ‘Held-to-maturity’ or ‘Loans and receivables’. Fair-value-through-profit-or-loss financial assets are either classified as held-for-trading or designated upon initial recognition. Held-for-trading financial assets are acquired principally to generate profit from short-term fluctuations in price. Financial assets are designated as fair-value-through-profit-or-loss if doing so results in more relevant information by eliminating a measurement or recognition inconsistency. Held-to-maturity financial assets are securities with a fixed maturity that the RHI Group has the intent and ability to hold until maturity. Loans and receivables are financial assets created by the RHI Group or acquired from the issuer in a primary market. They are non-derivative financial assets with fixed or determinable payments that are not quoted in an active market. All other financial assets are considered to be available-for-sale.

18 Annual Report 2010 – Roche Holdings, Inc. Consolidated Financial Statements
All financial assets are initially recorded at fair value, including transaction costs, except for assets at fair-value-through-profit-or-loss, which exclude transaction costs. All purchases and sales are recognized on the settlement date. Fair-value-through-profit-or-loss financial assets are subsequently carried at fair value, with all changes in fair value recorded as financial income in the period in which they arise. Held-to-maturity financial assets are subsequently carried at amortized cost using the effective interest rate method. Available-for-sale financial assets are subsequently carried at fair value, with all unrealized changes in fair value recorded in equity except for interest calculated using the effective interest rate method and foreign exchange components. When the available-for-sale financial assets are sold, impaired or otherwise disposed of, the cumulative gains and losses previously recognized in equity are included in financial income for the current period. Loans and receivables are subsequently carried at amortized cost using the effective interest rate method. Financial assets are individually assessed for possible impairment at each reporting date. An impairment charge is recorded where there is objective evidence of impairment, such as where the issuer is in bankruptcy, default or other significant financial difficulty. In addition any available-for-sale equity securities that have a market value of more than 25% below their original cost, net of any previous impairment, will be considered as impaired. Any available-for-sale equity securities that have a market value below their original cost, net of any previous impairment, for a sustained six-month period will also be considered as impaired. Any decreases in the market price of less than 25% of original cost, net of any previous impairment, which are also for less than a sustained six-month period are not by themselves considered as objective evidence of impairment. Such movements in fair value are recorded in equity until there is objective evidence of impairment or until the asset is sold or otherwise disposed of. For financial assets carried at amortized cost, any impairment charge is the difference between the carrying value and the recoverable amount, calculated using estimated future cash flows discounted using the original effective interest rate. For available-for-sale financial assets, any impairment charge is the amount currently carried in equity for the difference between the original cost, net of any previous impairment, and the fair value. An impairment loss is reversed if the reversal can be related objectively to an event occurring after the impairment loss was recognized. For debt securities measured at amortized cost or available-for-sale, the reversal is recognized in income. For equity securities held available-for-sale, the reversal is recognized directly in equity. A financial asset is derecognized when the contractual cash flows from the asset expire or when the Group transfers the rights to receive the contractual cash flows from the financial assets in a transaction in which substantially all the risks and rewards of ownership of the financial asset are transferred. Any interest in transferred financial assets that is created or retained by the Group is recognized as a separate asset or liability. Derivatives Derivative financial instruments are initially recorded and subsequently carried at fair value. Apart from those derivatives designated as qualifying cash flow hedging instruments as discussed in the ‘Hedging’ policy below, all changes in fair value are recorded as financial income in the period in which they arise. Embedded derivatives are recognized separately if not closely related to the host contract and where the host contract is carried at amortized cost. Hedge accounting For the purposes of hedge accounting, hedging relationships may be of three types. A ‘fair value hedge’ is a hedge of the exposure to changes in fair value of a recognized asset or liability, or an unrecognized firm commitment, or an identified portion of such an asset, liability or firm commitment, that is attributable to a particular risk and could affect profit or loss. A ‘cash flow hedge’ is a hedge of the exposure to variability in cash flows that is attributable to a particular risk associated with a recognized asset or liability or a highly probable forecast transaction and could affect profit or loss. A ‘hedge of a net investment in a foreign operation’ is a hedge of the foreign currency exposure on a net investment in a foreign operation. To qualify for hedge accounting the hedging relationship must meet several strict conditions on documentation, probability of occurrence (for cash flow hedges), hedge effectiveness and reliability of measurement. If these conditions are not met, then the relationship does not qualify for hedge accounting. In this case the hedging instrument and the hedged item are reported independently as if there were no hedging relationship. In particular any derivatives are reported at fair value, with changes in fair value included in financial income. For qualifying fair value hedges, the hedging instrument is recorded at fair value and the hedged item is recorded at its previous carrying value, adjusted for any changes in fair value that are attributable to the hedged risk. Any changes in the fair values are reported in financial income.

Annual Report 2010 – Roche Holdings, Inc. Consolidated Financial Statements 19
For qualifying cash flow hedges, the hedging instrument is recorded at fair value. The portion of any change in fair value that is an effective hedge is included in equity, and any remaining ineffective portion is reported in financial income. If the hedging relationship is the hedge of the foreign currency risk of a firm commitment or highly probable forecasted transaction that results in the recognition of a non-financial asset or liability, the cumulative changes in the fair value of the hedging instrument that have been recorded in equity are included in the initial carrying value of the asset or liability at the date of recognition. For all other qualifying cash flow hedges, the cumulative changes in the fair value of the hedging instrument that have been recorded in equity are included in financial income when the forecasted transaction affects net income. For qualifying hedges of net investment in a foreign entity, the hedging instrument is recorded at fair value. The portion of any change in fair value that is an effective hedge is included in equity. Any remaining ineffective portion is recorded in financial income where the hedging instrument is a derivative and in equity in other cases. If the entity is disposed of, then the cumulative changes of fair value of the hedging instrument that have been recorded in equity are reclassified to income. Debt Debt instruments are initially recorded at cost, which is the proceeds received, net of transaction costs. Subsequently they are reported at amortized cost. Any discount between the net proceeds received and the principal value due on redemption is amortized over the duration of the debt instrument and is recognized as part of financing costs using the effective interest rate method. The Group derecognizes a financial liability when its contractual obligations are discharged, cancelled or expired. Certain debt instruments have been designated as ‘fair-value-through-profit-or-loss’ where doing so results in more relevant information as it eliminates or significantly reduces measurement or recognition inconsistencies. Such debt instruments were reported at fair value, based on quoted prices in an active market, with movements in fair value reported within financial income. The Group’s last such instrument was redeemed on July 6, 2009 as disclosed in Note 26. Taxation Income taxes include all taxes based upon the taxable profits of the RHI Group, including withholding taxes payable on the distribution of retained earnings within the RHI Group. Other taxes not based on income, such as property and capital taxes, are included within general and administration expenses. Liabilities for income taxes, mainly withholding taxes, which could arise on the remittance of retained earnings, principally relating to subsidiaries, are only recognized where it is probable that such earnings will be remitted in the foreseeable future. Deferred income tax assets and liabilities are recognized on temporary differences between the tax bases of assets and liabilities and their carrying values in the financial statements. Deferred income tax assets relating to the carry-forward of unused tax losses are recognized to the extent that it is probable that future taxable profit will be available against which the unused tax losses can be utilized. Current and deferred income tax assets and liabilities are offset when the income taxes are levied by the same taxation authority and when there is a legally enforceable right to offset them. Deferred income taxes are determined based on the currently enacted tax rates applicable in each tax jurisdiction where the RHI Group operates. Discontinued businesses and non-current assets held for sale A discontinued business is a component of the RHI Group’s business that represents a separate major line of business or is a subsidiary acquired exclusively with a view to resale. Reclassification as a discontinued business occurs upon disposal or when the operation meets the criteria to be classified as held for sale, if earlier. A disposal group is a group of assets that are to be disposed of as a group in a single transaction, together with the liabilities directly associated with those assets that will be transferred in the transaction. The assets and liabilities in a disposal group are reclassified as held for sale if their value will be recovered principally through a sale rather than through continuing use. The disposal group must be available for sale in its current condition and the sale must be highly probable.

20 Annual Report 2010 – Roche Holdings, Inc. Consolidated Financial Statements
Immediately before classification as held for sale, the measurement of all assets and liabilities in a disposal group is updated in accordance with applicable accounting policies. Then, on initial classification as held for sale, disposal groups are recognized at the lower of carrying value and fair value less costs to sell. Impairment losses on initial classification as held for sale are included in the income statement. Management judgments made in applying accounting policies The application of RHI’s accounting policies may require management to make judgments, apart from those involving estimates, that can have a significant effect on the amounts recognized in the consolidated financial statements. Management judgment is particularly required when assessing the substance of transactions that have a complicated structure or legal form. These include, but are not limited to, the following areas: Revenue recognition: The nature of RHI’s business is such that many sales transactions do not have a simple structure. Sales agreements may consist of multiple components occurring at different times. RHI is also party to various out-licensing agreements, which can involve upfront and milestone payments that may occur over several years. These agreements may also involve certain future obligations. Revenue is only recognized when, in management’s judgment, the significant risks and rewards of ownership have been transferred and when the RHI Group does not retain continuing managerial involvement or effective control over the goods sold or when the obligation has been fulfilled. For some transactions this can result in cash receipts being initially recognized as deferred income and then released to income over subsequent periods on the basis of the performance of the conditions specified in the agreement. Consolidation of subsidiaries and associates: The RHI Group periodically undertakes transactions that may involve obtaining the right to control or significantly influence the operations of other companies. These transactions include the acquisition of all or part of the equity of other companies, the purchase of certain assets and assumption of certain liabilities and contingent liabilities of other companies, and entering into alliance agreements with other companies. Also included are transactions involving Special Purpose Entities and similar vehicles. In all such cases management makes an assessment as to whether the RHI Group has the right to control or significantly influence the other company’s operations, and based on this assessment the other company is consolidated as a subsidiary or associated company. In making this assessment management considers the underlying economic substance of the transaction and not only the contractual terms. Business combinations: Where the RHI Group acquires control of another business, the consideration transferred has to be allocated to the identifiable assets acquired, the liabilities assumed and any non-controlling interest the acquired business, with any residual recorded as goodwill. This process involves management making an assessment of the fair value of these items. Management judgment is particularly involved in the recognition and measurement of the following items: • Intellectual property. This may include patents, licenses, trademarks and similar rights for currently marketed
products and also the rights and scientific knowledge associated with projects that are currently in research or development phases.
• Contingencies such as legal and environmental matters. • Contingent consideration arrangements. • The recoverability of any accumulated tax losses previously incurred by the acquired company. In all cases management makes an assessment based on the underlying economic substance of items concerned, and not only on the contractual terms, in order to fairly present these items. Leases: The RHI Group is party to leasing arrangements, both as a lessee and as a lessor. The treatment of leasing transactions in the financial statements is mainly determined by whether the lease is considered to be an operating lease or a finance lease. In making this assessment, management looks at the substance of the lease, as well as the legal form, and makes a judgment about whether substantially all of the risks and rewards of ownership are transferred. Arrangements which do not take the legal form of a lease but that nevertheless convey the right to use an asset are also covered by such assessments. Key assumptions and sources of estimation uncertainty The preparation of the consolidated financial statements in conformity with IFRS requires management to make estimates and assumptions that affect the application of policies and reported amounts of assets, liabilities, income, expenses and related disclosures. The estimates and underlying assumptions are based on historical experience and various other factors that are believed to be reasonable under the circumstances, the results of which form the basis for
Annual Report 2010 – Roche Holdings, Inc. Consolidated Financial Statements 21
making the judgments about carrying values of assets and liabilities that are not readily apparent from other sources. Actual results may differ from these estimates. The estimates and underlying assumptions are reviewed on an ongoing basis. Changes in accounting estimates may be necessary if there are changes in the circumstances on which the estimate was based, or as a result of new information or more experience. Such changes are recognized in the period in which the estimate is revised. The key assumptions about the future and key sources of estimation uncertainty that have a significant risk of causing a material adjustment to the carrying value of assets and liabilities within the next twelve months are described below. Revenue recognition: If the circumstances are such that the level of sales returns, and hence revenues, cannot be reliably measured, then sales are only recognized when the right of return expires, which is generally upon prescription of the products to patients. In order to estimate this, management uses publicly available information about prescriptions as well as information provided by wholesalers and other intermediaries. Sales allowances: The RHI Group has provisions and accruals for expected sales returns, charge-backs and other rebates, including Medicaid in the United States, which at December 31, 2010 was $977 million. Such estimates are based on analyses of existing contractual or legislatively-mandated obligations, historical trends and RHI’s experience. Management believes that the total provisions and accruals for these items are adequate, based upon currently available information. As these deductions are based on management estimates, they may be subject to change as better information becomes available. Such changes that arise could impact the provisions and accruals recognized in the balance sheet in future periods and consequently the level of sales recognized in the income statement in future periods. Property, plant and equipment and intangible assets, including goodwill: The RHI Group has property, plant and equipment with a carrying value of $6,205 million as disclosed in Note 11. Goodwill has a carrying value of $5,730 million (see Note 12) and intangible assets have a carrying value of $3,146 million (see Note 13). All of these assets are reviewed annually for impairment as described above. To assess whether any impairment exists, estimates are made of the future cash flows expected to result from the use of the asset and its eventual disposal. Actual outcomes could vary significantly from such estimates of discounted future cash flows. Factors such as changes in the planned use of buildings, machinery or equipment, or closure of facilities, the presence or absence of competition, technical obsolescence or lower than anticipated sales of products with capitalized rights could result in shortened useful lives or impairment. Changes in the discount rates used could also lead to impairments. Pensions and other post-employment benefits: Many of RHI’s employees participate in post-employment defined benefit plans. The calculations of the recognized assets and liabilities from such plans are based upon statistical and actuarial calculations. In particular the present value of the defined benefit obligation is impacted by assumptions on discount rates used to arrive at the present value of future pension liabilities, and assumptions on future increases in salaries and benefits. Furthermore, RHI’s independent actuaries use statistically based assumptions covering areas such as future withdrawals of participants from the plan and estimates of life expectancy. At December 31, 2010 the present value of RHI’s defined benefit obligation is $3,754 million for funded plans and $418 million for unfunded plans (see Note 9). The actuarial assumptions used may differ materially from actual results due to changes in market and economic conditions, higher or lower withdrawal rates, longer or shorter life spans of participants, and other changes in the factors being assessed. These differences could impact the assets or liabilities recognized in the balance sheet in future periods. Legal provisions: The RHI Group is party to various legal proceedings including claims arising from trade, and the most significant matters are described in Note 24. Legal provisions at December 31, 2010 total $767 million. Management believes that the total provisions for legal proceedings are adequate based upon currently available information. However, given the inherent difficulties in estimating liabilities in this area, it cannot be guaranteed that additional costs will not be incurred beyond the amounts accrued. Additional claims could be made which might not be covered by existing provisions or by insurance. There can be no assurance that there will not be an increase in the scope of these matters or that any future lawsuits, claims, proceedings or investigations will not be material. Such changes that arise could impact the provisions recognized in the balance sheet in future periods. Environmental provisions: The RHI Group has provisions for environmental remediation costs, which at December 31, 2010 total $161 million, as disclosed in Note 24. The material components of the environmental provisions consist of costs to fully clean and refurbish contaminated sites, including landfills, and to treat and contain contamination at

22 Annual Report 2010 – Roche Holdings, Inc. Consolidated Financial Statements
certain other sites. Future remediation expenses are affected by a number of uncertainties that include, but are not limited to, the detection of previously unknown contaminated sites, the method and extent of remediation, the percentage of problematic materials attributable to the RHI Group at the remediation sites relative to that attributable to other parties, and the financial capabilities of the other potentially responsible parties. Management believes that the total provisions for environmental matters are adequate based upon currently available information. However, given the inherent difficulties in estimating liabilities in this area, it cannot be guaranteed that additional costs will not be incurred beyond the amounts accrued. The effect of the resolution of environmental matters on the results of operations cannot be predicted due to uncertainty concerning both the amount and the timing of future expenditures. Such changes that arise could impact the provisions recognized in the balance sheet in future periods. Income taxes: At December 31, 2010 the net liability for current income taxes is $481 million and the net asset for deferred income taxes is $1,411 million, as disclosed in Note 5. Significant estimates are required to determine the current and deferred assets and liabilities for income taxes. Some of these estimates are based on interpretations of existing tax laws or regulations. Management believes that the estimates are reasonable and that the recognized liabilities for income tax-related uncertainties are adequate. Various internal and external factors may have favorable or unfavorable effects on the income tax assets and liabilities. These factors include, but are not limited to, changes in tax laws, regulations and/or rates, changing interpretations of existing tax laws or regulations, future levels of research and development spending and changes in overall levels of pre-tax earnings. Such changes that arise could impact the assets and liabilities recognized in the balance sheet in future periods.
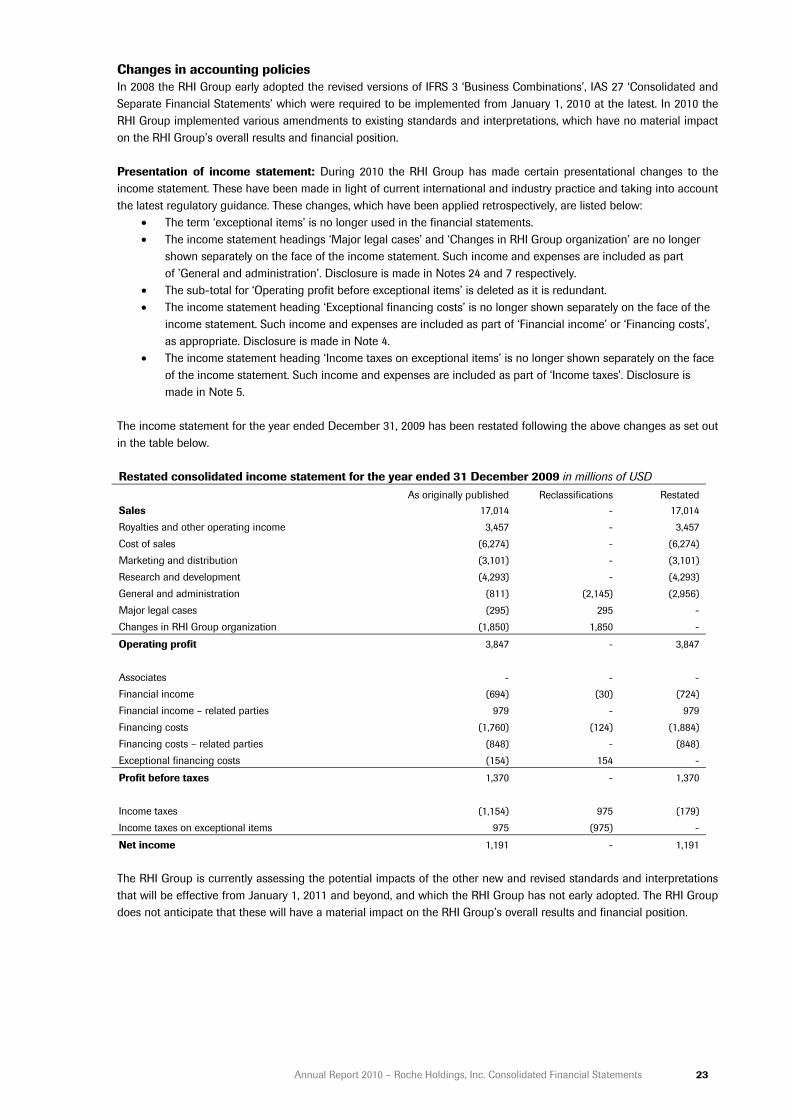
Annual Report 2010 – Roche Holdings, Inc. Consolidated Financial Statements 23
Changes in accounting policies In 2008 the RHI Group early adopted the revised versions of IFRS 3 ‘Business Combinations’, IAS 27 ‘Consolidated and Separate Financial Statements’ which were required to be implemented from January 1, 2010 at the latest. In 2010 the RHI Group implemented various amendments to existing standards and interpretations, which have no material impact on the RHI Group’s overall results and financial position. Presentation of income statement: During 2010 the RHI Group has made certain presentational changes to the income statement. These have been made in light of current international and industry practice and taking into account the latest regulatory guidance. These changes, which have been applied retrospectively, are listed below:
• The term ‘exceptional items’ is no longer used in the financial statements. • The income statement headings ‘Major legal cases’ and ‘Changes in RHI Group organization’ are no longer
shown separately on the face of the income statement. Such income and expenses are included as part of ’General and administration’. Disclosure is made in Notes 24 and 7 respectively.
• The sub-total for ‘Operating profit before exceptional items’ is deleted as it is redundant. • The income statement heading ‘Exceptional financing costs’ is no longer shown separately on the face of the
income statement. Such income and expenses are included as part of ‘Financial income’ or ‘Financing costs’, as appropriate. Disclosure is made in Note 4.
• The income statement heading ‘Income taxes on exceptional items’ is no longer shown separately on the face of the income statement. Such income and expenses are included as part of ‘Income taxes’. Disclosure is made in Note 5.
The income statement for the year ended December 31, 2009 has been restated following the above changes as set out in the table below. Restated consolidated income statement for the year ended 31 December 2009 in millions of USD
As originally published Reclassifications Restated Sales 17,014 - 17,014 Royalties and other operating income 3,457 - 3,457 Cost of sales (6,274) - (6,274) Marketing and distribution (3,101) - (3,101) Research and development (4,293) - (4,293) General and administration (811) (2,145) (2,956) Major legal cases (295) 295 - Changes in RHI Group organization (1,850) 1,850 -
Operating profit 3,847 - 3,847 Associates - - - Financial income (694) (30) (724) Financial income – related parties 979 - 979 Financing costs (1,760) (124) (1,884) Financing costs – related parties (848) - (848) Exceptional financing costs (154) 154 -
Profit before taxes 1,370 - 1,370 Income taxes (1,154) 975 (179) Income taxes on exceptional items 975 (975) -
Net income 1,191 - 1,191
The RHI Group is currently assessing the potential impacts of the other new and revised standards and interpretations that will be effective from January 1, 2011 and beyond, and which the RHI Group has not early adopted. The RHI Group does not anticipate that these will have a material impact on the RHI Group’s overall results and financial position.

24 Annual Report 2010 – Roche Holdings, Inc. Consolidated Financial Statements
2. Operating segment information
Divisional information in millions of USD
Pharmaceuticals
Diagnostics Corporate RHI Group 2010 2009 2010 2009 2010 2009 2010 2009
Revenues from external customers and related parties Sales 14,178 14,221 2,920 2,793 - - 17,098 17,014 Royalties and other operating income 3,188 3,236 250 221 - - 3,438 3,457
Total 17,366 17,457 3,170 3,014 - - 20,536 20,471 Segment results Operating profit 5,916 3,727 233 143 (13) (23) 6,136 3,847 Capital expenditure Business combinations 451 54 113 - - - 564 54 Additions to property, plant and equipment 490 595 154 203 - - 644 798 Additions to intangible assets 176 164 5 - - - 181 164
Total capital expenditure 1,117 813 272 203 - - 1,389 1,016 Research and development Research and development costs 4,008 4,174 142 119 - - 4,150 4,293 Other segment information Depreciation of property, plant and equipment 490 599 143 129 - - 633 728 Amortization of intangible assets 69 123 177 181 - - 246 304 Impairment of property, plant and equipment 57 858 2 3 - - 59 861 Impairment of goodwill - - - - - - - - Impairment of intangible assets 227 427 16 36 - - 243 463 Equity compensation plan expenses 172 409 20 24 2 3 194 436

Annual Report 2010 – Roche Holdings, Inc. Consolidated Financial Statements 25
Net operating assets in millions of USD
Assets Liabilities Net assets 2010 2009 2008 2010 2009 2008 2010 2009 2008
Pharmaceuticals 12,877 13,004 15,212 (5,140) (5,423) (3,969) 7,737 7,581 11,243 Diagnostics 7,481 7,449 6,147 (868) (766) (853) 6,613 6,683 5,294 Corporate 7 170 409 (43) (203) (347) (36) (33) 62
Total operating 20,365 20,623 21,768 (6,051) (6,392) (5,169) 14,314 14,231 16,599 Non-operating 6,755 8,316 11,226 (49,215) (52,844) (13,634) (42,460) (44,528) (2,408)
RHI Group 27,120 28,939 32,994 (55,266) (59,236) (18,803) (28,146) (30,297) 14,191
Supplementary information on sales for major products is given on page 3 of the Management Report.
Major customers Substantially all of the RHI Group’s third party sales are to customers in the United States. The U.S. national wholesale distributors, AmerisourceBergen Corp., Cardinal Health, Inc. and McKesson Corp. each contributed more than 10% of the RHI Group’s revenues. The total amounts of revenues are approximately $6 billion (2009: $6 billion), $3 billion (2009: $3 billion) and $4 billion (2009: $4 billion), respectively. These revenues arose primarily in the Pharmaceuticals segment.
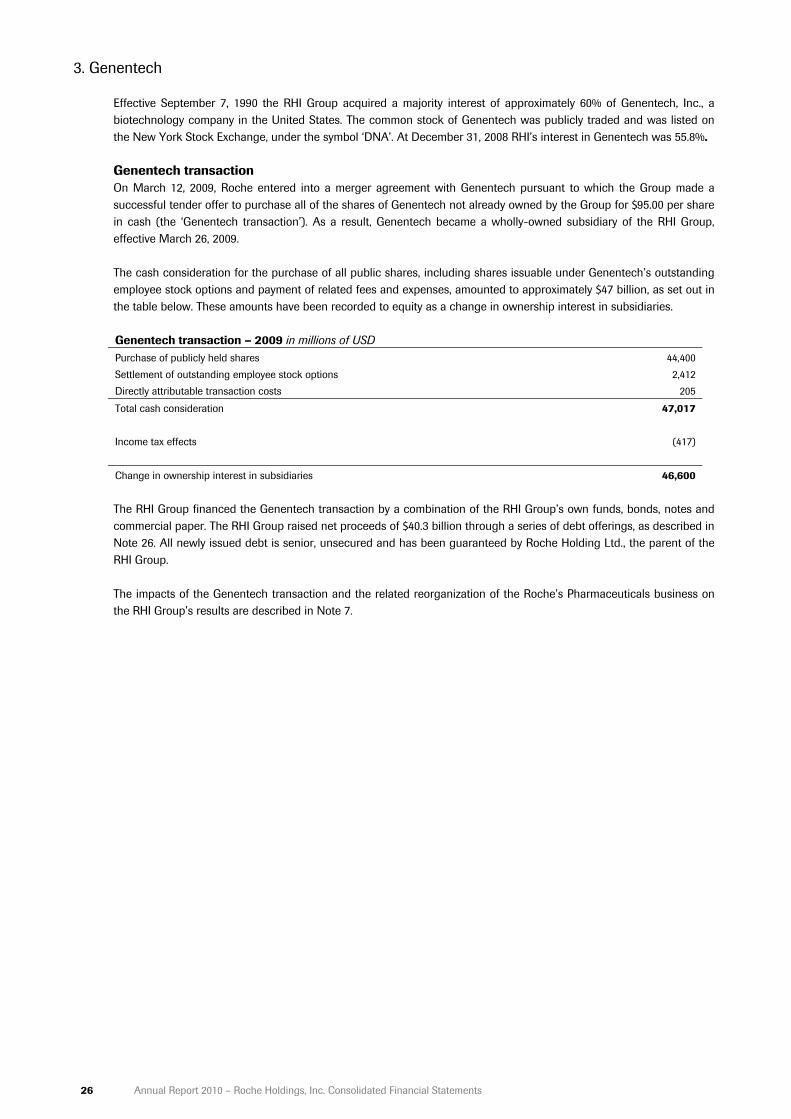
26 Annual Report 2010 – Roche Holdings, Inc. Consolidated Financial Statements
3. Genentech
Effective September 7, 1990 the RHI Group acquired a majority interest of approximately 60% of Genentech, Inc., a biotechnology company in the United States. The common stock of Genentech was publicly traded and was listed on the New York Stock Exchange, under the symbol ‘DNA’. At December 31, 2008 RHI’s interest in Genentech was 55.8%. Genentech transaction On March 12, 2009, Roche entered into a merger agreement with Genentech pursuant to which the Group made a successful tender offer to purchase all of the shares of Genentech not already owned by the Group for $95.00 per share in cash (the ‘Genentech transaction’). As a result, Genentech became a wholly-owned subsidiary of the RHI Group, effective March 26, 2009. The cash consideration for the purchase of all public shares, including shares issuable under Genentech’s outstanding employee stock options and payment of related fees and expenses, amounted to approximately $47 billion, as set out in the table below. These amounts have been recorded to equity as a change in ownership interest in subsidiaries. Genentech transaction – 2009 in millions of USD Purchase of publicly held shares 44,400 Settlement of outstanding employee stock options 2,412 Directly attributable transaction costs 205
Total cash consideration 47,017 Income tax effects (417)
Change in ownership interest in subsidiaries 46,600
The RHI Group financed the Genentech transaction by a combination of the RHI Group’s own funds, bonds, notes and commercial paper. The RHI Group raised net proceeds of $40.3 billion through a series of debt offerings, as described in Note 26. All newly issued debt is senior, unsecured and has been guaranteed by Roche Holding Ltd., the parent of the RHI Group. The impacts of the Genentech transaction and the related reorganization of the Roche’s Pharmaceuticals business on the RHI Group’s results are described in Note 7.

Annual Report 2010 – Roche Holdings, Inc. Consolidated Financial Statements 27
4. Financial income and financing costs
Financial income in millions of USD Year ended December 31, 2010 2009
Gains on sale of equity securities 100 29 (Losses) on sale of equity securities - (1) Write-downs and impairments of equity securities (2) (4)
Net income from equity securities 98 24 Interest income 1 58 Gain (loss) on liquidation of debt securities - (30)
Net interest income and income from debt securities 1 28 Expected return on plan assets of defined benefit plans 9 209 184 Foreign exchange gains (losses), net (54) (966) Gains (losses) on foreign currency derivatives, net - -
Net foreign exchange (losses) (54) (966) Net other financial income (expense) 7 6
Total financial income 261 (724) Net foreign exchange losses of $54 million were largely offset by a net gain of $46 made on foreign exchange forward contracts with related parties (see Note 31). The related party derivatives mirror exactly the terms of derivative contracts that a Roche Group affiliate outside the RHI Group has entered with third party financial institutions. Financing costs in millions of USD
Year ended December 31, 2010 2009
Interest expense (1,573) (1,485) Interest expense incurred on newly issued bonds and notes during bridging period - (124) Amortization of debt discount 26 (43) (41) Gains (losses) on debt derivatives, net - 2 Gains (losses) on redemption and repurchase of bonds and notes, net 26 (244) (8) Gains (losses) on financial liabilities at fair-value-through-profit-or-loss, net - 6 Time cost of provisions 24 (16) (17) Interest cost of defined benefit plans 9 (222) (217)
Total financing costs (2,098) (1,884) Net financial income in millions of USD
Year ended December 31, 2010 2009
Financial income 261 (724) Financing costs (2,098) (1,884)
Net financial income (1,837) (2,608) Financial result from Treasury management (1,824) (2,575) Financial result from Pension management (13) (33)
Net financial income (1,837) (2,608) Genentech transaction financing costs: As described in Note 3, effective March 26, 2009 the RHI Group purchased all publicly owned shares of Genentech for $95.00 per share in cash, with the total cash consideration of the transaction, including shares issuable under Genentech’s outstanding employee stock option plans and payment of related fees and expenses, being approximately $47.0 billion. In order to execute this transaction, Roche’s Treasury operations liquidated certain debt securities into cash. This resulted in a net loss on these transactions of $30 million. Furthermore, due to the prevailing financial conditions, the RHI Group issued bonds and notes in advance of the transaction totaling $40.3 billion through a series of debt offerings,
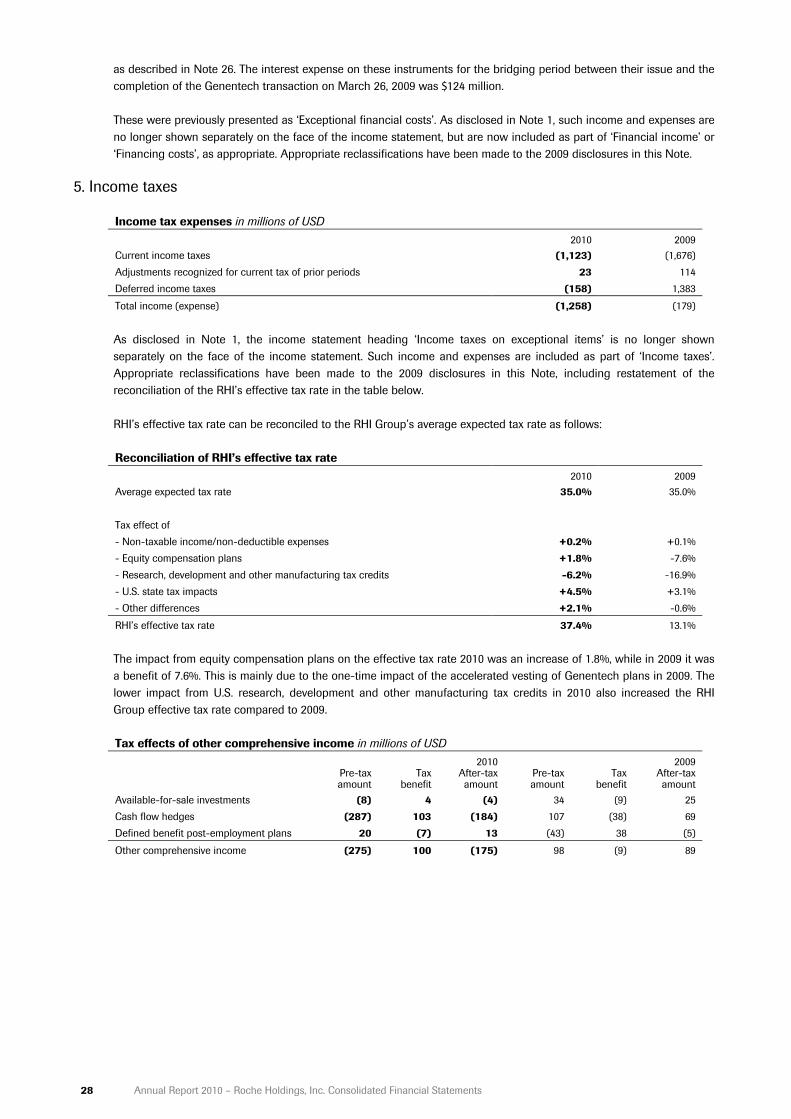
28 Annual Report 2010 – Roche Holdings, Inc. Consolidated Financial Statements
as described in Note 26. The interest expense on these instruments for the bridging period between their issue and the completion of the Genentech transaction on March 26, 2009 was $124 million. These were previously presented as ‘Exceptional financial costs’. As disclosed in Note 1, such income and expenses are no longer shown separately on the face of the income statement, but are now included as part of ‘Financial income’ or ‘Financing costs’, as appropriate. Appropriate reclassifications have been made to the 2009 disclosures in this Note.
5. Income taxes
Income tax expenses in millions of USD 2010 2009
Current income taxes (1,123) (1,676) Adjustments recognized for current tax of prior periods 23 114 Deferred income taxes (158) 1,383
Total income (expense) (1,258) (179) As disclosed in Note 1, the income statement heading ‘Income taxes on exceptional items’ is no longer shown separately on the face of the income statement. Such income and expenses are included as part of ‘Income taxes’. Appropriate reclassifications have been made to the 2009 disclosures in this Note, including restatement of the reconciliation of the RHI’s effective tax rate in the table below. RHI’s effective tax rate can be reconciled to the RHI Group’s average expected tax rate as follows: Reconciliation of RHI’s effective tax rate
2010 2009 Average expected tax rate 35.0% 35.0% Tax effect of - Non-taxable income/non-deductible expenses +0.2% +0.1% - Equity compensation plans +1.8% -7.6% - Research, development and other manufacturing tax credits -6.2% -16.9% - U.S. state tax impacts +4.5% +3.1% - Other differences +2.1% -0.6%
RHI’s effective tax rate 37.4% 13.1%
The impact from equity compensation plans on the effective tax rate 2010 was an increase of 1.8%, while in 2009 it was a benefit of 7.6%. This is mainly due to the one-time impact of the accelerated vesting of Genentech plans in 2009. The lower impact from U.S. research, development and other manufacturing tax credits in 2010 also increased the RHI Group effective tax rate compared to 2009.
Tax effects of other comprehensive income in millions of USD
2010 2009
Pre-tax amount
Tax benefit
After-tax amount
Pre-tax amount
Tax benefit
After-tax amount
Available-for-sale investments (8) 4 (4) 34 (9) 25 Cash flow hedges (287) 103 (184) 107 (38) 69 Defined benefit post-employment plans 20 (7) 13 (43) 38 (5)
Other comprehensive income (275) 100 (175) 98 (9) 89

Annual Report 2010 – Roche Holdings, Inc. Consolidated Financial Statements 29
Income tax assets (liabilities) in millions of USD
2010 2009 2008 Current income taxes - Assets 39 101 103 - Liabilities (520) (874) (584) Net current income tax assets (liabilities) (481) (773) (481) Deferred income taxes - Assets 2,077 2,079 1,224 - Liabilities (666) (475) (401) Net deferred income tax assets (liabilities) 1,411 1,604 823 Movements in amounts recorded on the balance sheet for current income taxes are shown in the table below: Current income taxes: movements in recognized net assets (liabilities) in millions of USD
2010 2009 Net current income tax asset (liability) at 1 January (773) (481) Income taxes paid 1,372 199 (Charged) credited to the income statement - Current income taxes (1,123) (1,676) - Adjustments recognized for current tax of prior periods 23 114 (Charged) credited to equity from equity compensation plans and other transactions with shareholders 15 1,085 Other 5 (14)
Net current income tax asset (liability) at December 31 (481) (773)
Deferred income tax assets are recognized for tax loss carry-forwards only to the extent that realization of the related tax benefit is probable. The RHI Group has unrecognized tax losses, including valuation allowances, as follows: Unrecognized tax losses: expiry 2010 2009
Amount (mUSD)
Applicable tax rate
Amount (mUSD)
Applicable tax rate
Within one year - - - - Between one and five years - - - - More than five years 923 4% 115 35%
Total unrecognized tax losses 923 4% 115 35% The ‘More than five’ years category includes losses that cannot be used for U.S. state income tax purposes in those states which only permit tax reporting on a separate entity basis. Deferred income tax liabilities have not been established for the withholding tax and other taxes that would be payable on the unremitted earnings, as such amounts are currently regarded as permanently reinvested. These unremitted earnings totaled $5.1 billion at 31 December 2010 (2009: none). Movements in amounts recorded on the balance sheet for deferred income taxes are shown in the table below: Deferred income taxes: movements in recognized net assets (liabilities) in millions of USD
Property, plant and equipment, and intangible
assets Other temporary
differences Total Year ended December 31, 2009 Net deferred income tax asset (liability) at January 1, 2009 (1,321) 2,144 823 Memory acquisition 6 (16) 21 5 (Charged) credited to the income statement 328 1,055 1,383 (Charged) credited to equity from other comprehensive income 27 - (9) (9) (Charged) credited to equity from equity compensation plans and other transactions with shareholders - (460) (460) Other (153) 15 (138)
Net deferred income tax asset (liability) at December 31, 2009 (1,162) 2,766 1,604

30 Annual Report 2010 – Roche Holdings, Inc. Consolidated Financial Statements
Year ended December 31, 2010 Net deferred income tax asset (liability) at January 1, 2010 (1,162) 2,766 1,604 Marcadia acquisition 6 (120) 8 (112)Other business combinations 6 (28) 23 (5)(Charged) credited to the income statement 27 (185) (158)(Charged) credited to equity from other comprehensive income 27 - 100 100 (Charged) credited to equity from equity compensation plans and other transactions with shareholders - (18) (18)
Net deferred income tax asset (liability) at December 31, 2010 (1,283) 2,694 1,411
6. Business combinations
Acquisitions – 2010 Effective December 29, 2010 the RHI Group acquired a 100% controlling interest in Marcadia Biotech, Inc., (‘Marcadia’), a privately owned U.S. company based in Carmel, Indiana. Marcadia is a biopharmaceutical company focused on developing a broad portfolio of drug candidates for the treatment of diabetes and obesity. Marcadia is now reported as part of the Pharmaceuticals operating segment. The acquisition of Marcadia will allow the RHI Group to integrate Marcadia’s development pipeline into its own Research and Development portfolio. Marcadia’s research programs focus on new peptide therapies for the treatment of Type 2 diabetes and obesity. These include next generation peptides such as MAR701, a novel compound currently in Phase I development. Based on Marcadia’s unique peptide chemistry technology, these peptides are designed to offer patients improved efficacy, safety and convenience. The total purchase consideration was $377 million, of which $287 million was paid in cash and $90 million arises from a contingent consideration arrangement. The payment from this arrangement is based on the achievement of two separate performance milestones that may arise between 2013 and 2015 and the range of outcomes, undiscounted, is between zero and $250 million. A liability of $90 million was recognized at the acquisition date, based on management’s best estimate of the probability–adjusted expected cash outflow from the arrangement. As at December 31, 2010 the amount recognized for this arrangement was unchanged, based on the most recent management estimates. The purchase has been allocated as shown in the table below. The assets and liabilities and the amounts allocated to them are provisional based on preliminary information and valuations of the assets and liabilities of Marcadia. They are subject to adjustment during 2011, if new information is obtained about the facts and circumstances that existed at the acquisition date. Marcadia acquisition: net assets acquired in millions of USD
Carrying value
prior to acquisition Fair value
adjustments Carrying value
upon acquisition Intangible assets - Product intangibles: in use - 93 93 - Product intangibles: not available for use - 206 206 Inventories - - -Deferred income taxes 10 (122) (112)Cash 34 - 34 Other net assets (liabilities) 4 - 4
Net identifiable assets 48 177 225 Goodwill 152
Purchase consideration 377 Goodwill represents a control premium and synergies that can be obtained from the Group’s existing business. None of the goodwill recognized is expected to be deductible for income tax purposes. The fair value of other net assets (liabilities) includes receivables with a fair value of $6 million. Other acquisitions: Effective September 3, 2010 the RHI Group acquired a 100% controlling interest in BioImagene, Inc., (‘BioImagene’), a privately owned U.S. company, based in Sunnyvale, California. BioImagene is engaged in the digital pathology workflow and analysis field and is reported as part of the Diagnostics operating segment. The

Annual Report 2010 – Roche Holdings, Inc. Consolidated Financial Statements 31
acquisition complements and strengthens the RHI Group’s portfolio in image analysis and diagnosis. The total purchase consideration was $85 million in cash. There was another minor business combination in the Diagnostics business with a total purchase consideration of $2 million in cash. The combined purchase consideration has been allocated as follows: Other acquisitions - 2010: net assets acquired in millions of USD
Carrying value
prior to acquisition Fair value
adjustments Carrying value
upon acquisition Property, plant and equipment 1 - 1Goodwill - - -Intangible assets - Product intangibles: in use - 17 17 - Product intangibles: not available for use - 51 51 - Technology intangibles: in use - 3 3Inventories 2 - 2Deferred income taxes - (5) (5)Cash - - -Other net assets (liabilities) (23) - (23)
Net identifiable assets (liabilities) (20) 66 46 Goodwill 41
Purchase consideration 87 Goodwill represents a control premium and synergies that can be obtained from the Group’s existing business. None of the goodwill recognized is expected to be deductible for income tax purposes. The fair value of other net assets (liabilities) does not include any receivables. Directly attributable transaction costs of $2 million were incurred in these acquisitions. These are reported within general and administration expenses in the current period as part of the operating result of the Pharmaceuticals and Diagnostics operating segment ($1 million each). Acquisitions – 2010: impact on results in millions of USD
Revenues from external
customers
Inventory fair value
adjustment
Amortisation of intangible
assets Operating
profit Net incomeImpact on reported results Marcadia - - - - -
Pharmaceuticals Division - - - - - BioImagene 1 - (1) (6) (4)Minor business combination - - - - -
Diagnostics Division 1 - (1) (6) (4) RHI Group 1 - (1) (6) (4) Estimated impact on results if acquisition assumed effective January 1, 2010 Marcadia 20 - (9) (1) -
Pharmaceuticals Division 20 - (9) (1) - BioImagene 2 - (1) (19) (12)Minor business combination - - (1) (2) (1)
Diagnostics Division 2 - (2) (21) (13) RHI Group 22 - (11) (22) (13)

32 Annual Report 2010 – Roche Holdings, Inc. Consolidated Financial Statements
The above figures exclude directly attributable acquisition-related costs of $1 million related to acquisitions by the Pharmaceuticals Division and $1 million related to acquisitions by the Diagnostics Division. Corresponding tax impacts are also excluded.
a) The figures exclude integration costs of $2 million related to Marcadia and BioImagine. Corresponding tax impacts are also excluded.
Acquisitions – 2010: net cash outflow in millions of USD
Cash
consideration paid Cash in
acquired company Net cash
outflow Marcadia (287) 34 (253)Other acquisitions (87) - (87)
Total acquisitions (374) 34 (340)
Acquisitions – 2009 Effective January 1, 2009 the RHI Group acquired an 89.6% controlling interest in Memory Pharmaceuticals Corp. ('Memory'), a publicly owned U.S. company based in Montvale, New Jersey, that had been listed on the NASDAQ under the symbol ‘MEMY’. Memory develops innovative drug candidates for the treatment of debilitating central nervous system (CNS) disorders such as Alzheimer's disease and schizophrenia. Memory is reported as part of the Pharmaceuticals operating segment. The acquisition will further strengthen the RHI Group’s research and development pipeline in areas such as Alzheimer’s disease. The purchase consideration was $45 million, paid in cash. The purchase consideration has been allocated as follows: Memory acquisition: net assets acquired in millions of USD
Carrying value
prior to acquisition Fair value
adjustments Carrying value
upon acquisition Intangible assets - Product intangibles: not available for use - 44 44 Deferred income taxes 5 1 4 5Cash 15 - 15 Provisions 24 (3) - (3)Other net assets (liabilities) (22) - (22)
Net identifiable assets (liabilities) (9) 48 39 Non-controlling interests (4)Goodwill 10
Purchase consideration 45 Subsequent to the effective date of the acquisition on January 1, 2009, the RHI Group purchased the remaining shares in Memory held by third parties to give the RHI Group a 100% interest in Memory. The cash consideration was $5 million, which has been recorded to equity as a change in ownership interest in subsidiaries.
Goodwill represents a control premium and synergies that can be obtained from the RHI Group’s existing business. None of the goodwill recognized is expected to be deductible for income tax purposes. The fair value of other net assets (liabilities) includes receivables with a fair value of $1 million. Directly attributable acquisition-related costs of $1 million were incurred in this acquisition. These are reported within the operating result of the Pharmaceuticals operating segment.
Memory Acquisition – 2009: net cash outflow in millions of USD
Cash
consideration paid Cash in
acquired company Net cash
outflow Memory (45) 15 (30) The above cash consideration paid does not include the subsequent payment of $5 million to purchase the remaining shares in Memory held by third parties to give the RHI Group a 100% interest in Memory. This is reported as financing cash flow in the statement of cash flows within the heading ‘Change in ownership interest in subsidiaries’.

Annual Report 2010 – Roche Holdings, Inc. Consolidated Financial Statements 33
Contingent consideration arrangements The RHI Group is party to certain contingent consideration arrangements arising from business combination arrangements. The provisions for these arrangements are recorded as part of other provisions (see Note 24) and are set out in the table below.
Provisions for contingent consideration arrangements in millions of USD
2010 2009 At January 1 - - Additional provisions created - - Unused amounts reversed - - Utilised during the year - - Unwinding of discount - - Business combinations 6 - Marcadia 90 - - Minor business combinations - -
At December 31 90 - Expected outflow of resources - Within one year - - - Between one to two years - - - Between two to three years 90 - - More than three years - -
Total provisions 90 - 7. Global restructuring plans
Genentech transaction: restructuring and integration On July 21, 2008 the Roche Group announced an offer to purchase all outstanding shares of Genentech. Following the closing of a transaction, Genentech’s South San Francisco site would become the headquarters of the RHI Group’s combined pharmaceuticals operations in the United States. On July 21, 2008 the Roche Group also announced that the Roche’s pharmaceuticals business in the U.S. would close manufacturing operations at its site in Nutley, New Jersey, and commercial operations would be moved to Genentech. The research site at Palo Alto, California, would be closed with the research activities being transferred to Nutley and to Genentech. Subsequent to these announcements, initial restructuring activities started at the Nutley and Palo Alto sites in 2008. As described in Note 3, the Genentech transaction was completed effective March 26, 2009. Following this the Pharmaceuticals Division initiated a detailed integration program to align the Genentech business and the rest of the Roche’s pharmaceuticals business. Genentech’s South San Francisco site has now been established as the headquarters of the pharmaceuticals business in the U.S., including commercial operations for the U.S. market. Genentech Research and Early Development has been set up as an autonomous unit while Genentech’s late-stage development activities have been integrated with the global Pharmaceuticals Division network. The integration program included prioritizing projects within the shared portfolio and eliminating activities that were either duplicated or no longer required, notably in the administration function. Following the completion of the transaction, the Pharmaceuticals Division carried out a detailed reassessment of its global manufacturing network, with particular emphasis on its biotech manufacturing facilities. As a result several manufacturing facilities and construction projects have been discontinued, notably a bulk drug production unit on part of the site at Vacaville in California. These restructuring activities have been substantially completed by the end of 2010.
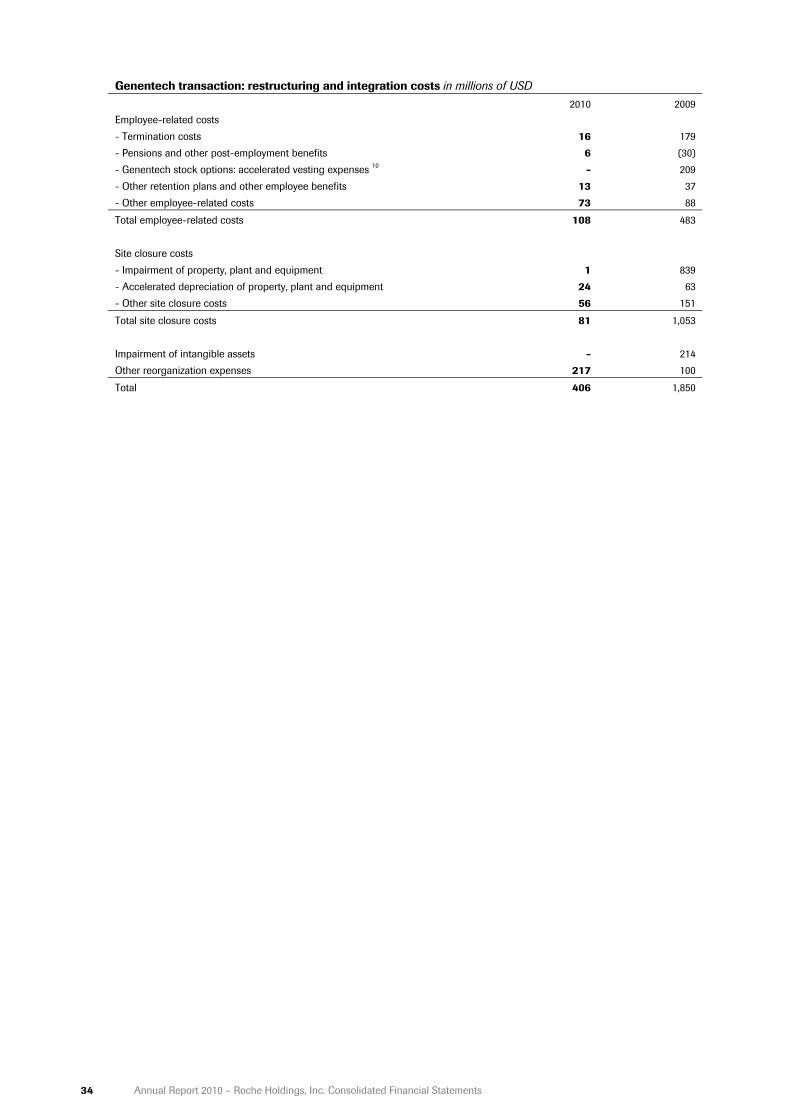
34 Annual Report 2010 – Roche Holdings, Inc. Consolidated Financial Statements
Genentech transaction: restructuring and integration costs in millions of USD
2010 2009 Employee-related costs - Termination costs 16 179 - Pensions and other post-employment benefits 6 (30) - Genentech stock options: accelerated vesting expenses 10 - 209 - Other retention plans and other employee benefits 13 37 - Other employee-related costs 73 88
Total employee-related costs 108 483 Site closure costs - Impairment of property, plant and equipment 1 839 - Accelerated depreciation of property, plant and equipment 24 63 - Other site closure costs 56 151
Total site closure costs 81 1,053 Impairment of intangible assets - 214 Other reorganization expenses 217 100
Total 406 1,850

Annual Report 2010 – Roche Holdings, Inc. Consolidated Financial Statements 35
Operational Excellence On November 17, 2010 the Roche Group announced details concerning the ‘Operational Excellence’ global restructuring plan. The plan is aimed at adapting cost structures to an increasingly challenging market environment and achieving significant efficiency and productivity gains. The planned measures will enable sustained investment in research and product development and thus strengthen the Roche Group’s long-term innovation capability. Implementation plans include reducing the work force by 3,550 positions in the United States over the next two years. The planned job reductions will occur in the Pharmaceuticals Division, particularly division’s global sales and marketing organization and in manufacturing. Approximately 800 jobs would be transferred to other Roche sites outside the United States. As part of its plans, the Roche Group intends to seek buyers for its Pharmaceuticals Division manufacturing sites at Florence, South Carolina and Boulder, Colorado in the United States, which would affect additional 600 jobs, and for the research and development site at Madison, Wisconsin, in the United States. These plans are still at a preliminary stage and all of these sites are still in operation. Following a comprehensive portfolio review, the Pharmaceuticals Division has decided to discontinue certain activities in research and early development. In addition certain product development activities are being discontinued or transferred to other Roche sites or to third parties. As a result of these decisions intangible assets with a carrying value of $129 million were fully impaired during 2010. The Roche Group currently anticipates that these restructuring activities will be substantially completed by the end of 2012. Operational Excellence: restructuring costs in millions of USD
2010 Employee-related costs - Termination costs 278 - Pensions and other post-employment benefits (72)- Other employee-related costs 7
Total employee-related costs 213 Site closure costs - Impairment of property, plant and equipment 17 - Accelerated depreciation of property, plant and equipment -- Environmental remediation costs 1- Other site closure costs 31
Total site closure costs 49 Impairment of intangible assets 129 Other reorganization expenses 16
Total 407
Classification of Operational Excellence restructuring costs in millions of USD 2010
Depreciation,amortization
and impairment Other costs Total
Cost of sales - Pharmaceuticals 11 18 29 Marketing and distribution - Pharmaceuticals - 79 79 Research and development - Pharmaceuticals 129 147 276 General and administration - Pharmaceuticals 5 18 23
Total 145 262 407 Total by operating segment - Pharmaceuticals 145 262 407
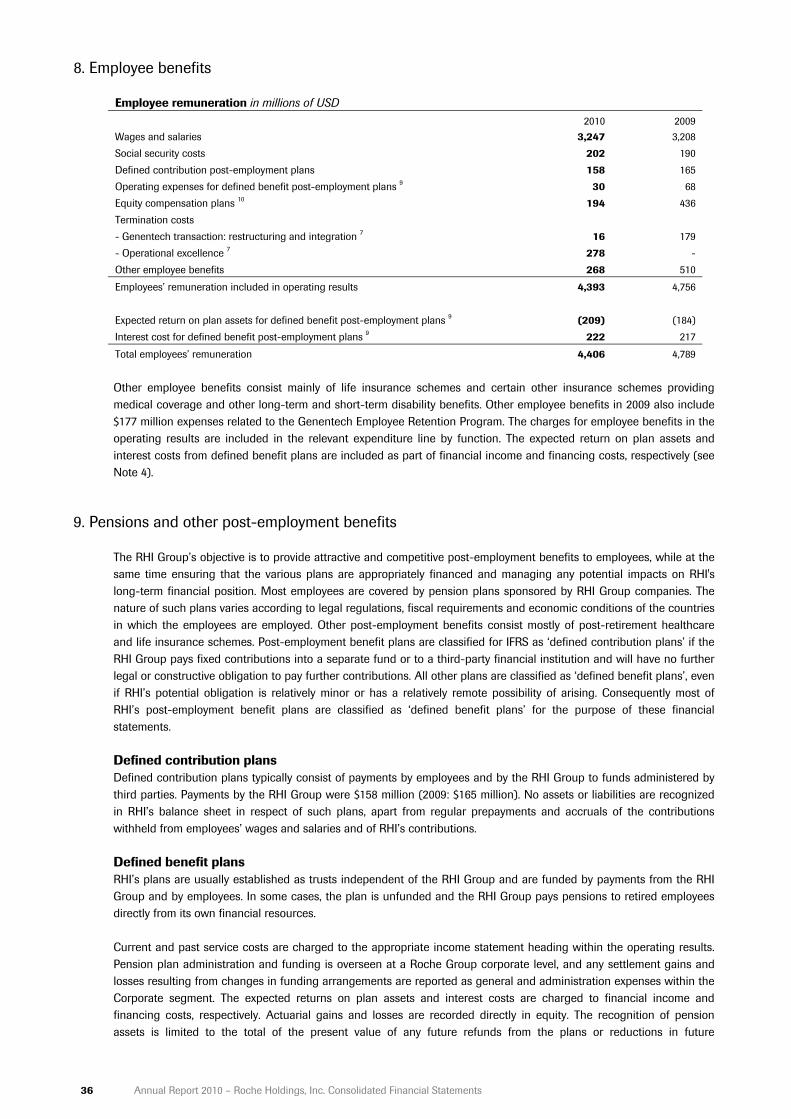
36 Annual Report 2010 – Roche Holdings, Inc. Consolidated Financial Statements
8. Employee benefits
Employee remuneration in millions of USD 2010 2009
Wages and salaries 3,247 3,208 Social security costs 202 190 Defined contribution post-employment plans 158 165 Operating expenses for defined benefit post-employment plans 9 30 68 Equity compensation plans 10 194 436 Termination costs - Genentech transaction: restructuring and integration 7 16 179 - Operational excellence 7 278 - Other employee benefits 268 510
Employees’ remuneration included in operating results 4,393 4,756 Expected return on plan assets for defined benefit post-employment plans 9 (209) (184) Interest cost for defined benefit post-employment plans 9 222 217
Total employees’ remuneration 4,406 4,789 Other employee benefits consist mainly of life insurance schemes and certain other insurance schemes providing medical coverage and other long-term and short-term disability benefits. Other employee benefits in 2009 also include $177 million expenses related to the Genentech Employee Retention Program. The charges for employee benefits in the operating results are included in the relevant expenditure line by function. The expected return on plan assets and interest costs from defined benefit plans are included as part of financial income and financing costs, respectively (see Note 4).
9. Pensions and other post-employment benefits
The RHI Group’s objective is to provide attractive and competitive post-employment benefits to employees, while at the same time ensuring that the various plans are appropriately financed and managing any potential impacts on RHI's long-term financial position. Most employees are covered by pension plans sponsored by RHI Group companies. The nature of such plans varies according to legal regulations, fiscal requirements and economic conditions of the countries in which the employees are employed. Other post-employment benefits consist mostly of post-retirement healthcare and life insurance schemes. Post-employment benefit plans are classified for IFRS as ‘defined contribution plans’ if the RHI Group pays fixed contributions into a separate fund or to a third-party financial institution and will have no further legal or constructive obligation to pay further contributions. All other plans are classified as ‘defined benefit plans’, even if RHI’s potential obligation is relatively minor or has a relatively remote possibility of arising. Consequently most of RHI’s post-employment benefit plans are classified as ‘defined benefit plans’ for the purpose of these financial statements. Defined contribution plans Defined contribution plans typically consist of payments by employees and by the RHI Group to funds administered by third parties. Payments by the RHI Group were $158 million (2009: $165 million). No assets or liabilities are recognized in RHI’s balance sheet in respect of such plans, apart from regular prepayments and accruals of the contributions withheld from employees’ wages and salaries and of RHI’s contributions. Defined benefit plans RHI’s plans are usually established as trusts independent of the RHI Group and are funded by payments from the RHI Group and by employees. In some cases, the plan is unfunded and the RHI Group pays pensions to retired employees directly from its own financial resources. Current and past service costs are charged to the appropriate income statement heading within the operating results. Pension plan administration and funding is overseen at a Roche Group corporate level, and any settlement gains and losses resulting from changes in funding arrangements are reported as general and administration expenses within the Corporate segment. The expected returns on plan assets and interest costs are charged to financial income and financing costs, respectively. Actuarial gains and losses are recorded directly in equity. The recognition of pension assets is limited to the total of the present value of any future refunds from the plans or reductions in future
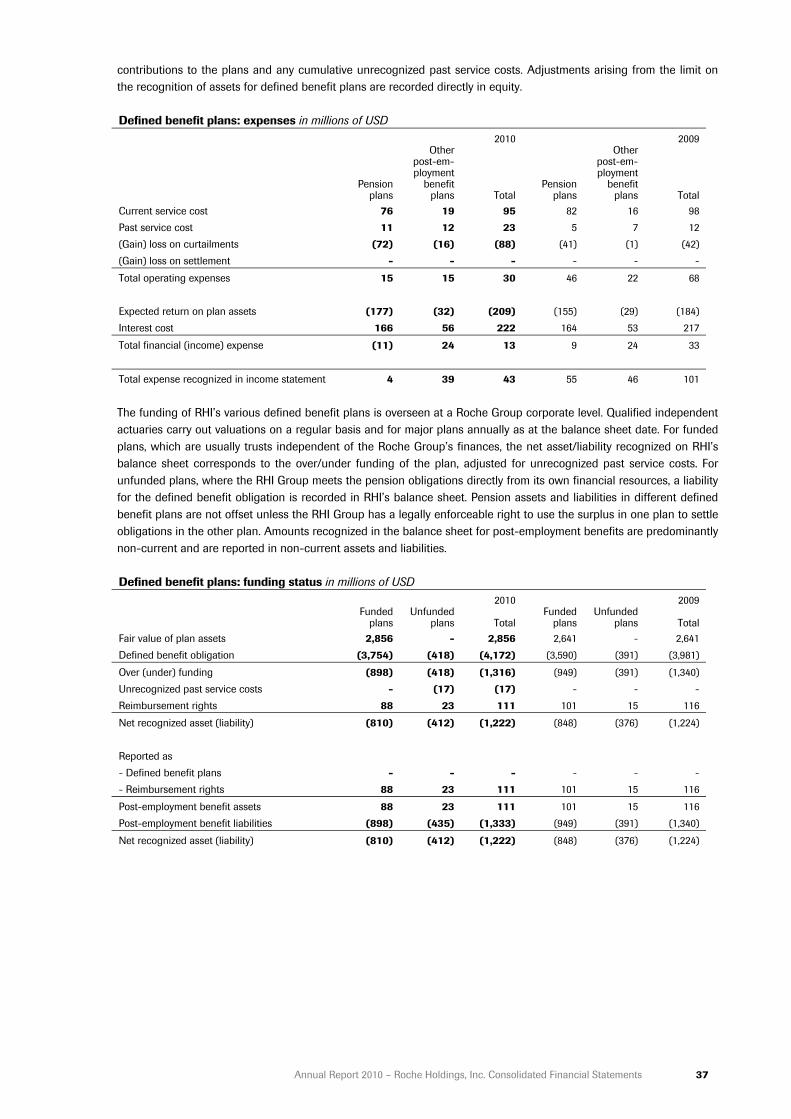
Annual Report 2010 – Roche Holdings, Inc. Consolidated Financial Statements 37
contributions to the plans and any cumulative unrecognized past service costs. Adjustments arising from the limit on the recognition of assets for defined benefit plans are recorded directly in equity. Defined benefit plans: expenses in millions of USD
2010 2009
Pension
plans
Other post-em-ployment
benefit plans Total
Pension plans
Other post-em-ployment
benefit plans Total
Current service cost 76 19 95 82 16 98Past service cost 11 12 23 5 7 12(Gain) loss on curtailments (72) (16) (88) (41) (1) (42)(Gain) loss on settlement - - - - - -
Total operating expenses 15 15 30 46 22 68 Expected return on plan assets (177) (32) (209) (155) (29) (184)Interest cost 166 56 222 164 53 217
Total financial (income) expense (11) 24 13 9 24 33
Total expense recognized in income statement 4 39 43 55 46 101 The funding of RHI’s various defined benefit plans is overseen at a Roche Group corporate level. Qualified independent actuaries carry out valuations on a regular basis and for major plans annually as at the balance sheet date. For funded plans, which are usually trusts independent of the Roche Group’s finances, the net asset/liability recognized on RHI’s balance sheet corresponds to the over/under funding of the plan, adjusted for unrecognized past service costs. For unfunded plans, where the RHI Group meets the pension obligations directly from its own financial resources, a liability for the defined benefit obligation is recorded in RHI’s balance sheet. Pension assets and liabilities in different defined benefit plans are not offset unless the RHI Group has a legally enforceable right to use the surplus in one plan to settle obligations in the other plan. Amounts recognized in the balance sheet for post-employment benefits are predominantly non-current and are reported in non-current assets and liabilities. Defined benefit plans: funding status in millions of USD
2010 2009
Funded
plans Unfunded
plans Total Funded
plans Unfunded
plans TotalFair value of plan assets 2,856 - 2,856 2,641 - 2,641Defined benefit obligation (3,754) (418) (4,172) (3,590) (391) (3,981)
Over (under) funding (898) (418) (1,316) (949) (391) (1,340)Unrecognized past service costs - (17) (17) - - - Reimbursement rights 88 23 111 101 15 116
Net recognized asset (liability) (810) (412) (1,222) (848) (376) (1,224) Reported as - Defined benefit plans - - - - - - - Reimbursement rights 88 23 111 101 15 116
Post-employment benefit assets 88 23 111 101 15 116Post-employment benefit liabilities (898) (435) (1,333) (949) (391) (1,340)
Net recognized asset (liability) (810) (412) (1,222) (848) (376) (1,224)

38 Annual Report 2010 – Roche Holdings, Inc. Consolidated Financial Statements
Further detailed information on plan assets and the defined benefit obligation is given below. Defined benefit plans: fair value of plan assets and reimbursement rights in millions of USD
2010 2009
Fair value of plan assets
Reimburse-ment rights Total
Fair value of plan assets
Reimburse-ment rights Total
At January 1 2,641 116 2,757 2,259 84 2,343 Expected return on plan assets 202 7 209 178 6 184 Actuarial gains (losses) 190 (8) 182 213 31 244 Employer contributions - (2) (2) 155 (5) 150 Employee contributions - - - - - - Benefits paid - funded plans (177) - (177) (164) - (164) Past service cost - - - - - - Curtailments - (2) (2) - - - Settlements - - - - - -
At December 31 2,856 111 2,967 2,641 116 2,757 Invested as 2010 2009 - Shares and other equity instruments 1,731 1,724 - Bonds, debentures and other debt instruments 781 688 - Property 225 229 - Other assets 230 116
Total 2,967 2,757 Defined benefit plans: defined benefit obligation in millions of USD
2010 2009
Pension
plans
Other post-
employ-ment
benefit plans Total
Pension plans
Other post-
employ-ment
benefit plans Total
At January 1 2,958 1,023 3,981 2,749 842 3,591Current service cost 76 19 95 82 16 98Interest cost 166 56 222 164 53 217Employee contributions - - - - - - Actuarial (gains) losses 228 (66) 162 128 159 287Benefits paid – funded plans (131) (46) (177) (121) (43) (164)Benefits paid – unfunded plans (16) (11) (27) (8) (10) (18)Past service cost 11 (5) 6 5 7 12Curtailments (72) (18) (90) (41) (1) (42)Settlements - - - - - -
At December 31 3,220 952 4,172 2,958 1,023 3,981 Of which - Funded plans 3,049 705 3,754 2,803 787 3,590- Unfunded plans 171 247 418 155 236 391
Actuarial assumptions Actuarial assumptions are unbiased and mutually compatible estimates of variables that determine the ultimate cost of providing post-employment benefits. They are set on an annual basis by local management and actuaries and are subject to approval by Roche Group corporate management and the Roche Group’s actuaries. Actuarial assumptions consist of demographic assumptions on matters such as mortality and employee turnover, and financial assumptions on matters such as salary and benefit levels, interest rates, return on investments and costs of medical benefits. The Roche Group operates defined benefit plans in many countries and the actuarial assumptions vary based upon local economic and social conditions. Demographic assumptions: The most significant demographic assumptions relate to mortality rates. The Roche Group’s actuaries use mortality tables which take into account historic patterns and expected changes, such as further increases in longevity. The mortality table used for the U.S. was RP2000 projected to 2017.

Annual Report 2010 – Roche Holdings, Inc. Consolidated Financial Statements 39
Rates of employee turnover, disability and early retirement are based on historical behavior within RHI Group companies. Financial assumptions: These are based on market expectations for the period over which the obligations are to be settled. The ranges of assumptions used in the actuarial valuations of the most significant plans are shown below. Defined benefit plans: financial actuarial assumptions 2010 2009
Weighted
average
RangeWeighted
average
Range Discount rates 5.40% 5.40% 5.79% 5.79% Expected rates of return on plan assets 7.93% 7.50%-8.00% 7.93% 7.50%-8.00% Expected rates of salary increases 6.20% 3.00%-6.50% 6.21% 4.50%-6.53% Immediate medical cost trend rate 8.00% 8.00% 8.20% 8.20% Ultimate medical cost trend rate (in 2029) 4.50% 4.50% 4.50% 4.50% Discount rates, which are used to calculate the discounted present value of the defined benefit obligation, are determined with reference to market yields on high-quality corporate bonds. The currency and term of the bonds are consistent with the obligation being discounted. The interest cost included in the income statement is calculated by multiplying the discount rate by the defined benefit obligation. Expected returns on plan assets are based on market expectations of expected returns on the assets in funded plans over the duration of the related obligation. This takes into account the split of the plan assets between equities, bonds, property and other investments. The calculation includes assumptions concerning expected dividend and interest income, realized and unrealized gains on plan assets and taxes and administration costs borne by the plan. These are based on long-term market expectations and the actual performance is continually monitored by Roche Group corporate management. Due to the long-term nature of the obligations, the assumptions used for matters such as returns on investments may not necessarily be consistent with recent historical patterns. The expected return on plan assets included in the income statement is calculated by multiplying the expected rate of return by the fair value of plan assets. The difference between the expected return and the actual return in any twelve-month period is an actuarial gain/loss and is recorded directly to equity. The actual return on plan assets was a gain of $392 million (2009 gain of $391 million). Expected rates of salary increases, which are used to calculate the defined benefit obligation and the current service cost included in the income statement, are based on the latest expectation and historical behavior within RHI Group companies. Medical cost trend rates are used to calculate the defined benefit obligation and the current service cost included in the income statement of post-employment medical plans. These take into account the benefits set out in the plan terms and expected future changes in medical costs. The effect of one percentage point increase or decrease in the medical cost trend rate is shown below. Defined benefit plans: sensitivity of medical cost trend rate in millions of USD 2010 2009 +1% -1% +1% -1% Current service cost and interest cost 9 (8) 7 (6) Defined benefit obligation 106 (88) 105 (88)
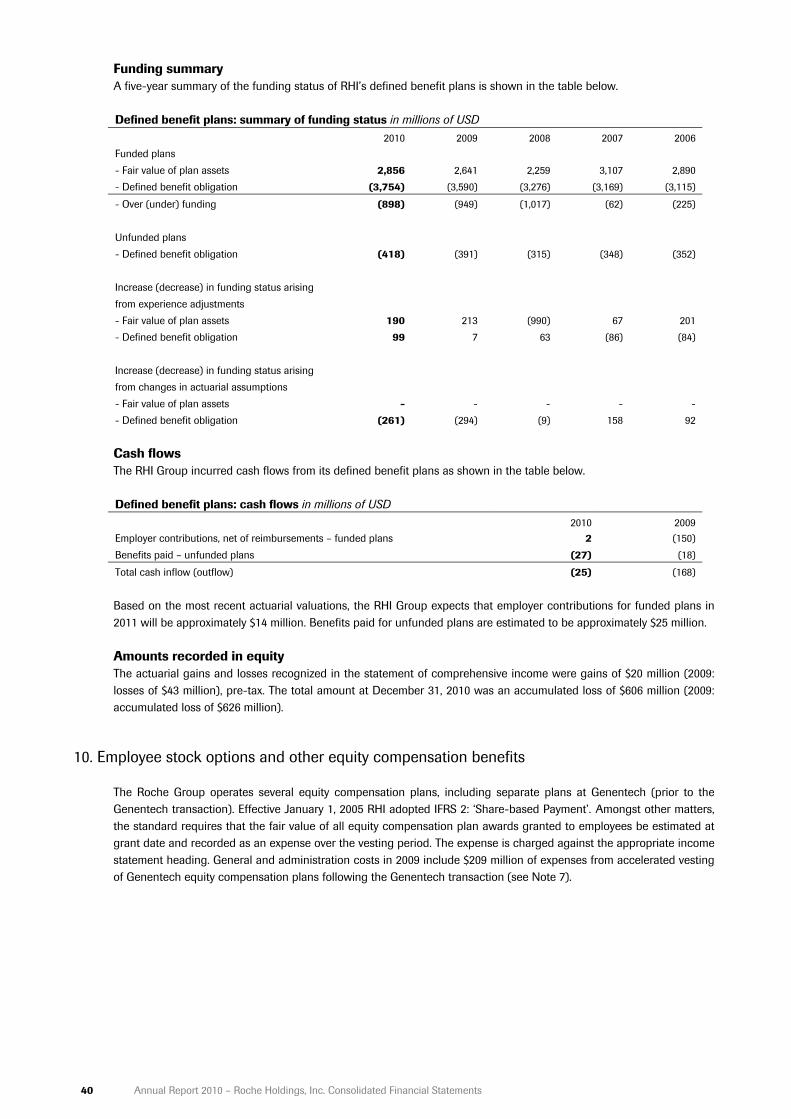
40 Annual Report 2010 – Roche Holdings, Inc. Consolidated Financial Statements
Funding summary A five-year summary of the funding status of RHI’s defined benefit plans is shown in the table below. Defined benefit plans: summary of funding status in millions of USD
2010 2009 2008 2007 2006 Funded plans - Fair value of plan assets 2,856 2,641 2,259 3,107 2,890 - Defined benefit obligation (3,754) (3,590) (3,276) (3,169) (3,115)
- Over (under) funding (898) (949) (1,017) (62) (225) Unfunded plans - Defined benefit obligation (418) (391) (315) (348) (352) Increase (decrease) in funding status arising from experience adjustments - Fair value of plan assets 190 213 (990) 67 201 - Defined benefit obligation 99 7 63 (86) (84) Increase (decrease) in funding status arising from changes in actuarial assumptions - Fair value of plan assets - - - - - - Defined benefit obligation (261) (294) (9) 158 92 Cash flows The RHI Group incurred cash flows from its defined benefit plans as shown in the table below. Defined benefit plans: cash flows in millions of USD
2010 2009 Employer contributions, net of reimbursements – funded plans 2 (150) Benefits paid – unfunded plans (27) (18)
Total cash inflow (outflow) (25) (168) Based on the most recent actuarial valuations, the RHI Group expects that employer contributions for funded plans in 2011 will be approximately $14 million. Benefits paid for unfunded plans are estimated to be approximately $25 million. Amounts recorded in equity The actuarial gains and losses recognized in the statement of comprehensive income were gains of $20 million (2009: losses of $43 million), pre-tax. The total amount at December 31, 2010 was an accumulated loss of $606 million (2009: accumulated loss of $626 million).
10. Employee stock options and other equity compensation benefits
The Roche Group operates several equity compensation plans, including separate plans at Genentech (prior to the Genentech transaction). Effective January 1, 2005 RHI adopted IFRS 2: ‘Share-based Payment’. Amongst other matters, the standard requires that the fair value of all equity compensation plan awards granted to employees be estimated at grant date and recorded as an expense over the vesting period. The expense is charged against the appropriate income statement heading. General and administration costs in 2009 include $209 million of expenses from accelerated vesting of Genentech equity compensation plans following the Genentech transaction (see Note 7).
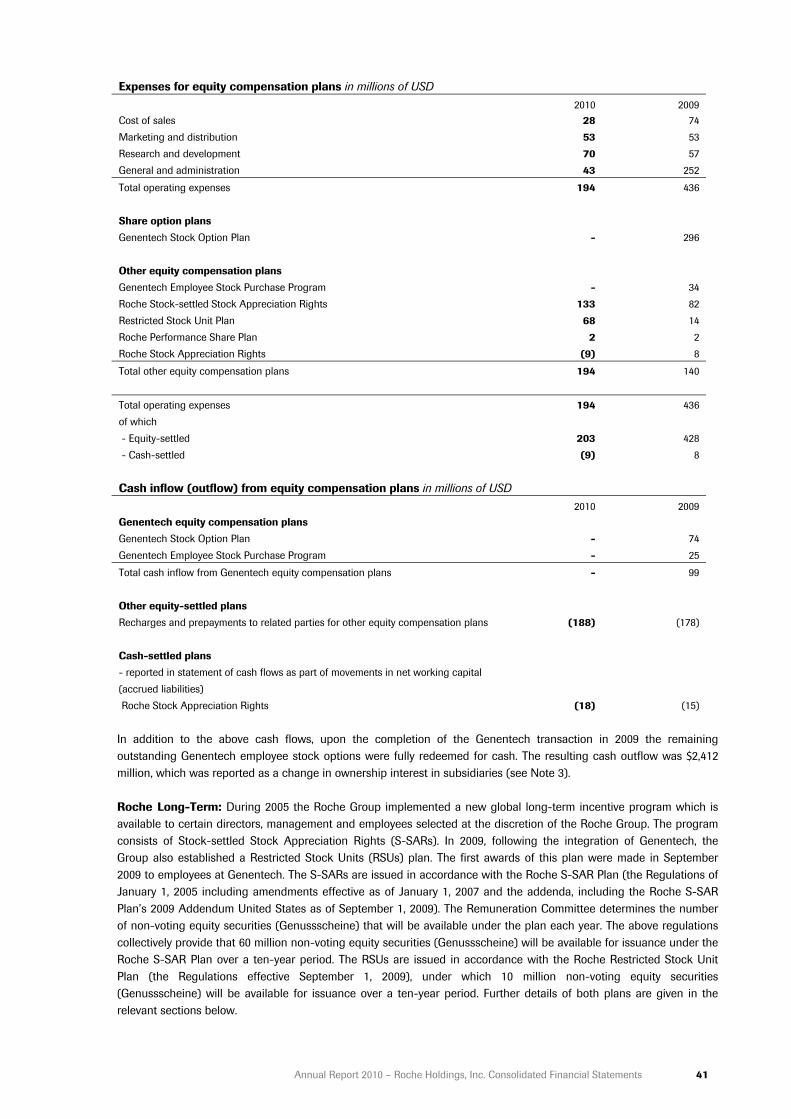
Annual Report 2010 – Roche Holdings, Inc. Consolidated Financial Statements 41
Expenses for equity compensation plans in millions of USD
2010 2009 Cost of sales 28 74 Marketing and distribution 53 53 Research and development 70 57 General and administration 43 252
Total operating expenses 194 436 Share option plans Genentech Stock Option Plan - 296 Other equity compensation plans Genentech Employee Stock Purchase Program - 34 Roche Stock-settled Stock Appreciation Rights 133 82 Restricted Stock Unit Plan 68 14 Roche Performance Share Plan 2 2 Roche Stock Appreciation Rights (9) 8
Total other equity compensation plans 194 140
Total operating expenses 194 436 of which - Equity-settled 203 428 - Cash-settled (9) 8 Cash inflow (outflow) from equity compensation plans in millions of USD
2010 2009 Genentech equity compensation plans Genentech Stock Option Plan - 74 Genentech Employee Stock Purchase Program - 25
Total cash inflow from Genentech equity compensation plans - 99 Other equity-settled plans Recharges and prepayments to related parties for other equity compensation plans (188) (178) Cash-settled plans - reported in statement of cash flows as part of movements in net working capital (accrued liabilities) Roche Stock Appreciation Rights (18) (15) In addition to the above cash flows, upon the completion of the Genentech transaction in 2009 the remaining outstanding Genentech employee stock options were fully redeemed for cash. The resulting cash outflow was $2,412 million, which was reported as a change in ownership interest in subsidiaries (see Note 3). Roche Long-Term: During 2005 the Roche Group implemented a new global long-term incentive program which is available to certain directors, management and employees selected at the discretion of the Roche Group. The program consists of Stock-settled Stock Appreciation Rights (S-SARs). In 2009, following the integration of Genentech, the Group also established a Restricted Stock Units (RSUs) plan. The first awards of this plan were made in September 2009 to employees at Genentech. The S-SARs are issued in accordance with the Roche S-SAR Plan (the Regulations of January 1, 2005 including amendments effective as of January 1, 2007 and the addenda, including the Roche S-SAR Plan’s 2009 Addendum United States as of September 1, 2009). The Remuneration Committee determines the number of non-voting equity securities (Genussscheine) that will be available under the plan each year. The above regulations collectively provide that 60 million non-voting equity securities (Genussscheine) will be available for issuance under the Roche S-SAR Plan over a ten-year period. The RSUs are issued in accordance with the Roche Restricted Stock Unit Plan (the Regulations effective September 1, 2009), under which 10 million non-voting equity securities (Genussscheine) will be available for issuance over a ten-year period. Further details of both plans are given in the relevant sections below.

42 Annual Report 2010 – Roche Holdings, Inc. Consolidated Financial Statements
Share option plans Genentech Stock Option Plan: The Genentech Stock Option Plan was adopted in 1999 and amended thereafter. In April 2004 Genentech’s shareholders approved an equity incentive plan. The plans allowed for the granting of various stock options, incentive stock options and stock purchase rights to employees, directors and consultants of Genentech. No incentive stock options and stock purchase rights have been granted under this plan to date. The options granted, were non-tradable equity-settled awards, had a duration of 10 years and vested on a phased basis over four years, subject to continued employment. Upon the completion of the Genentech transaction (see Note 3) the remaining outstanding options were fully redeemed for cash. For accounting purposes the remaining fair value of $192 million was expensed for the options that were not fully vested at that time. Genentech Stock Option Plan - movement in number of options outstanding 2009
Number of options
(millions)
Weighted average exercise
price (USD) Outstanding at January 1 77 63.06 Granted - - Forfeited - - Exercised (1) 52.66 Expired - - Genentech transaction 3 (76) 63.14
Outstanding at December 31 - - - of which exercisable - - Other equity compensation plans Genentech Employee Stock Purchase Program (ESPP): Genentech had an employee stock purchase program that allowed employees to purchase Genentech’s common stock at 85% of the lower of market value at the grant date or purchase date. In 2009 a total of 0.4 million shares of Genentech common stock were purchased resulting in a cash inflow of $25 million and the cost of the plan was $34 million, which was reported within the relevant expenditure line by function. Upon the completion of the Genentech transaction (see Note 3) the remaining outstanding awards were fully redeemed for cash. For accounting purposes the remaining fair value of $17 million was expensed for the awards that were not fully vested at that time. Roche Stock-settled Stock Appreciation Rights: With the introduction of Roche Long-Term in 2005, the Roche Group offers Stock-settled Stock Appreciation Rights (S-SARs) to certain directors, management and employees selected at the discretion of the Roche Group. The S-SARs give employees the right to receive non-voting equity securities (Genussscheine) reflecting the value of any appreciation in the market price of the non-voting equity securities between the grant date and the exercise date. The rights, which are non-tradable equity-settled awards, have a seven-year duration and vest on a phased basis over three years, subject to continued employment.
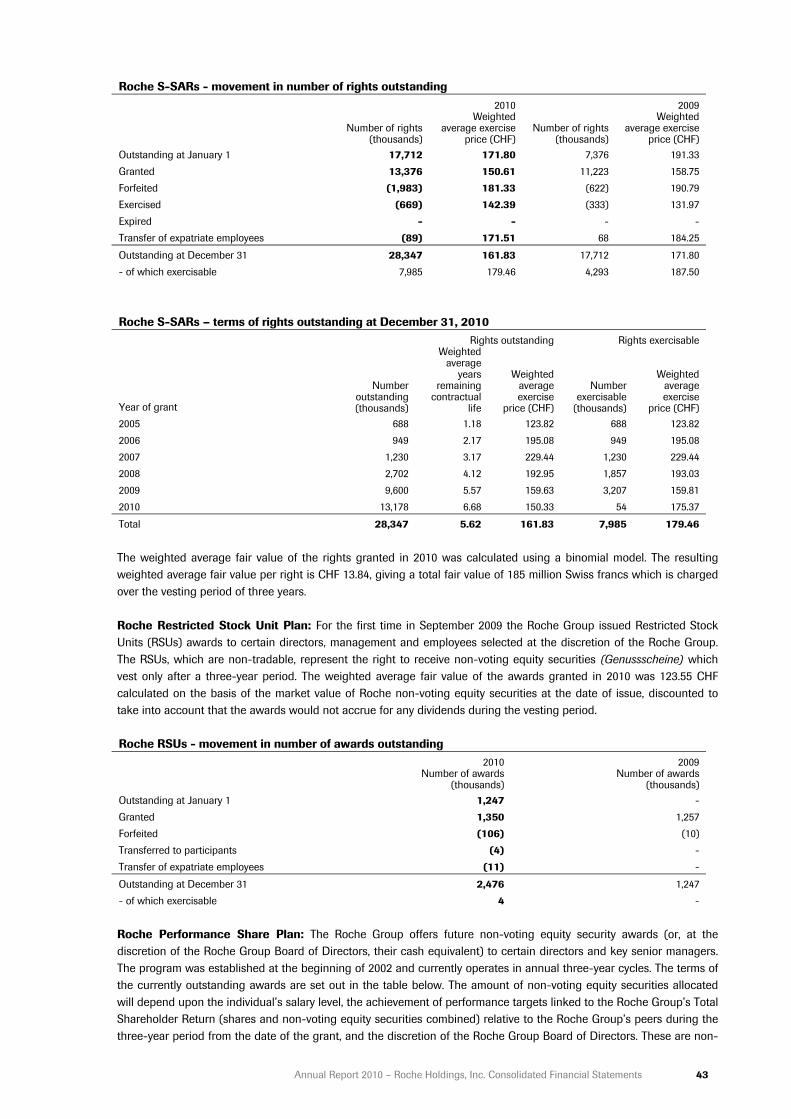
Annual Report 2010 – Roche Holdings, Inc. Consolidated Financial Statements 43
Roche S-SARs - movement in number of rights outstanding 2010 2009
Number of rights
(thousands)
Weighted average exercise
price (CHF)Number of rights
(thousands)
Weighted average exercise
price (CHF) Outstanding at January 1 17,712 171.80 7,376 191.33 Granted 13,376 150.61 11,223 158.75 Forfeited (1,983) 181.33 (622) 190.79 Exercised (669) 142.39 (333) 131.97 Expired - - - - Transfer of expatriate employees (89) 171.51 68 184.25
Outstanding at December 31 28,347 161.83 17,712 171.80 - of which exercisable 7,985 179.46 4,293 187.50 Roche S-SARs – terms of rights outstanding at December 31, 2010
Rights outstanding Rights exercisable
Year of grant
Number outstanding (thousands)
Weighted average
years remaining
contractual life
Weighted average exercise
price (CHF)
Number exercisable
(thousands)
Weighted average exercise
price (CHF) 2005 688 1.18 123.82 688 123.82 2006 949 2.17 195.08 949 195.08 2007 1,230 3.17 229.44 1,230 229.44 2008 2,702 4.12 192.95 1,857 193.03 2009 9,600 5.57 159.63 3,207 159.81 2010 13,178 6.68 150.33 54 175.37
Total 28,347 5.62 161.83 7,985 179.46 The weighted average fair value of the rights granted in 2010 was calculated using a binomial model. The resulting weighted average fair value per right is CHF 13.84, giving a total fair value of 185 million Swiss francs which is charged over the vesting period of three years. Roche Restricted Stock Unit Plan: For the first time in September 2009 the Roche Group issued Restricted Stock Units (RSUs) awards to certain directors, management and employees selected at the discretion of the Roche Group. The RSUs, which are non-tradable, represent the right to receive non-voting equity securities (Genussscheine) which vest only after a three-year period. The weighted average fair value of the awards granted in 2010 was 123.55 CHF calculated on the basis of the market value of Roche non-voting equity securities at the date of issue, discounted to take into account that the awards would not accrue for any dividends during the vesting period. Roche RSUs - movement in number of awards outstanding
2010 2009
Number of awards
(thousands) Number of awards
(thousands)Outstanding at January 1 1,247 - Granted 1,350 1,257Forfeited (106) (10)Transferred to participants (4) - Transfer of expatriate employees (11) -
Outstanding at December 31 2,476 1,247- of which exercisable 4 - Roche Performance Share Plan: The Roche Group offers future non-voting equity security awards (or, at the discretion of the Roche Group Board of Directors, their cash equivalent) to certain directors and key senior managers. The program was established at the beginning of 2002 and currently operates in annual three-year cycles. The terms of the currently outstanding awards are set out in the table below. The amount of non-voting equity securities allocated will depend upon the individual’s salary level, the achievement of performance targets linked to the Roche Group’s Total Shareholder Return (shares and non-voting equity securities combined) relative to the Roche Group’s peers during the three-year period from the date of the grant, and the discretion of the Roche Group Board of Directors. These are non-

44 Annual Report 2010 – Roche Holdings, Inc. Consolidated Financial Statements
tradable equity-settled awards. Each award will result in between zero and two non-voting equity securities, depending upon the achievement of the performance targets. Roche Performance Share Plan – terms of outstanding awards at December 31, 2010
2008-2010 2009-2011 2010-2012 Number of awards (thousands) 10 15 20 Vesting period 3 years 3 years 3 years Allocated to recipients in Feb. 2011 Feb. 2012 Feb. 2013 Fair value per unit (CHF) 201.22 156.06 173.39 The weighted average fair value of the 21,819 awards granted in 2010 was calculated using a Monte Carlo simulation. The input parameters to the model were the covariance matrix between Roche and the other individual companies of the peer group based on a three-year history and a risk-free rate of 0.59%. The valuation also takes into account the defined rank and performance structure which determines the payout of the plan. Roche Stock Appreciation Rights: Some employees of the RHI Group receive Stock Appreciation Rights (SARs) as part of their compensation. The SARs, which are non-tradable cash-settled awards, may be exercised after a vesting period of between one and three years for a cash payment, based upon the amount by which the market price of the Roche Group’s American Depositary Receipts (ADRs) at the point of exercise exceeds the strike price (grant price at issuance). Following the implementation of Roche Long-Term (see above), the Roche Group does not plan to award any further cash-settled SARs and no awards have been made since 2004. Roche Stock Appreciation Rights in millions of USD
2010 2009 Liability at December 31 5 32 Intrinsic value of vested rights at December 31 5 32 Roche Stock Appreciation Rights - terms of rights outstanding at December 31, 2010
Rights outstanding and exercisable
Year of grant
Number outstanding and exercisable
(thousands)
Expiry
Weighted average exercise
price (USD) 2004 514 Feb. 03, 2011 26.04
Total 514 26.04 The fair value at December 31, 2010 was calculated using a binomial model. The inputs to the model were the ADR price at December 31, 2010 ($36.65), the exercise prices given in the above table, and other inputs consistent with those used for the Roche S-SAR awards 2010 given in the table below.

Annual Report 2010 – Roche Holdings, Inc. Consolidated Financial Statements 45
Issues of rights in 2010: Issues of rights in 2010, including the methodology used to calculate fair value and the main inputs to the valuation models, are described below. Issues of equity compensation plans in 2010
Roche S-SAR Number of rights granted 13,376 thousand Underlying equity Roche non-voting equity securities Currency Swiss francs Vesting period Progressively over 3 years Contractual life 7 years Weighted average fair value of rights issued 13.84 Option pricing model used Binomial Inputs to option pricing model - Share price at grant date 150.61 - Exercise price 150.61 - Expected volatility 24.01% - Expected dividend yield 7.51% - Early exercise factor 1.214 - Expected exit rate 7.63% Volatility for Roche S-SAR was determined primarily by reference to historically observed prices of the underlying equity. Risk-free interest rates are derived from zero coupon swap rates at the grant date taken from Datastream. The early exercise factor describes the ratio between the expected market price at the exercise date and the exercise price at which early exercises can be expected, based on historically observed behavior.
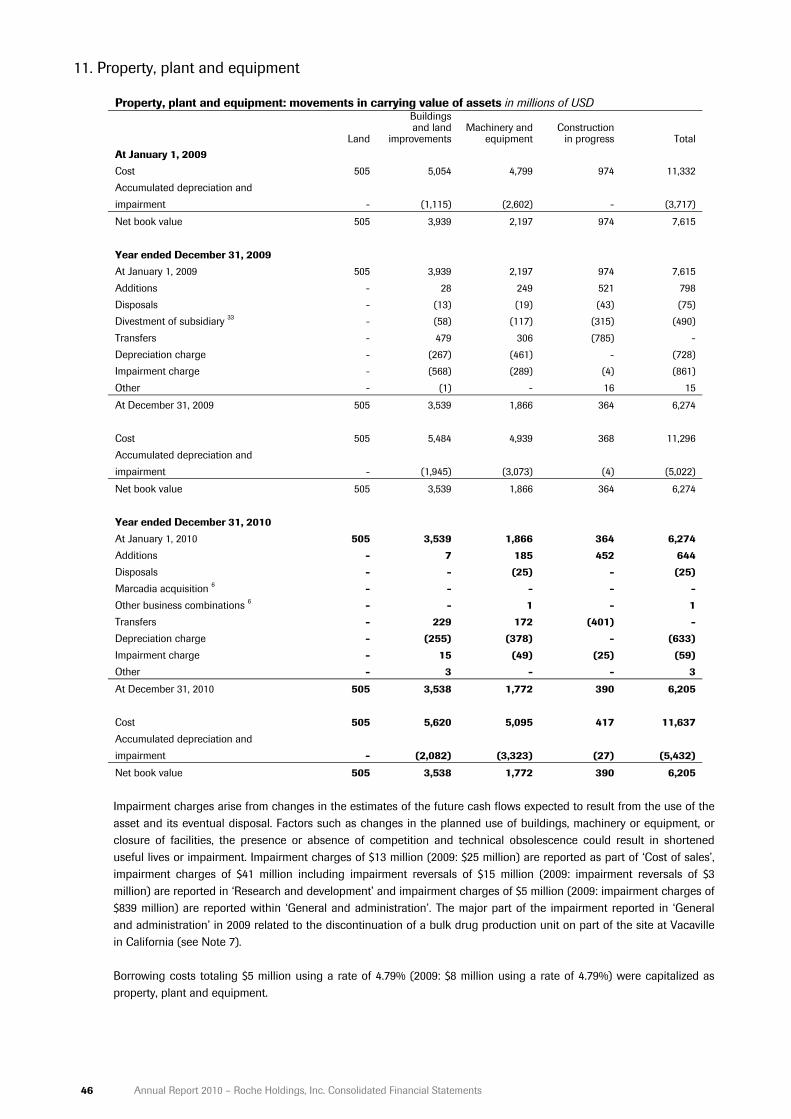
46 Annual Report 2010 – Roche Holdings, Inc. Consolidated Financial Statements
11. Property, plant and equipment
Property, plant and equipment: movements in carrying value of assets in millions of USD
Land
Buildings and land
improvements Machinery and
equipment
Construction
in progress
Total At January 1, 2009 Cost 505 5,054 4,799 974 11,332 Accumulated depreciation and impairment - (1,115) (2,602) - (3,717)
Net book value 505 3,939 2,197 974 7,615 Year ended December 31, 2009 At January 1, 2009 505 3,939 2,197 974 7,615 Additions - 28 249 521 798 Disposals - (13) (19) (43) (75) Divestment of subsidiary 33 - (58) (117) (315) (490) Transfers - 479 306 (785) - Depreciation charge - (267) (461) - (728) Impairment charge - (568) (289) (4) (861) Other - (1) - 16 15
At December 31, 2009 505 3,539 1,866 364 6,274 Cost 505 5,484 4,939 368 11,296 Accumulated depreciation and impairment - (1,945) (3,073) (4) (5,022)
Net book value 505 3,539 1,866 364 6,274 Year ended December 31, 2010 At January 1, 2010 505 3,539 1,866 364 6,274 Additions - 7 185 452 644 Disposals - - (25) - (25)Marcadia acquisition 6 - - - - -Other business combinations 6 - - 1 - 1Transfers - 229 172 (401) -Depreciation charge - (255) (378) - (633)Impairment charge - 15 (49) (25) (59)Other - 3 - - 3
At December 31, 2010 505 3,538 1,772 390 6,205 Cost 505 5,620 5,095 417 11,637 Accumulated depreciation and impairment - (2,082) (3,323) (27) (5,432)
Net book value 505 3,538 1,772 390 6,205 Impairment charges arise from changes in the estimates of the future cash flows expected to result from the use of the asset and its eventual disposal. Factors such as changes in the planned use of buildings, machinery or equipment, or closure of facilities, the presence or absence of competition and technical obsolescence could result in shortened useful lives or impairment. Impairment charges of $13 million (2009: $25 million) are reported as part of ‘Cost of sales’, impairment charges of $41 million including impairment reversals of $15 million (2009: impairment reversals of $3 million) are reported in ‘Research and development’ and impairment charges of $5 million (2009: impairment charges of $839 million) are reported within ‘General and administration’. The major part of the impairment reported in ‘General and administration’ in 2009 related to the discontinuation of a bulk drug production unit on part of the site at Vacaville in California (see Note 7). Borrowing costs totaling $5 million using a rate of 4.79% (2009: $8 million using a rate of 4.79%) were capitalized as property, plant and equipment.
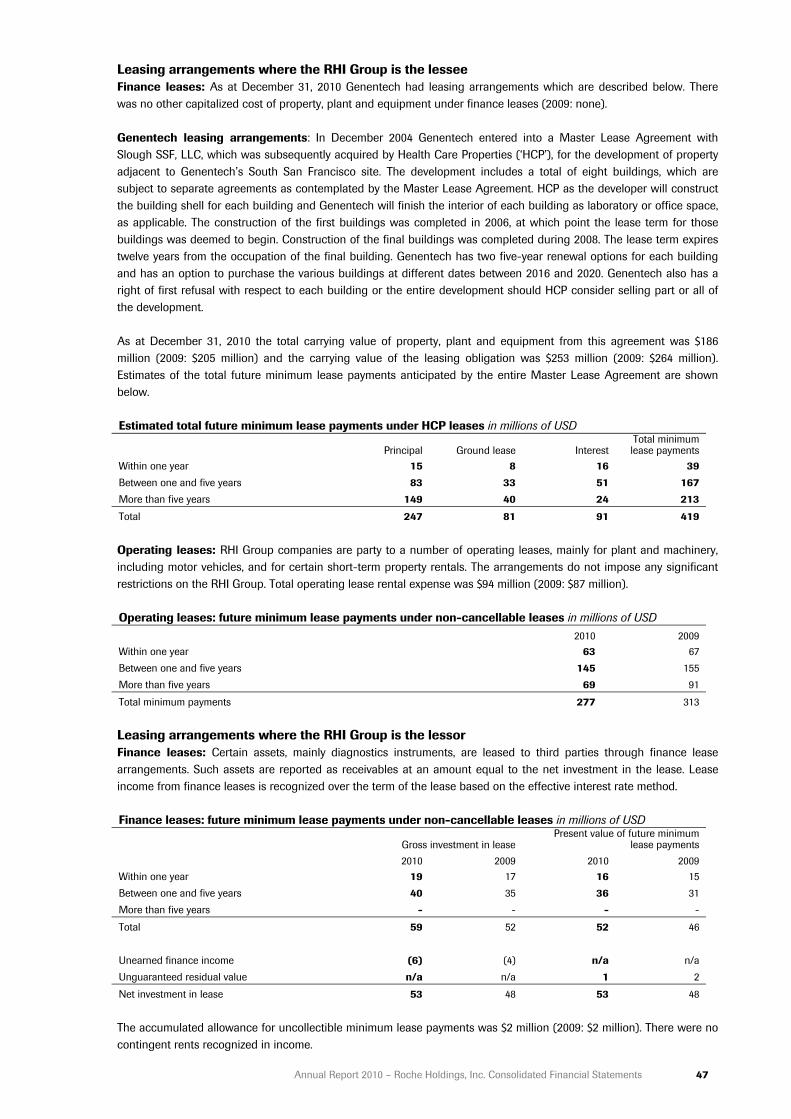
Annual Report 2010 – Roche Holdings, Inc. Consolidated Financial Statements 47
Leasing arrangements where the RHI Group is the lessee Finance leases: As at December 31, 2010 Genentech had leasing arrangements which are described below. There was no other capitalized cost of property, plant and equipment under finance leases (2009: none). Genentech leasing arrangements: In December 2004 Genentech entered into a Master Lease Agreement with Slough SSF, LLC, which was subsequently acquired by Health Care Properties (‘HCP’), for the development of property adjacent to Genentech’s South San Francisco site. The development includes a total of eight buildings, which are subject to separate agreements as contemplated by the Master Lease Agreement. HCP as the developer will construct the building shell for each building and Genentech will finish the interior of each building as laboratory or office space, as applicable. The construction of the first buildings was completed in 2006, at which point the lease term for those buildings was deemed to begin. Construction of the final buildings was completed during 2008. The lease term expires twelve years from the occupation of the final building. Genentech has two five-year renewal options for each building and has an option to purchase the various buildings at different dates between 2016 and 2020. Genentech also has a right of first refusal with respect to each building or the entire development should HCP consider selling part or all of the development. As at December 31, 2010 the total carrying value of property, plant and equipment from this agreement was $186 million (2009: $205 million) and the carrying value of the leasing obligation was $253 million (2009: $264 million). Estimates of the total future minimum lease payments anticipated by the entire Master Lease Agreement are shown below. Estimated total future minimum lease payments under HCP leases in millions of USD
Principal Ground lease
Interest Total minimum lease payments
Within one year 15 8 16 39 Between one and five years 83 33 51 167 More than five years 149 40 24 213
Total 247 81 91 419 Operating leases: RHI Group companies are party to a number of operating leases, mainly for plant and machinery, including motor vehicles, and for certain short-term property rentals. The arrangements do not impose any significant restrictions on the RHI Group. Total operating lease rental expense was $94 million (2009: $87 million). Operating leases: future minimum lease payments under non-cancellable leases in millions of USD
2010 2009 Within one year 63 67 Between one and five years 145 155 More than five years 69 91
Total minimum payments 277 313 Leasing arrangements where the RHI Group is the lessor Finance leases: Certain assets, mainly diagnostics instruments, are leased to third parties through finance lease arrangements. Such assets are reported as receivables at an amount equal to the net investment in the lease. Lease income from finance leases is recognized over the term of the lease based on the effective interest rate method. Finance leases: future minimum lease payments under non-cancellable leases in millions of USD
Gross investment in lease Present value of future minimum
lease payments 2010 2009 2010 2009
Within one year 19 17 16 15 Between one and five years 40 35 36 31 More than five years - - - -
Total 59 52 52 46 Unearned finance income (6) (4) n/a n/a Unguaranteed residual value n/a n/a 1 2
Net investment in lease 53 48 53 48 The accumulated allowance for uncollectible minimum lease payments was $2 million (2009: $2 million). There were no contingent rents recognized in income.

48 Annual Report 2010 – Roche Holdings, Inc. Consolidated Financial Statements
Operating leases: Certain assets, mainly some diagnostics instruments, are leased to third parties through operating lease arrangements. Such assets are reported within property, plant and equipment. Lease income from operating leases is recognized over the lease term on a straight-line basis. Operating leases: future minimum lease payments under non-cancellable leases in millions of USD
2010 2009 Within one year 74 68 Between one and five years 148 147 More than five years - 2
Total minimum payments 222 217 At December 31, 2010, machinery and equipment with an original cost of $357 million (2009: $300 million) and a net book value of $181 million (2009: $171 million) was being leased to third parties. There was no contingent rent recognized as income. Capital commitments The RHI Group has non-cancellable capital commitments for the purchase or construction of property, plant and equipment totaling $113 million (2009: $140 million).
12. Goodwill
Goodwill: movements in carrying value of assets in millions of USD 2010 2009
At January 1 5,537 4,096 Memory acquisition 6 - 10 Marcadia acquisition 6 152 - Other business combinations 6 41 - IGEN capital contribution 27 - 1,431 Impairment charge - -
At December 31 5,730 5,537 Allocated to the following cash-generating units - Pharmaceuticals 1,932 1,780
Total Pharmaceuticals Division 1,932 1,780 Diagnostics Division - Diabetes Care 2 2 - Professional Diagnostics 1,465 1,465 - Molecular Diagnostics - - - Applied Science 233 233 - Tissue Diagnostics 796 755 - Strategic goodwill (held at divisional level and not allocated to business areas) 1,302 1,302
Total Diagnostics Division 3,798 3,757
There are no accumulated impairment losses in goodwill. Goodwill impairment testing Pharmaceuticals Division: For the Pharmaceuticals Division, the recoverable amount used in the impairment testing is based on value in use. The cash flow projections used are based on the most recent business plans approved by management. These assume no significant changes in the organization of the division and include management’s latest estimates on sales volume and pricing, and production and other operating costs. These reflect past experience and are projected over five years. The cash flow projections used do not extend beyond management’s most recent business plans. The discount rate used is based on a rate of 7.31%, which is derived from a capital asset pricing model using data from Swiss capital markets, including Swiss Federal Government twenty-year bonds and the Swiss Market Index. Cost of debt is calculated based on the weighted average effective interest rate of the bonds and notes issued. A weighted average tax rate of 24.98% is used in the calculations. Management believes that any reasonably possible change in any of the key assumptions would not cause the carrying value of goodwill to exceed the recoverable amount.
Annual Report 2010 – Roche Holdings, Inc. Consolidated Financial Statements 49
Diagnostics Division: The division’s business areas are the cash-generating units used for the testing of goodwill. The goodwill arising from the Corange/Boehringer Mannheim acquisition and part of the goodwill from the Ventana acquisition is recorded and monitored at a divisional level as it relates to the strategic development of the whole division and cannot be meaningfully allocated to the division’s business areas. Therefore the cash-generating unit for this goodwill is the entire division. The recoverable amount used in the impairment testing is based on value in use. The cash flow projections used are based on the most recent business plans approved by management. These assume no significant changes in the organization of the division and include management’s latest estimates on sales volume and pricing, and production and other operating costs. These reflect past experience and are projected over five years. The estimates for the Tissue Diagnostics business area are projected over ten years, which management believes reflects the long-term nature of this business. The cash flow projections used do not extend beyond management’s most recent business plans. The discount rate used is based on a rate of 7.31%, which is derived from a capital asset pricing model using data from Swiss capital markets, including Swiss Federal Government twenty-year bonds and the Swiss Market Index. Cost of debt is calculated based on the weighted average effective interest rate of the bonds and notes issued. A weighted average tax rate of 19.71% is used in the calculations. Management believes that any reasonably possible change in any of the key assumptions would not cause the carrying value of goodwill to exceed the recoverable amount.
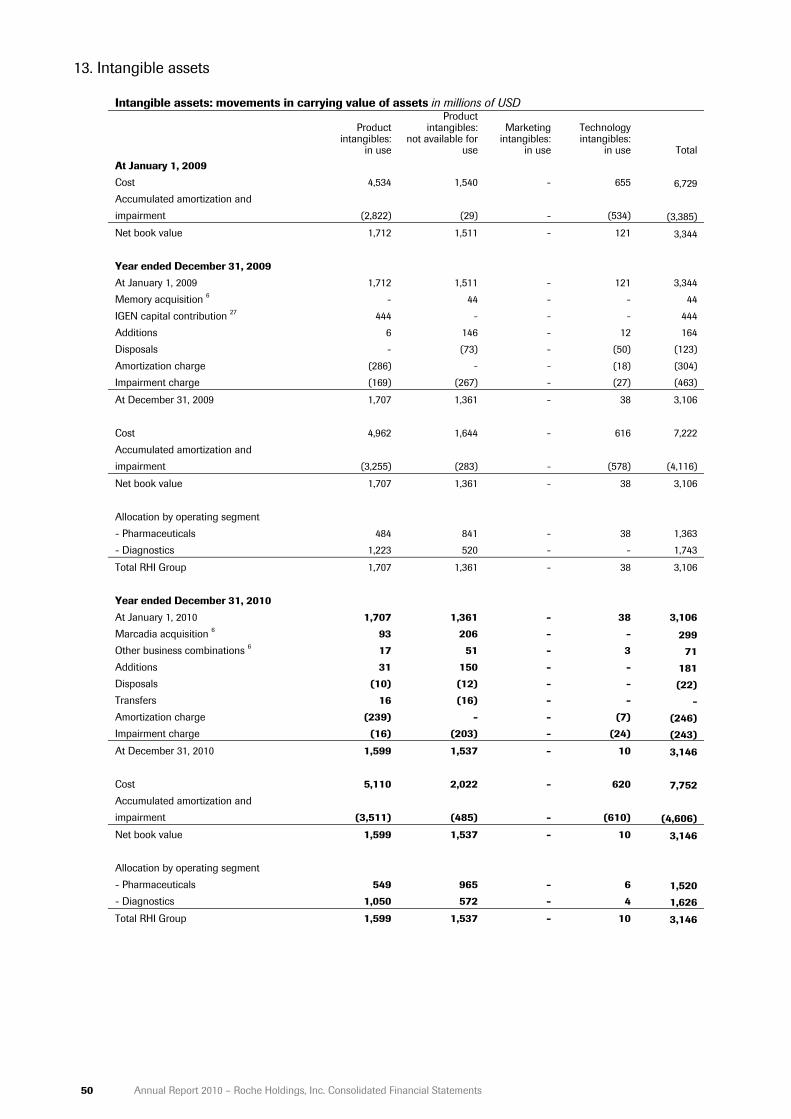
50 Annual Report 2010 – Roche Holdings, Inc. Consolidated Financial Statements
13. Intangible assets
Intangible assets: movements in carrying value of assets in millions of USD
Product intangibles:
in use
Product intangibles:
not available for use
Marketing intangibles:
in use
Technology intangibles:
in use Total At January 1, 2009 Cost 4,534 1,540 - 655 6,729 Accumulated amortization and impairment (2,822) (29) - (534) (3,385) Net book value 1,712 1,511 - 121 3,344 Year ended December 31, 2009 At January 1, 2009 1,712 1,511 - 121 3,344 Memory acquisition 6 - 44 - - 44 IGEN capital contribution 27 444 - - - 444 Additions 6 146 - 12 164 Disposals - (73) - (50) (123) Amortization charge (286) - - (18) (304) Impairment charge (169) (267) - (27) (463)
At December 31, 2009 1,707 1,361 - 38 3,106 Cost 4,962 1,644 - 616 7,222 Accumulated amortization and impairment (3,255) (283) - (578) (4,116)
Net book value 1,707 1,361 - 38 3,106 Allocation by operating segment - Pharmaceuticals 484 841 - 38 1,363 - Diagnostics 1,223 520 - - 1,743
Total RHI Group 1,707 1,361 - 38 3,106 Year ended December 31, 2010 At January 1, 2010 1,707 1,361 - 38 3,106 Marcadia acquisition 6 93 206 - - 299 Other business combinations 6 17 51 - 3 71 Additions 31 150 - - 181 Disposals (10) (12) - - (22)Transfers 16 (16) - - -Amortization charge (239) - - (7) (246)Impairment charge (16) (203) - (24) (243)At December 31, 2010 1,599 1,537 - 10 3,146 Cost 5,110 2,022 - 620 7,752 Accumulated amortization and impairment (3,511) (485) - (610) (4,606)Net book value 1,599 1,537 - 10 3,146 Allocation by operating segment - Pharmaceuticals 549 965 - 6 1,520 - Diagnostics 1,050 572 - 4 1,626 Total RHI Group 1,599 1,537 - 10 3,146

Annual Report 2010 – Roche Holdings, Inc. Consolidated Financial Statements 51
Significant intangible assets as at December 31, 2010 in millions of USD
Operating segment
Net book value
Remaining amortization
period Product intangibles in use Tanox acquisition Pharmaceuticals 376 9 years Ventana acquisition Diagnostics 525 7 years IGEN capital contribution 27 Diagnostics 272 6 years Product intangibles not available for use Ventana acquisition Diagnostics 516 n/a Classification of amortization and impairment expenses in millions of USD
2010 2009 Amortization Impairment Amortization Impairment
Cost of sales - Pharmaceuticals 62 - 105 - - Diagnostics 177 16 179 15 Marketing and distribution - Diagnostics - - - - Research and development - Pharmaceuticals 7 227 18 213 - Diagnostics - - 2 21 General and administration - Pharmaceuticals - - - 214
Total 246 243 304 463 Internally generated intangible assets The RHI Group currently has no internally generated intangible assets from development as the criteria for the recognition as an asset are not met. Intangible assets with indefinite useful lives The RHI Group currently has no intangible assets with indefinite useful lives. Impairment of intangible assets Impairment charges arise from changes in the estimates of the future cash flows expected to result from the use of the asset and its eventual disposal. Factors such as the presence or absence of competition, technical obsolescence or lower than anticipated sales for products with capitalized rights could result in shortened useful lives or impairment. 2010: In 2010 the Pharmaceuticals operating segment recorded an impairment charge of $227 million and the Diagnostics operating segment recorded an impairment charge of $16 million. Of the amount recorded in the Pharmaceuticals operating segment, an impairment charge of $129 million was recorded as part of the Operational Excellence program (see Note 7). As part of the program the division carried out a comprehensive portfolio review and decided to discontinue certain activities in research and early development. In addition certain product development activities are being discontinued or transferred to other Roche sites or to third parties. As a result of these decisions intangible assets with a carrying value of $129 million were fully written down. Apart from the Operational Excellence program, an impairment charge of $95 million was also recorded in the Pharmaceuticals Division with respect of product intangibles not available for use and follows from recent clinical data and portfolio prioritization decisions relating to certain projects either with alliance partners or acquired in business combinations. The assets concerned, which were not yet being amortized, were fully written down by these charges. A further charge of $18 million was recorded, resulting from a portfolio prioritization decision on a project acquired as part of a previous business combination. The asset concerned, which was not yet being amortized, was written down to its recoverable value of $36 million, based on a value in use calculation using a discount rate of 7.31%. A reversal of previously recorded impairment loss of $15 million was recorded, which follows from the latest clinical data assessment of the project concerned.
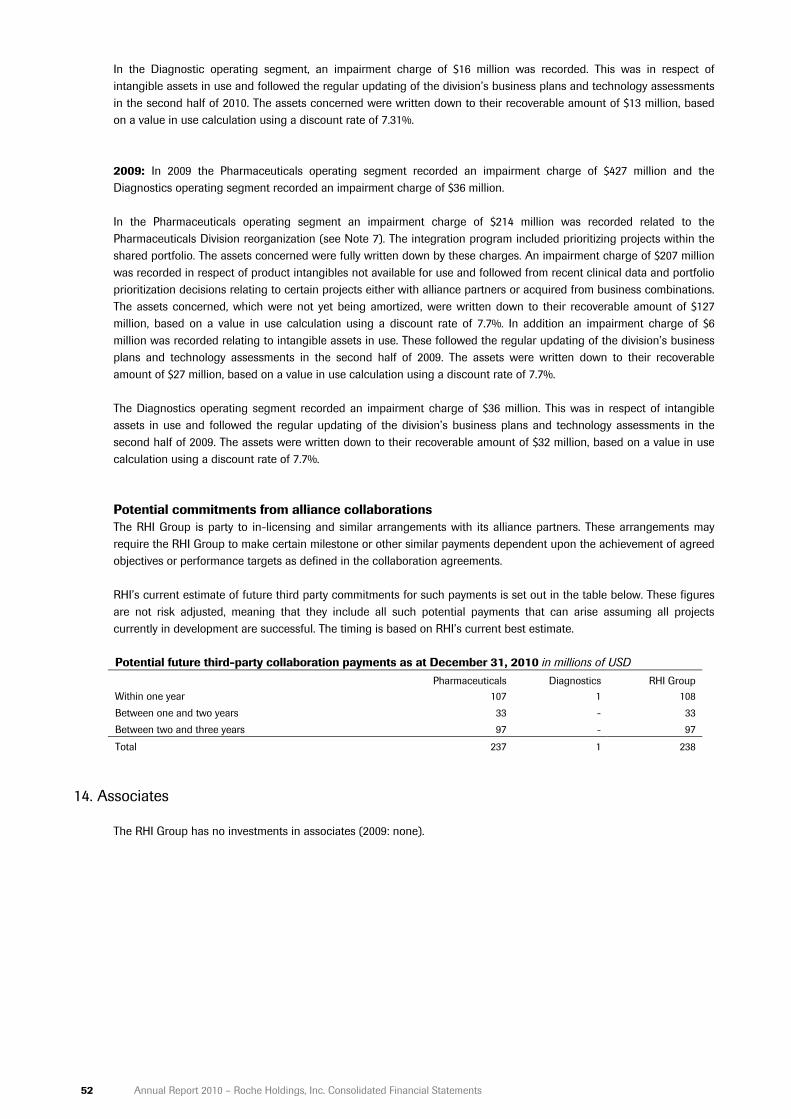
52 Annual Report 2010 – Roche Holdings, Inc. Consolidated Financial Statements
In the Diagnostic operating segment, an impairment charge of $16 million was recorded. This was in respect of intangible assets in use and followed the regular updating of the division’s business plans and technology assessments in the second half of 2010. The assets concerned were written down to their recoverable amount of $13 million, based on a value in use calculation using a discount rate of 7.31%. 2009: In 2009 the Pharmaceuticals operating segment recorded an impairment charge of $427 million and the Diagnostics operating segment recorded an impairment charge of $36 million. In the Pharmaceuticals operating segment an impairment charge of $214 million was recorded related to the Pharmaceuticals Division reorganization (see Note 7). The integration program included prioritizing projects within the shared portfolio. The assets concerned were fully written down by these charges. An impairment charge of $207 million was recorded in respect of product intangibles not available for use and followed from recent clinical data and portfolio prioritization decisions relating to certain projects either with alliance partners or acquired from business combinations. The assets concerned, which were not yet being amortized, were written down to their recoverable amount of $127 million, based on a value in use calculation using a discount rate of 7.7%. In addition an impairment charge of $6 million was recorded relating to intangible assets in use. These followed the regular updating of the division’s business plans and technology assessments in the second half of 2009. The assets were written down to their recoverable amount of $27 million, based on a value in use calculation using a discount rate of 7.7%. The Diagnostics operating segment recorded an impairment charge of $36 million. This was in respect of intangible assets in use and followed the regular updating of the division’s business plans and technology assessments in the second half of 2009. The assets were written down to their recoverable amount of $32 million, based on a value in use calculation using a discount rate of 7.7%. Potential commitments from alliance collaborations The RHI Group is party to in-licensing and similar arrangements with its alliance partners. These arrangements may require the RHI Group to make certain milestone or other similar payments dependent upon the achievement of agreed objectives or performance targets as defined in the collaboration agreements. RHI’s current estimate of future third party commitments for such payments is set out in the table below. These figures are not risk adjusted, meaning that they include all such potential payments that can arise assuming all projects currently in development are successful. The timing is based on RHI’s current best estimate. Potential future third-party collaboration payments as at December 31, 2010 in millions of USD
Pharmaceuticals Diagnostics RHI Group Within one year 107 1 108 Between one and two years 33 - 33 Between two and three years 97 - 97
Total 237 1 238
14. Associates
The RHI Group has no investments in associates (2009: none).

Annual Report 2010 – Roche Holdings, Inc. Consolidated Financial Statements 53
15. Financial and other long-term assets
Financial and other long-term assets in millions of USD 2010 2009 2008
Available-for-sale investments 65 92 331 Held-to-maturity investments - 4 15 Loans receivable - - 3 Long-term trade receivables 1 2 1 Restricted cash 9 - - Other 37 32 21
Total financial long-term assets 112 130 371 Long-term employee benefits 236 214 212 Other 92 103 110
Total other long-term assets 328 317 322 Financial long-term assets are held for strategic purposes and are classified as non-current. The available-for-sale investments are mainly equity investments. These are primarily investments in private biotechnology companies, which are kept as part of RHI’s strategic alliance efforts. Some unquoted equity investments classified as available-for-sale are measured at cost, as their fair value cannot be measured reliably. The carrying value of equity investments held at cost is $15 million (2009: $32 million, 2008: $24 million). Loans receivable comprise all loans to third parties with a term of over one year.
16. Inventories
Inventories in millions of USD 2010 2009 2008
Raw materials and supplies 296 271 240 Work in process 90 135 127 Intermediates 869 838 1,176 Finished goods 680 644 556 Less: provision for slow-moving and obsolete inventory (256) (162) (93)
Total inventories 1,679 1,726 2,006
In 2010 expenses relating to inventories expensed through cost of sales totaled $3,653 million (2009: $3,405 million).
17. Accounts receivable
Accounts receivable in millions of USD 2010 2009 2008
Trade accounts receivable 1,879 1,927 1,892 Notes receivable 8 7 - Other 16 15 14 Allowances for doubtful accounts (30) (21) (28) Charge-backs and other allowances (141) (66) (53)
Total accounts receivable 1,732 1,862 1,825
In 2010 expenses relating to bad debt expensed through marketing and distribution totaled $9 million (2009: income of $1 million). Significant concentrations within trade receivables of counterparty credit risk are described in Note 30.

54 Annual Report 2010 – Roche Holdings, Inc. Consolidated Financial Statements
The movements in allowances are shown below. Allowances for doubtful accounts receivable: movements in recognized liability in millions of USD
2010 2009 At January 1 (21) (28) Additional allowances created (9) (4) Unused amounts reversed 1 5 Utilized during the year - - Other (1) 6
At December 31 (30) (21)
18. Other current assets
Other current assets in millions of USD 2010 2009 2008
Accrued interest income - - 1 Derivative financial instruments 23 - 29 79 Other 368 324 353
Total financial current assets 368 353 433 Prepaid expenses 140 197 177 Other 26 10 17
Total non-financial current assets 166 207 194
Total other current assets 534 560 627
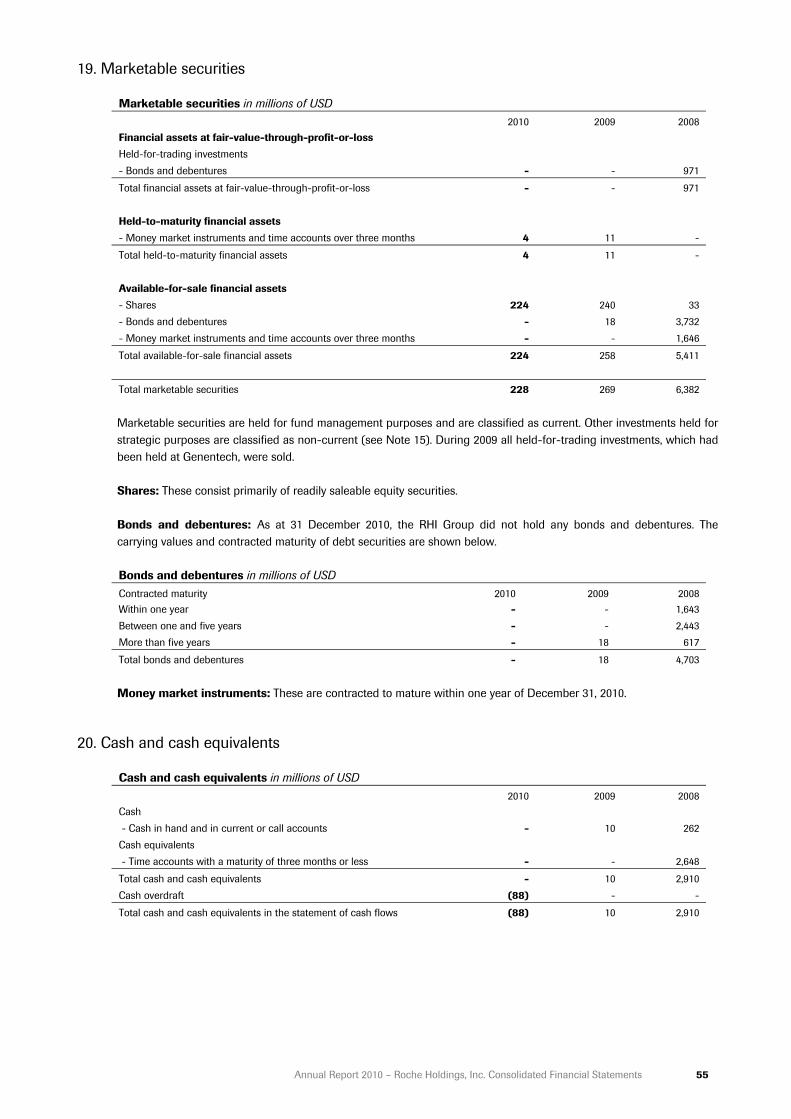
Annual Report 2010 – Roche Holdings, Inc. Consolidated Financial Statements 55
19. Marketable securities
Marketable securities in millions of USD 2010 2009 2008
Financial assets at fair-value-through-profit-or-loss Held-for-trading investments - Bonds and debentures - - 971
Total financial assets at fair-value-through-profit-or-loss - - 971 Held-to-maturity financial assets - Money market instruments and time accounts over three months 4 11 -
Total held-to-maturity financial assets 4 11 - Available-for-sale financial assets - Shares 224 240 33 - Bonds and debentures - 18 3,732 - Money market instruments and time accounts over three months - - 1,646
Total available-for-sale financial assets 224 258 5,411
Total marketable securities 228 269 6,382 Marketable securities are held for fund management purposes and are classified as current. Other investments held for strategic purposes are classified as non-current (see Note 15). During 2009 all held-for-trading investments, which had been held at Genentech, were sold. Shares: These consist primarily of readily saleable equity securities. Bonds and debentures: As at 31 December 2010, the RHI Group did not hold any bonds and debentures. The carrying values and contracted maturity of debt securities are shown below. Bonds and debentures in millions of USD Contracted maturity 2010 2009 2008 Within one year - - 1,643 Between one and five years - - 2,443 More than five years - 18 617
Total bonds and debentures - 18 4,703 Money market instruments: These are contracted to mature within one year of December 31, 2010.
20. Cash and cash equivalents
Cash and cash equivalents in millions of USD 2010 2009 2008
Cash - Cash in hand and in current or call accounts - 10 262 Cash equivalents - Time accounts with a maturity of three months or less - - 2,648
Total cash and cash equivalents - 10 2,910 Cash overdraft (88) - -
Total cash and cash equivalents in the statement of cash flows (88) 10 2,910
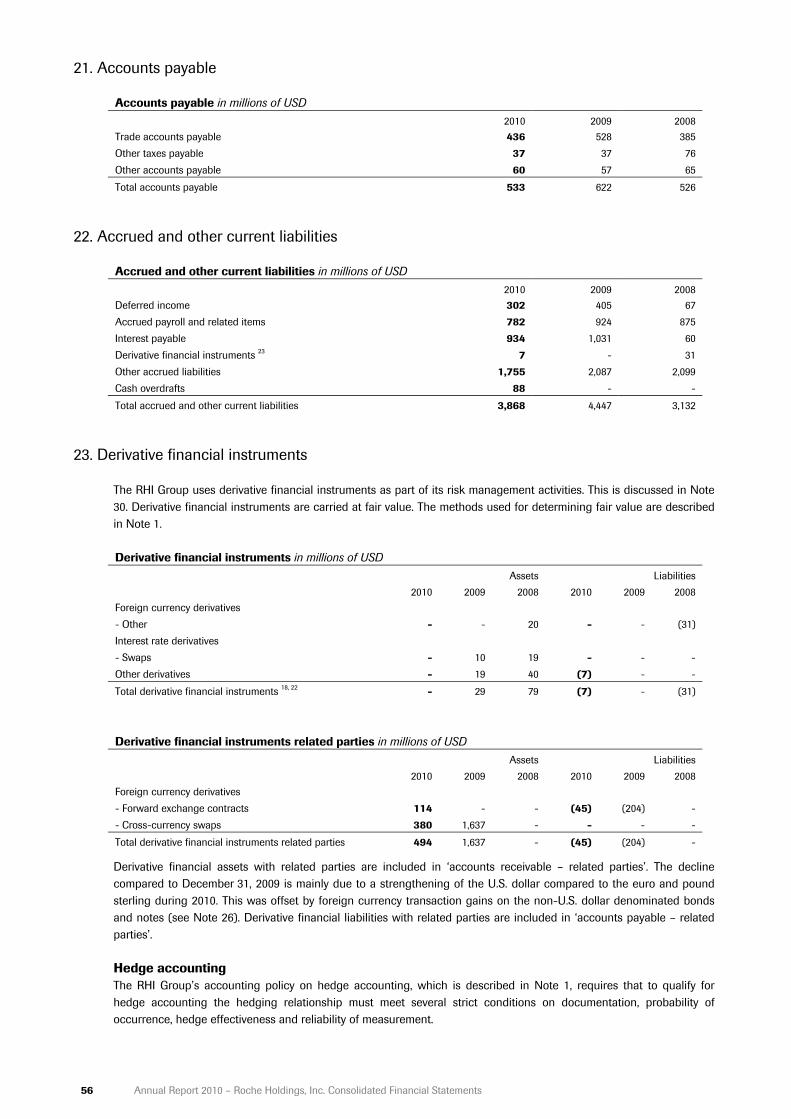
56 Annual Report 2010 – Roche Holdings, Inc. Consolidated Financial Statements
21. Accounts payable
Accounts payable in millions of USD 2010 2009 2008
Trade accounts payable 436 528 385 Other taxes payable 37 37 76 Other accounts payable 60 57 65
Total accounts payable 533 622 526
22. Accrued and other current liabilities
Accrued and other current liabilities in millions of USD 2010 2009 2008
Deferred income 302 405 67 Accrued payroll and related items 782 924 875 Interest payable 934 1,031 60 Derivative financial instruments 23 7 - 31 Other accrued liabilities 1,755 2,087 2,099 Cash overdrafts 88 - -
Total accrued and other current liabilities 3,868 4,447 3,132
23. Derivative financial instruments
The RHI Group uses derivative financial instruments as part of its risk management activities. This is discussed in Note 30. Derivative financial instruments are carried at fair value. The methods used for determining fair value are described in Note 1. Derivative financial instruments in millions of USD
Assets Liabilities 2010 2009 2008 2010 2009 2008
Foreign currency derivatives - Other - - 20 - - (31) Interest rate derivatives - Swaps - 10 19 - - - Other derivatives - 19 40 (7) - -
Total derivative financial instruments 18, 22 - 29 79 (7) - (31) Derivative financial instruments related parties in millions of USD
Assets Liabilities 2010 2009 2008 2010 2009 2008
Foreign currency derivatives - Forward exchange contracts 114 - - (45) (204) - - Cross-currency swaps 380 1,637 - - - -
Total derivative financial instruments related parties 494 1,637 - (45) (204) -
Derivative financial assets with related parties are included in ‘accounts receivable – related parties’. The decline compared to December 31, 2009 is mainly due to a strengthening of the U.S. dollar compared to the euro and pound sterling during 2010. This was offset by foreign currency transaction gains on the non-U.S. dollar denominated bonds and notes (see Note 26). Derivative financial liabilities with related parties are included in ‘accounts payable – related parties’. Hedge accounting The RHI Group’s accounting policy on hedge accounting, which is described in Note 1, requires that to qualify for hedge accounting the hedging relationship must meet several strict conditions on documentation, probability of occurrence, hedge effectiveness and reliability of measurement.
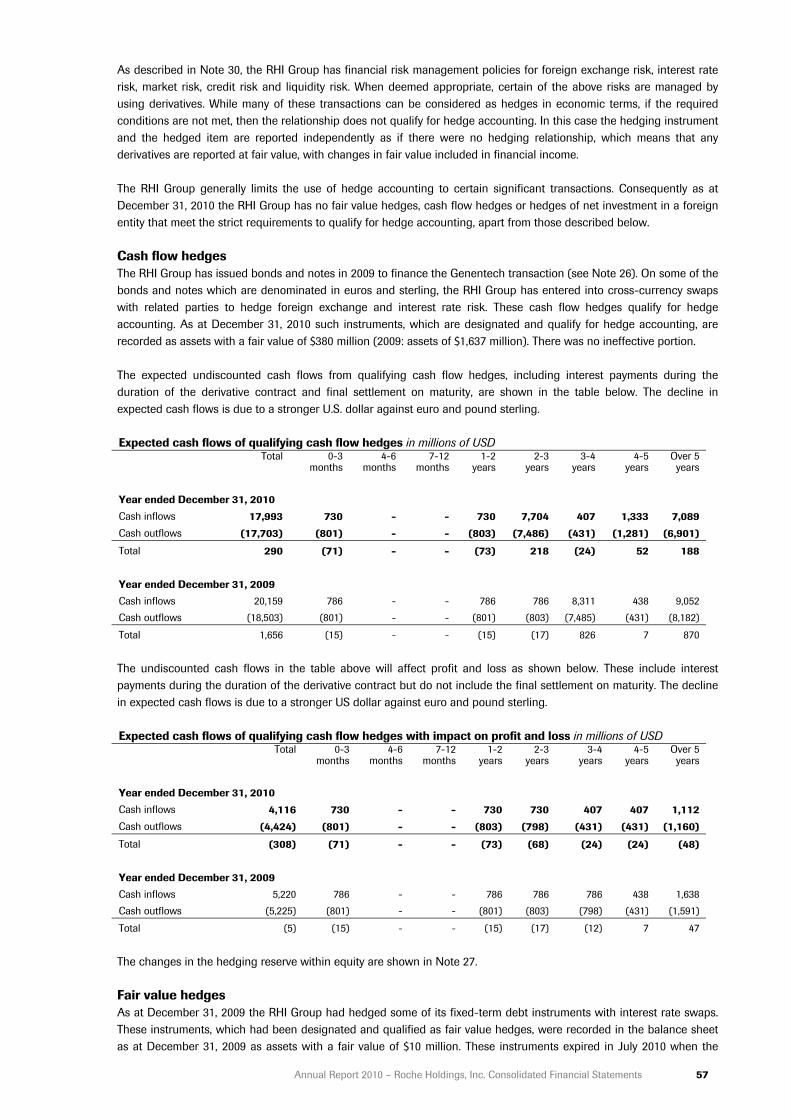
Annual Report 2010 – Roche Holdings, Inc. Consolidated Financial Statements 57
As described in Note 30, the RHI Group has financial risk management policies for foreign exchange risk, interest rate risk, market risk, credit risk and liquidity risk. When deemed appropriate, certain of the above risks are managed by using derivatives. While many of these transactions can be considered as hedges in economic terms, if the required conditions are not met, then the relationship does not qualify for hedge accounting. In this case the hedging instrument and the hedged item are reported independently as if there were no hedging relationship, which means that any derivatives are reported at fair value, with changes in fair value included in financial income. The RHI Group generally limits the use of hedge accounting to certain significant transactions. Consequently as at December 31, 2010 the RHI Group has no fair value hedges, cash flow hedges or hedges of net investment in a foreign entity that meet the strict requirements to qualify for hedge accounting, apart from those described below. Cash flow hedges The RHI Group has issued bonds and notes in 2009 to finance the Genentech transaction (see Note 26). On some of the bonds and notes which are denominated in euros and sterling, the RHI Group has entered into cross-currency swaps with related parties to hedge foreign exchange and interest rate risk. These cash flow hedges qualify for hedge accounting. As at December 31, 2010 such instruments, which are designated and qualify for hedge accounting, are recorded as assets with a fair value of $380 million (2009: assets of $1,637 million). There was no ineffective portion. The expected undiscounted cash flows from qualifying cash flow hedges, including interest payments during the duration of the derivative contract and final settlement on maturity, are shown in the table below. The decline in expected cash flows is due to a stronger U.S. dollar against euro and pound sterling. Expected cash flows of qualifying cash flow hedges in millions of USD
Total
0-3
months 4-6
months7-12
months 1-2
years 2-3
years 3-4
years 4-5
years Over 5 years
Year ended December 31, 2010 Cash inflows 17,993 730 - - 730 7,704 407 1,333 7,089 Cash outflows (17,703) (801) - - (803) (7,486) (431) (1,281) (6,901)
Total 290 (71) - - (73) 218 (24) 52 188 Year ended December 31, 2009 Cash inflows 20,159 786 - - 786 786 8,311 438 9,052 Cash outflows (18,503) (801) - - (801) (803) (7,485) (431) (8,182)
Total 1,656 (15) - - (15) (17) 826 7 870 The undiscounted cash flows in the table above will affect profit and loss as shown below. These include interest payments during the duration of the derivative contract but do not include the final settlement on maturity. The decline in expected cash flows is due to a stronger US dollar against euro and pound sterling. Expected cash flows of qualifying cash flow hedges with impact on profit and loss in millions of USD
Total
0-3
months 4-6
months 7-12
months1-2
years 2-3
years 3-4
years 4-5
years Over 5 years
Year ended December 31, 2010 Cash inflows 4,116 730 - - 730 730 407 407 1,112 Cash outflows (4,424) (801) - - (803) (798) (431) (431) (1,160)
Total (308) (71) - - (73) (68) (24) (24) (48) Year ended December 31, 2009 Cash inflows 5,220 786 - - 786 786 786 438 1,638 Cash outflows (5,225) (801) - - (801) (803) (798) (431) (1,591)
Total (5) (15) - - (15) (17) (12) 7 47 The changes in the hedging reserve within equity are shown in Note 27. Fair value hedges As at December 31, 2009 the RHI Group had hedged some of its fixed-term debt instruments with interest rate swaps. These instruments, which had been designated and qualified as fair value hedges, were recorded in the balance sheet as at December 31, 2009 as assets with a fair value of $10 million. These instruments expired in July 2010 when the

58 Annual Report 2010 – Roche Holdings, Inc. Consolidated Financial Statements
underlying bond was repaid. During 2010 a loss of $10 million was recorded on these interest rate swaps (2009: loss of $9 million). As the fair value hedge had been highly effective since inception, the result of the interest rate swaps was largely offset by changes in the fair value of the hedged debt instruments. The RHI Group has equity investments in various biotechnology companies that are subject to a greater risk of market fluctuation than the stock market in general. To manage part of this exposure the RHI Group has entered into forward contracts, which have been designated and qualify as fair value hedges. As at December 31, 2010 such instruments are recorded as liabilities with a fair value of $7 million (2009: assets $19 million). During 2010 a loss of $26 million was recorded on these forward contracts (2009: loss of $21 million). The result of the forward contracts is offset by the changes in the fair value of the hedged equity investments. The RHI Group uses other derivatives, not designated in a qualifying hedge relationship, to manage its exposures to foreign currency, interest rate, equity market and credit risks. The instruments used may include interest rate swaps, cross-currency swaps, forwards contracts, options.

Annual Report 2010 – Roche Holdings, Inc. Consolidated Financial Statements 59
24. Provisions and contingent liabilities
Provisions: movements in recognized liabilities in millions of USD
Legal
provisions Environmental
provisions Restructuring
provisions Employee provisions
Other provisions Total
Year ended December 31, 2009 At January 1, 2009 126 93 121 142 220 702 Memory acquisition 6 - - 2 - 1 3 IGEN capital contribution 27 - - 8 - - 8 Additional provisions created 450 42 308 86 289 1,175 Unused amounts reversed (79) (2) (17) (11) (31) (140) Utilized during the year (41) (6) (84) (92) (163) (386) Unwinding of discount 4 5 12 - - - 17 Other - - - 6 - 6
At December 31, 2009 461 139 338 131 316 1,385 Of which - Current portion 446 16 317 46 311 1,136 - Non-current portion 15 123 21 85 5 249
Total provisions 461 139 338 131 316 1,385 Year ended December 31, 2010 At January 1, 2010 461 139 338 131 316 1,385 Business combinations 6 - Acquired companies - - - - - -- Contingent considerations - - - - 90 90 Additional provisions created 398 37 344 80 244 1,103 Unused amounts reversed (37) (13) (34) (4) (17) (105)Utilized during the year (60) (13) (226) (68) (153) (520)Unwinding of discount 4 5 11 - - - 16 Other - - - (1) - (1)
At December 31, 2010 767 161 422 138 480 1,968 Of which - Current portion 717 10 418 57 378 1,580 - Non-current portion 50 151 4 81 102 388
Total provisions 767 161 422 138 480 1,968 Expected outflow of resources - Within one year 717 10 418 57 378 1,580 - Between one to two years 30 7 3 20 12 72 - Between two to three years 6 6 1 12 90 115 - More than three years 14 138 - 49 - 201
Total provisions 767 161 422 138 480 1,968
Legal provisions Legal provisions consist of a number of separate legal matters, including claims arising from trade, in various RHI Group companies. The majority of any cash outflows for these other matters are expected to occur within the next one to three years, although these are dependent on the development of the various litigations. Significant provisions are discounted between 4% and 5% where the time value of money is material. Environmental provisions Provisions for environmental matters include various separate environmental issues. By their nature the amounts and timings of any outflows are difficult to predict. The estimated timings of these cash outflows are shown in the table above. Significant provisions are discounted by between 5% and 6% where the time value of money is material. Restructuring provisions These arise from planned programs that materially change the scope of business undertaken by the RHI Group or the manner in which business is conducted. Such provisions include only the costs necessarily entailed by the restructuring which are not associated with the recurring activities of the RHI Group. The timings of these cash outflows are
60 Annual Report 2010 – Roche Holdings, Inc. Consolidated Financial Statements
reasonably certain and are shown in the table above. These provisions are not discounted as the time value of money is not material in these matters. Employee provisions These mostly relate to certain employee benefit obligations, such as sabbatical leave and long-service benefits. The timings of these cash outflows can be reasonably estimated based on past performance and are shown in the table above. These provisions are not discounted as the time value of money is not material in these matters. Other provisions Other provisions consist mostly of claims arising from trade, sales returns, certain employee benefit obligations and various other provisions from RHI Group companies that do not fit into the above categories. The timings of cash outflows are by their nature uncertain and the best estimates are shown in the table above. These provisions are not discounted as the time value of money is not material in these matters. Contingent liabilities The operations and earnings of the RHI Group continue, from time to time and in varying degrees, to be affected by political, legislative, fiscal and regulatory developments, including those relating to environmental protection. The industries in which the RHI Group operates are also subject to other risks of various kinds. The nature and frequency of these developments and events, not all of which are covered by insurance, as well as their effect on future operations and earnings, are not predictable. The RHI Group has entered into strategic alliances with various companies in order to gain access to potential new products or to utilize other companies to help develop the RHI Group’s own potential new products. Potential future payments may become due to certain collaboration partners achieving certain milestones as defined in the collaboration agreements. RHI’s best estimate for future commitment payments are given in Note 13. Pharmaceuticals legal cases Accutane: Hoffmann-La Roche Inc. (‘HLR’) and various other Roche affiliates have been named as defendants in numerous legal actions in the United States relating to the acne medication Accutane. The litigation alleges that Accutane caused certain serious conditions, including, but not limited to, inflammatory bowel disease (‘IBD’), birth defects and psychiatric disorders. As of December 31, 2010 HLR was defending approximately 2,422 actions brought in various federal and state courts throughout the United States for personal injuries allegedly resulting from their use of Accutane. Most of the actions allege IBD as a result of Accutane use. On June 26, 2009 HLR announced that, following a re-evaluation of its portfolio of medicines that are now available from generic manufacturers, rapidly declining brand sales in the U.S. and high costs from personal-injury lawsuits that it continues to defend vigorously, it had decided to immediately discontinue the manufacture and distribution of the product in the United States. All of the actions pending in federal court alleging IBD were consolidated for pre-trial proceedings in a Multi-District Litigation in the United States District Court for the Middle District of Florida, Tampa Division. In July 2007 the District Court granted summary judgment in favor of HLR in the lead federal IBD cases. The plaintiffs appealed and in August 2008 these rulings were affirmed by the United States Court of Appeals for the Eleventh Circuit. In October 2009 the District court granted summary judgment in favor of HLR in the next five federal IBD cases. The plaintiffs appealed in November 2009 and in May 2010 these rulings were affirmed by the United States Court of Appeals for the Eleventh Circuit. Several recently filed matters remain pending. All of the actions pending in state court in New Jersey alleging IBD were consolidated for pre-trial proceedings in the Superior Court of New Jersey, Law Division, Atlantic County. As of December 31, 2010 juries in the Superior Court have ruled in favor of the plaintiff in six cases, assessing total compensatory damages totaling $48 million. The first verdict was reversed on appeal; the re-trial resulted in a verdict in favor of the plaintiff assessing total compensatory damages of $25.2 million; HLR is currently in the process of post-trial briefing. The second verdict was reversed on appeal; the re-trial is scheduled for May 2011; additional plaintiffs may be added to the trial. HLR has appealed the third verdict to the Superior Court of New Jersey, Appellate Division, which involved three plaintiffs. The next trial, involving three plaintiffs, is scheduled for February 2011. In October 2007 a jury in the Circuit Court of Escambia County, Florida, returned a verdict in favor of the plaintiff, assessing total compensatory damages of $7 million, subsequently reduced to $6.8 million by the court, against the Company. In October 2009, the District Court of Appeal, State of Florida reversed and entered judgment as to HLR. The Supreme Court of Florida declined to review plaintiff’s appeal.

Annual Report 2010 – Roche Holdings, Inc. Consolidated Financial Statements 61
Additional trials may be scheduled for 2011. Individual trial results depend on a variety of factors, including many that are unique to the particular case and therefore the trial results to date may not be predictive of future trial results. The RHI Group continues to defend vigorously the remaining personal injury cases and claims. Boniva: HLR and various other Roche affiliates have been named as defendants in numerous legal actions in the United States relating to the post-menopausal osteoporosis medication Boniva. In these litigations, the plaintiffs allege that Boniva caused one of the following conditions: osteonecrosis of jaw (‘ONJ’), atypical femoral fractures, or severe bone pain. As of December 31, 2010 HLR is defending approximately 30 actions brought in federal and state courts in the States of New Jersey, New York and California for personal injuries allegedly resulting from the use of Boniva. All of these Boniva cases are in the early discovery stages of litigation, with no trial dates having been set. Individual trial results depend on a variety of factors, including many that are unique to the particular case. HLR and the other named Roche affiliates intend to vigorously defend themselves in these matters. The outcome of these matters cannot be determined at this time. Cabilly patent: On May 30, 2008 Centocor, Inc. filed a patent lawsuit against Genentech and City of Hope National Medical Center in the U.S. District Court for the Central District of California. The lawsuit related to U.S. Patent No. 6,331,415 (‘the Cabilly patent’) that is co-owned by Genentech and City of Hope. The Cabilly patent, which expires in 2018, relates to methods used by Genentech and others to make certain antibodies or antibody fragments, as well as cells and DNA used in these methods. Genentech has licensed the Cabilly patent to other companies and derives significant royalties from these licences. The lawsuit sought a declaratory judgment of patent invalidity and unenforceability with regard to the Cabilly patent and of patent non-infringement with regard to certain of Centocor’s products. On August 30, 2010 Genentech and Centocor entered into a settlement agreement resolving this lawsuit and certain additional patent issues. The agreement was effective as of April 30, 2010 with regard to royalties that Centocor has agreed to pay for licenses under the Cabilly patent. This matter has been finally resolved. On October 8, 2009 Glaxo Group Limited, SmithKline Beecham Corporation, and GlaxoSmithKline LLC (collectively “GSK”) filed a patent lawsuit against Genentech and City of Hope in the U.S. District Court for the Southern District of Florida. The lawsuit relates to the Cabilly patent and seeks a declaratory judgment of patent invalidity and unenforceability with regard to the Cabilly patent and of patent non-infringement with regard to a certain GSK product. On December 16, 2009 Genentech filed a motion to dismiss, or in the alternative to transfer to the Central District of California. GSK dismissed its Florida lawsuit in its entirety on February 17, 2010 and filed a related action on the same day in Northern District of California. Genentech filed a motion to transfer to the Central District of California, an answer, and a counterclaim against GSK on March 10, 2010. On April 12, 2010 Genentech’s motion to transfer was granted. On October 13, 2010 the Court entered an Order related to claim construction matters, including setting a Markman hearing date of February 14, 2011. The outcome of this matter cannot be determined at this time. Other litigation: On June 28, 2003 Mr Ubaldo Bao Martinez filed a lawsuit against the Porriño Town Council and Genentech España S.L. in the Contentious Administrative Court Number One of Pontevedra, Spain. The lawsuit challenged the Town Council’s decision to grant licenses to Genentech España S.L. for the construction and operation of a warehouse and biopharmaceutical manufacturing facility in Porriño, Spain. On January 16, 2008 the Administrative Court ruled in favor of Mr Bao on one of the claims in the lawsuit and ordered the closing and demolition of the facility, subject to certain further legal proceedings. On February 12, 2008, Genentech España S.L and the Town Council filed appeals of the Administrative Court decision at the High Court in Galicia, Spain. On March 16, 2010 Genentech received notice that it prevailed over Mr Bao on the appeal. This decision revokes the January 2008 ruling in its entirety. On October 4, 2004 Genentech received a subpoena from the United States Department of Justice, requesting documents related to the promotion of Rituxan. Genentech co-operated with the government’s associated investigation. Previously the investigation had been both civil and criminal in nature. Genentech was informed in August 2008 by the criminal prosecutor who handled this matter that the government has declined to prosecute Genentech criminally in connection with this investigation. The civil matter was still ongoing. Through counsel Genentech continued to have discussions with government representatives about the status of their investigation and Genentech’s views on this matter, including potential resolution. On October 20, 2009 the government notified Genentech that it had decided not to make any civil claim against Genentech. The government’s investigation was initiated by a complaint that was filed under seal in the U.S. District Court for the Eastern District of Pennsylvania in 2003 by an individual plaintiff. The complaint was unsealed on December 31, 2009 and is currently the basis of civil litigation by the plaintiff against Roche Holdings, Inc. and Genentech. Discovery in this matter is ongoing. The Group intends to vigorously defend itself. The outcome of this civil litigation cannot be determined at this time.
62 Annual Report 2010 – Roche Holdings, Inc. Consolidated Financial Statements
HLR, Roche Laboratories Inc. (‘RLI’) and Genentech, along with approximately 50 other brand and generic pharmaceutical companies, have been named as defendants in several legal actions in the United States relating to the pricing of pharmaceutical drugs and State Medicaid reimbursement. The primary allegation in these litigations is that the pharmaceutical companies misrepresented or otherwise reported inaccurate Average Wholesale Prices (‘AWP’) and/or Wholesale Acquisition Costs (‘WAC’) for their drugs, which prices were allegedly relied upon by the States in calculating Medicaid reimbursements to entities such as retail pharmacies. The States, through their respective Attorney General, are seeking repayment of the amounts they claim were over-reimbursed. The time period associated with these cases is 1991-2005. As of December 31, 2010, HLR and RLI are defending six actions filed in the following States: Alabama, Mississippi, New Jersey, Kansas, Oklahoma and Louisiana. Genentech is defending one action filed in the state of Kansas. Discovery is currently pending in each of these cases. HLR, RLI and Genentech intend to vigorously defend themselves in these matters. The outcome of these matters cannot be determined at this time. HLR, along with various other branded pharmaceutical companies, has been named as a defendant in several legal actions in the United States brought by retail pharmacies relating to the discounting practices for Brand Name Prescription Drugs (‘BNPD’). In these BNPD litigations, the plaintiffs allege that they were denied discounts for certain prescription drugs that were offered to other mail order and managed care entities, which denial is claimed to be a violation of the Robinson-Patman Act (‘RPA’). The RPA is a Federal law that prohibits unlawful price discrimination. In addition, the plaintiffs alleged that the defendants conspired in their refusal to offer them certain discounts. The conspiracy claims against all defendants were previously settled, with only the RPA claims remaining to be litigated. As of December 31, 2010 HLR is defending approximately 10 BNPD actions brought by approximately 120 retail pharmacies in various federal and state courts throughout the United States. Discovery is currently pending in each of these cases. HLR is not currently scheduled for a trial in any of these BNPD matters in 2011. HLR intends to vigorously defend itself. The outcome of these matters cannot be determined at this time On November 19, 2007 Novartis Vaccines & Diagnostics, Inc. (the former Chiron affiliate of Novartis) filed a lawsuit against Trimeris, Inc. and four Roche Group companies: Hoffmann-La Roche Inc., F. Hoffmann-La Roche Ltd, Roche Laboratories Inc. and Roche Colorado Corp., in the U.S. District Court for the Eastern District of Texas. The complaint sought an injunction and damages for the manufacture and sale of Roche’s anti-AIDS drug Fuzeon in the United States. Novartis alleged that these activities infringed the claims of U.S. Patent No. 7,285,271. On September 23, 2010 the matter was settled by Roche and Trimeris taking a royalty-bearing license under the Novartis patent.
On May 8, June 11, August 8, and September 29, of 2008, Genentech was named as a defendant, along with InterMune, Inc. and its former chief executive officer, W. Scott Harkonen, in four separate class-action complaints filed in the U.S. District Court for the Northern District of California on behalf of plaintiffs who allegedly paid part or all of the purchase price for a product that was licensed by Genentech to Connectics Corporation and was subsequently assigned to InterMune. Genentech responded to these complaints with a motion to dismiss these matters, which was granted on April 28, 2009. Plaintiffs filed amended complaints including only State law claims on May 28, 2009. Genentech responded to these complaints with another motion to dismiss, which was heard on September 11, 2009. The Court again granted Genentech’s motion to dismiss with respect to all claims, but with leave for plaintiffs to replead specific claims under California unfair competition law. Plaintiffs filed an amended class action complaint on December 23, 2009 naming Genentech as a defendant in claims for unfair competition law, false advertising law, consumer remedies law, consumer protection law, and unjust enrichment. Genentech sought dismissal of this amended complaint. On September 1, 2010 the Court entered an order granting Genentech’s motion to dismiss all claims against it with prejudice. Plaintiffs filed an appeal of the District Court’s ruling with the United States Court of Appeals for the Ninth Circuit and briefing on the appeal is ongoing. The outcome of this matters cannot be determined at this time.
On October 27, 2008 Genentech and Biogen Idec Inc. filed a complaint against Sanofi-Aventis Deutschland GmbH (‘Sanofi’), Sanofi-Aventis U.S. LLC and Sanofi-Aventis U.S. Inc. in the Northern District of California seeking a declaratory judgment that certain Genentech products, including Rituxan, do not infringe Sanofi’s U.S. Patents 5,849,522 and 6,218,140 and a declaratory judgment that the ‘522 and ‘140 patents are invalid. Also on October 27, 2008 Sanofi filed suit against Genentech and Biogen Idec in the Eastern District of Texas, Lufkin Division, claiming that Rituxan and at least eight other Genentech products infringe the ‘522 and ‘140 patents. Sanofi brought claims for preliminary and permanent injunctions, compensatory and exemplary damages, and other relief. Genentech challenged the venue of the Texas case and, after an opinion by the Federal Circuit Court of Appeals, the Texas and California cases were consolidated in the Northern District of California. The District Court issued a claim construction order on June 23, 2010. Sanofi filed a motion for reconsideration that was denied. Genentech and Biogen Idec have filed motions for summary judgment that Sanofi has opposed and no ruling on these motions has been issued. Discovery in these consolidated

Annual Report 2010 – Roche Holdings, Inc. Consolidated Financial Statements 63
matters is ongoing. In addition on October 24, 2008 Hoechst GmbH filed with the ICC International Court of Arbitration (Paris) a request for arbitration with Genentech, relating to a terminated agreement between Hoechst’s predecessors and Genentech that pertained to the above patents and related patents outside the United States. Hoechst is seeking payments on royalties on sales of Genentech products, damages for breach of contract, and other relief. The ICC arbitration hearing was held on August 30, 2010 through September 3, 2010. Post-hearing briefs have been filed and a ruling is expected in the first half of 2011. The outcome of these matters cannot be determined at this time. On May 11, 2010 Genentech, filed a patent lawsuit against the University of Pennsylvania in the U.S. District Court for the Northern District of California. The lawsuit relates to United States Patent No. 6,733,752 and seeks a declaratory judgment of patent non-infringement and invalidity with regard to that patent. On July 12, 2010 the University counterclaimed against Genentech for infringement of the ‘752 patent, seeking unspecified damages based on the sales of Herceptin. Genentech filed its answer on August 2, 2010. A case management conference was held on August 24, 2010 and a Markman hearing is currently scheduled for March 28, 2011. Discovery in this matter is ongoing. The outcome of this matter cannot be determined at this time. On August 27, 2010 PDL Biopharma filed a complaint against Genentech in Nevada state court seeking a judicial declaration concerning Genentech’s obligation to pay royalties on certain ex-U.S. sales of Herceptin, Avastin, Xolair and Lucentis under a 2003 agreement between the parties. On September 13, 2010 PDL filed a first amended complaint asserting additional claims against Genentech, including breach of contract and breach of the implied covenant of good faith and fair dealing. PDL also asserted new claims against Roche and Novartis for intentional interference with contractual relations. In addition to declaratory relief, PDL is seeking monetary damages including liquidated and punitive damages. On November 1, 2010 Genentech and Roche filed a motion to dismiss for failure to state a claim, and Roche filed an additional motion to dismiss for lack of personal jurisdiction. The outcome of this matter cannot be determined at this time. On September 20, 2010 GSK and Genentech each filed patent lawsuits against one another (and in the case of GSK, also against Roche Holding Ltd.) in U.S. District Courts for the District of Delaware and the Northern District of California respectively. The lawsuits concern GSK’s U.S. Patent Nos. RE41,070 and RE41,555. GSK has asserted claims against Genentech and Roche alleging infringement of the ‘070 and ‘555 patents by certain “therapeutic antibody products,” although the complaint only specifically refers to Herceptin. In its lawsuit Genentech is seeking a judicial declaration of non-infringement by certain Genentech products. In the Delaware action on November 12, 2010 Genentech filed a motion to dismiss for failure to state a claim and a motion to transfer the case to California. Roche filed a motion to dismiss for lack of personal jurisdiction (and joining Genentech's motion in the event its personal jurisdiction motion is denied). All motions are currently pending. In the California action on December 1, 2010 the Court entered an order staying the California action pending resolution by the Delaware Court of Genentech's motion to transfer. The outcome of these matters cannot be determined at this time.
25. Other non-current liabilities
Other non-current liabilities in millions of USD 2010 2009 2008
Deferred income 52 70 100 Other long-term liabilities 36 46 51
Total other non-current liabilities 88 116 151
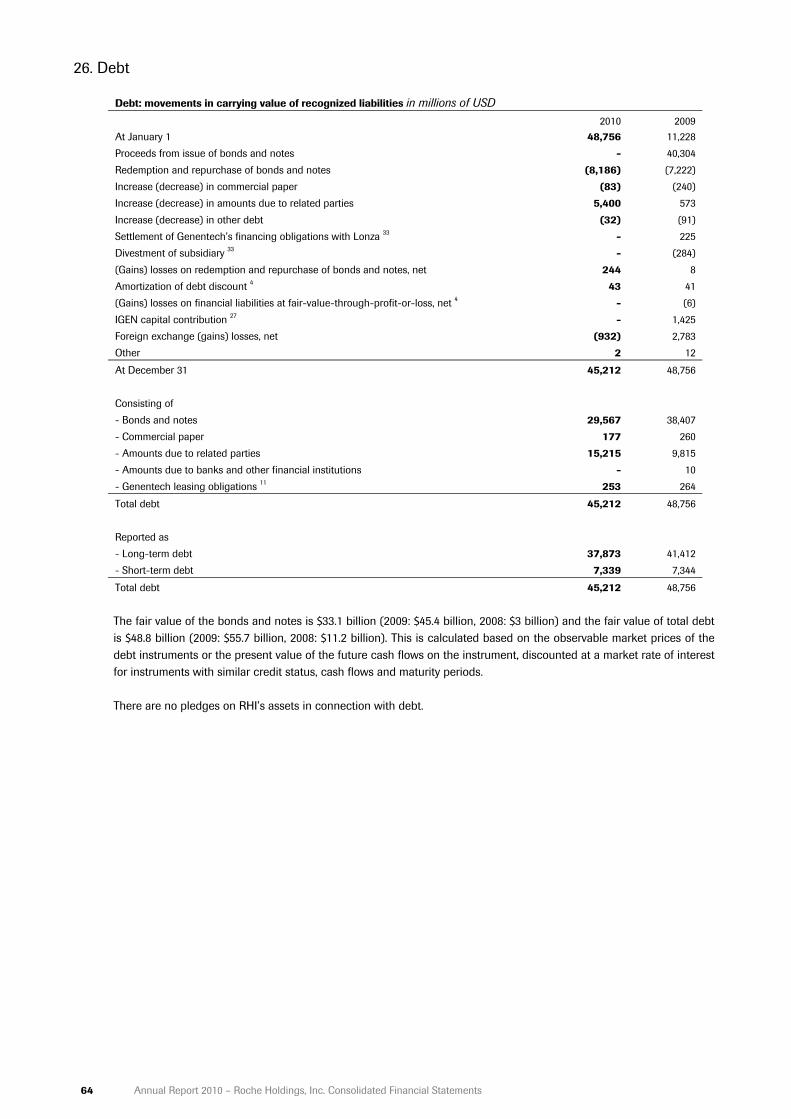
64 Annual Report 2010 – Roche Holdings, Inc. Consolidated Financial Statements
26. Debt
Debt: movements in carrying value of recognized liabilities in millions of USD
2010 2009 At January 1 48,756 11,228 Proceeds from issue of bonds and notes - 40,304 Redemption and repurchase of bonds and notes (8,186) (7,222) Increase (decrease) in commercial paper (83) (240) Increase (decrease) in amounts due to related parties 5,400 573 Increase (decrease) in other debt (32) (91) Settlement of Genentech’s financing obligations with Lonza 33 - 225 Divestment of subsidiary 33 - (284) (Gains) losses on redemption and repurchase of bonds and notes, net 244 8 Amortization of debt discount 4 43 41 (Gains) losses on financial liabilities at fair-value-through-profit-or-loss, net 4 - (6) IGEN capital contribution 27 - 1,425 Foreign exchange (gains) losses, net (932) 2,783 Other 2 12
At December 31 45,212 48,756 Consisting of - Bonds and notes 29,567 38,407 - Commercial paper 177 260 - Amounts due to related parties 15,215 9,815 - Amounts due to banks and other financial institutions - 10 - Genentech leasing obligations 11 253 264
Total debt 45,212 48,756 Reported as - Long-term debt 37,873 41,412 - Short-term debt 7,339 7,344
Total debt 45,212 48,756
The fair value of the bonds and notes is $33.1 billion (2009: $45.4 billion, 2008: $3 billion) and the fair value of total debt is $48.8 billion (2009: $55.7 billion, 2008: $11.2 billion). This is calculated based on the observable market prices of the debt instruments or the present value of the future cash flows on the instrument, discounted at a market rate of interest for instruments with similar credit status, cash flows and maturity periods. There are no pledges on RHI’s assets in connection with debt.

Annual Report 2010 – Roche Holdings, Inc. Consolidated Financial Statements 65
Bonds and notes
Recognized liabilities and effective interest rates of bonds and notes in millions of USD Effective interest rate 2010 2009 2008 Underlying
instrument Including hedging
U.S. dollar-denominated notes – floating rate 3 months LIBOR Notes due February 25, 2010, principal 3 billion U.S. dollars +1.13% n/a - 2,999 - Notes due February 25. 2011, principal 931 million U.S. dollars +2.10% n/a 931 930 - U.S. dollar-denominated notes – fixed rate 4.50% notes due March 1, 2012, principal 2.5 billion U.S. dollars 4.84% n/a - 2,486 - 5.00% notes due March 1, 2014, principal 2.75 billion U.S. dollars a) 5.31% n/a 2,835 2,725 - 6.00% notes due March 1, 2019, principal 4.5 billion U.S. dollars 6.37% n/a 4,422 4,415 - 7.00% notes due March 1, 2039, principal 2.5 billion U.S. dollars 7.43% n/a 2,412 2,411 - European Medium Term Note programme – floating rate 3 months EURIBOR Notes due March 4, 2010, principal 1.5 billion euros +1.05% +0.92% - 2,150 - European Medium Term Note programme – fixed rate 4.625% notes due March 4, 2013, principal 5.25 billion euros 4.82% 5.53% 6,947 7,484 - 5.5% notes due March 4, 2015, principal 1.25 billion pounds sterling
5.70%
5.73% 1,914 1,992 -
5.625% notes due March 4, 2016, principal 2.75 billion euros 5.70% 6.37% 3,641 3,927 - 6.5% notes due March 4, 2021, principal 1.75 billion euros 6.66% 6.99% 2,298 2,477 - Swiss franc bonds 2.5% bonds due March 23, 2012, principal amount 2.5 billion Swiss francs 2.68% 3.05% 2,667 2,402 - U.S. dollar bonds ‘Chameleon’ 6.75% due July 6, 2009, principal 487 million U.S. dollars 6.77% n/a - - 493 Genentech Senior Notes 4.40% Senior Notes due July 15, 2010, principal 500 million U.S. dollars 4.53% n/a - 509 519 4.75% Senior Notes due July 15, 2015, principal 1 billion U.S. dollars 4.87% n/a 1,000 1,000 1,000 5.25% Senior Notes due July 15, 2035, principal 500 million U.S. dollars 5.39% n/a 500 500 500
Total 29,567 38,407 2,512
a) Of the principal amount of 2.75 billion US dollars, notes of $1.0 billion will be redeemed on March 24, 2011 following the RHI Group’s resolution to early redeem these notes (see below).

66 Annual Report 2010 – Roche Holdings, Inc. Consolidated Financial Statements
Bonds and notes: maturity in millions of USD
2010 2009 2008 Within one year 2,028 5,658 493 Between one and two years 2,667 930 519 Between two and three years 6,947 4,888 - Between three and four years 1,738 7,484 - Between four and five years 2,914 2,725 - More than five years 13,273 16,722 1,500
Total bonds and notes 29,567 38,407 2,512
Unamortized discount included in carrying value of bonds and notes in millions of USD 2010 2009 2008
U.S. dollar notes 83 215 - Euro notes 64 88 - Swiss franc bonds 6 9 - Sterling notes 13 17 - Total unamortized discount 166 329 -
Fair Value Option In 2005 the RHI Group applied the Fair Value Option on one of its outstanding debt instruments on which RHI had been applying fair value hedge accounting in the past. This debt instrument was the ‘Chameleon’ U.S. dollar bonds. This instrument was fully redeemed at its due date in 2009. The Fair Value Option treatment is based on the elimination of an accounting mismatch which had been recognized between the hedging swaps (reported at fair value) and the hedged bonds (reported at amortized cost). Issuance of new bonds and notes – 2010 No new bonds or notes were issued in 2010. Issuance of new bonds and notes – 2009 The RHI Group financed the Genentech transaction (see Note 3) by a combination of the RHI Group’s own funds, bonds, notes and commercial paper. The RHI Group raised net proceeds of $40.3 billion through a series of debt offerings, as described below. All newly issued debt is senior, unsecured and has been guaranteed by Roche Holding Ltd., the parent company of the Roche Group.
U.S. dollar-denominated notes: On February 25, 2009 the RHI Group completed an offering of U.S. dollar-denominated notes to qualified institutional buyers in the United States under Rule 144A and to persons other than U.S. persons outside the United States under Regulation S of the U.S. Securities Act of 1933. The RHI Group received approximately $16.3 billion aggregate net proceeds from the issuance and sale of these fixed and floating rate notes. On March 20, 2009 the RHI Group completed a further offering of U.S. dollar-denominated notes under Rule 144A of the U.S. Securities Act of 1933. Roche received approximately $2.5 billion in aggregate net proceeds from the issuance and sale of these fixed rate notes. The terms and proceeds of the notes were as follows: Issuance of U.S. dollar-denominated notes
Principal amount Net proceeds
USD millions USD millions Floating rate notes due 2010 3,000 2,996 Floating rate notes due 2011 1,250 1,248 Fixed rate 1.95% notes due 2009 2,500 2,500 Fixed rate 4.50% notes due 2012 2,500 2,481 Fixed rate 5.00% notes due 2014 2,750 2,720 Fixed rate 6.00% notes due 2019 4,500 4,409 Fixed rate 7.00% notes due 2039 2,500 2,410
Total 19,000 18,764 European Medium Term Note programme: On March 4, 2009 the RHI Group issued euro- and sterling-denominated fixed- and floating rate notes. The terms and proceeds of the notes were as follows:

Annual Report 2010 – Roche Holdings, Inc. Consolidated Financial Statements 67
Issuance of European Medium Term Notes
Principal amount Net
proceeds
EUR millions GBP
millions USD
millions Floating rate EUR notes due 2010 1,500 - 1,883 Fixed rate 4.625% EUR notes due 2013 5,250 - 6,551 Fixed rate 5.5% GBP notes due 2015 - 1,250 1,740 Fixed rate 5.625% EUR notes due 2016 2,750 - 3,441 Fixed rate 6.5% EUR notes due 2021 1,750 - 2,170
Total 11,250 1,250 15,785 Subsequent to the debt issuances, the proceeds of all notes were swapped into U.S. dollars by entering into derivative contracts with related parties. The related party derivatives mirror exactly the terms of derivative contracts that a Roche Group affiliate outside the RHI Group has entered with third party financial institutions. As a result, in these financial statements, the notes have economic characteristics equivalent to U.S. dollar-denominated notes. Swiss franc-denominated bonds and notes: On March 23, 2009 the RHI Group completed an offering of Swiss franc-denominated fixed-rate bonds. The terms and proceeds of the bonds were as follows: Issuance of Swiss franc-denominated bonds and notes Principal amount Net proceeds CHF millions USD millions Fixed rate 1.2% bonds due 2009 4,000 3,548 Fixed rate 2.5% bonds due 2012 2,500 2,207
Total 6,500 5,755 Subsequent to the debt issuances, the proceeds of all Swiss franc-denominated bonds were swapped into U.S. dollars by entering into derivative contracts with related parties. The related party derivatives mirror exactly the terms of derivative contracts that a Roche Group affiliate outside the RHI Group has entered with third party financial institutions. As a result, in these financial statements, the bonds have economic characteristics equivalent to U.S. dollar-denominated bonds. Cash inflows from issuance of bonds and notes in millions of USD 2010 2009 U.S. dollar-denominated notes - 18,764 European Medium Term Note programme euro- and sterling-denominated notes - 15,785 Swiss franc-denominated bonds - 5,755
Total cash inflows from issuance of bonds and notes - 40,304 Redemption and repurchase of bonds and notes - 2010 Redemption of U.S. dollar-denominated notes: On the due date of February 25, 2010 the RHI Group redeemed notes with a principal of $3 billion at the original issue amount plus accrued original issue discount (‘OID’). The effective interest rate of these notes was 3 months LIBOR plus 1.13%. The cash outflow was $3,000 million and there was no gain or loss recorded on the redemption.
Redemption of European Medium Term Note programme notes: On the due date of March 4, 2010 the RHI Group redeemed notes with a principal of 1.5 billion euros at the original issue amount plus accrued original issue discount (‘OID’). The effective interest rate of these notes was 3 months EURIBOR plus 1.05% (plus 0.92% including hedging). The cash outflow was $2,055 million and there was no gain or loss recorded on the redemption. Redemption of Genentech Senior Notes: On the due date of July 15, 2010 the RHI Group redeemed notes with a principal of $500 million at the original issue amount plus accrued original issue discount (‘OID’). The effective interest rate of these bonds was 4.53%. The cash outflow was $500 million and there was no gain or loss recorded on the redemption.
Early redemption of U.S. dollar-denominated notes: On June 29, 2010 the RHI Group resolved to exercise its option to call for redemption the U.S. dollar denominated 4.50% fixed rate notes due March 1, 2012 with a principal of $2.5 billion. The RHI Group redeemed these notes on September 9, 2010 at an amount equal to the sum of the present
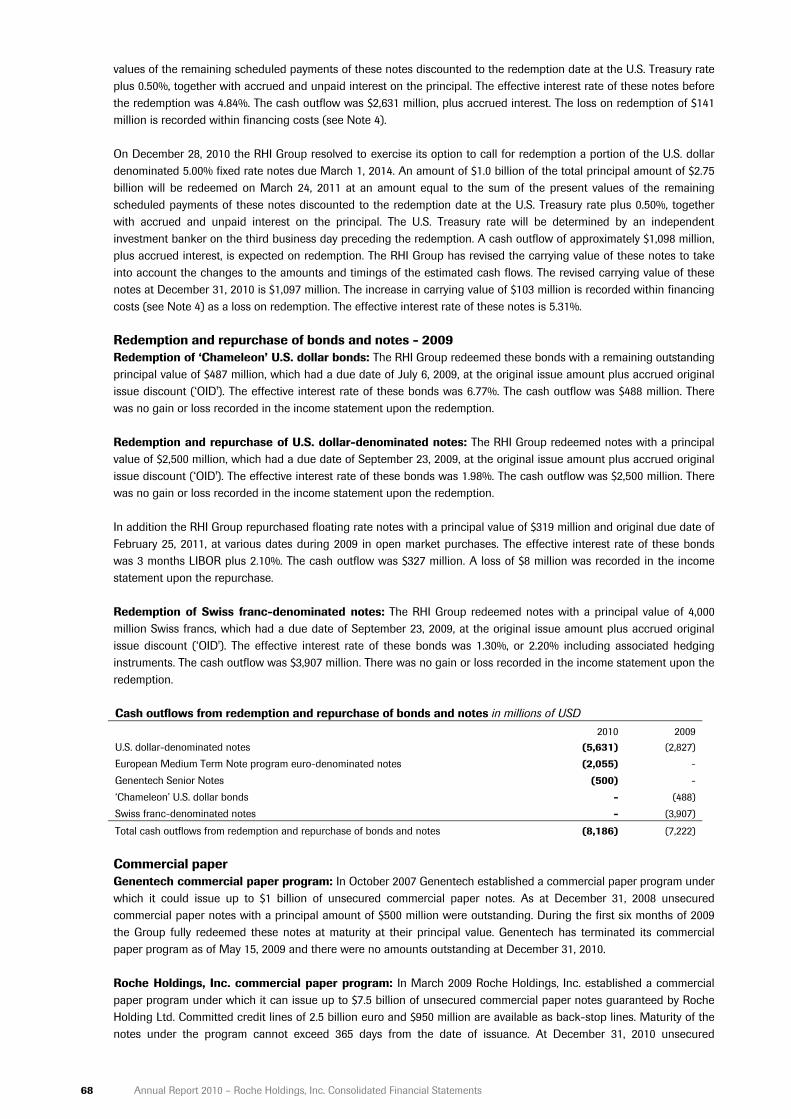
68 Annual Report 2010 – Roche Holdings, Inc. Consolidated Financial Statements
values of the remaining scheduled payments of these notes discounted to the redemption date at the U.S. Treasury rate plus 0.50%, together with accrued and unpaid interest on the principal. The effective interest rate of these notes before the redemption was 4.84%. The cash outflow was $2,631 million, plus accrued interest. The loss on redemption of $141 million is recorded within financing costs (see Note 4). On December 28, 2010 the RHI Group resolved to exercise its option to call for redemption a portion of the U.S. dollar denominated 5.00% fixed rate notes due March 1, 2014. An amount of $1.0 billion of the total principal amount of $2.75 billion will be redeemed on March 24, 2011 at an amount equal to the sum of the present values of the remaining scheduled payments of these notes discounted to the redemption date at the U.S. Treasury rate plus 0.50%, together with accrued and unpaid interest on the principal. The U.S. Treasury rate will be determined by an independent investment banker on the third business day preceding the redemption. A cash outflow of approximately $1,098 million, plus accrued interest, is expected on redemption. The RHI Group has revised the carrying value of these notes to take into account the changes to the amounts and timings of the estimated cash flows. The revised carrying value of these notes at December 31, 2010 is $1,097 million. The increase in carrying value of $103 million is recorded within financing costs (see Note 4) as a loss on redemption. The effective interest rate of these notes is 5.31%.
Redemption and repurchase of bonds and notes - 2009 Redemption of ‘Chameleon’ U.S. dollar bonds: The RHI Group redeemed these bonds with a remaining outstanding principal value of $487 million, which had a due date of July 6, 2009, at the original issue amount plus accrued original issue discount (‘OID'). The effective interest rate of these bonds was 6.77%. The cash outflow was $488 million. There was no gain or loss recorded in the income statement upon the redemption. Redemption and repurchase of U.S. dollar-denominated notes: The RHI Group redeemed notes with a principal value of $2,500 million, which had a due date of September 23, 2009, at the original issue amount plus accrued original issue discount (‘OID'). The effective interest rate of these bonds was 1.98%. The cash outflow was $2,500 million. There was no gain or loss recorded in the income statement upon the redemption. In addition the RHI Group repurchased floating rate notes with a principal value of $319 million and original due date of February 25, 2011, at various dates during 2009 in open market purchases. The effective interest rate of these bonds was 3 months LIBOR plus 2.10%. The cash outflow was $327 million. A loss of $8 million was recorded in the income statement upon the repurchase. Redemption of Swiss franc-denominated notes: The RHI Group redeemed notes with a principal value of 4,000 million Swiss francs, which had a due date of September 23, 2009, at the original issue amount plus accrued original issue discount (‘OID'). The effective interest rate of these bonds was 1.30%, or 2.20% including associated hedging instruments. The cash outflow was $3,907 million. There was no gain or loss recorded in the income statement upon the redemption. Cash outflows from redemption and repurchase of bonds and notes in millions of USD
2010 2009 U.S. dollar-denominated notes (5,631) (2,827) European Medium Term Note program euro-denominated notes (2,055) - Genentech Senior Notes (500) - ‘Chameleon’ U.S. dollar bonds - (488) Swiss franc-denominated notes - (3,907)
Total cash outflows from redemption and repurchase of bonds and notes (8,186) (7,222)
Commercial paper Genentech commercial paper program: In October 2007 Genentech established a commercial paper program under which it could issue up to $1 billion of unsecured commercial paper notes. As at December 31, 2008 unsecured commercial paper notes with a principal amount of $500 million were outstanding. During the first six months of 2009 the Group fully redeemed these notes at maturity at their principal value. Genentech has terminated its commercial paper program as of May 15, 2009 and there were no amounts outstanding at December 31, 2010. Roche Holdings, Inc. commercial paper program: In March 2009 Roche Holdings, Inc. established a commercial paper program under which it can issue up to $7.5 billion of unsecured commercial paper notes guaranteed by Roche Holding Ltd. Committed credit lines of 2.5 billion euro and $950 million are available as back-stop lines. Maturity of the notes under the program cannot exceed 365 days from the date of issuance. At December 31, 2010 unsecured

Annual Report 2010 – Roche Holdings, Inc. Consolidated Financial Statements 69
commercial paper notes with a principal of $177 million and an interest rate of 0.19% were outstanding. These amounts were due at various dates until January 7, 2011.
Movements in commercial paper obligations in millions of USD
2010 2009 At January 1 260 500 Net cash proceeds (payments) - Genentech commercial paper program - (500) - Roche Holdings, Inc. commercial paper program (83) 260
Total net cash proceeds (payments) (83) (240)
At December 31 177 260

70 Annual Report 2010 – Roche Holdings, Inc. Consolidated Financial Statements
Recognized liabilities due to related parties The movements of the amounts due to related parties are shown in the table below: Recognized liabilities due to related parties in millions of USD
2010 2009 2008 At January 1 9,815 7,817 4,664 Cash inflows from related parties 11,165 963 4,427 Cash outflows to related parties (5,765) (390) (1,274) IGEN capital contribution 27 - 1,425 -
At December 31 15,215 9,815 7,817
Effective interest
rate 2010 2009 2008 Term note 5.95% due June 7, 2010, principal $280 million 6.04% - 280 280 Term note 5.95% due October 15, 2010, principal $500 million 6.04% - 500 500 Term note 6.15% due December 16, 2011, principal $1.5 billion 6.25% 1,500 1,500 1,500 Term note 6.20% due September 17, 2012, principal $200 million 6.30% 200 250 250 Term note 6.20% due September 17, 2012, principal $250 million 6.29% 250 250 360 Term note 6.45% due July 17, 2014, principal $200 million 6.56% 200 500 500 Term note 5.80% due February 12, 2018, principal $1,4 billion 5.88% 1,400 1,400 1,400 Term note 5.80% due February 12, 2018, principal $2,0 billion 5.88% 2,000 2,000 2,000 Term note 4.50% due September 19, 2011, principal $800 million 4.55% 800 800 800 Term note 1.75% due January 19, 2009, principal $150 million 1.75% - - 150 Term note 2.10% due May 5, 2009, principal $55 million 2.11% - - 55 Term note 2.25% due March 15, 2010, principal $22 million 2.26% - 22 22 Term note 2.25% due March 15, 2010, principal $78 million 2.26% - 78 - Term note 2.25% due March 15, 2010, principal $10 million 2.26% - 10 - Term note 5.52% due March 14, 2014, principal $800 million 5.60% 800 800 - Term note 6.3% due June 25, 2010, principal $525 million 27 6.40% - 525 - Term note 5.70% due November 13, 2012, principal $900 million 27 5.78% 900 900 - Term note 5.79% due February 25, 2020 principal $1,500 million 5.88% 1,500 - - Term note 0.83% due March 15, 2011, principal $20 million 0.83% 20 - - Term note 0.83% due March 15, 2011, principal $45 million 0.83% 45 - - Term note 5.60% due June 8, 2020, principal $280 million 5.68% 280 - - Term note 0.96% due June 24, 2011, principal $420 million 0.96% 420 - - Term note 2.53% due September 3, 2014, principal $300 million 2.55% 300 - - Term note 0.60% due March 9, 2011, principal $1,750 million 0.60% 1,750 - - Term note 2.25% due March 14, 2014, principal $500 million 2.26% 500 - - Term note 0.59% due March 3, 2011, principal $600 million 0.59% 600 - - Term note 1.99% due January 6, 2014, principal $1,750 million 2.00% 1,750 - -
Total amounts due to related parties 15,215 9,815 7,817

Annual Report 2010 – Roche Holdings, Inc. Consolidated Financial Statements 71
Issues from related parties: Issues of new term notes from related parties are shown in the table below: Cash inflows from related parties in millions of USD
2010 2009 Term note 2.25% issued March 16, 2009 - 78 Term note 2.25% issued March 16, 2009 - 10 Term note 5.52% issued March 16, 2009 - 800 Term note 0.85% issued June 29, 2009 - 75 Term note 0.94% issued February 25, 2010 500 - Term note 5.79% issued February 25, 2010 1,500 - Term note 0.83% issued March 04, 2010 1,000 - Term note 0.83% issued March 15, 2010 100 - Term note 0.83% issued March 15, 2010 20 - Term note 0.83% issued March 15, 2010 45 - Term note 0.87% issued April 29, 2010 500 - Term note 5.60% issued June 7, 2010 280 - Term note 0.96% issued June 25, 2010 420 - Term note 2.53% issued September 03, 2010 300 - Term note 0.60% issued September 09, 2010 1,750 - Term note 0.53% issued October 06, 2010 1,750 - Term note 2.25% issued October 15, 2010 500 - Term note 0.46% issued November 02, 2010 150 - Term note 0.59% issued December 03, 2010 600 - Term note 1.99% issued December 06, 2010 1,750 -
Total cash inflows from related party issues 11,165 963 Payments to related parties: Payments of term notes to related parties are shown in the table below: Cash outflows to related party issues in millions of USD
2010 2009 Term note 6.20% due September 17, 2012, principal $360 million - 110 Term note 1.75% due January 19, 2009, principal $150 million - 150 Term note 2.10% due May 5, 2009, principal $55 million - 55 Term note 0.85% due September 29, 2009, principal $75 million - 75 Term note 2.25% due March 15, 2010, principal $22 million 22 - Term note 2.25% due March 15, 2010, principal $10 million 10 - Term note 2.25% due March 15, 2010, principal $78 million 78 - Term note 5.95% due June 7, 2010, principal $280 million 280 - Term note 6.40% due June 25, 2010, principal $525 million 525 - Term note 0.94% due September 15, 2010, principal $500 million 500 - Term note 0.87% due October 6, 2010, principal $500 million 500 - Term note 0.83% due October 15, 2010, principal $100 million 100 - Term note 5.95% due October 15, 2010, principal $500 million 500 - Term note 6.20% due September 17, 2012, principal $50 million 50 - Term note 0.83% due December 3, 2010, principal $1,000 million 1,000 - Term note 0.46% due December 3, 2010, principal $150 million 150 - Term note 0.53% due December 6, 2010, principal $1,750 million 1,750 - Term note 6.45% due July 17, 2014, principal $300 million 300 -
Total cash outflows to related party issues 5,765 390

72 Annual Report 2010 – Roche Holdings, Inc. Consolidated Financial Statements
27. Equity attributable to RHI shareholder
Changes in equity attributable to RHI shareholder in millions of USD
Share
capital Retained earnings
Fair value reserve
Hedging reserve Total
Year ended December 31, 2009 At January 1, 2009 1 7,127 65 7 7,200 Net income recognized in income statement - 816 - - 816 Available-for-sale investments - Valuation gains (losses) taken to equity - - 30 - 30 - Transferred to income statement on sale or impairment - - 4 - 4 - Income taxes - - (9) - (9) - Non-controlling interests - - (2) - (2) Cash flow hedges - Gains (losses) taken to equity - - - 1,924 1,924 - Transferred to income statement a) - - - (1,817) (1,817) - Transferred to the initial carrying value of hedged items - - - - - - Income taxes - - - (38) (38) - Non-controlling interests - - - (13) (13) Defined benefit post-employment plans - Actuarial gains (losses) 9 - (43) - - (43) - Income taxes - 38 - - 38 - Non-controlling interests - - - - -
Other comprehensive income, net of tax - (5) 23 56 74
Total comprehensive income - 811 23 56 890 Capital contribution related parties 27 - 382 - - 382 Dividends paid - - - - - Equity compensation plans - 297 - - 297 Changes in ownership interests in subsidiaries - Genentech 3 - (39,050) - - (39,050) - Memory 6 - (1) - - (1) Changes in non-controlling interests - (15) - - (15)
At December 31, 2009 1 (30,449) 88 63 (30,297)
a) Of amounts transferred to income statement losses of $11 million (2008: losses of $80 million) were reported as ‘Royalties and other operating income’ and gains of $1,828 million (2008: gains of $3 million) as ‘Financial income’.

Annual Report 2010 – Roche Holdings, Inc. Consolidated Financial Statements 73
Changes in equity attributable to RHI shareholder in millions of USD
Share
capital Retained earnings
Fair value reserve
Hedging reserve Total
Year ended December 31, 2010 At January 1, 2010 1 (30,449) 88 63 (30,297) Net income recognized in income statement - 2,104 - - 2,104 Available-for-sale investments - Valuation gains (losses) taken to equity - - 90 - 90 - Transferred to income statement on sale or impairment - - (98) - (98)- Income taxes - - 4 - 4Cash flow hedges - Gains (losses) taken to equity - - - (1,316) (1,316)- Transferred to income statement a) - - - 1,029 1,029 - Transferred to the initial carrying value of hedged items - - - - -- Income taxes - - - 103 103 Defined benefit post-employment plans - Actuarial gains (losses) 9 - 20 - - 20 - Income taxes - (7) - (7)
Other comprehensive income, net of tax - 13 (4) (184) (175)
Total comprehensive income - 2,117 (4) (184) 1,929 Dividends paid - - - - -Equity compensation plans - 222 - - 222 Other movements - (75) 53 22 -
At December 31, 2010 1 (28,185) 137 (99) (28,146)a) Of amounts transferred to income statement gains of $28 million (2009: losses of $11 million) were reported as ‘Royalties and other operating income’ and losses of $1,057 million (2009: gains of $1,828 million) as ‘Financial income’
The RHI Group completed the purchase of the non-controlling interests in Genentech effective March 26, 2009 (see Note 3). Based on the revised International Accounting Standard 27 ‘Consolidated and Separate Financial Statements’ (IAS 27), which was adopted by RHI in 2008, this transaction was accounted for in full as an equity transaction. As a consequence, the carrying amount of the consolidated equity of the RHI Group was reduced by approximately $47 billion, of which $7.6 billion was allocated to eliminate the book value of Genentech non-controlling interests and at December 31, 2010 the RHI Group had a negative equity of $28.1 billion (December 31, 2009: $30.3 billion). The capacity of the RHI Group to generate positive cash flows and operating profit is not affected by this accounting treatment. Share capital As of December 31, 2010 the authorized and issued share capital of Roche Holdings, Inc., which is the RHI Group’s parent company, consisted of 1,000 shares with a nominal value of $1,000 each, as in the preceding year. All the shares are indirectly owned by Roche Holding Ltd, a public company registered in Switzerland. Own equity instruments The RHI Group holds none of its own equity shares. Reserves Fair value reserve: The fair value reserve represents the cumulative net change in the fair value of available-for-sale financial assets until the asset is sold, impaired or otherwise disposed. Hedging reserve: The hedging reserve represents the effective portion of the cumulative net change in the fair value of cash flow hedging instruments related to hedged transactions that have not yet occurred. Capital contributions related parties - 2009 IGEN: On January 1, 2009 the shareholder of Roche Holdings, Inc. contributed the Roche Group's investment in IGEN International, Inc. to RHI as a capital contribution. As a result, RHI obtained a 100% controlling interest in IGEN International, Inc. and its subsidiary BioVeris Corporation effective January 1, 2009. The contributed goodwill was $1,431

74 Annual Report 2010 – Roche Holdings, Inc. Consolidated Financial Statements
million, intangible assets $444 million, recognized liabilities due to related parties $1,425 million and other net liabilities of $158 million. Their combined recognized net assets at January 1, 2009 were $384 million, which were reported as an addition of retained earnings in equity. These two companies are reported as part of the Diagnostics operating segment. Innovatis Inc: Effective July 1, 2009, Innovatis AG, a subsidiary of the Roche Group, sold to RHI their 100% ownership of Innovatis Inc, at a nominal prize. Innovatis Inc. was subsequently merged into Roche Diagnostics Corporation, which is part of the Diagnostics operating segment. The fair value of the net liabilities was $2 million, which was shown as a reduction of equity.
28. Non-controlling interests
Changes in equity attributable to non-controlling interests in millions of USD 2010 2009
At January 1 - 6,991 Net income recognized in income statement - Genentech 3 - 375
Total net income recognized in income and expense - 375 Available-for-sale investments - 2 Cash flow hedges - 13
Other comprehensive income, net of tax - 15
Total comprehensive income - 390 Memory acquisition 6 - 4 Equity compensation plans - 154 Changes in ownership interests in subsidiaries - Genentech - (7,550) - Memory 6 - (4) Changes in non-controlling interests - 15
At December 31 - -

Annual Report 2010 – Roche Holdings, Inc. Consolidated Financial Statements 75
29. Statement of cash flows
Cash flows from operating activities Cash flows from operating activities arise from the RHI Group’s primary activities in the Pharmaceuticals and Diagnostics businesses. These are calculated by the indirect method by adjusting RHI’s operating profit for any operating income and expenses that are not cash flows (for example depreciation, amortization and impairment) in order to derive the cash generated from operations. This and other operating cash flows are shown in the statement of cash flows. Operating cash flows also include income taxes paid on all activities. Cash generated from operations in millions of USD
2010 2009 Net income 2,104 1,191 Add back non-operating (income) expense - Financial income 4 (261) 724 - Financial income – related parties 31 (55) (979) - Financing costs 4 2,098 1,884 - Financing costs – related parties 31 992 848 - Income taxes 5 1,258 179
Operating profit 6,136 3,847 Depreciation of property, plant and equipment 11 633 728 Amortization of intangible assets 13 246 304 Impairment of intangible assets 13 243 463 Impairment of property, plant and equipment 11 59 861 Operating expenses for defined benefit post-employment plans 9 30 68 Operating expenses for equity-settled equity compensation plans 10 203 428 Net (income) expense for provisions 24 998 1,035 Bad debt expense 9 (1) Inventory write-downs 226 27 Other adjustments (2) 19
Cash generated from operations 8,781 7,779 Cash flows from investing activities Cash flows from investing activities are principally those arising from the RHI Group’s investments in property, plant and equipment and intangible assets, and from the acquisition and divestments of subsidiaries. Cash flows connected with the RHI Group’s portfolio of marketable securities and other investments are also included, as are any interest and dividend payments received in respect of these securities and investments. These cash flows indicate the RHI Group’s net reinvestment in its operating assets and the cash flow effects of business combinations and divestments, as well as the cash generated by the RHI Group’s other investments. Cash flows from financing activities Cash flows from financing activities are primarily the proceeds from the issue and repayment of the RHI Group’s equity and debt instruments. They also include interest payments and dividend payments on these instruments. Cash flows from short-term financing, including finance leases, are also included. These cash flows indicate the RHI Group’s transactions with the providers of its equity and debt financing. Cash flows from short-term borrowings are shown as a net movement, as these consist of a large number of transactions with short maturity. Significant non-cash transactions 2010: There were no significant non-cash transactions. 2009: In connection with the sale of the subsidiary Genentech Bermuda Ltd., together with its fully-controlled subsidiary, Genentech Singapore, Pte. Ltd. there was a non-cash decrease of $284 million for the financing obligation for the Singapore Lonza facility and a similar non-cash decrease in the capitalized construction in progress. For further information see Note 33.

76 Annual Report 2010 – Roche Holdings, Inc. Consolidated Financial Statements
30. Risk management
RHI Group risk management Risk management is a fundamental element of the Roche Group business practice on all levels and encompasses different types of risks. At a Roche Group level risk management is an integral part of the business planning and controlling processes. Material risks are monitored and regularly discussed with the Corporate Executive Committee and the Audit Committee of the Board of Directors of Roche Holding Ltd. Financial risk management The RHI Group is exposed to various financial risks arising from its underlying operations and corporate finance activities. The RHI Group’s financial risk exposures are predominantly related to changes in interest rates, equity prices and to an extent, foreign exchange rates, as well as the creditworthiness and the solvency of RHI's counterparties. Financial risk management within the Roche Group is governed by policies reviewed by the boards of directors of Roche Holding Ltd. as appropriate to their areas of statutory responsibility. These policies cover credit risk, liquidity risk and market risk. The policies provide guidance on risk limits, type of authorized financial instruments and monitoring procedures. As a general principle, the policies prohibit the use of derivative financial instruments for speculative trading purposes. Policy implementation and day-to-day risk management are carried out by the relevant treasury functions; and regular reporting on these risks is performed by the relevant accounting and controlling functions within Roche Group.
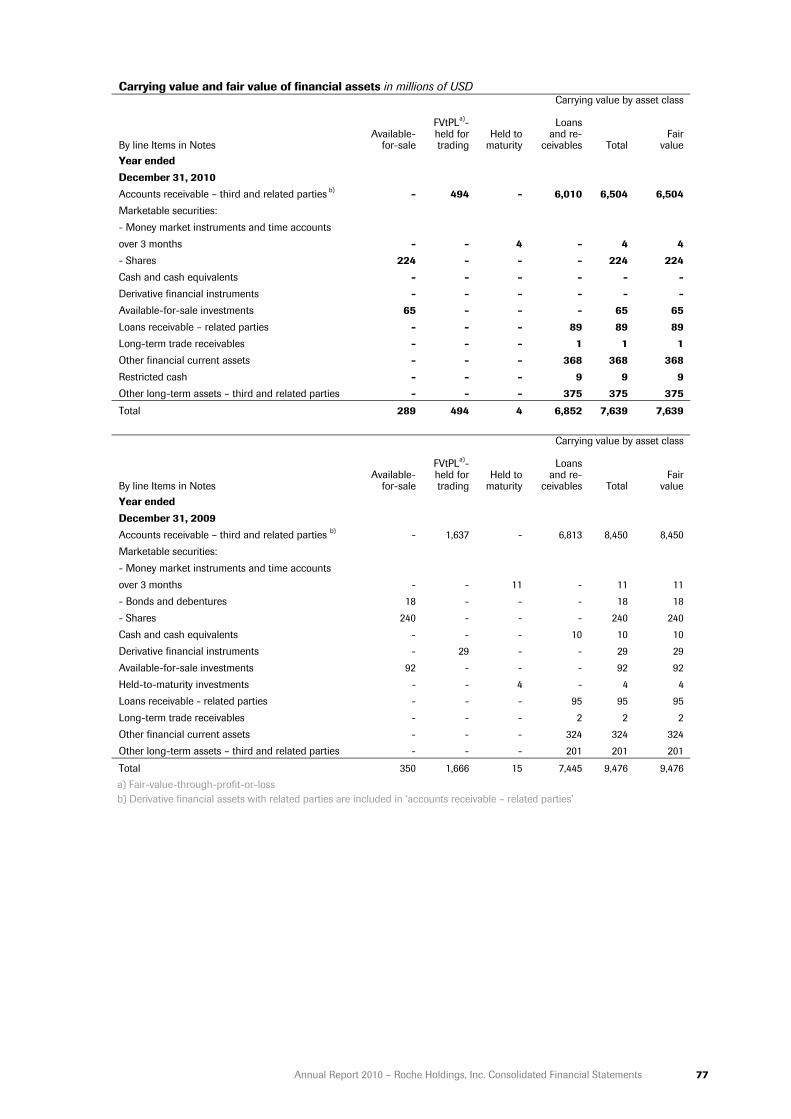
Annual Report 2010 – Roche Holdings, Inc. Consolidated Financial Statements 77
Carrying value and fair value of financial assets in millions of USD
Carrying value by asset class
By line Items in Notes Available-
for-sale
FVtPLa)- held for trading
Held to maturity
Loans and re-
ceivables Total Fair
value Year ended December 31, 2010 Accounts receivable – third and related parties b) - 494 - 6,010 6,504 6,504 Marketable securities: - Money market instruments and time accounts over 3 months
-
- 4 - 4 4- Shares 224 - - - 224 224 Cash and cash equivalents - - - - - -Derivative financial instruments - - - - - -Available-for-sale investments 65 - - - 65 65 Loans receivable – related parties - - - 89 89 89 Long-term trade receivables - - - 1 1 1Other financial current assets - - - 368 368 368 Restricted cash - - - 9 9 9Other long-term assets – third and related parties - - - 375 375 375
Total 289 494 4 6,852 7,639 7,639
Carrying value by asset class
By line Items in Notes Available-
for-sale
FVtPLa)- held for trading
Held to maturity
Loans and re-
ceivables Total Fair
value Year ended December 31, 2009 Accounts receivable – third and related parties b) - 1,637 - 6,813 8,450 8,450 Marketable securities: - Money market instruments and time accounts over 3 months
-
- 11 - 11 11 - Bonds and debentures 18 - - - 18 18 - Shares 240 - - - 240 240 Cash and cash equivalents - - - 10 10 10 Derivative financial instruments - 29 - - 29 29 Available-for-sale investments 92 - - - 92 92 Held-to-maturity investments - - 4 - 4 4 Loans receivable - related parties - - - 95 95 95 Long-term trade receivables - - - 2 2 2 Other financial current assets - - - 324 324 324 Other long-term assets – third and related parties - - - 201 201 201
Total 350 1,666 15 7,445 9,476 9,476 a) Fair-value-through-profit-or-loss b) Derivative financial assets with related parties are included in ‘accounts receivable – related parties’
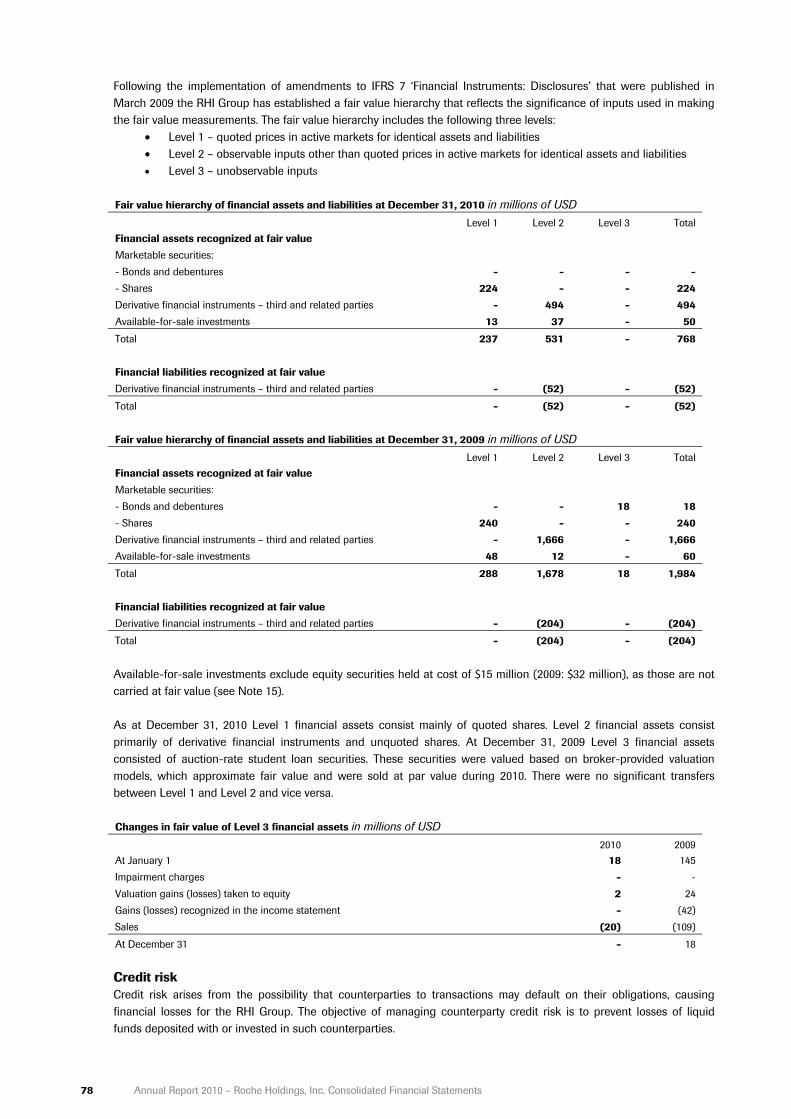
78 Annual Report 2010 – Roche Holdings, Inc. Consolidated Financial Statements
Following the implementation of amendments to IFRS 7 ‘Financial Instruments: Disclosures’ that were published in March 2009 the RHI Group has established a fair value hierarchy that reflects the significance of inputs used in making the fair value measurements. The fair value hierarchy includes the following three levels:
• Level 1 – quoted prices in active markets for identical assets and liabilities • Level 2 – observable inputs other than quoted prices in active markets for identical assets and liabilities • Level 3 – unobservable inputs
Fair value hierarchy of financial assets and liabilities at December 31, 2010 in millions of USD
Level 1 Level 2 Level 3 Total Financial assets recognized at fair value Marketable securities: - Bonds and debentures - - - -- Shares 224 - - 224 Derivative financial instruments – third and related parties - 494 - 494 Available-for-sale investments 13 37 - 50
Total 237 531 - 768 Financial liabilities recognized at fair value Derivative financial instruments – third and related parties - (52) - (52)
Total - (52) - (52) Fair value hierarchy of financial assets and liabilities at December 31, 2009 in millions of USD
Level 1 Level 2 Level 3 Total Financial assets recognized at fair value Marketable securities: - Bonds and debentures - - 18 18 - Shares 240 - - 240 Derivative financial instruments – third and related parties - 1,666 - 1,666 Available-for-sale investments 48 12 - 60
Total 288 1,678 18 1,984 Financial liabilities recognized at fair value Derivative financial instruments – third and related parties - (204) - (204)
Total - (204) - (204)
Available-for-sale investments exclude equity securities held at cost of $15 million (2009: $32 million), as those are not carried at fair value (see Note 15).
As at December 31, 2010 Level 1 financial assets consist mainly of quoted shares. Level 2 financial assets consist primarily of derivative financial instruments and unquoted shares. At December 31, 2009 Level 3 financial assets consisted of auction-rate student loan securities. These securities were valued based on broker-provided valuation models, which approximate fair value and were sold at par value during 2010. There were no significant transfers between Level 1 and Level 2 and vice versa.
Changes in fair value of Level 3 financial assets in millions of USD
2010 2009 At January 1 18 145 Impairment charges - - Valuation gains (losses) taken to equity 2 24 Gains (losses) recognized in the income statement - (42) Sales (20) (109)
At December 31 - 18
Credit risk Credit risk arises from the possibility that counterparties to transactions may default on their obligations, causing financial losses for the RHI Group. The objective of managing counterparty credit risk is to prevent losses of liquid funds deposited with or invested in such counterparties.

Annual Report 2010 – Roche Holdings, Inc. Consolidated Financial Statements 79
The maximum exposure to credit risk resulting from financial activities, without considering netting agreements and without taking account of any collateral held or other credit enhancements, is equal to the carrying value of RHI’s financial assets. Trade receivables: These are subject to a policy of active credit risk management which focuses on the assessment of credit availability, ongoing credit evaluation and account monitoring procedures. The objective of the management of trade receivables from third parties is to sustain the growth and profitability of the RHI Group by optimizing asset utilization whilst maintaining risks at an acceptable level. Except as noted below, there is no significant concentration of counterparty credit risk due to the RHI Group’s large number of customers. Risk limits and exposures are continuously monitored. Additionally, the RHI Group obtains credit insurance and similar enhancements when appropriate to protect the collection of trade receivables. As at December 31, 2010 no collateral was held for loans and receivables at the end of 2010 (2009: none). At December 31, 2010 the RHI Group’s combined trade accounts receivable balance with three national wholesale distributors, AmerisourceBergen Corp., Cardinal Health Inc. and McKesson Corp., was $1,217 million representing 65% of RHI’s consolidated third party trade accounts receivables (2009: $1,299 million representing 70%). Nature and geographical location of trade receivables (not overdue) counterparties in millions of USD
2010 2009
Total Public
Whole-salers/dis-
tributors Private Total Public
Whole-salers/dis-
tributors Private Switzerland 1 - 1 - - - - - European Union - - - - 1 - 1 - Rest of Europe 1 - - 1 - - - - North America 1,680 9 1,399 272 1,816 10 1,160 646 Japan 49 - 49 - 50 - 50 - Rest of Asia - - - - - - - -
Total 1,731 9 1,449 273 1,867 10 1,211 646 In addition to third party trade receivable, the RHI Group had $4.7 billion accounts receivable balances with related parties mainly in the European Union and Switzerland (2009: $6.6 billion). Analysis of overdue but not impaired financial assets by class in millions of USD
Total amount overdue
Under 1 month
1-3months
4-6 months
6-12 months
more than 1 year
Year ended December 31, 2010 Loans and receivables 38 9 18 10 1 -Year ended December 31, 2009 Loans and receivables 29 17 4 6 2 - As at December 31, 2010 there were no financial assets whose terms have been renegotiated (2009: none). Liquidity risk Liquidity risk arises through a surplus of financial obligations over available financial assets due at any point in time. RHI’s approach to liquidity risk is to maintain sufficient readily available reserves in order to meet its liquidity requirements at any point in time. Roche enjoys strong credit quality and is rated by at least one major credit rating agency. The ratings will permit efficient access to the international capital markets in the event of major financing requirements. In addition, the RHI Group has unused committed credit lines with various financial institutions totaling $4.3 billion (2009: $4.5 billion).

80 Annual Report 2010 – Roche Holdings, Inc. Consolidated Financial Statements
Contractual maturity analysis of financial liabilities in millions of USD
Total 0-3
months 4-6
months 7-12
months 1-2
years 2-3
years 3-4
years 4-5
years Over 5years
Year ended December 31, 2010 Total debt a) 61,346 5,861 556 2,912 5,918 8,722 6,710 4,256 26,411 Trade payables 437 435 - 2 - - - - -Accruals 2,617 1,868 586 125 38 - - - -Derivative financial instruments related parties 52 45 - 7 - - - - -Other liabilities: current and non-current 131 64 29 - 34 3 - - 1
Total financial liabilities 64,583 8,273 1,171 3,046 5,990 8,725 6,710 4,256 26,412 Year ended December 31, 2009 Total debt a) 67,312 6,971 990 1,696 5,440 8,325 9,340 5,447 29,103 Trade payables 528 527 1 - - - - - - Accruals 2,979 2,677 130 155 17 - - - - Derivative financial instruments related parties 204 204 - - - - - - - Other liabilities: current and non-current 140 58 28 1 49 1 1 1 1
Total financial liabilities 71,163 10,437 1,149 1,852 5,506 8,326 9,341 5,448 29,104
a) Total debt in the above table shows undiscounted cash flows, whereas the carrying value in the consolidated balance sheet reflects
discounted cash flows. Market risk Market risk arises from changing market prices of RHI’s financial assets or financial liabilities. Market risk may affect RHI’s financial result and the value of RHI’s equity. Roche uses Value-at-Risk (VaR) to measure the impact of market risk on its financial instruments. Roche has defined VaR limits to manage market risk. VaR data are reported on a monthly basis and indicate the value range within which a given financial instrument will fluctuate with a pre-set probability as a result of movements in market prices. VaR is a statistical measure which implicitly assumes that value changes of the recent past are indicative of value changes in the future. VaR figures do not represent actual or expected losses, or possible worst-case losses over the stated period. Also, VaR does not consider any effects of favorable market movements. VaR figures are calculated using a historical simulation approach. For each scenario, all financial instruments are fully valued and the total change in value and earnings is determined. All VaR calculations are based on a 95% confidence level and a holding period of 20 trading days over the past ten years. This holding period reflects the time required to change the corresponding risk exposure, should this be deemed appropriate. Longer holding periods increase the probability of higher value changes and lead to increased VaR figures. Actual future gains and losses associated with our treasury activities may differ materially from the VaR analyses performed due to the inherent limitations associated with predicting the timing and amount of changes to interest rates, foreign currency exchanges rates and equity investment prices, particularly in periods of high market volatilities. Furthermore, the VaR numbers below do not include the effect of changes in credit spreads. Market risk of financial instruments in millions of USD
December 31,
2010 December 31,
2009 VaR - Foreign exchange component 14 16 VaR - Interest rate component 654 801 VaR - Other price component 24 32 Diversification (33) (40)
VaR - Total market risk 659 809

Annual Report 2010 – Roche Holdings, Inc. Consolidated Financial Statements 81
At December 31, 2010, the total VaR of the financial assets and liabilities was $659 million (2009: $809 million). The interest rate VaR decreased to $654 million reflecting the ageing of debt and the repayment of debt during 2010. As all issued debt is held at amortized cost, the interest rate VaR is a sole metric for economic fair value changes, but there is no impact on the carrying value or profit and loss of the Group. The foreign exchange VaR remained stable. Other price risk arises mainly from movements in the prices of equity securities and declined as equity securities holdings were reduced. At December 31, 2010, the RHI Group held equity securities with a market value of $0.3 billion (December 31, 2009: $0.3 billion). This includes holdings in biotechnology companies, which were acquired in the context of licensing transactions or scientific collaborations. Foreign exchange risk The RHI Group is exposed to movements in foreign currencies affecting its financial result and the value of RHI’s equity. Foreign exchange risk arises because the amount of local currency paid or received for transactions denominated in foreign currencies may vary due to changes in exchange rates (transaction exposures). The objective of RHI’s foreign exchange risk management activities is to preserve the economic value of its current and future assets and to minimize the volatility of RHI’s financial result. The primary focus of RHI’s foreign exchange risk management activities is on hedging transaction exposures arising through foreign currency flows or monetary positions held in foreign currencies. The RHI Group does not currently hedge translation exposures using financial instruments. RHI monitors transaction exposures on a daily basis. The net foreign exchange result and the corresponding VaR parameters are reported on a monthly basis. RHI uses forward contracts, foreign exchange options and cross-currency swaps to hedge transaction exposures. Application of these instruments intends to continuously lock in favorable developments of foreign exchange rates, thereby reducing the exposure to potential future movements in such rates. Interest rate risk Interest rate risk arises from movements in interest rates which could affect RHI’s financial result or the value of RHI’s equity. Changes in interest rates may cause variations in interest income and expense. In addition, they may affect the market value of certain financial assets, liabilities and hedging instruments. The primary objective of RHI’s interest rate management is to protect the net interest result. Interest rate exposures and the corresponding VaR parameters are reported on a monthly basis. RHI uses forward contracts, options and swaps to hedge its interest rate exposures. Depending on the interest rate environment of the major currencies, RHI will use these instruments to generate the appropriate mix of fixed and floating rate exposures. Other price risk Other price risk arises mainly from movements in the prices of equity securities held by RHI. In 2010, the RHI Group held equity securities with a market value of $0.3 billion (2009: $0.3 billion). This amount includes holdings in biotechnology companies, which were acquired in the context of licensing transactions or scientific collaborations. Due to the nature of their business, biotechnology companies are exposed to greater equity volatilities than general stock market fluctuations. RHI manages the price risk through placing limits on individual and total equity investments. These limits are defined both as a percentage of total liquid funds and as an absolute number for individual equity investments. Impairment of financial assets In 2010 impairments of investments were $2 million (2009: $4 million). Impairment losses by asset classes in millions of USD
2010 2009 Loans and receivables (9) 1 Available-for-sale financial assets - Shares - - - Investments (2) (4)
Total impairment losses (11) (3)

82 Annual Report 2010 – Roche Holdings, Inc. Consolidated Financial Statements
Capital The RHI Group defines the capital that it manages as RHI’s total capitalization, being the sum of debt plus equity, including non-controlling interests. RHI’s objectives when managing capital are: • To safeguard RHI’s ability to continue as a going concern, so that it can continue to provide benefits for patients
and returns to investors. • To provide an adequate return to investors based on the level of risk undertaken. • To have available the necessary financial resources to allow the RHI Group to invest in areas that may deliver future
benefits for patients and returns to investors. • To maintain sufficient financial resources to mitigate against risks and unforeseen events. Effective March 26, 2009, the purchase of the non-controlling interests in Genentech was completed (see Note 3). Based on the revised International Accounting Standard 27 ‘Consolidated and Separate Financial Statements’ (IAS 27), which was adopted by RHI in 2008, this transaction was accounted for in full as an equity transaction. As a consequence, the carrying amount of the consolidated equity of the RHI Group was reduced by approximately $47 billion, of which $7.6 billion was allocated to eliminate the book value of Genentech non-controlling interests. At December 31, 2010 the negative equity of the RHI Group was reduced from $30.3 billion to $28.1. The capacity of the RHI Group to generate positive cash flows and operating profit is not affected by this accounting treatment. Capital is monitored on the basis of the capitalization, which is calculated as being debt plus equity (including non-controlling interests). This is reported to senior management as part of the RHI Group’s regular internal management reporting. RHI’s capitalization is shown in the table below. Capital in millions of USD
2010 2009 2008 Capital and reserves attributable to RHI shareholder 27 (28,146) (30,297) 7,200 Equity attributable to non-controlling interests 28 - - 6,991
Total equity (28,146) (30,297) 14,191 Total debt 26 45,212 48,756 11,228 Capitalization 17,066 18,459 25,419 The RHI Group is not subject to regulatory capital adequacy requirements as known in the financial services industry.
31. Related parties
Controlling shareholders Roche Finance Ltd (Roche Finanz AG), a Swiss corporation, owns all of the issued and outstanding shares of Roche Holdings, Inc. Roche Finance Ltd is a wholly owned, direct subsidiary of Roche Holding Ltd, a public company in Switzerland. As a member of the Roche Group, all of the RHI Group’s related party transactions are with Roche Group affiliates. The transactions include purchases of inventory and other materials, sales of inventory and other materials, allocation of research and development costs under cost-sharing agreements and collaborations, allocation of marketing and distribution costs under cost-sharing agreements, allocations of other expenses attributable to the U.S. business, and the payment and receipt of royalties.
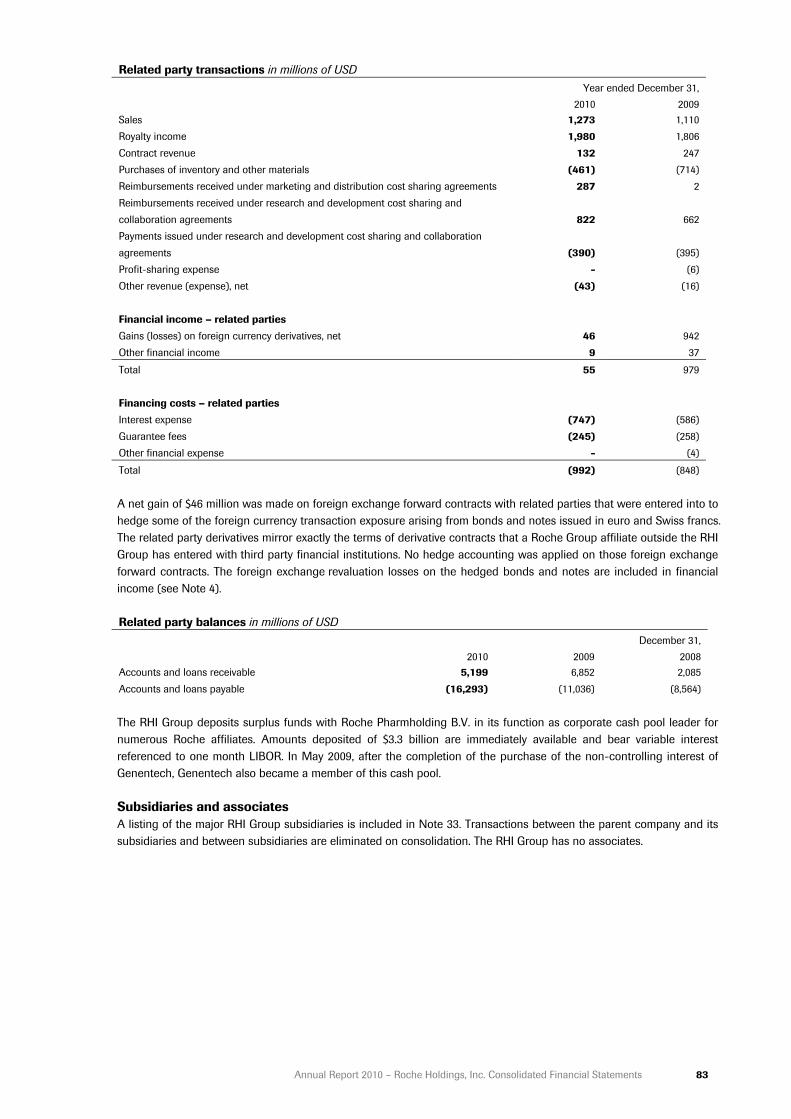
Annual Report 2010 – Roche Holdings, Inc. Consolidated Financial Statements 83
A net gain of $46 million was made on foreign exchange forward contracts with related parties that were entered into to hedge some of the foreign currency transaction exposure arising from bonds and notes issued in euro and Swiss francs. The related party derivatives mirror exactly the terms of derivative contracts that a Roche Group affiliate outside the RHI Group has entered with third party financial institutions. No hedge accounting was applied on those foreign exchange forward contracts. The foreign exchange revaluation losses on the hedged bonds and notes are included in financial income (see Note 4). Related party balances in millions of USD
December 31, 2010 2009 2008
Accounts and loans receivable 5,199 6,852 2,085 Accounts and loans payable (16,293) (11,036) (8,564) The RHI Group deposits surplus funds with Roche Pharmholding B.V. in its function as corporate cash pool leader for numerous Roche affiliates. Amounts deposited of $3.3 billion are immediately available and bear variable interest referenced to one month LIBOR. In May 2009, after the completion of the purchase of the non-controlling interest of Genentech, Genentech also became a member of this cash pool. Subsidiaries and associates A listing of the major RHI Group subsidiaries is included in Note 33. Transactions between the parent company and its subsidiaries and between subsidiaries are eliminated on consolidation. The RHI Group has no associates.
Related party transactions in millions of USD Year ended December 31, 2010 2009
Sales 1,273 1,110 Royalty income 1,980 1,806 Contract revenue 132 247 Purchases of inventory and other materials (461) (714) Reimbursements received under marketing and distribution cost sharing agreements 287 2 Reimbursements received under research and development cost sharing and collaboration agreements 822 662 Payments issued under research and development cost sharing and collaboration agreements (390) (395) Profit-sharing expense - (6) Other revenue (expense), net (43) (16) Financial income – related parties Gains (losses) on foreign currency derivatives, net 46 942 Other financial income 9 37
Total 55 979 Financing costs – related parties Interest expense (747) (586) Guarantee fees (245) (258) Other financial expense - (4)
Total (992) (848)
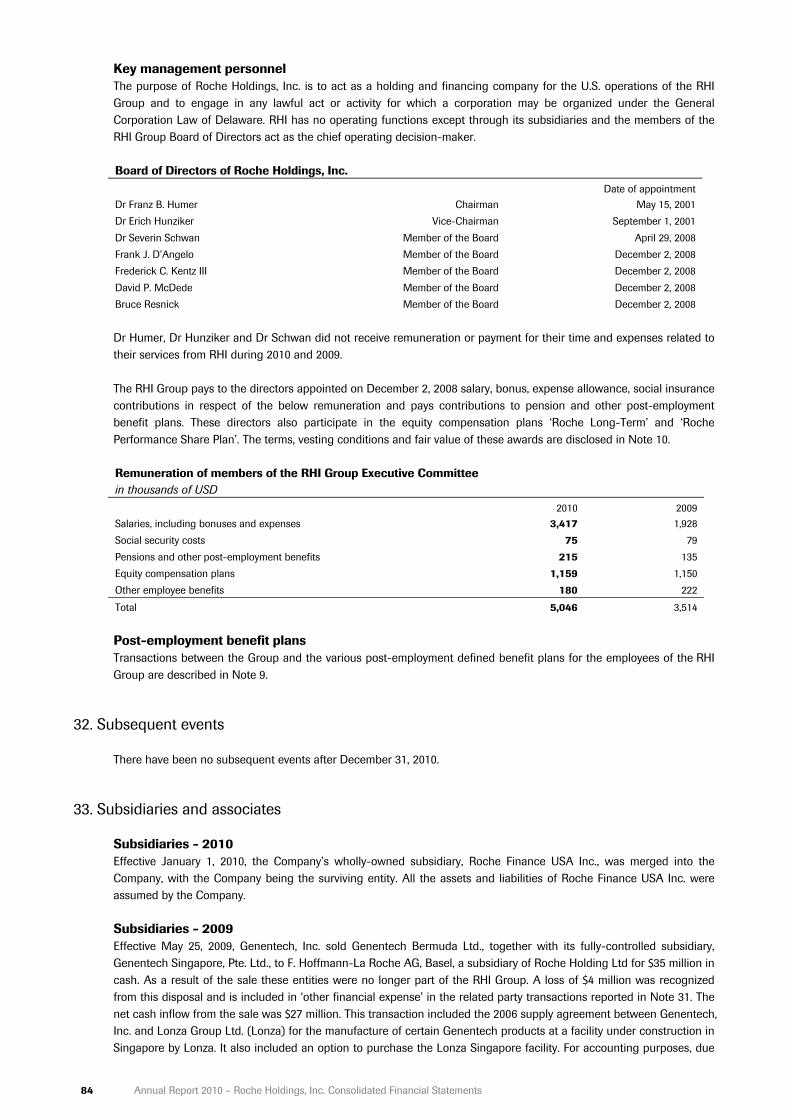
84 Annual Report 2010 – Roche Holdings, Inc. Consolidated Financial Statements
Key management personnel The purpose of Roche Holdings, Inc. is to act as a holding and financing company for the U.S. operations of the RHI Group and to engage in any lawful act or activity for which a corporation may be organized under the General Corporation Law of Delaware. RHI has no operating functions except through its subsidiaries and the members of the RHI Group Board of Directors act as the chief operating decision-maker. Board of Directors of Roche Holdings, Inc.
Date of appointment Dr Franz B. Humer Chairman May 15, 2001 Dr Erich Hunziker Vice-Chairman September 1, 2001 Dr Severin Schwan Member of the Board April 29, 2008 Frank J. D’Angelo Member of the Board December 2, 2008 Frederick C. Kentz III Member of the Board December 2, 2008 David P. McDede Member of the Board December 2, 2008 Bruce Resnick Member of the Board December 2, 2008 Dr Humer, Dr Hunziker and Dr Schwan did not receive remuneration or payment for their time and expenses related to their services from RHI during 2010 and 2009. The RHI Group pays to the directors appointed on December 2, 2008 salary, bonus, expense allowance, social insurance contributions in respect of the below remuneration and pays contributions to pension and other post-employment benefit plans. These directors also participate in the equity compensation plans ‘Roche Long-Term’ and ‘Roche Performance Share Plan’. The terms, vesting conditions and fair value of these awards are disclosed in Note 10. Remuneration of members of the RHI Group Executive Committee in thousands of USD
2010 2009 Salaries, including bonuses and expenses 3,417 1,928 Social security costs 75 79 Pensions and other post-employment benefits 215 135 Equity compensation plans 1,159 1,150 Other employee benefits 180 222
Total 5,046 3,514 Post-employment benefit plans Transactions between the Group and the various post-employment defined benefit plans for the employees of the RHI Group are described in Note 9.
32. Subsequent events
There have been no subsequent events after December 31, 2010.
33. Subsidiaries and associates
Subsidiaries - 2010 Effective January 1, 2010, the Company’s wholly-owned subsidiary, Roche Finance USA Inc., was merged into the Company, with the Company being the surviving entity. All the assets and liabilities of Roche Finance USA Inc. were assumed by the Company.
Subsidiaries - 2009 Effective May 25, 2009, Genentech, Inc. sold Genentech Bermuda Ltd., together with its fully-controlled subsidiary, Genentech Singapore, Pte. Ltd., to F. Hoffmann-La Roche AG, Basel, a subsidiary of Roche Holding Ltd for $35 million in cash. As a result of the sale these entities were no longer part of the RHI Group. A loss of $4 million was recognized from this disposal and is included in ‘other financial expense’ in the related party transactions reported in Note 31. The net cash inflow from the sale was $27 million. This transaction included the 2006 supply agreement between Genentech, Inc. and Lonza Group Ltd. (Lonza) for the manufacture of certain Genentech products at a facility under construction in Singapore by Lonza. It also included an option to purchase the Lonza Singapore facility. For accounting purposes, due
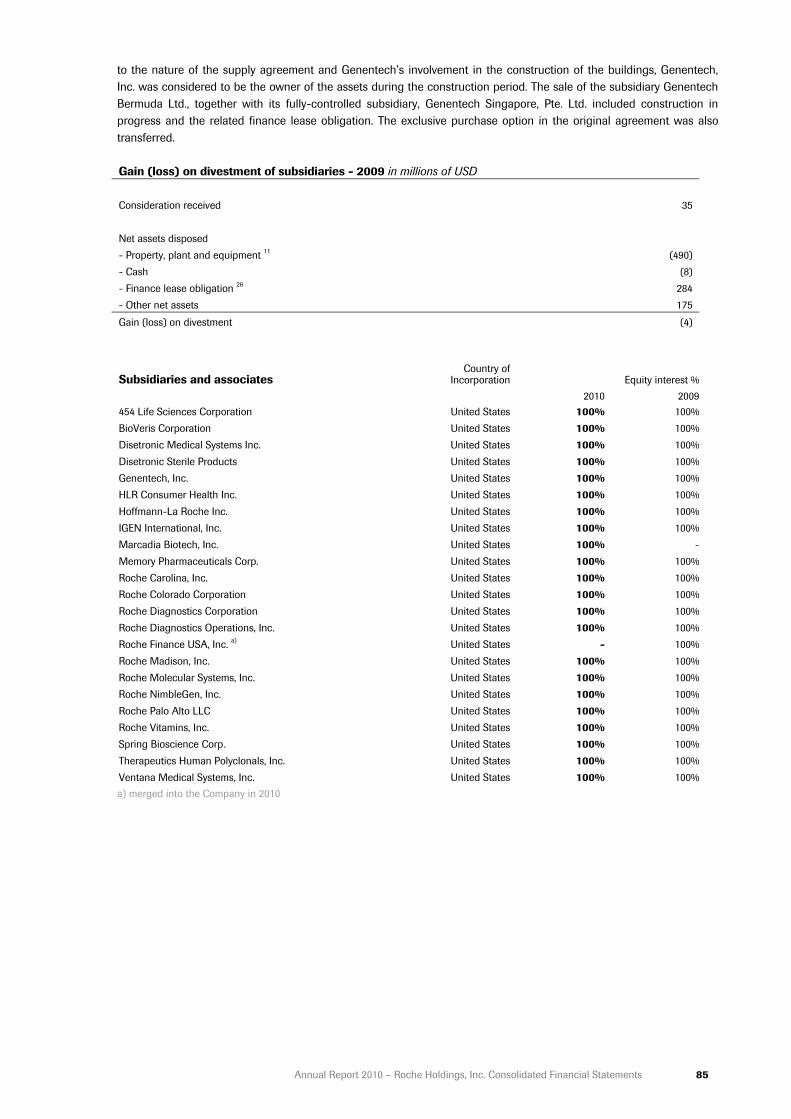
Annual Report 2010 – Roche Holdings, Inc. Consolidated Financial Statements 85
to the nature of the supply agreement and Genentech’s involvement in the construction of the buildings, Genentech, Inc. was considered to be the owner of the assets during the construction period. The sale of the subsidiary Genentech Bermuda Ltd., together with its fully-controlled subsidiary, Genentech Singapore, Pte. Ltd. included construction in progress and the related finance lease obligation. The exclusive purchase option in the original agreement was also transferred. Gain (loss) on divestment of subsidiaries - 2009 in millions of USD
Consideration received 35 Net assets disposed - Property, plant and equipment 11 (490) - Cash (8) - Finance lease obligation 26 284 - Other net assets 175
Gain (loss) on divestment (4)
Subsidiaries and associates Country of
Incorporation Equity interest % 2010 2009 454 Life Sciences Corporation United States 100% 100% BioVeris Corporation United States 100% 100% Disetronic Medical Systems Inc. United States 100% 100% Disetronic Sterile Products United States 100% 100% Genentech, Inc. United States 100% 100% HLR Consumer Health Inc. United States 100% 100% Hoffmann-La Roche Inc. United States 100% 100% IGEN International, Inc. United States 100% 100% Marcadia Biotech, Inc. United States 100% - Memory Pharmaceuticals Corp. United States 100% 100% Roche Carolina, Inc. United States 100% 100% Roche Colorado Corporation United States 100% 100% Roche Diagnostics Corporation United States 100% 100% Roche Diagnostics Operations, Inc. United States 100% 100% Roche Finance USA, Inc. a) United States - 100% Roche Madison, Inc. United States 100% 100% Roche Molecular Systems, Inc. United States 100% 100% Roche NimbleGen, Inc. United States 100% 100% Roche Palo Alto LLC United States 100% 100% Roche Vitamins, Inc. United States 100% 100% Spring Bioscience Corp. United States 100% 100% Therapeutics Human Polyclonals, Inc. United States 100% 100% Ventana Medical Systems, Inc. United States 100% 100% a) merged into the Company in 2010

86 Annual Report 2010 – Roche Holdings, Inc. Consolidated Financial Statements
Report of the RHI Group Auditors
Independent Auditor’s Report to the Board of Directors of Roche Holdings, Inc., Wilmington, Delaware We have audited the accompanying consolidated financial statements of Roche Holdings, Inc., which comprise the income statement, statement of comprehensive income, balance sheet, statement of cash flows, statement of changes in equity and notes on pages 6 to 85 for the year ended December 31, 2010. Board of Director’s Responsibility: The Board of Directors is responsible for the preparation and fair presentation of the consolidated financial statements in accordance with International Financial Reporting Standards (IFRS). This responsibility includes designing, implementing and maintaining an internal control system relevant to the preparation and fair presentation of consolidated financial statements that are free from material misstatement, whether due to fraud or error. The Board of Directors is further responsible for selecting and applying appropriate accounting policies; and making accounting estimates that are reasonable in the circumstances. Auditor’s Responsibility: Our responsibility is to express an opinion on these consolidated financial statements based on our audit. We conducted our audit in accordance with International Standards on Auditing. Those standards require that we comply with ethical requirements and plan and perform the audit to obtain reasonable assurance whether the consolidated financial statements are free from material misstatement. An audit involves performing procedures to obtain audit evidence about the amounts and disclosures in the consolidated financial statements. The procedures selected depend on the auditor’s judgment, including the assessment of the risks of material misstatement of the consolidated financial statements, whether due to fraud or error. In making those risk assessments, the auditor considers the internal control system relevant to the entity’s preparation and fair presentation of the consolidated financial statements in order to design audit procedures that are appropriate in the circumstances, but not for the purpose of expressing an opinion on the effectiveness of the entity’s internal control system. An audit also includes evaluating the appropriateness of accounting policies used and the reasonableness of accounting estimates made by management, as well as evaluating the overall presentation of the consolidated financial statements. We believe that the audit evidence we have obtained is sufficient and appropriate to provide a basis for our audit opinion. Opinion: In our opinion, the consolidated financial statements for the year ended December 31, 2010 give a true and fair view of the financial position, the results of operations and the cash flows in accordance with International Financial Reporting Standards (IFRS). KPMG AG John A. Morris François Rouiller Basel, January 26, 2011