
Robust Rank Correlation Coe cients on the Basis of Fuzzy ... · Robust Rank Correlation Coe cients...
16
Mathware & Soft Computing 15 (2008) 5-20 Robust Rank Correlation Coefficients on the Basis of Fuzzy Orderings: Initial Steps U. Bodenhofer 1 and F. Klawonn 2 1 Institute of Bioinformatics, Johannes Kepler University Linz 4040 Linz, Austria 2 University of Applied Sciences Braunschweig/Wolfenb¨ uttel 38302 Wolfenb¨ uttel, Germany [email protected], [email protected] Abstract The goal of this paper is to demonstrate that established rank correlation measures are not ideally suited for measuring rank correlation for numerical data that are perturbed by noise. We propose to use robust rank correlation measures based on fuzzy orderings. We demonstrate that the new measures overcome the robustness problems of existing rank correlation coefficients. As a first step, this is accomplished by illustrative examples. The paper closes with an outlook on future research and applications. 1 Introduction Correlation measures are among the most basic tools in statistical data analysis and machine learning. They are applied to pairs of observations (n ≥ 2) (x i ,y i ) n i=1 (1) to measure to which extent the two observations comply with a certain model. The most prominent representative is surely Pearson’s product moment coefficient [1, 18], often nonchalantly called correlation coefficient for short. Pearson’s product moment coefficient is applicable to numerical data and assumes a linear relationship as the underlying model; therefore, it can be used to detect linear relationships, but no non-linear ones. Rank correlation measures [11, 13, 16] are intended to measure to which extent a monotonic function is able to model the inherent relationship between the two observables. They neither assume a specific parametric model nor specific distribu- tions of the observables. They can be applied to ordinal data and, if some ordering relation is given, to numerical data too. Therefore, rank correlation measures are ideally suited for detecting monotonic relationships, in particular, if more specific information about the data is not available. The two most common approaches 5
Transcript of Robust Rank Correlation Coe cients on the Basis of Fuzzy ... · Robust Rank Correlation Coe cients...

Mathware & Soft Computing 15 (2008) 5-20
Robust Rank Correlation Coefficients on the Basis
of Fuzzy Orderings: Initial Steps
U. Bodenhofer1 and F. Klawonn2
1Institute of Bioinformatics, Johannes Kepler University Linz4040 Linz, Austria
2University of Applied Sciences Braunschweig/Wolfenbuttel38302 Wolfenbuttel, Germany
[email protected], [email protected]
Abstract
The goal of this paper is to demonstrate that established rank correlationmeasures are not ideally suited for measuring rank correlation for numericaldata that are perturbed by noise. We propose to use robust rank correlationmeasures based on fuzzy orderings. We demonstrate that the new measuresovercome the robustness problems of existing rank correlation coefficients. Asa first step, this is accomplished by illustrative examples. The paper closeswith an outlook on future research and applications.
1 Introduction
Correlation measures are among the most basic tools in statistical data analysisand machine learning. They are applied to pairs of observations (n ≥ 2)
(xi, yi)ni=1 (1)
to measure to which extent the two observations comply with a certain model.The most prominent representative is surely Pearson’s product moment coefficient[1, 18], often nonchalantly called correlation coefficient for short. Pearson’s productmoment coefficient is applicable to numerical data and assumes a linear relationshipas the underlying model; therefore, it can be used to detect linear relationships,but no non-linear ones.
Rank correlation measures [11, 13, 16] are intended to measure to which extenta monotonic function is able to model the inherent relationship between the twoobservables. They neither assume a specific parametric model nor specific distribu-tions of the observables. They can be applied to ordinal data and, if some orderingrelation is given, to numerical data too. Therefore, rank correlation measures areideally suited for detecting monotonic relationships, in particular, if more specificinformation about the data is not available. The two most common approaches
5
6 U. Bodenhofer & F. Klawonn
are Spearman’s rank correlation coefficient (short Spearman’s rho) [20, 21] andKendall’s tau (rank correlation coefficient) [2, 12, 13].
This paper argues why these well-known rank correlation measures are notideally suited for measuring rank correlation for numerical data that are perturbedby noise. Consequently, we propose a robust rank correlation measure on the basisof fuzzy orderings. The superiority of the new measure is demonstrated by meansof illustrative examples.
2 An Overview of Rank Correlation Measures
Assume that we are given a family of pairs as in (1), where all xi and yi are fromlinearly ordered domains X and Y , respectively. Spearman’s rho is computed as
ρ = 1− 6∑n
i=1(r(xi)− r(yi))2
n(n2 − 1),
where r(xi) is the rank of value xi if we sort the list (x1, . . . , xn); r(yi) is definedanalogously. So, Spearman’s rho measures the sum of quadratic distances of ranksand scales this measure to the interval [−1, 1]. It can be checked easily that a valueof 1 is obtained if the two rankings coincide and that a value of −1 is obtained ifone ranking is the reverse of the respective other. Note that the above definition ofr(xi) and r(yi) was simplified, because it did not take coinciding values, so-calledties, into account. In such a case, the values r(xi) are usually defined as the meanvalue of all ranks of consecutive coinciding values in the sorted list.
To define the Kendall tau rank correlation coefficient, we need to introduce theconcepts of concordance, discordance and ties first. For a given pair of indices(i, j) ∈ {1, . . . , n}2, we say that (i, j) is concordant if xi < xj and yi < yj ; we saythat (i, j) is discordant if xi < xj and yi > yj . If xi = xj , we say that (i, j) isa tie in the first component. If yi = yj , we say that (i, j) is a tie in the secondcomponent. We simply say that (i, j) is a tie if (i, j) is a tie in either component.
Let us denote the numbers of concordant, discordant and tied pairs as follows:
C = |{(i, j) | xi < xj and yi < yj}|D = |{(i, j) | xi < xj and yi > yj}|
T = |{(i, j) | xi = xj}|U = |{(i, j) | yi = yj}|
Then the basic variant of Kendall’s tau which we denote with τa is computed asthe quotient
τa =C −D
12n(n− 1)
.
If there are no ties and the two rankings coincide, we have 12n(n − 1) concordant
and no discordant pairs, so τa = 1; if we have no ties and one ranking is the reverseof the respective other, we have no concordant and 1
2n(n− 1) discordant pairs, so
Robust Rank Correlation Coefficients on the Basis of Fuzzy Orderings 7
a value of τa = −1 is obtained. So, in these extremal cases, Kendall’s tau gives thesame results as Spearman’s rho.
Ties, no matter whether in the first or in the second list, are not counted in theabove definition of τa, so they lower the absolute value of τa. Therefore, τa is bestsuited for detecting strictly monotonic relationships, but not ideally suited in thepresence of ties. A well-established second variant [13] is the following:
τb =C −D√
12n(n− 1)− T
√12n(n− 1)− U
,
It takes ties into account, but is still not fully robust to ties (see next section).A simple and tie-robust rank correlation measure is the gamma rank correlationmeasure according to Goodman and Kruskal [11] that is defined as
γ =C −DC +D
.
Finally, we remark that τa, τb and γ coincide in all cases where no ties occur in thedata.
3 Motivation
Historically, all rank correlation measures highlighted above have been introducedwith the aim to measure rank correlation of ordinal data (e.g. natural numbers,marks, quality classes, ranks). The measurement of rank correlation for real-valueddata, however, is equally important in statistics and machine learning, but raisescompletely new issues. Depending on the source, numerical data are almost alwayssubject to random perturbations—noise. The concepts introduced above do nottake this into account. Pairs are counted as concordant or discordant only on thebasis of ordering relations, but without taking into account that only minimal dif-ferences may decide whether a pair is concordant or discordant. If one observabledepends on the other in a clearly monotonic way and if the level of noise is low,then the rank correlation measures introduced above will still reveal this strictlymonotonic relationship and will not be compromised by minor local effects of noise.In the presence of a larger percentage of ties, however, already the slightest per-turbations may lead to situations in which the above rank correlation coefficientscannot yield meaningful results anymore.
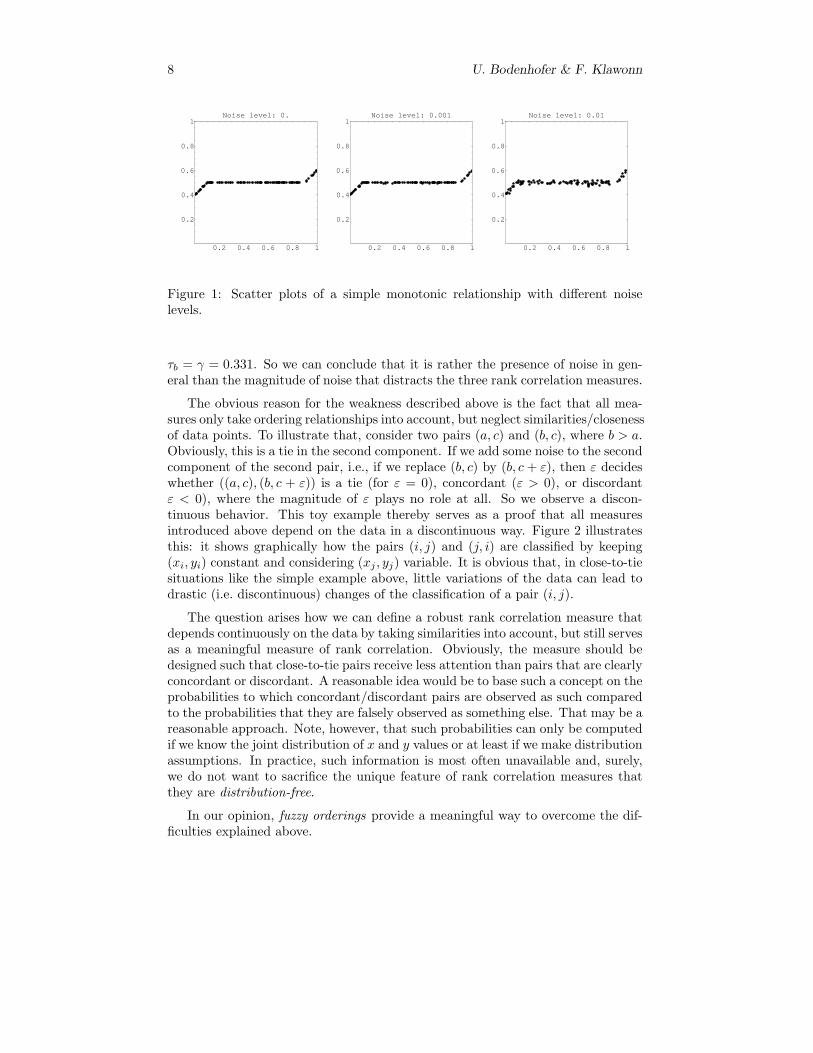
Consider the data sets in Figure 1. We see a monotonic, yet not strictly mono-tonic, relationship. The left plot shows data without noise, i.e. yi = f(xi) for a non-decreasing function f . For these data, we obtain ρ = 0.737, τb = 0.639 and γ = 1(which confirms that γ is most robust to ties). The middle plot shows the samedata, but with additive normally distributed noise with zero mean and σ = 0.001.Although the noise can hardly be seen from the plot, we obtain ρ = 0.519 andτb = γ = 0.387. These results indicate that none of the three measures can ad-equately handle a large proportion of ties in the presence of noise. For σ = 0.01(right plot), the values are slightly lower, but not significantly: ρ = 0.456 and
8 U. Bodenhofer & F. Klawonn
0.2 0.4 0.6 0.8 1
0.2
0.4
0.6
0.8
1Noise level: 0.
0.2 0.4 0.6 0.8 1
0.2
0.4
0.6
0.8
1Noise level: 0.001
0.2 0.4 0.6 0.8 1
0.2
0.4
0.6
0.8
1Noise level: 0.01
Figure 1: Scatter plots of a simple monotonic relationship with different noiselevels.
τb = γ = 0.331. So we can conclude that it is rather the presence of noise in gen-eral than the magnitude of noise that distracts the three rank correlation measures.
The obvious reason for the weakness described above is the fact that all mea-sures only take ordering relationships into account, but neglect similarities/closenessof data points. To illustrate that, consider two pairs (a, c) and (b, c), where b > a.Obviously, this is a tie in the second component. If we add some noise to the secondcomponent of the second pair, i.e., if we replace (b, c) by (b, c + ε), then ε decideswhether ((a, c), (b, c + ε)) is a tie (for ε = 0), concordant (ε > 0), or discordantε < 0), where the magnitude of ε plays no role at all. So we observe a discon-tinuous behavior. This toy example thereby serves as a proof that all measuresintroduced above depend on the data in a discontinuous way. Figure 2 illustratesthis: it shows graphically how the pairs (i, j) and (j, i) are classified by keeping(xi, yi) constant and considering (xj , yj) variable. It is obvious that, in close-to-tiesituations like the simple example above, little variations of the data can lead todrastic (i.e. discontinuous) changes of the classification of a pair (i, j).
The question arises how we can define a robust rank correlation measure thatdepends continuously on the data by taking similarities into account, but still servesas a meaningful measure of rank correlation. Obviously, the measure should bedesigned such that close-to-tie pairs receive less attention than pairs that are clearlyconcordant or discordant. A reasonable idea would be to base such a concept on theprobabilities to which concordant/discordant pairs are observed as such comparedto the probabilities that they are falsely observed as something else. That may be areasonable approach. Note, however, that such probabilities can only be computedif we know the joint distribution of x and y values or at least if we make distributionassumptions. In practice, such information is most often unavailable and, surely,we do not want to sacrifice the unique feature of rank correlation measures thatthey are distribution-free.
In our opinion, fuzzy orderings provide a meaningful way to overcome the dif-ficulties explained above.

Robust Rank Correlation Coefficients on the Basis of Fuzzy Orderings 9
Hi,jL is concordant
Hi,jL is discordant
Hj,iL is discordant
Hj,iL is concordant
Hi,jL and Hj,iL are ties
xi
yi
xi
yi
Figure 2: Visualization of the concepts of concordance, discordance and ties forfixed (xi, yi) and variable (xj , yj). The horizontal axis corresponds to xj , while thevertical axis corresponds to yj .
4 Fuzzy Orderings
Before we can introduce a fuzzy ordering-based rank correlation coefficient, we needto provide some basics of fuzzy orderings. We restrict to an absolutely necessaryminimum and refer to literature for details. We assume that the reader is aware ofthe most basic concepts of triangular norms [15] and fuzzy relations [6, 10, 17].
A fuzzy relation L : X2 → [0, 1] is called fuzzy ordering with respect to a t-normT and a T -equivalence E : X2 → [0, 1], for brevity T -E-ordering, if and only if thefollowing three axioms for all x, y, z ∈ X:
(i) E-Reflexivity: E(x, y) ≤ L(x, y)
(ii) T -E-antisymmetry: T (L(x, y), L(y, x)) ≤ E(x, y)
(iii) T -transitivity: T (L(x, y), L(y, z)) ≤ L(x, z)
Moreover, we call a T -E-ordering L strongly complete if max(L(x, y), L(y, x)) = 1for all x, y ∈ X [4].
Several correspondences between distances and fuzzy equivalence relations areavailable [7, 8, 14, 23]. From these results, we can easily infer that (assume r > 0in the following)
Er(x, y) = max(0, 1− 1r |x− y|)
is a TL-equivalence on R, where TL(x, y) = max(0, x+y−1) denotes the Lukasiewicz

10 U. Bodenhofer & F. Klawonn
t-norm. Analogously,E′r(x, y) = exp(− 1
r |x− y|)
is a TP-equivalence on R, where TP(x, y) = xy denotes the product t-norm.1
Based on a general representation theorem for strongly complete fuzzy orderings[4, Theorem 4.2], we can further prove that
Lr(x, y) = min(1,max(0, 1− 1r (x− y)))
is a strongly complete TL-Er-ordering on R and that
L′r(x, y) = min(1, exp(− 1r (x− y))
is a strongly complete TP-E′r-ordering on R. As TL ≤ TP, we can trivially concludethat L′r is also a strongly complete TL-E′r-ordering.
In order to generalize the notion of concordant and discordant pairs, we needthe notion of a strict fuzzy ordering. We call a binary fuzzy relation R : X2 → [0, 1]a strict fuzzy ordering with respect to T and a T -equivalence E : X2 → [0, 1], forbrevity strict T -E-ordering, if it is irreflexive (i.e. R(x, x) = 0 for all x ∈ X),T -transitive, and E-extensional, that is,
T (E(x, x′), E(y, y′), R(x, y)) ≤ R(x′, y′)
for all x, x′, y, y′, z ∈ X [5].Given a T -E-ordering L : X2 → [0, 1],
R(x, y) = min(L(x, y), NT (L(y, x))), (2)
where NT (x) = sup{y ∈ [0, 1] | T (x, y) = 0} is the residual negation of T , is themost appropriate choice for extracting a strict fuzzy ordering from a given fuzzyordering L (for a detailed argumentation, see [5]). From this construction, we caninfer that the fuzzy relation
Rr(x, y) = min(1,max(0, 1r (y − x)))
is a strict TL-Er-ordering and that
R′r(x, y) = max(0, 1− exp(− 1r (y − x)))
is a strict TL-E′r-ordering.If a given TL-E-ordering L : X2 → [0, 1] is strongly complete, it can be proved
that the fuzzy relation R defined as in (2) simplifies to
R(x, y) = 1− L(y, x)
and that the following holds:
R(x, y) + E(x, y) +R(y, x) = 1 (3)min(R(x, y), R(y, x)) = 0 (4)
1In the following, we will further use the well-known minimum t-norm TM(x, y) = min(x, y).
Robust Rank Correlation Coefficients on the Basis of Fuzzy Orderings 11
5 A Fuzzy Ordering-Based Rank CorrelationCoefficient
The previous section has provided us with the apparatus that is necessary to de-fine a generalized rank correlation measure. Assume that the data are given asin (1) again (with xi ∈ X and yi ∈ Y for all i = 1, . . . , n). Further assumethat we are given two TL-equivalences EX : X2 → [0, 1] and EY : Y 2 → [0, 1],a strongly complete TL-EX -ordering LX : X2 → [0, 1] and a strongly completeTL-EY -ordering LY : Y 2 → [0, 1]. Then we can define a strict TL-EX -orderingon X as RX(x1, x2) = 1 − LX(x2, x1) and a strict TL-EY -ordering on Y asRY (y1, y2) = 1− LY (y2, y1).
Spearman’s rho is based on rankings. Rankings are crisp concepts in whichit is not easy to accommodate degrees of relationship in a straightforward way.Thus it is more meaningful to use pairwise comparisons to define a concept of rankcorrelation, just like Kendall’s tau and the gamma measure do.
Given an index pair (i, j), we can compute the degree to which (i, j) is a con-cordant pair as
C(i, j) = T (RX(xi, xj), RY (yi, yj))
and the degree to which (i, j) is a discordant pair as
D(i, j) = T (RX(xi, xj), RY (yj , yi)),
where T is some t-norm to aggregate the relationships of x and y components.It is easy to prove that, for all index pairs (i, j), the equality
C(i, j) + C(j, i) + D(i, j) + D(j, i) + T (i, j) = 1 (5)
holds. In this equation, T (i, j) denotes the degree to which (i, j) is a tie in eithervariable
T (i, j) = S(EX(xi, xj), EY (yi, yj)),
where S is the dual t-conorm of T (i.e. S(x, y) = 1 − T (1 − x, 1 − y)). Note that(5) does not hold in general. The properties (3) and (4), however, are sufficientconditions for the fulfillment of (5).
If we adopt the simple sigma count idea to measure the cardinality of a fuzzyset [9], we can compute the numbers of concordant pairs C and discordant pairsD, respectively, as
C =n∑
i=1
∑j 6=i
C(i, j), D =n∑
i=1
∑j 6=i
D(i, j).
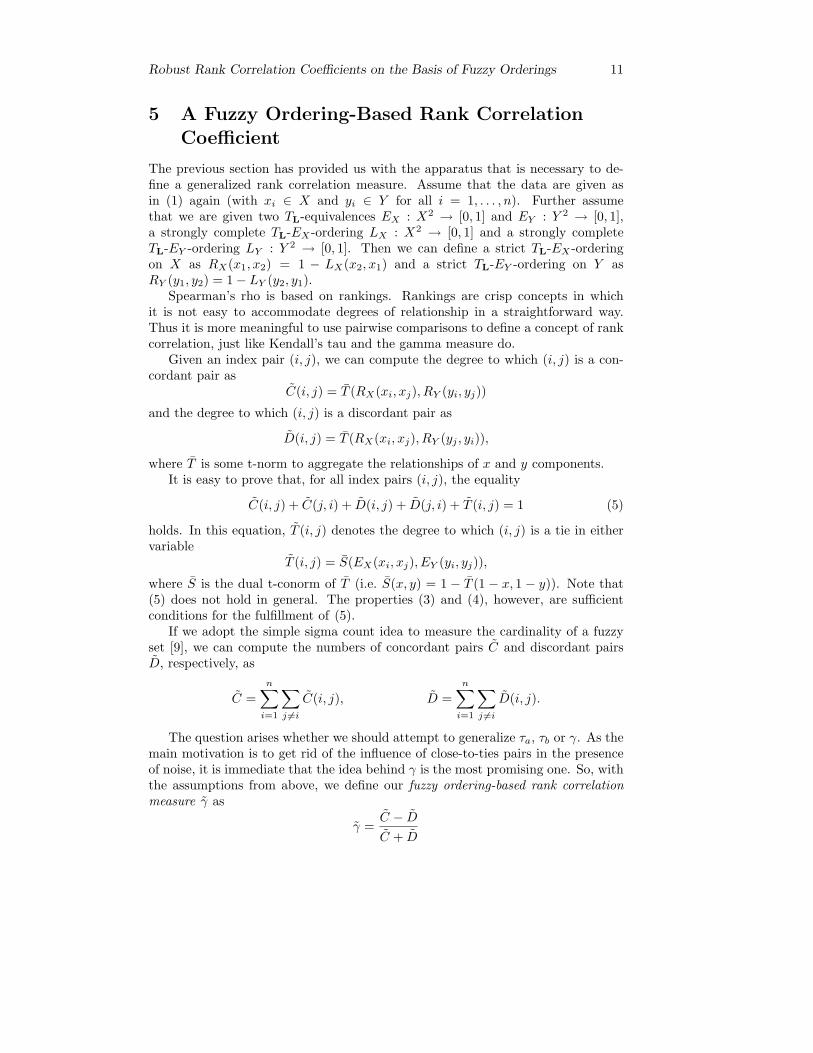
The question arises whether we should attempt to generalize τa, τb or γ. As themain motivation is to get rid of the influence of close-to-ties pairs in the presenceof noise, it is immediate that the idea behind γ is the most promising one. So, withthe assumptions from above, we define our fuzzy ordering-based rank correlationmeasure γ as
γ =C − DC + D
12 U. Bodenhofer & F. Klawonn
xi- rxi
xi+ r
yi- r
yi
yi+ r0.0
0.5
1.0
xi- rxi
xi+ r
yi- r
yi
yi+ r0.0
0.5
1.0
xi- rxi
xi+ r
yi- r
yi
yi+ r0.0
0.5
1.0
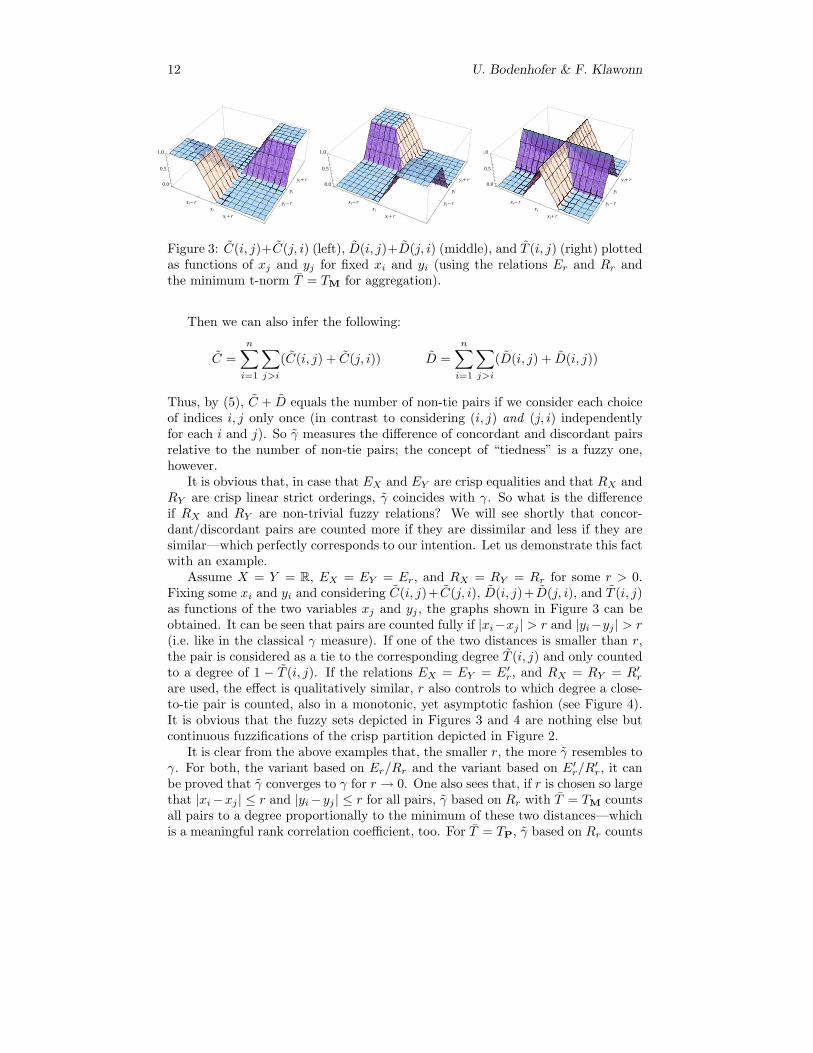
Figure 3: C(i, j)+C(j, i) (left), D(i, j)+D(j, i) (middle), and T (i, j) (right) plottedas functions of xj and yj for fixed xi and yi (using the relations Er and Rr andthe minimum t-norm T = TM for aggregation).
Then we can also infer the following:
C =n∑
i=1
∑j>i
(C(i, j) + C(j, i)) D =n∑
i=1
∑j>i
(D(i, j) + D(i, j))
Thus, by (5), C + D equals the number of non-tie pairs if we consider each choiceof indices i, j only once (in contrast to considering (i, j) and (j, i) independentlyfor each i and j). So γ measures the difference of concordant and discordant pairsrelative to the number of non-tie pairs; the concept of “tiedness” is a fuzzy one,however.
It is obvious that, in case that EX and EY are crisp equalities and that RX andRY are crisp linear strict orderings, γ coincides with γ. So what is the differenceif RX and RY are non-trivial fuzzy relations? We will see shortly that concor-dant/discordant pairs are counted more if they are dissimilar and less if they aresimilar—which perfectly corresponds to our intention. Let us demonstrate this factwith an example.
Assume X = Y = R, EX = EY = Er, and RX = RY = Rr for some r > 0.Fixing some xi and yi and considering C(i, j)+ C(j, i), D(i, j)+D(j, i), and T (i, j)as functions of the two variables xj and yj , the graphs shown in Figure 3 can beobtained. It can be seen that pairs are counted fully if |xi−xj | > r and |yi−yj | > r(i.e. like in the classical γ measure). If one of the two distances is smaller than r,the pair is considered as a tie to the corresponding degree T (i, j) and only countedto a degree of 1 − T (i, j). If the relations EX = EY = E′r, and RX = RY = R′rare used, the effect is qualitatively similar, r also controls to which degree a close-to-tie pair is counted, also in a monotonic, yet asymptotic fashion (see Figure 4).It is obvious that the fuzzy sets depicted in Figures 3 and 4 are nothing else butcontinuous fuzzifications of the crisp partition depicted in Figure 2.
It is clear from the above examples that, the smaller r, the more γ resembles toγ. For both, the variant based on Er/Rr and the variant based on E′r/R′r, it canbe proved that γ converges to γ for r → 0. One also sees that, if r is chosen so largethat |xi−xj | ≤ r and |yi−yj | ≤ r for all pairs, γ based on Rr with T = TM countsall pairs to a degree proportionally to the minimum of these two distances—whichis a meaningful rank correlation coefficient, too. For T = TP, γ based on Rr counts

Robust Rank Correlation Coefficients on the Basis of Fuzzy Orderings 13
xi- rxixi+ r
yi- ryi
yi+ r0.0
0.5
1.0
xi- rxixi+ r
yi- ryi
yi+ r0.0
0.5
1.0
xi- rxixi+ r
yi- ryi
yi+ r0.0
0.5
1.0
Figure 4: C(i, j)+C(j, i) (left), D(i, j)+D(j, i) (middle), and T (i, j) (right) plottedas functions of xj and yj for fixed xi and yi (using the relations E′r and R′r andthe product t-norm T = TP for aggregation).
pairs to a degree proportionally to the product of the two distances. With moreeffort, it is possible to prove that the R′r-based variants of γ, with r →∞, convergeto the same limit values as the Rr-based variants.
Another property of γ is immediate to see: if the fuzzy relations RX and RY
are continuous and if T is a continuous t-norm, then γ depends continuously onthe data set (xi, yi)n
i=1.
6 Experiments
Let us first reconsider the example from Section 3. More specifically, we are given100 uniformly distributed random values (x1, . . . , x100) from the unit interval. Thelist (y1, . . . , y100) is computed as yi = f(xi), where f is a simple, piecewise linear,non-decreasing function that has a relatively large flat area. In order to study howdifferent rank correlation measures react to noise, we contaminated the data pointswith additive, independent, normally distributed noise with 0 mean and standarddeviation σ. Figure 5 shows these data sets. Figure 6 displays the results thatwe obtained for different rank correlation measures. We compared ρ, τb, γ anddifferent variants of γ. Every line in Figure 6 corresponds to the results obtainedby one rank correlation measure depending on the noise level σ. The two lines forτb (dotted, black) and γ (dotted, light gray) coincide except for no noise (σ = 0).Both lines reveal that these two measures react to noise in a non-robust way. Moreor less the same is true for ρ (dotted, medium gray). The other lines correspondto different variants of γ. Solid lines correspond to γ using Rr and dashed linesdenote the results for γ using R′r (where we use the same r for both componentsand T = TM). We used r = 0.05 (black), r = 0.2 (medium gray), and r = 0.5 (lightgray). We see that all six different variants react to the noise in a more robust waythan the three crisp measures. Clearly, the higher r, the more noise is neglected.Note, however, that, the larger r, the more difficult it is for γ to find out whetherthere are slightly non-monotonic parts in the data.
So let us consider a different setting. Now we fix the noise level σ = 0.01 anduse different functions to create the second list (y1, . . . , y100). Right of x = 0.5, weuse f(x) = x
2 + 14 and, to the left of x = 0.5, we linearly interpolate between (0, q)

14 U. Bodenhofer & F. Klawonn
0.2 0.4 0.6 0.8 1
0.2
0.4
0.6
0.8
1Σ=0.03125
0.2 0.4 0.6 0.8 1
0.2
0.4
0.6
0.8
1Σ=0.0625
0.2 0.4 0.6 0.8 1
0.2
0.4
0.6
0.8
1Σ=0.125
0.2 0.4 0.6 0.8 1
0.2
0.4
0.6
0.8
1Σ=0.00390625
0.2 0.4 0.6 0.8 1
0.2
0.4
0.6
0.8
1Σ=0.0078125
0.2 0.4 0.6 0.8 1
0.2
0.4
0.6
0.8
1Σ=0.015625
0.2 0.4 0.6 0.8 1
0.2
0.4
0.6
0.8
1Σ=0.
0.2 0.4 0.6 0.8 1
0.2
0.4
0.6
0.8
1Σ=0.000976563
0.2 0.4 0.6 0.8 1
0.2
0.4
0.6
0.8
1Σ=0.00195313
Figure 5: Different data sets obtained from contaminating a non-decreasing rela-tionship by normally distributed noise with different standard deviations.

Robust Rank Correlation Coefficients on the Basis of Fuzzy Orderings 15
00.02
0.04
0.06
0.08
0.1
0.12
Σ
0
0.2
0.4
0.6
0.8 1
Correlation
Figure 6: Results obtained by applying different rank correlation measures to thedata sets shown in Figure 5.

16 U. Bodenhofer & F. Klawonn
0.2 0.4 0.6 0.8 1
0.2
0.4
0.6
0.8
1q=0.6
0.2 0.4 0.6 0.8 1
0.2
0.4
0.6
0.8
1q=0.7
0.2 0.4 0.6 0.8 1
0.2
0.4
0.6
0.8
1q=1.
0.2 0.4 0.6 0.8 1
0.2
0.4
0.6
0.8
1q=0.
0.2 0.4 0.6 0.8 1
0.2
0.4
0.6
0.8
1q=0.4
0.2 0.4 0.6 0.8 1
0.2
0.4
0.6
0.8
1q=0.5
Figure 7: Noisy data sets that correspond to monotonic (q ≤ 0.5) and non-monotonic relationships (q > 0.5).
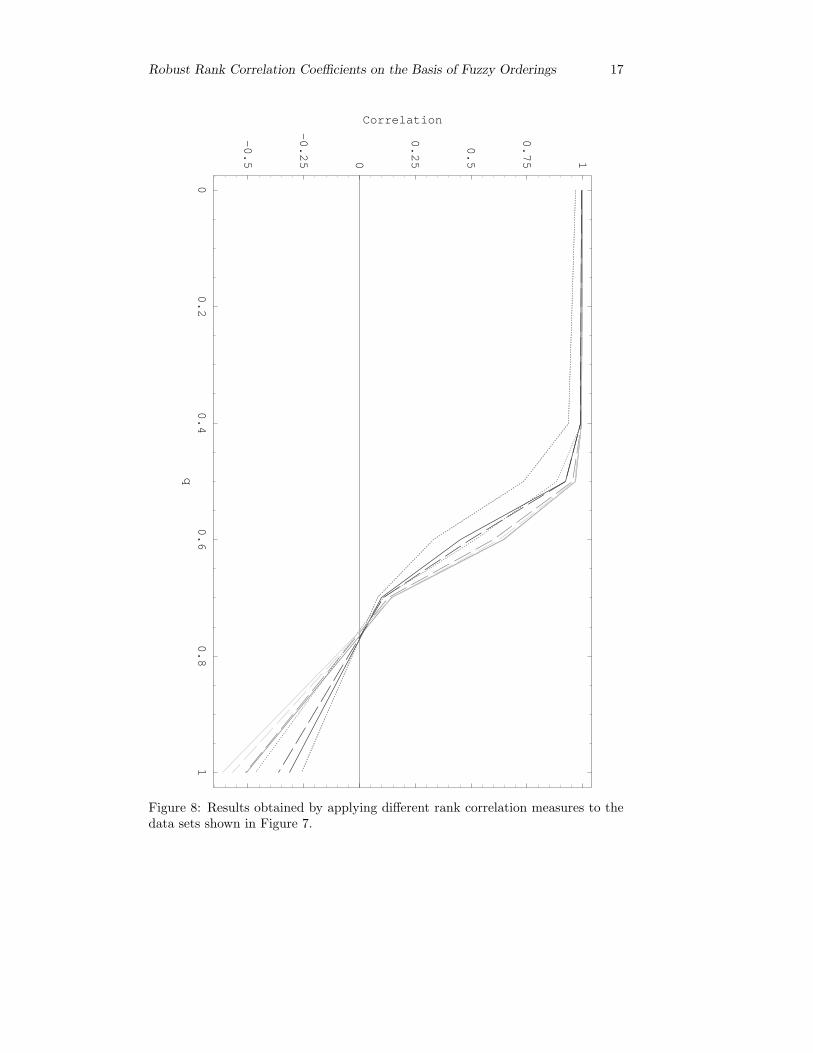
and (0.5, 0.5). It is clear, that this relationship is monotonic if and only if q ≤ 0.5.The data sets are displayed in Figure 7 and the results are presented in Figure 8,where we use the same conventions to distinguish the lines as in Figure 6. Wesee that all variants of γ show acceptable results for q ≤ 0.5, whereas ρ, τb and γagain have problems to handle the noise in case of the large proportion of ties thatoccurs for q = 0.5. We also see that γ already yields significantly lower values forq = 0.6 in the case r = 0.05 (no matter which of the two variants is considered).For larger r, however, we see that γ cannot detect the slight non-monotonicity forq = 0.6 that well. These two examples demonstrate that, when choosing r, there isa trade-off between robustness (the larger r, the better) and sensitivity (the smallerr, the better).
As a third set of experiments, we have tried to figure out the variance of γ.For this study, we have computed all rank correlation measures used in the aboveexperiments for different test data several times and computed the variance of theresults. In all experiments, we have encountered that τb and γ had higher variancesthan all variants of γ. The variances we obtained for different variants of γ obeyeda simple and unsurprising rule: the larger r, the smaller the variance. Interestingly,the variances we obtained for Spearman’s ρ were also very low, comparable to thelower values for γ with a large r.
Robust Rank Correlation Coefficients on the Basis of Fuzzy Orderings 17
00.2
0.4
0.6
0.8
1q
-0.5
-0.25 0
0.25
0.5
0.75 1
Correlation
Figure 8: Results obtained by applying different rank correlation measures to thedata sets shown in Figure 7.

18 U. Bodenhofer & F. Klawonn
7 Concluding Remarks
This paper, as the title suggests, attempts to present initial ideas that the authorsconsider promising. The examples of the previous section are intended to supportthis viewpoint. They are illustrative and indicative, but they cannot replace aformal investigation of the properties of γ. As it has been done exhaustively forSpearman’s rho and Kendall’s tau, a significance analysis and a variance analysishave to be carried out. Note, however, that this cannot be done analogously for γ.Both Spearman’s rho and Kendall’s tau are fully determined by the ranking of thelists (x1, . . . , xn) and (y1, . . . , yn). Thus, combinatorial techniques can be used tostudy variances and significance levels [13]—not so for γ that always depends onthe distance relationships of the values, too, so this analysis can only be done bysome distribution assumptions. These studies are left to future research.
To determine the right choice for the parameter r is another open question. Aswe have noted above, there is a trade-off between robustness on the one side andsensitivity/significance on the other side. So this topic goes hand in hand with amore formal statistical analysis. Profound results concerning the choice of r, again,can only be expected with specific distribution assumptions. In any case, we wantto note in advance that γ depends continuously on r, so at least we can be surethat γ will react robustly to slightly sub-optimal choices of r.
We would like to remark that this investigation was inspired by a problem inbioinformatics: how to infer sets of co-transcribed genes in procaryotic genomes (so-called operons) from the gene expression levels measured by microarray experiments[3, 19, 22]. It will also be subject of future research to evaluate the rank correlationmeasures introduced in this paper in this domain. First experiments have beenvery promising.
References
[1] H. Abdi. Coefficients of correlation, alienation and determination. In N. J.Salkind, editor, Encyclopedia of Measurement and Statistics. Sage, ThousandOaks, CA, 2007.
[2] H. Abdi. The Kendall rank correlation coefficient. In N. J. Salkind, editor,Encyclopedia of Measurement and Statistics. Sage, Thousand Oaks, CA, 2007.
[3] J. Bockhorst, Y. Qiu, J. Glasner, M. Liu, F. Blattner, and M. Craven. Predict-ing bacterial transcription units using sequence and expression data. Bioin-formatics, 19(Suppl. 1):i34–i43, 2003.
[4] U. Bodenhofer. A similarity-based generalization of fuzzy orderings preserv-ing the classical axioms. Internat. J. Uncertain. Fuzziness Knowledge-BasedSystems, 8(5):593–610, 2000.
[5] U. Bodenhofer and M. Demirci. Strict fuzzy orderings with a given contextof similarity. Internat. J. Uncertain. Fuzziness Knowledge-Based Systems,16(2):147–178, 2008.

Robust Rank Correlation Coefficients on the Basis of Fuzzy Orderings 19
[6] D. Boixader, J. Jacas, and J. Recasens. Fuzzy equivalence relations: advancedmaterial. In D. Dubois and H. Prade, editors, Fundamentals of Fuzzy Sets,volume 7 of The Handbooks of Fuzzy Sets, pages 261–290. Kluwer AcademicPublishers, Boston, 2000.
[7] B. De Baets and R. Mesiar. Pseudo-metrics and T -equivalences. J. FuzzyMath., 5(2):471–481, 1997.
[8] B. De Baets and R. Mesiar. Metrics and T -equalities. J. Math. Anal. Appl.,267:331–347, 2002.
[9] A. DeLuca and S. Termini. A definition of a nonprobabilistic entropy in thesetting of fuzzy sets theory. Inf. Control, 20:301–312, 1972.
[10] J. Fodor and M. Roubens. Fuzzy Preference Modelling and Multicriteria De-cision Support. Kluwer Academic Publishers, Dordrecht, 1994.
[11] L. A. Goodman and W. H. Kruskal. Measures of association for cross classifi-cations. J. Amer. Statist. Assoc., 49(268):732–764, 1954.
[12] M. G. Kendall. A new measure of rank correlation. Biometrika, 30:81–93,1938.
[13] M. G. Kendall. Rank Correlation Methods. Charles Griffin & Co., London,third edition, 1962.
[14] F. Klawonn. Fuzzy sets and vague environments. Fuzzy Sets and Systems,66:207–221, 1994.
[15] E. P. Klement, R. Mesiar, and E. Pap. Triangular Norms, volume 8 of Trendsin Logic. Kluwer Academic Publishers, Dordrecht, 2000.
[16] W. H. Kruskal. Ordinal measures of association. J. Amer. Statist. Assoc.,53(284):814–861, 1958.
[17] S. V. Ovchinnikov. An introduction to fuzzy relations. In D. Dubois andH. Prade, editors, Fundamentals of Fuzzy Sets, volume 7 of The Handbooks ofFuzzy Sets, pages 233–259. Kluwer Academic Publishers, Boston, 2000.
[18] K. Pearson. Notes on the history of correlation. Biometrika, 13:25–45, 1920.
[19] C. Sabatti, L. Rohlin, M.-K. Oh, and J. C. Liao. Co-expression pattern fromDNA microarray experiments as a tool for operon prediction. Nucleic AcidsRes., 30(13):2886–2893, 2002.
[20] C. Spearman. The proof and measurement of association between two things.Am. J. Psychol., 15(1):72–101, 1904.
[21] C. Spearman. Demonstration of formulae for true measurement of correlation.Am. J. Psychol., 18(2):161–169, 1907.
20 U. Bodenhofer & F. Klawonn
[22] D. Steinhauser, B. H. Junker, A. Luedemann, J. Selbig, and J. Kopka.Hypothesis-driven approach to predict transcriptional units from gene expres-sion data. Bioinformatics, 20(12):1928–1939, 2004.
[23] E. Trillas and L. Valverde. An inquiry into indistinguishability operators. InH. J. Skala, S. Termini, and E. Trillas, editors, Aspects of Vagueness, pages231–256. Reidel, Dordrecht, 1984.


![Seance 4 - LORIA · 2016-07-05 · Les coe cients de la DCT sont reels ! quanti cation necessaire. (representation informatique nie) Exemple : coe cients dans un intervalle [ a;b],](https://static.fdocuments.in/doc/165x107/5e5a0d8d4a47992dd44fd7c9/seance-4-loria-2016-07-05-les-coe-cients-de-la-dct-sont-reels-quanti-cation.jpg)