Robust optimization and uncertainty quantification …...Robust optimization and uncertainty...
13
Robust optimization and uncertainty quantification in the nonlinear mechanics of an elevator brake system Piotr Wolszczak . Pawel Lonkwic . Americo Cunha Jr. . Grzegorz Litak . Szymon Molski Received: 17 November 2018 / Accepted: 4 May 2019 / Published online: 14 May 2019 Ó The Author(s) 2019 Abstract This paper deals with nonlinear mechanics of an elevator brake system subjected to uncertainties. A deterministic model that relates the braking force with uncertain parameters is deduced from mechanical equilibrium conditions. In order to take into account parameters variabilities, a parametric probabilistic approach is employed. In this stochastic formalism, the uncertain parameters are modeled as random variables, with distributions specified by the maxi- mum entropy principle. The uncertainties are propagated by the Monte Carlo method, which provides a detailed statistical characterization of the response. This work still considers the optimum design of the brake system, formulating and solving nonlinear optimization problems, with and without the uncertainties effects. Keywords Elevator brake system Nonlinear mechanics Nonlinear optimization Uncertainty quantification Parametric probabilistic approach 1 Introduction Considerations regarding the construction of lifting devices (design of cranes), and in particular brake systems, are not often discussed in the scientific literature, as the corresponding dynamical conditions are difficult to determine. The first person who addressed the issue of the impact of safety gears construction on the braking distance was Elisha Graves Otis, who in 1853 built the first safety gears and subjected them to experimental studies [1, 2]. Subsequent works on this subject, studying several aspects of cranes mechanics, appeared in the twentieth century and were published in journals and conference proceedings [3–9]. For instance, Yost and Rothenfluth [3] describe how to configure a lifting device and how to select the correct components. These issues constituted a P. Wolszczak (&) G. Litak Faculty of Mechanical Engineering, Lublin University of Technology, Nadbystrzycka 36, 20-618 Lublin, Poland e-mail: [email protected] G. Litak e-mail: [email protected] P. Lonkwic Mechanical Engineering Faculty, State School of Higher Education, Pocztowa 54, 22-100 Chelm, Poland e-mail: [email protected] A. Cunha Jr. Nucleus of Modeling and Experimentation with Computers – NUMERICO, Universidade do Estado do Rio de Janeiro, Rua Sa ˜o Francisco Xavier, 524, Rio de Janeiro, RJ 20550-900, Brazil e-mail: [email protected] S. Molski Department of Rope Transport, AGH University of Science and Technology, Mickiewicza 30, 30-059 Krako ´w, Poland e-mail: [email protected] 123 Meccanica (2019) 54:1057–1069 https://doi.org/10.1007/s11012-019-00992-7
Transcript of Robust optimization and uncertainty quantification …...Robust optimization and uncertainty...

Robust optimization and uncertainty quantificationin the nonlinear mechanics of an elevator brake system
Piotr Wolszczak . Pawel Lonkwic . Americo Cunha Jr. . Grzegorz Litak .
Szymon Molski
Received: 17 November 2018 / Accepted: 4 May 2019 / Published online: 14 May 2019
� The Author(s) 2019
Abstract This paper deals with nonlinear mechanics
of an elevator brake system subjected to uncertainties.
A deterministic model that relates the braking force
with uncertain parameters is deduced from mechanical
equilibrium conditions. In order to take into account
parameters variabilities, a parametric probabilistic
approach is employed. In this stochastic formalism,
the uncertain parameters are modeled as random
variables, with distributions specified by the maxi-
mum entropy principle. The uncertainties are
propagated by the Monte Carlo method, which
provides a detailed statistical characterization of the
response. This work still considers the optimum
design of the brake system, formulating and solving
nonlinear optimization problems, with and without the
uncertainties effects.
Keywords Elevator brake system � Nonlinear
mechanics � Nonlinear optimization � Uncertainty
quantification � Parametric probabilistic approach
1 Introduction
Considerations regarding the construction of lifting
devices (design of cranes), and in particular brake
systems, are not often discussed in the scientific
literature, as the corresponding dynamical conditions
are difficult to determine. The first person who
addressed the issue of the impact of safety gears
construction on the braking distance was Elisha
Graves Otis, who in 1853 built the first safety gears
and subjected them to experimental studies [1, 2].
Subsequent works on this subject, studying several
aspects of cranes mechanics, appeared in the twentieth
century and were published in journals and conference
proceedings [3–9].
For instance, Yost and Rothenfluth [3] describe
how to configure a lifting device and how to select the
correct components. These issues constituted a
P. Wolszczak (&) � G. Litak
Faculty of Mechanical Engineering, Lublin University of
Technology, Nadbystrzycka 36, 20-618 Lublin, Poland
e-mail: [email protected]
G. Litak
e-mail: [email protected]
P. Lonkwic
Mechanical Engineering Faculty, State School of Higher
Education, Pocztowa 54, 22-100 Chelm, Poland
e-mail: [email protected]
A. Cunha Jr.
Nucleus of Modeling and Experimentation with
Computers – NUMERICO, Universidade do Estado do
Rio de Janeiro, Rua Sao Francisco Xavier, 524,
Rio de Janeiro, RJ 20550-900, Brazil
e-mail: [email protected]
S. Molski
Department of Rope Transport, AGH University of
Science and Technology, Mickiewicza 30,
30-059 Krakow, Poland
e-mail: [email protected]
123
Meccanica (2019) 54:1057–1069
https://doi.org/10.1007/s11012-019-00992-7(0123456789().,-volV)( 0123456789().,-volV)

significant contribution to the development of the
configuration of lifts, ensuring a trouble-free
operation.
Lonkwic [4] presents a comparative analysis of the
operation of slip safety gear of his own design study
with the models by leading European manufacturers.
Deceleration (braking time) values obtained in the
physical experiment are analyzed. In [5], the same
author and collaborators address, by means of wavelet
analysis, how certain variables influence on the
operating conditions of deceleration. A similar anal-
ysis is presented in [6], which concerns the selected
braking parameters of CHP2000 and PP16 type
chaters using the analysis of recursive patterns.
Regarding the study of elevator systems with
uncertain operating conditions, the literature is not
very comprehensive. The only works in this line
known by the authors are [7, 8], developed by
Kaczmarczyk et al., who attempt to analyze the
behavior of balance ropes due to harmonic and
stochastic excitations, and Colon et al. [9], who
calculate the propagation of the rail profile uncertain-
ties and study the effectiveness of a closed-loop
control law.
Even with the scientific literature being rich in
studies regarding the behavior of vehicles brake
systems under changing operating conditions
[10–12], it is surprising that, to the best of authors’
knowledge, no similar research description on lift
brakes has been reported up to the present date. Only
general provisions contained in the British Standard
Document BS EN 81 [13, 14] are to be found.
Thus, seeking to fill this gap, the present work aims
to study the influence of some operating conditions on
the efficiency of an elevator brake device, by analyz-
ing how the operating parameters underlying uncer-
tainties propagate through the mechanical system. In
particular, the cam brake angle and the spring reaction
force are of interest. In addition to quantifying the
effects of uncertainties in operating conditions, this
study also aims to achieve a robust design of a brake
system by solving a nonlinear optimization problem,
considering (or not) the uncertainty effects.
The remaining part of this paper is organized as
follows: the deterministic modeling of the lift brake
systems under study is presented in Sect. 2. In Sect. 3,
the construction of a consistent stochastic model of
uncertainties to deal with variabilities in the uncertain
parameters, is presented. Two optimization problems,
one classical and one robust, which seek to find an
optimal design for the brake system are formulated in
Sect. 4. In Sect. 5, numerical experiments are reported
and discussed. Finally, in Sect. 6, concluding remarks
are presented.
2 Deterministic modeling
2.1 Elevator brake system
A schematic representation of the CHP 2000 safety
gear, used by a typical friction crane brake system, is
presented in Fig. 1. It consists of a monolithic steel
body (1), in which a braking cam (5) is mounted on a
bolt. The braking cam moves the brake roller (2),
which has a knurled surface. This irregular surface is
responsible for the braking process and for the
cooperation with the guide roller surface. The brake
roller moves over the braking cam surface until it
contacts the lift guide (6). It is a free movement that
does not cause any braking effect. The second part of
Fig. 1 Schematic representation of the CHP 2000 safety gear
used by a friction crane brake system, which consists of the
following parts: 1—steel body; 2—brake roller; 3—thrust plate;
4—spring package; 5—braking cam; 6—lift guide
123
1058 Meccanica (2019) 54:1057–1069

the braking process is in constant contact with the lift
guide surface.
An illustration of a typical friction crane brake
system used by lifting devices is shown in Fig. 2,
which indicates the different components of the
mechanism (see the caption). It consists of two safety
gears, moving on the lift guides, connected to each
other to ensure simultaneous operation when the
brakes are activated by means of a trigger lever. A lift
safety gear is placed in the frame, under a safety gear
cabin. Its trigger is attached to the trigger lever, in
which the end is connected to the rope speed limiter. In
the upper part of the elevator shaft there is a speed
limiter supervising the work of the safety gear, and in
its lower part load responsible for causing the proper
tension of the speed limiter rope is located. The speed
limiter triggers the braking process when the nominal
speed of the elevator car is increased by 0.3 m/s. After
exceeding the nominal speed, the speed limiter is
blocked, and the rope is also immobilized.
During the movement of an elevator car with
locked components, the lever is moved in the opposite
direction to the cabin, triggering the brake safety gear
roll. In its turn, the roll is pressed against the guide
causing elastic deformation towards the thrust plate
located on the other side of the disk spring package,
which induces the loss of energy in the accelerating
mass. Therefore, the disc spring package is responsible
for a variable force that presses the roller to the guide
during the braking process.
2.2 Mathematical model
The design assumptions and safety gear structure
shown in Fig. 1 are taken into account to construct a
mathematical model that relates the braking force with
geometric parameters and other characteristics of the
mechanical system. In this sense, equilibrium condi-
tions for the system are deduced below.
A free-body diagram can be seen in Fig. 3, which
shows a schematic representation of the forces (in red)
acting on the safety gear steel body, and the underlying
geometric dimensions (in blue).
A balance of forces and the moments acting on the
steel body gives rise to the equations
Fig. 2 Illustration of a typical friction crane brake system used
by lifting devices, which consists of the following parts: 1—
safety gear cabin; 2—trigger lever; 3—safety gears connector;
4—rope speed limiter
Fig. 3 Illustration of the forces (in red) acting on the safety gear
steel body and the underlying geometric dimensions (in blue).
(Color figure online)
123
Meccanica (2019) 54:1057–1069 1059
� N4 þ Fs þ Rx ¼ 0; ð1Þ
T4 � Ry � ðFg þ FbÞ=2 ¼ 0; ð2Þ
� Fs a� Ry lþ N4 m� T4 n ¼ 0; ð3Þ
where Fs is the spring reaction force; Fb is the inertial
force from the cabin and lifting capacity; Fg is the
cabin and lifting capacity weight; T4 is the friction
force between the guide and brake retaining block, and
N4 is the corresponding normal force; Rx and Ry are the
reaction forces in the braking cam rotation point; while
a, l, m and n are geometric dimensions depicted in
Fig. 3.
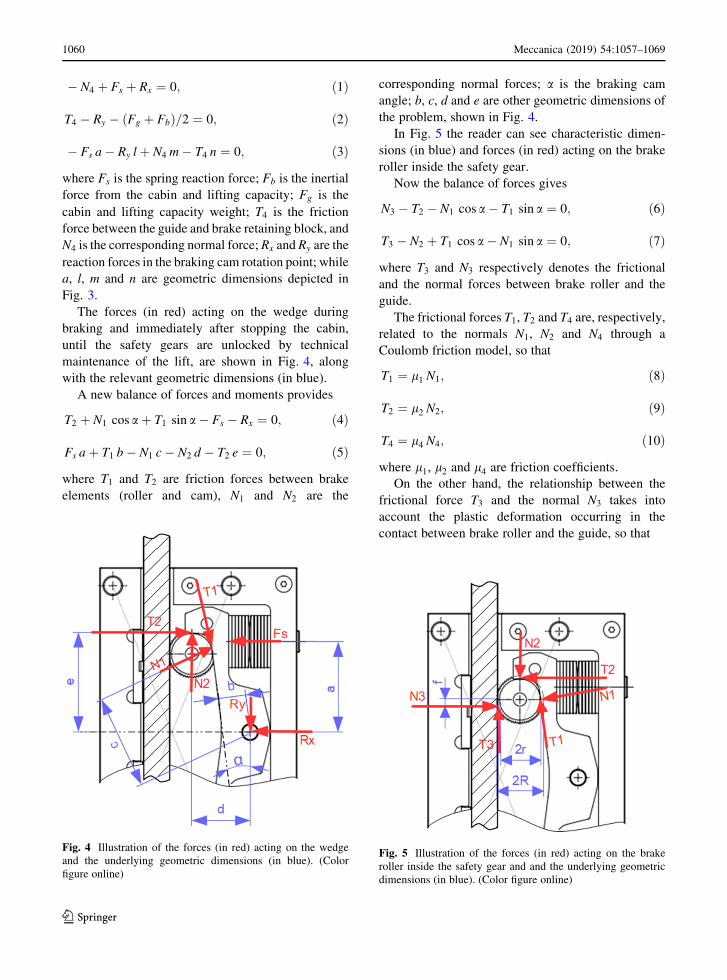
The forces (in red) acting on the wedge during
braking and immediately after stopping the cabin,
until the safety gears are unlocked by technical
maintenance of the lift, are shown in Fig. 4, along
with the relevant geometric dimensions (in blue).
A new balance of forces and moments provides
T2 þ N1 cos aþ T1 sin a� Fs � Rx ¼ 0; ð4Þ
Fs aþ T1 b� N1 c� N2 d � T2 e ¼ 0; ð5Þ
where T1 and T2 are friction forces between brake
elements (roller and cam), N1 and N2 are the
corresponding normal forces; a is the braking cam
angle; b, c, d and e are other geometric dimensions of
the problem, shown in Fig. 4.
In Fig. 5 the reader can see characteristic dimen-
sions (in blue) and forces (in red) acting on the brake
roller inside the safety gear.
Now the balance of forces gives
N3 � T2 � N1 cos a� T1 sin a ¼ 0; ð6Þ
T3 � N2 þ T1 cos a� N1 sin a ¼ 0; ð7Þ
where T3 and N3 respectively denotes the frictional
and the normal forces between brake roller and the
guide.
The frictional forces T1, T2 and T4 are, respectively,
related to the normals N1, N2 and N4 through a
Coulomb friction model, so that
T1 ¼ l1 N1; ð8Þ
T2 ¼ l2 N2; ð9Þ
T4 ¼ l4 N4; ð10Þ
where l1, l2 and l4 are friction coefficients.
On the other hand, the relationship between the
frictional force T3 and the normal N3 takes into
account the plastic deformation occurring in the
contact between brake roller and the guide, so that
Fig. 4 Illustration of the forces (in red) acting on the wedge
and the underlying geometric dimensions (in blue). (Color
figure online)
Fig. 5 Illustration of the forces (in red) acting on the brake
roller inside the safety gear and and the underlying geometric
dimensions (in blue). (Color figure online)
123
1060 Meccanica (2019) 54:1057–1069

T3 ¼ f
RN3; ð11Þ
where f and R are geometric dimensions defined in
Fig. 5.
The vertical reaction force Ry can be obtained from
Eqs. (2) and (3),
Ry ¼ � T4 þðFg þ FbÞ
2; ð12Þ
Ry ¼Fs a� N4 mþ T4 n
l; ð13Þ
which, when combined together with Eq. (10), allows
one to express N4 as
N4 ¼ ðFg þ FbÞ l=2 � Fs a
l4 ðnþ lÞ � m: ð14Þ
Similarly, from suitable manipulations of Eqs. (6), (8)
and (9), it can be concluded that
N3 ¼ l2 N2 þ ðl1 sin aþ cos aÞN1; ð15Þ
as well as, from Eqs. (5), (8) and (9), it is possible to
obtain
N2 ¼ a Fs þ ðb l1 � cÞN1
d þ e l2
; ð16Þ
which, in combination with Eqs. (1), (4), (8) and (9),
gives rise to
N1 ¼N4 �
a l2 Fs
d þ e l2
l1 sin aþ cos aþ l2 ðb l1 � cÞd þ e l2
: ð17Þ
The braking force, resulting from the joint superpo-
sition of all frictional forces, is given by
Fh ¼ T1 þ T2 þ T3 þ T4; ð18Þ
which, with aid of Eqs. (8)–(11), can be rewritten as
Fh ¼ l1 N1 þ l2 N2 þf
RN3 þ l4 N4: ð19Þ
Note that, once normal forces N1, N2, N3 and N4
present explicit dependence on geometric dimensions,
frictional coefficients, and non-frictional forces, the
braking force Fh is also a function of these parameters,
i.e.,
Fh ¼ Fhða;Fs;Fg;Fb; l1; l2; l4; . . .
. . .a; b; c; d; e; f ; l;m; n;RÞ:ð20Þ
3 Stochastic modeling
The angle a and the spring reaction force Fs are
subjected to variabilities during the operation condi-
tions of the brake system, so that their actual values
may be very different from the nominal project values.
Since they are the critical parameters for the brake
system efficiency, studying the effect of such vari-
abilities on the braking force is essential for a good
design. In this way, a parametric probabilistic
approach [15, 16] is employed here to construct a
consistent stochastic model for uncertain parameters aand Fs.
3.1 Probabilistic framework
Let ðH;R;PÞ be the probability space used to describe
the model parameters uncertainties [16, 17], where His the sample space, R a r-field over H, and P : R !½0; 1� a probability measure.
In this probabilistic setting, the parameters a and Fs
are respectively described by the random variables
X1 : H ! R and X2 : H ! R, which are lumped into
the random vector X : H ! R2, which associates to
each elementary event h 2 H a vector X ¼ ðX1;X2Þ.The probability distribution of X is characterized by
the map pX : R2 ! ½0;þ1Þ, dubbed the joint proba-
bility density function (PDF).
The mean value of X is defined in terms of the
expected value operator
E Xf g ¼Z Z
R2
x pXðxÞ dx ; ð21Þ
in which x ¼ ðx1; x2Þ and dx ¼ dx1 dx2.
3.2 Maximum entropy principle
To perform a judicious process of uncertainty quan-
tification, it is essential to construct a consistent
stochastic model for the random vector X, that
represents the uncertainties in a and Fs in a rational
way, trying to be unbiased as possible. In this sense, in
order to avoid possible physical inconsistencies in the
123
Meccanica (2019) 54:1057–1069 1061
probabilistic model, only available information must
be used in its construction [16, 17]. When this
information materializes in the form of a large set of
experimental data, the standard procedure is to use a
nonparametric statistical estimator to infer the joint
distribution of X [16, 17]. However, if little (or even
no) experimental data for X1 and X2 is available, as is
the case of this paper, such construction can be done
based only on known theoretical information, with the
aid of the maximum entropy principle [16, 17].
The available theoretical information about the
random parameters X1 and X2 encompasses a range of
possible values for each of then, i.e.,
ðX1;X2Þ 2 ½a1; a2� � ½c1; c2� � ½0; 2p� � ð0;þ1Þ;ð22Þ
as well as their nominal values lX1and lX2
, that are
assumed to be equal to their mean values, i.e.,
E X1f g ¼ lX12 ½a1; a2�; ð23Þ
E X2f g ¼ lX22 ½c1; c2�: ð24Þ
This information is translated into the statistical
language through the normalization condition
Z c2
c1
Z a2
a1
pXðxÞ dx ¼ 1; ð25Þ
and the first order moment equation
Z c2
c1
Z a2
a1
x pXðxÞ dx ¼ lX1; lX2
� �: ð26Þ
From the information theory point of view, the most
rational approach to specify the distribution of X in
this scenario of reduced information is through the
maximum entropy principle (MaxEnt) [16–18], which
seeks the PDF that maximizes the entropy functional
SðpXÞ ¼ �Z c2
c1
Z a2
a1
pXðxÞ ln pXðxÞ dx ; ð27Þ
respecting the restrictions (information) defined by
(25) and (26).
Using the Lagrange multipliers method it is possi-
ble to show that such joint PDF is given by
pXðxÞ ¼ pX1ðx1Þ � pX2
ðx2Þ; ð28Þ
with marginal densities
pX1ðx1Þ ¼ exp �k10 � k11 x1ð Þ 1½a1;a2�ðx1Þ; ð29Þ
pX2ðx2Þ ¼ exp �k20 � k21 x2ð Þ 1½c1;c2�ðx2Þ; ð30Þ
where k10, k11, k20 and k21 are parameters of the
distribution of X, and
1IðxÞ ¼1; x 2 I;
0; x 62 I;
�ð31Þ
denotes the indicator function of the interval I. Note
that, since no information relative to the cross
statistical moments between X1 and X2 has been
provided, MaxEnt provides independent distributions.
The parameters k10, k11, k20 and k21 depend on a1,
a2, c1, c2, lX1and lX2
. They are computed through the
nonlinear system of equations obtained by replacing
(28) in (26) and in the normalization conditions of the
marginal PDFs (29) and (30).
In a scenario with little information, it is practically
impossible not to be biased in choosing a probability
distribution. The MaxEnt formalism provides the least
biased distribution that is consistent with the known
information, therefore constituting the most rational
approach [18].
3.3 Uncertainty propagation
The mathematical model relating the braking force Fh
with braking cam angle a and the spring reaction force
Fs, Eq. (20), can be thought abstractly as a nonlinear
deterministic functional M that maps a vector of input
parameters x ¼ ða;FsÞ into a scalar quantity of interest
y ¼ Fh, i.e.,
x 7!y ¼ MðxÞ: ð32Þ
Thus, if the uncertain parameters a and Fs are
represented by the known random vector X, the
braking force becomes the random variable
Y ¼ MðXÞ, for which the distribution must be
estimated.
The process of determining the distribution of Y,
once the probabilistic law of X is known, is dubbed
uncertainty propagation problem [15, 16], being
addressed in this paper via the Monte Carlo simulation
[19, 20].
In this stochastic calculation technique, m indepen-
dent samples of X are drawn according to the density
(28), giving rise to statistical realizations
123
1062 Meccanica (2019) 54:1057–1069

Xð1Þ;Xð2Þ; . . .;XðmÞ: ð33Þ
Each of these scenarios for X is given as input to the
nonlinear deterministic map x 7!y ¼ MðxÞ, resulting
in a set of possible realizations for the quantity of
interest
Y ð1Þ; Y ð2Þ; . . .; Y ðmÞ; ð34Þ
where YðjÞ ¼ MðXðjÞÞ; j ¼ 1; . . .; m. These samples are
used to estimate statistics of Y non-parametrically, i.e.,
without assuming the PDF shape known [21].
4 Optimization framework
Regarding the improvement of brake system effi-
ciency, an optimal design of its components is
required. This work addresses this question by solving
nonlinear optimization problems that seeks to maxi-
mize the braking force, using geometric dimensions of
the system as design variables.
Two optimization approaches are employed. The
first one, named classical, is based on deterministic
formalism of nonlinear programming [22], while the
latter, dubbed robust, takes into account the model
parameters uncertainties, in order to reduce the
optimum point sensitivity to small disturbances
[23, 24].
In this framework, a set of two design variables
(geometric dimensions) is denoted generically by the
vector s. The other parameters of the model are
denoted generically by x, and the model response is
given by the nonlinear map ðs; xÞ7!y ¼ Mðs; xÞ The
quantity of interest to be optimized (objective func-
tion) is denoted generically by J .
4.1 Classical optimization
In this classical optimization approach the s compo-
nents are employed as design variables, while the
braking force is adopted as objective function, i.e.,
J CðsÞ ¼ y: ð35Þ
The admissible set for this optimization problem is
defined by AC ¼ ½smin1 ; smax1 � � ½smin2 ; smax2 �, so that it
can be formally stated as find an optimal design vector
soptC ¼ arg maxs2AC
J CðsÞ: ð36Þ
4.2 Robust optimization
In this robust optimization framework, which is based
on those shown in [25, 26], the uncertainties are
described according to the formalism of the Sect. 3,
where x becomes the random vector X, and, as a
consequence, y ¼ Mðs; xÞ becomes the random vari-
able Y ¼ Mðs;XÞ.Thus, the robust objective function is not con-
structed directly from the model response, but with the
aid of statistical measures of Y, which aims to
guarantee greater stability to small disturbances (ro-
bustness) to an optimum point.
Specifically, the robust objective function is given
by a convex combination between minimum, maxi-
mum, mean and standard deviation inverse, so that
J RðsÞ ¼ b1 minh2H
Yf g þ b2 maxh2H
Yf g þ b3 E Yf g
þ b4
1ffiffiffiffiffiffiffiffiffiffiffiffiffiffiffiffiffiffiffiffiffiffiffiffiffiffiffiffiffiffiffiffiE Y2f g � E Yf g2
q ; ð37Þ
where b1 þ b2 þ b3 þ b4 ¼ 1.
Note that by maximizing this robust objective
function, it is sought to raise both the lowest and the
highest possible value, the mean, in addition to
reducing the dispersion, by reducing the standard
deviation.
Additionally, in order to avoid excessively small
braking forces, the following probabilistic constraint
is imposed
P jY j[ y�f g� 1 � Pr; ð38Þ
where y� is a lower bound for the magnitude of Y, and
Pr is reference probability.
Therefore, the admissible set for the robust opti-
mization problem, denoted by AR, is defined as the
subset of AC for which the probabilistic constraint
(38) is respected. In this way, the robust optimization
problem is formally defined as find an optimal design
vector
soptR ¼ arg maxs2AR
J RðsÞ: ð39Þ
123
Meccanica (2019) 54:1057–1069 1063
5 Results and discussion
The simulations reported below, conducted in Matlab,
use the following numerical values for the determin-
istic parameters of the mechanical model: Fg ¼ 50
kN; Fb ¼ 30 kN; l1 ¼ 0:10; l2 ¼ 0:10; l4 ¼ 0:15;
a ¼ 55:0 mm; b ¼ 16:6 mm; c ¼ 52:7 mm; d ¼ 34:5
mm; e ¼ 60:7 mm; f ¼ 0:005 mm; l ¼ 49:0 mm; m ¼40:0 mm; n ¼ 17:5 mm; R ¼ 29:0 mm.
Regarding the two random parameters, the follow-
ing information is assumed: ½a1; a2� ¼ ½0; 18�;½c1; c2� ¼ ½0; 56� kN; lX1
¼ 6; and lX2¼ 42 kN.
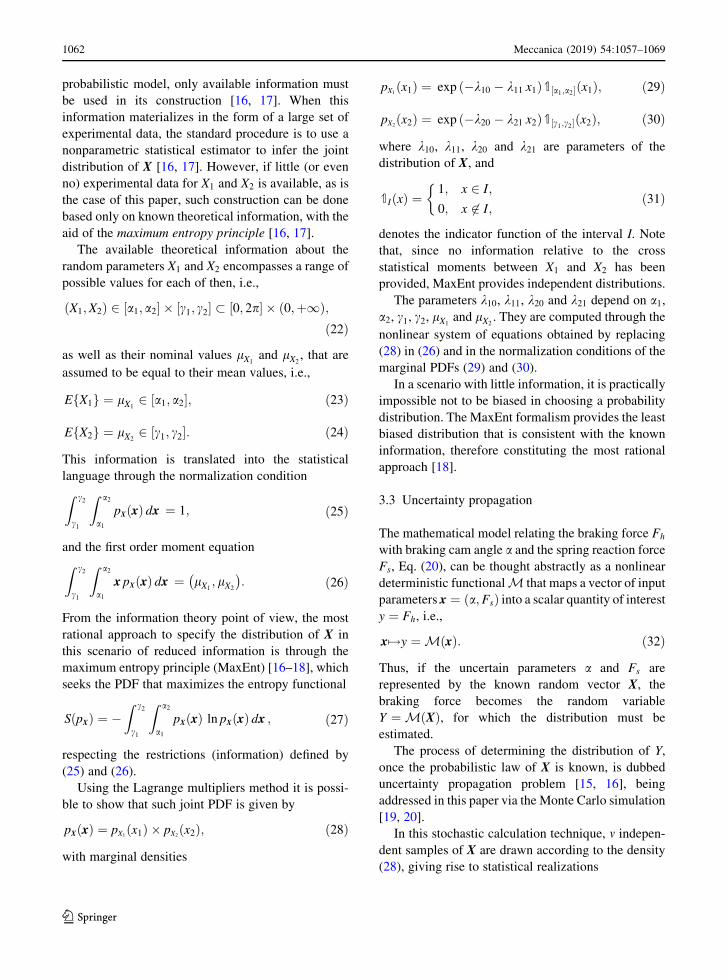
5.1 Uncertainty quatification
The calculation of the propagation of uncertainties of
X ¼ ðX1;X2Þ through the mechanical-mathematical
model (32) initially involves the generation of random
samples according to the probabilistic model defined
by Eq. (28). A set of 4096 random samples for X1 (top)
and X2 (bottom) can be seen in Fig. 6, which also
shows some statistics (mean, standard deviation and
95% confidence interval) for this set of values.
In Fig. 7 the reader can see the statistics shown in
Fig. 6 compared to the analytical curves for the PDFs
of X1 and X2, and histograms constructed with the
underlying random samples. It can be observed that
the sampling process is well conducted, since the
histograms and analytical curves present great
similarity.
Note that the brake cam angle X1 is modeled
according to a probability density with a descending
exponential behavior, which decays slowly between
the ends of the support ½a1; a2� ¼ ½0; 18�, whereas the
spring reaction force X2 is described by probabilistic
law with an increasing exponential density, which
grows rapidly from the left to the right extreme of
½c1; c2� ¼ ½0; 56� kN.
It is worth noting that, of course, the real system
parameters do not follow these probability distribu-
tions. These are only approximations of the real
distributions, constructed with the aid of the maximum
entropy principle and the available information about
these parameters. However, as in this paper the authors
do not have experimental data to infer the real form of
these distributions, in the light of information theory,
the PDFs of Fig. 7 are the best that can be inferred.
The next step involves the model evaluation in each
pair ðX1;X2Þ previously generated, which gives rise to
the set of possible values for the braking force Fh,
shown in the top part of Fig. 8. In the bottom part of
the same figure the reader can observe a histogram that
estimates the Fh PDF form, as well as a nonparametric
fitting obtained by a smooth curve. Mean, standard
deviation, and a 95% confidence interval can be seen
in both, top and bottom figures. To prove that these
estimates are reliable, the authors also show the
convergence of the mean and standard deviation
estimators, as a function of the number of samples,
in Fig. 9.
It may be noted that the PDFs of Fh and Fs have a
very similar shape, suggesting that the mechanical
model preserves the shape of the spring reaction force
distribution. This result is at the least curious and
unexpected, since the angular dependencies
0 1000 2000 3000 4000 sample index
5
10
15
cam
ang
le (
degr
ee)
samplemeanmean std 95% prob.
0 1000 2000 3000 4000
sample index
1
2
3
4
5
spr
ing
forc
e (N
)
104
samplemeanmean std 95% prob.
Fig. 6 Generated samples and statistical measures for the cam
angle (top) and the spring force reaction (bottom)
123
1064 Meccanica (2019) 54:1057–1069

introduced in the mechanical model by Eqs. (15) and
(17) define a structure of multiplicative uncertainty
between a and Fs, what should make Fh not invariant
with respect to the input distribution.
This result suggests that the nonlinearity associated
with the alpha parameter is very weak, which causes
Fh to behave as an affine map of Fs, and thus to
preserve the form of its distribution. This hypothesis is
reinforced by analyzing the system response by
keeping a distribution and Fs support fixed, while
the mean value of the latter parameter is varied,
assuming the values equal to for 14 kN, 28 kN1 and 42
kN. The probability densities corresponding to these
different inputs, and the corresponding outputs of the
mechanical system can be seen in Figs. 10 and 11,
respectively. In all cases the input and output PDFs
have the same shape.
The results of this study allow one to conclude that
uncertainties in a parameter does not have significant
influence on the braking force behavior. Simulations
propagating only a uncertainties, not included here
because of space limitation, demonstrate such an
assertion. However, the uncertainty propagation study
also shows that the variability of Fs cannot be ignored,
since it has great influence on the statistical behavior
of Fh.
5.2 Optimization
In this section the problem of optimum design of the
brake system is addressed. The geometric dimensions
s ¼ ða; cÞ are used as design variables, considering as
admissible region 50 a 60 mm and 50 c 55
mm.
0 5 10 15 cam angle (degree)
0
2
4
6
8
pro
babi
lity
dens
ity fu
nctio
n
PDFmeanmean std 95% prob.
1 2 3 4 5 spring force (N) 104
0
1
2
3
4
5
6
7
pro
babi
lity
dens
ity fu
nctio
n
10-5
PDFmeanmean std 95% prob.
Fig. 7 Probability density functions and statistical measures for
the cam angle (top) and the spring force reaction (bottom)
0 1000 2000 3000 4000 sample index
-5000
0
5000
10000
bra
king
forc
e (N
)
samplemeanmean std 95% prob.
-5000 0 5000 10000 braking force (N)
0
1
2
pro
babi
lity
dens
ity fu
nctio
n
10-4
PDFmeanmean std 95% prob.
Fig. 8 Generated samples (top) and probability density
function (bottom), with statistical measures, for the braking
force
1 For this value, which corresponds to the midpoint of the
support, the distribution degenerates into an uniform.
123
Meccanica (2019) 54:1057–1069 1065

The optimization problem is solved using the standard
sequential programming quadratic (SQP) algorithm
obtained from Matlab (see chap. 18 of [27]), being the
contour map of the objective function (35) illustrated in
Fig. 12, which also highlights the optimum point found.
Despite the fact that this result offers a starting
point for an optimal project for the brake system, it
does not take into account the effect of the uncertain-
ties underlying the operating conditions, which can
considerably affect the system response, as shown in
the previous section. In this way, robust optimization
presents itself as a natural alternative.
For the robust optimization problem the design
variables s ¼ ða; cÞ are considered once more, with the
same ranges of admissible values used above. The
uncertainties in a and Fs are modeled as in Sect. 3, and
the probabilistic constraint is characterized by the
parameters y� ¼ 0:5 kN and Pr ¼ 5%. The convex
weights b1 ¼ b2 ¼ b3 ¼ 2=10 and b4 ¼ 4=10 are
adopted in the robust objective function.
This second problem is much more complex
because the constraint to be satisfied is nonconvex,
offering additional challenges to the numerical
0 1000 2000 3000 4000 number of samples
4000
5000
6000
7000
8000
9000 b
raki
ng fo
rce
mea
n
0 1000 2000 3000 4000 number of samples
0
1000
2000
3000
4000
5000
bra
king
forc
e st
d de
viat
ion
Fig. 9 Statistical estimators convergence for the braking force
mean (top) and standard deviation (bottom)
1 2 3 4 5 spring force (N) 104
0
1
2
3
4
5
6
7
pro
babi
lity
dens
ity fu
nctio
n
10-5
PDFmeanmean std 95% prob.
1 2 3 4 5 spring force (N) 104
0
0.5
1
1.5
2
pro
babi
lity
dens
ity fu
nctio
n
10-5
PDFmeanmean std 95% prob.
1 2 3 4 5 spring force (N) 104
0
1
2
3
4
5
6
7
pro
babi
lity
dens
ity fu
nctio
n
10-5
PDFmeanmean std 95% prob.
Fig. 10 Probability density functions and statistical measures
for the spring force reaction with different mean values: 14 kN
(top); 28 kN (middle); 42 kN (bottom)
123
1066 Meccanica (2019) 54:1057–1069

solution procedure. But for the values described above
the SPQ algorithm is able to find a solution.
The reader can see the contour map of the
probabilistic constraint (38) in Fig. 13, while Fig. 14
presents the contour map for the robust objective
function (37). Although the objective function still
maintains a smooth appearance, the problem gains a
non-convex status by the irregular forms of constraint.
Once the robust objective function takes into
account other design criteria than in (35), its behavior
is different from the classical objective function
shown in Fig. 12, thus having a different optimal
point.
It is also worth noting that this second formulation
of the optimization problem considers the effects of
uncertainties, which in a realistic system are always
present, thus offering a design option more suitable for
projects that cannot ignore such variabilities.
-5000 0 5000 10000 braking force (N)
0
0.5
1
1.5
pro
babi
lity
dens
ity fu
nctio
n10-4
PDFmeanmean std 95% prob.
-5000 0 5000 10000 braking force (N)
0
1
2
3
4
5
6
7
pro
babi
lity
dens
ity fu
nctio
n
10-5
PDFmeanmean std 95% prob.
-5000 0 5000 10000 braking force (N)
0
1
2
pro
babi
lity
dens
ity fu
nctio
n
10-4
PDFmeanmean std 95% prob.
Fig. 11 Probability density functions and statistical measures
for the braking force with different input mean values for Fs: 14
kN (top); 28 kN (middle); 42 kN (bottom)
classical optimization
50 52 54 56 58 60
geometric dimension a (mm)
50
51
52
53
54
55
geo
met
ric d
imen
sion
c (
mm
)
6500
7000
7500
8000
8500
9000
Fig. 12 Contour map for the classical objective function and
with the optimum point is indicated by a cross
probabilistic constraint
50 52 54 56 58 60 geometric dimension a (mm)
50
51
52
53
54
55
geo
met
ric d
imen
sion
c (
mm
)
-0.032
-0.03
-0.028
-0.026
-0.024
Fig. 13 Contour map for probabilistic constraint with the
optimum point is indicated by a cross
123
Meccanica (2019) 54:1057–1069 1067

6 Summary and conclusions
This work presents a study regarding the optimization
and uncertainty quantification of an elevator brake
system. The paper starts from an original construction
of a safety gear for the brake, for which a mechanical-
mathematical model is constructed. Studies involving
the quantification of the braking force uncertainties
due to the variability in the brake cam angle and the
spring reaction force are presented, showing that
spring force uncertainties are more significant. The
paper also focuses on the optimal design of an elevator
brake system, showing through the solution of a robust
optimization problem that operating conditions uncer-
tainties can significantly influence its efficiency.
Funding This research was financed in the framework of the
project Lublin University of Technology-Regional Excellence
Initiative, funded by the Polish Ministry of Science and Higher
Education (Contract No. 030/RID/2018/19). The Grzegorz
Litak acknowledge the financial support given by the
Brazilian agencies Carlos Chagas Filho Research Foundation
of Rio de Janeiro State (FAPERJ) under Grants E-26/
010.002.178/2015 and E-26/010.000.805/2018 and
Coordenacao de Aperfeicoamento de Pessoal de Nıvel
Superior - Brasil (CAPES) - Finance Code 001.
Compliance with ethical standards
Conflict of interest The authors declare that they have no
conflict of interest.
Open Access This article is distributed under the terms of the
Creative Commons Attribution 4.0 International License (http://
creativecommons.org/licenses/by/4.0/), which permits unrest-
ricted use, distribution, and reproduction in any medium, pro-
vided you give appropriate credit to the original author(s) and
the source, provide a link to the Creative Commons license, and
indicate if changes were made.
References
1. Lonkwic P (2017) Selected issues of the operating process
of slide catches. Monography, Politechnika Lubelska,
Lublin (in polish)
2. Pater Z (2011) Selected topics from the history of technol-
ogy. Monography, Politechnika Lubelska, Lublin (in polish)
3. Yost GR, Rothenfluh TR (1996) Configuring elevator sys-
tems. Int J Hum Comput Stud 44:521–568. https://doi.org/
10.1006/ijhc.1996.0023
4. Lonkwic P (2015) Influence of friction drive lift gears
construction on the length of braking distance. Chin J Mech
Eng 28:363–368. https://doi.org/10.3901/CJME.2015.0108.
009
5. Lonkwic P, Łygas K, Wolszczak P, Molski S, Litak G (2017)
Braking deceleration variability of progressive safety gears
using statistical and wavelet analyses. Measurement
110:90–97. https://doi.org/10.1016/j.measurement.2017.06.
005
6. Lonkwic P, Syta A (2016) Nonlinear analysis of braking
delay dynamics for the progressive gears in variable oper-
ating conditions. J Vibroeng 18:4401–4408. https://doi.org/
10.21595/jve.2016.17000
7. Kaczmarczyk S, Iwankiewicz R (2006) Dynamic response
of an elevator car due to stochastic rail excitation. In: Pro-
ceedings of the Estonian Academy of Sciences, vol 55
8. Kaczmarczyk S, Iwankiewicz R, Terumichi Y (2009) The
dynamic behaviour of a non-stationary elevator compen-
sating rope system under harmonic and stochastic excita-
tions. J Phys Conf Ser 181:012047. https://doi.org/10.1088/
1742-6596/181/1/012047
9. Colon D, Cunha A Jr, Kaczmarczyk S, Balthazar JM (2017)
On dynamic analysis and control of an elevator system using
polynomial chaos and Karhunen–Loeve approaches. Proc
Eng 199:1629–1634. https://doi.org/10.1016/j.proeng.2017.
09.083
10. Renault A, Massa F, Lallemand B, Tison T (2016) Experi-
mental investigations for uncertainty quantification in brake
squeal analysis. J Sound Vibr 367:37–55. https://doi.org/10.
1016/j.jsv.2015.12.049
11. Dezi M, Forte P, Frendo F (2014) Motorcycle brake squeal:
experimental and numerical investigation on a case study.
Meccanica 49:1011–1021. https://doi.org/10.1007/s11012-
013-9848-y
12. Knops RJ, Villaggio P (2006) An optimum braking strategy.
Meccanica 41:693–696. https://doi.org/10.1007/s11012-
006-9011-0
13. British Standards Institution (2018) Safety rules for the
construction and installation of lifts: lifts for the transport of
persons and goods–part 20: Passenger and goods passenger
lifts. British Standards Institution, London
14. British Standards Institution (2018) Safety rules for the
construction and installation of lifts: examinations and
tests–part 50: Design rules, calculations, examinations and
tests of lift components. British Standards Institution,
London
robust optimization
50 52 54 56 58 60 geometric dimension a (mm)
50
51
52
53
54
55
geo
met
ric d
imen
sion
c (
mm
)
1800
2000
2200
2400
2600
2800
3000
Fig. 14 Contour map for the robust objective function with the
optimum point is indicated by a cross
123
1068 Meccanica (2019) 54:1057–1069

15. Cunha A Jr (2017) Modeling and quantification of physical
systems uncertainties in a probabilistic framework. In:
Ekwaro-Osire S, Goncalves AC, Alemayehu FM (eds)
Probabilistic prognostics and health management of energy
systems. Springer, New York, pp 127–156. https://doi.org/
10.1007/978-3-319-55852-3_8
16. Soize C (2017) Uncertainty quantification: an accelerated
course with advanced applications in computational engi-
neering. Springer, New York. https://doi.org/10.1007/978-
3-319-54339-0
17. Soize C (2013) Stochastic modeling of uncertainties in
computational structural dynamics: recent theoretical
advances. J Sound Vibr 332:2379–2395. https://doi.org/10.
1016/j.jsv.2011.10.010
18. Kapur JN, Kesavan HK (1992) Entropy optimization prin-
ciples with applications. Academic Press, Cambridge
19. Kroese DP, Taimre T, Botev ZI (2011) Handbook of Monte
Carlo methods. Wiley, Hoboken
20. Cunha A Jr, Nasser R, Sampaio R, Lopes H, Breitman K
(2014) Uncertainty quantification through Monte Carlo
method in a cloud computing setting. Comput Phys Com-
mun 185:1355–1363. https://doi.org/10.1016/j.cpc.2014.
01.006
21. Wasserman L (2007) All of nonparametric statistics.
Springer, New York
22. Bonnans JF, Gilbert JC, Lemarechal C, SagastizAbal CA
(2009) Numerical optimization: theoretical and practical
aspects, 2nd edn. Springer, New York
23. Beyer HG, Sendhoff B (2007) Robust optimization: a
comprehensive survey. Comput Methods Appl Mech Eng
196:3190–3218. https://doi.org/10.1016/j.cma.2007.03.003
24. Gorissen BL, Yanikoglu I, den Hertog D (2015) A practical
guide to robust optimization. Omega 53:124–137. https://
doi.org/10.1016/j.omega.2014.12.006
25. Cunha A Jr, Soize C, Sampaio R (2015) Computational
modeling of the nonlinear stochastic dynamics of horizontal
drillstrings. Comput Mech. https://doi.org/10.1007/s00466-
015-1206-6
26. Cuellar N, Pereira A, Menezes IFM, Cunha A Jr (2018)
Non-intrusive polynomial chaos expansion for topology
optimization using polygonal meshes. J Braz Soc Mech Sci
Eng 40:561. https://doi.org/10.1007/s40430-018-1464-2
27. Nocedal J, Wright S (2006) Numerical optimization, 2nd
edn. Springer, New York
Publisher’s Note Springer Nature remains neutral with
regard to jurisdictional claims in published maps and
institutional affiliations.
123
Meccanica (2019) 54:1057–1069 1069