
Robust Design Engineering Excellence Hardware Fundamentals Workshop Prepared By: The Engineering...
38
Robust Design Engineering Excellence Hardware Fundamentals Workshop Prepared By: The Engineering Excellence Institute Xerox Corporation, Webster, New York 14580 Copyright 1996 Xerox Corporation. All rights reserved. July 1996 Revision #002
-
Upload
kory-clarke -
Category
Documents
-
view
215 -
download
1
Transcript of Robust Design Engineering Excellence Hardware Fundamentals Workshop Prepared By: The Engineering...

Robust Design
Engineering ExcellenceHardware Fundamentals Workshop
Prepared By:
The Engineering Excellence Institute
Xerox Corporation, Webster, New York 14580
Copyright 1996 Xerox Corporation. All rights reserved.
July 1996
Revision #002

2
EEFW - Robust Design Revision #002
At the end of this module you will be able to:
• Describe the basic concepts of Robust Design
• Describe the basic elements of Robust Design
• State how Robust Design impacts the entire design process to
improve TTM
• Relate Robust Design to the Design Quality Process
• List the process steps to achieving Robust Design• Recognize the Robust Design Quality Enablers and inspect for
this robustness
Objectives

3
EEFW - Robust Design Revision #002
Technology Readiness
3.2
DefineProduct &DeliverTechnology
DemonstrateProduct
3.4
DeliverProduct
3.5
DelightCustomers
3.63.3
Design Product
Market &
Product
Strategy
Vision
3.1
DefineProductPlatform &Technology
Product Launch ReadinessTechnology/Design Validation
As we progress towards Robust Design crossover occurs sooner and the length of the Design and Demonstration Phases decreases
A larger S/N ratio results in a robust design with the latitude to accommodate ‘Noises’
DesignLatitude Variance
Major Connections To Time To Market
The “Bottle Model”.........
4
EEFW - Robust Design Revision #002
Major Connections To Time To Market
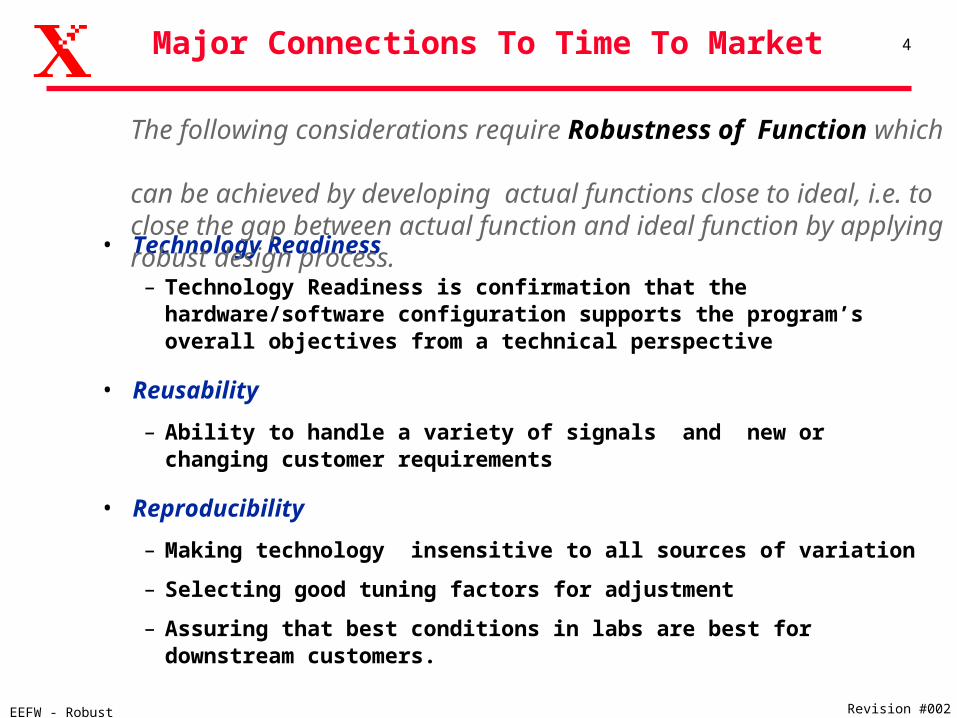
• Technology Readiness
– Technology Readiness is confirmation that the hardware/software configuration supports the program’s overall objectives from a technical perspective
• Reusability
– Ability to handle a variety of signals and new or changing customer requirements
• Reproducibility
– Making technology insensitive to all sources of variation
– Selecting good tuning factors for adjustment
– Assuring that best conditions in labs are best for downstream customers.
The following considerations require Robustness of Function which can be achieved by developing actual functions close to ideal, i.e. to close the gap between actual function and ideal function by applying robust design process.

5
EEFW - Robust Design Revision #002
• Develop low cost product designs, mfg process designs, measurement system designs with consistent functional performance under a wide range of usage conditions through systems intended life.
• Improve product quality within constraints of cost and time, through more efficient, customer focused, R&D activities.
• Achieve desired customer performance through optimization of designs, rapid commercialization of technologies, and reduced quality loss after shipment
Purpose of Robust Design

Product Quality Model: Quality achieved when VOC is met, and the enablers are process capable.
BAB 6/6/96
Voice of the Customer (VOC)
1
1a
22a
House 1System
PerformanceSpec Devlp. Production and
Quality Control Planning Matrix
Multiple Houses
Pre planning matrix1 VOC1a Customer
Importance Rating
2 CustomerCompetitive Evaluation
2a XC Strategy and Quality Plan
House 2Module Level
CriticalParameter
Devlp.House 3
Subsystem LevelCritical
ParameterDevlp.
House 4Component Level
Critical Specifications
Devlp.
House 5Manufacturing
Process ParameterDevlp.
Integrated System Design
3.1 3.3 Design 3.4 Demonstrate 3.5 Deliver3.2 Define
Manufacturing Quality • Key Quality Indicators• Manufacturing Quality Plan• Design/Manufacturing Readiness
• Product Verification Test (PVT) Implementation• Supplier Process Certification• Manufacturing Process Robustness
• Planning / Customizing
• Status vs Plan • Verification, Plan customer satisfaction monitoringDesign Quality
Software Process Management and Software Capability Maturity
Reusability Technology, Modules, Manufacturing Process and Parts
Technology Readiness Selection Ready Validation
Process Qualification of Critical Specifications and enablers
Robust Design
• Data and DemonstrationCritical Parameter Management Implementation • Critical Parameter
Process Capability Verification
Optimum Nominal Value and Tolerance of Critical Parameters/Critical Specs DeterminedParameter Design Phase
Trade-offs - (Exceptions) Performance vs CostTolerance Design Phase
Optimum Concept Selected - Best of Breed Will Meet VOC at Lowest CostConcept Design
MPSV 3.6
Quality Function Deployment (QFD)
Customer Feedback
Market Analysis
Focus Interviews
Development
Quality:
• Key Quality Indicators • Quality Initial Design Emphasis• Problem Discovery Process
• Customer Survey
• Customer Survey• Supplier Process Qualification• Factory and Plan Implementation
• Plans/Strategy
On Line Quality Control

7
EEFW - Robust Design Revision #002
Robustness:
The ability of a product or process to function close to ideal customer satisfaction under actual conditions of use. A product or process is said to be robust when it is insensitive to the effects of sources of variability, even though the sources themselves have not been eliminated.
Robust Design:
A systematic engineering based methodology (which is part of a quality engineering process) that develops and manufactures high reliability products at low cost with reduced delivery cycle. The goal of Robust Design is to reduce cost and quality loss. Concept Design, Parameter Design, tolerance design and on-line QC are the 4 successive stages. Parameter design, most widely practiced,uses a two step optimization process --Maximizing S/N ratio and then Tuning to Target.
Ideal Function:
A mathematical relationship between input and output, which can be used for function or energy transfer optimization. Ideal function of resistor is Ohm’s law, to convert current to voltage.
Definitions

8
EEFW - Robust Design Revision #002
Control Factor:Factors affecting the function whose levels can be specified freely by engineer / designer. Their settings are used to amplify sensitivity to signal, dampen sensitivity to noise plus tuning to target .
Noise Factor:Factors affecting the function which cannot be controlled by the engineer/designer. Factors whose settings are difficult or expensive to control are also called noise factors. There are three noise classifications:
1) Internal 2) External 3) between product noises
Response factor:Response factors are often called the response variables, measurands, quality characteristics, outputs. These are also selected by engineers to pick up information about control, noise, and signal factor effects. Some desirable properties for responses include:- fundamental (related to basic energy transfer mechanism of input/output relationship) - continuous, quantitative - monotonic with changes in control factor levels , unambiguous.- should be complete (cover important dimensions of the function)
- valid, independent of imposed specifications - economical, timely
Signal Factor: Factor whose levels carry the information to easily change output response, usually related to input power.
It is based on the physics or engineering of the system.
Definitions

9
EEFW - Robust Design Revision #002
Each customer expects that every product will deliver the target performance each time the product is used, under all intended operating conditions, and throughout its intended life, with no harmful side effects.
“When a product’s performance deviates from the target performance, its quality is considered inferior. Such deviations in performance cause losses to the user of the product, and in varying degrees, to the rest of society.”
G. Taguchi (1992)
Zero Defects CPk S/N Ratio
Achieve Target Values
A B C
Ideal Quality
10
EEFW - Robust Design Revision #002
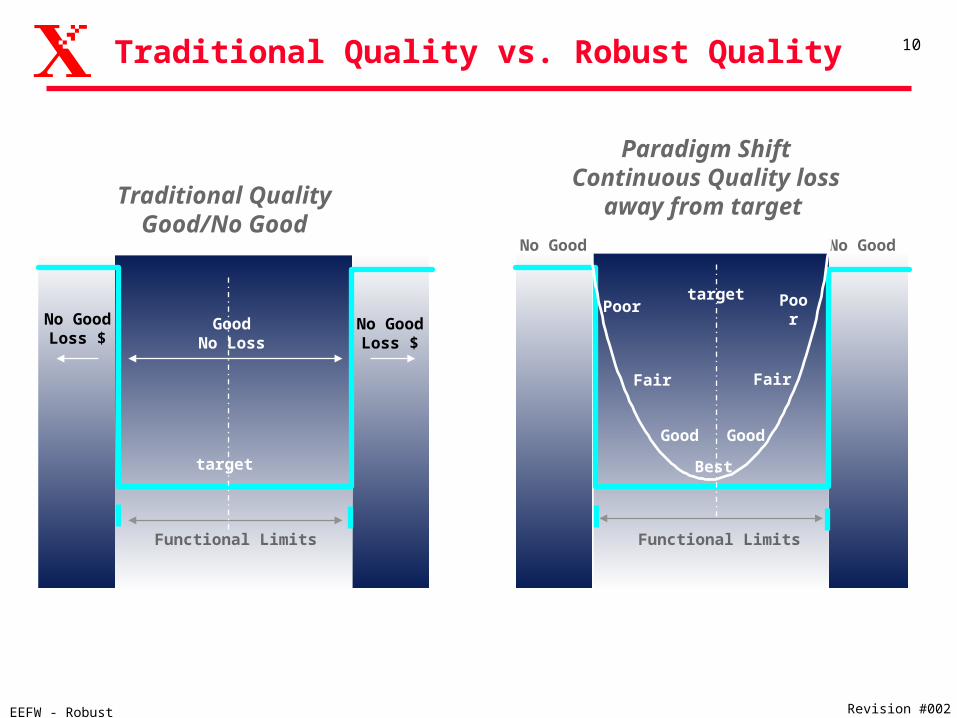
Traditional Quality vs. Robust Quality
Traditional QualityGood/No Good
No GoodLoss $
Functional Limits
GoodNo Loss
No GoodLoss $
Paradigm ShiftContinuous Quality loss
away from target
Functional Limits
No Good No Good
Poor
Good
Fair
Poor
Good
Fair
Best
target
target
11
EEFW - Robust Design Revision #002
Summary / The Robustness Paradigm
• Robustness = Problem Prevention
• Any deviation from target incurs a quality loss
• Don’t need to always control / eliminate the root cause to improve design
• High performance does not always require high cost
• Robust Design process is to improve efficiency of R&D
• Engineering focus using mathematical and statistical concepts

12
EEFW - Robust Design Revision #002
Proactive Quality Indicators of Robustness
Quality Indicator Desired StateS / N RatioReliable Measures of FunctionFunctional Limits / LatitudeImportant Noise FactorsRange of OperationPower ConsumptionBenchmark Comparison Test GapDesign ComplexityTuning FactorsCritical Parameter Nominal ValuesCostQuality LossSystem Integration ProblemsUnderstanding of DesignData Supporting Decisions
Gain Over TimeIdentifiedExpanded / IncreasedIdentifiedExpandedReducedReducedReducedIdentifiedIdentifiedNo IncreaseImprovedFewerImprovedUnambiguous
13
EEFW - Robust Design Revision #002
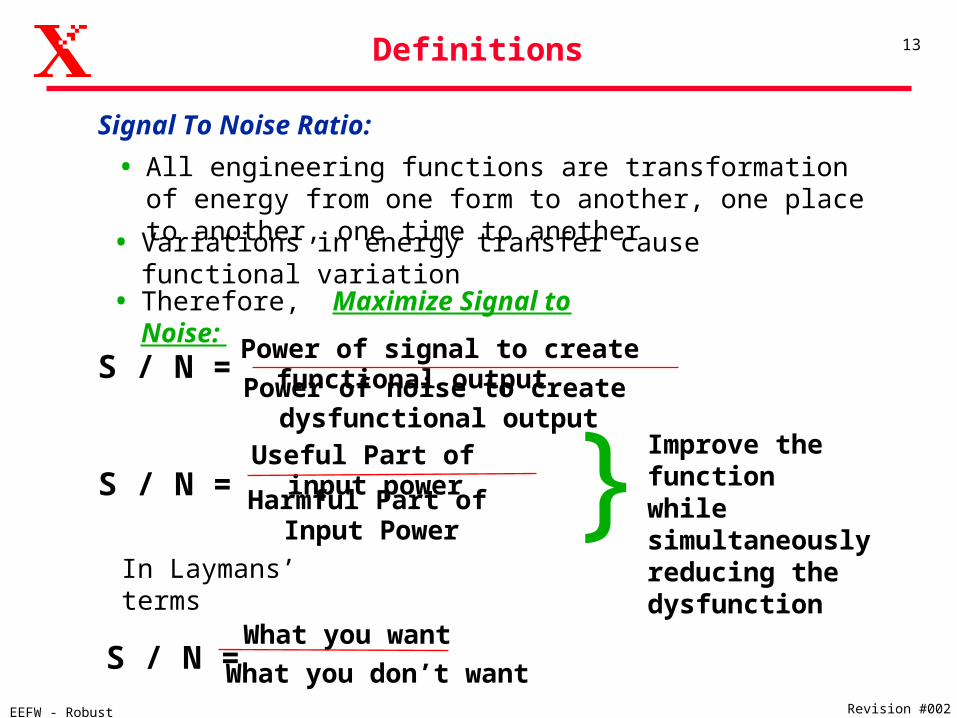
Signal To Noise Ratio:
Power of signal to create functional output
Power of noise to create dysfunctional output
Useful Part of input power
What you don’t want
S / N =
S / N =
• All engineering functions are transformation of energy from one form to another, one place to another, one time to another
• Variations in energy transfer cause functional variation
• Therefore, Maximize Signal to Noise:
} Improve the functionwhile simultaneouslyreducing the dysfunction
Definitions
In Laymans’ terms
S / N =What you want
Harmful Part of Input Power

14
EEFW - Robust Design Revision #002
Input
Output
DesignConcept
DesignConcept Manufacturing
Process Concept
ManufacturingProcess Concept
Robust ProductDesign
Robust ProductDesign
Robust Mfg. ProcessDesign
Robust Mfg. ProcessDesign
Robust Product Process Capable
ProcessSteps System Verification
Test Process
System VerificationTest Process
Tolerance DesignProcess
Tolerance DesignProcess
Production / FieldReadiness Test Process
Production / FieldReadiness Test Process On-Line Quality
Control Process
On-Line QualityControl Process
Manufacturing ToleranceDesign Process
Manufacturing ToleranceDesign Process
Mfg. Process VerificationTest Process
Mfg. Process VerificationTest Process
Parameter DesignOptimization Process
Parameter DesignOptimization Process Mfg. Process Parameter
Optimization Process
Mfg. Process ParameterOptimization Process
Robust Design as Part of Concurrent Engineering

15
EEFW - Robust Design Revision #002
In this innovation stage of the design process, the system and subsystem engineer examines a variety of architectures and technologies for achieving a desired function for a planned product and selects the most suitable one(s).
Once the concept is selected, the design engineer determines the best nominal values and tolerances for each of the critical parameters of the system / subsystem that will produce consistent output using low cost components and tolerances.
If at the end of the parameter design stage the output is not at or above benchmark , a third stage is introduced to improve quality by selectively adding cost by upgrading components and/or tightening tolerances, maintaining cost and quality balance.
Cost effective maintenance of quality
ConceptDesign
ToleranceDesign
ParameterDesign
On-Line QCDesign
Process Stages of Robust Design
ParameterDesign
16
EEFW - Robust Design Revision #002
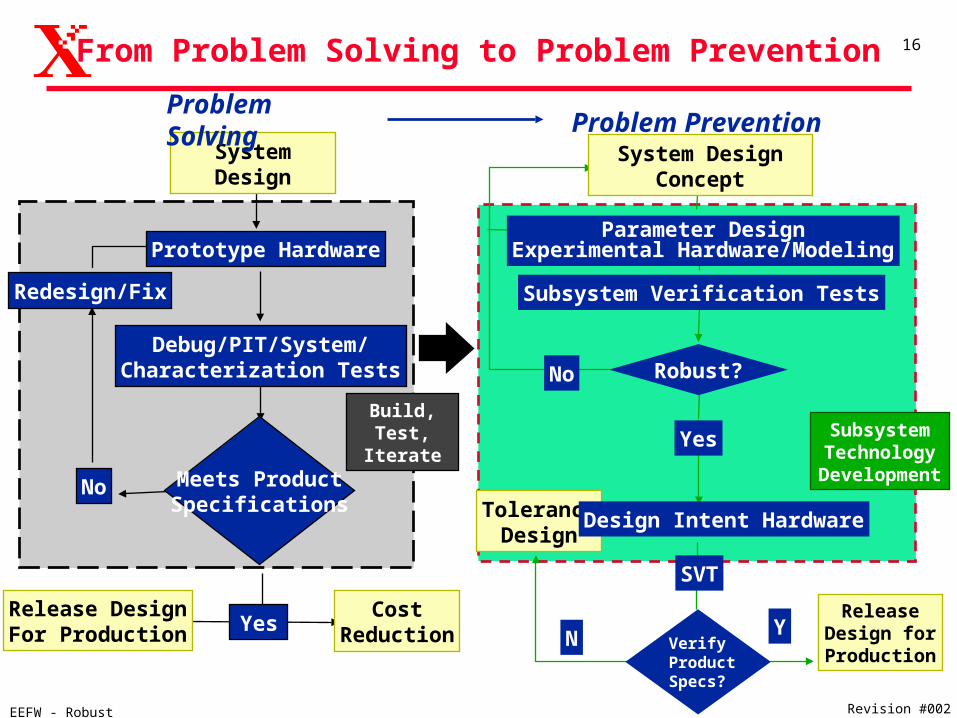
System Design
Debug/PIT/System/Characterization Tests
Release DesignFor Production
CostReduction
No
Redesign/Fix
Prototype Hardware
Meets ProductSpecifications
YesRelease
Design for Production
SubsystemTechnology
Development
Parameter DesignExperimental Hardware/Modeling
Robust?
Yes
SVT
YN
No
ToleranceDesign
Design Intent Hardware
Subsystem Verification Tests
System Design Concept
Build, Test, Iterate
Problem Solving
VerifyProductSpecs?
From Problem Solving to Problem Prevention
Problem Prevention
17
EEFW - Robust Design Revision #002
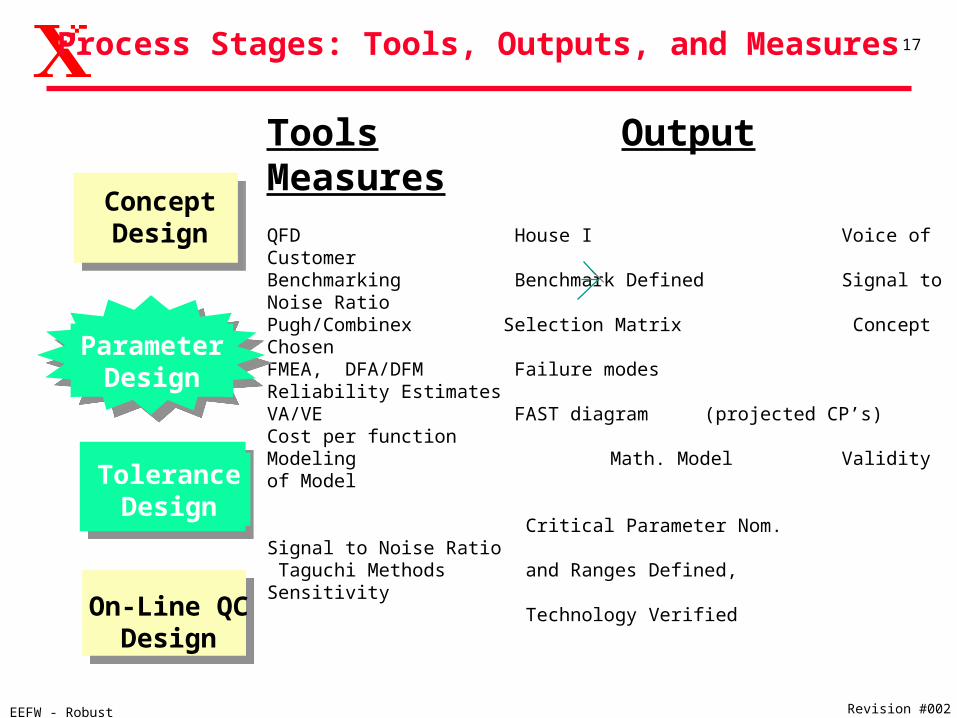
ConceptDesign
ToleranceDesign
On-Line QCDesign
Tools Output MeasuresQFD House I Voice of CustomerBenchmarking Benchmark Defined Signal to Noise RatioPugh/Combinex Selection Matrix Concept Chosen FMEA, DFA/DFM Failure modes Reliability EstimatesVA/VE FAST diagram (projected CP’s) Cost per functionModeling Math. Model Validity of Model
Critical Parameter Nom. Signal to Noise Ratio Taguchi Methods and Ranges Defined, Sensitivity
Technology Verified
Taguchi Methods Cost & Performance Cost & Quality Loss Trade-offs Complete
SPC / Production Control Cpk, Taguchi Methods Quality Loss
ParameterDesign
Process Stages: Tools, Outputs, and Measures

18
EEFW - Robust Design Revision #002
Robust Design as a Part of Critical Parameter Management
}
Design Hardwareand OptimizationExperiments
Critical Parameter Development Activity 5.2:Conduct Experiments /
Analysis to VerifyPerformance at CPNominal
Conduct Experiments to Define CP Range( tolerance )
ToleranceDesign /Analysis
SystemRobustness
Demo Reset&
VerifyNominal Set Points
Conduct /Analyze
Experiments
ParameterDesignPlans
Fixture &
Measurement
System
Development
1
2
345
6
On-Line Quality Control
1.0 Concept Design
}
}}
Conduct Experimentsto Optimize CPNominals and Verify all CP’s Identified
Critical ParameterDevelopment Activity 2.1:
Critical ParameterDevelopmentActivity 5.2:
Critical ParameterDevelopmentActivity 6.1:
Refer to slide 34 for detailed inspection list for each step

19
EEFW - Robust Design Revision #002
SIGNAL FACTORSInputs Main
Function
CONTROL FACTORSDesign aspects you control
PrimaryResponses
functional outputs
Secondary Responses
dysfunctional outputs
Signal/Noise Ratio &
Sensitivity
Expected Quality Loss
Benchmarking
Failure Mode
Failure Mode
Counter Measure
NOISE FACTORSDesign aspects you can't control
Steps 1 & 2: Parameter Design Methodology
Step 1: Fixture & Measurement System Development
Step 2: Parameter Design Plans
345
345
6

20
EEFW - Robust Design Revision #002
Signal Factors
Replenisher Dispensing
PrimaryResponse Trickle
Charging
PrimaryResponse
Signal Factors
Control Factors Noise FactorsR
espo
nse
Signal
S / N ~ Beta 2 / Sigma2
Signal Factors
PrimaryResponse
DeveloperMixing
Signal Factors
PrimaryResponseMagnetic Roll
Loading
PrimaryInput
rgf-4/96
PrimaryInput
Signal Factors
PrimaryResponse
Signal Factors
PrimaryResponse Cloud Generation
(Jumping)
Signal Factors
PrimaryResponsePhotoreceptor
Development
Donor RollLoading
Steps 1 & 2: Design Decomposition & Flowchart:Dispensing Replenisher and Development Subsystem
Step 1: Fixture & Measurement System Development
Step 2: Parameter Design Plans
* Develop Ideal Function for each subfunction
345
345
6

21
EEFW - Robust Design Revision #002
Control Factors Noise Factors
Signal FactorAuger Speed
Dispense Rate (Gm/Min)
Function: Replenisher Dispensing
Ideal Function: Convertauger speed to dispense rate
(BO
TT
LE
)
Dis
pens
e G
PM
Auger RPM
S / N ~ Beta2 / Sigma2
Spiral Pitch(1)
Spiral Depth(2)
diameter (6)
(CA
P) # of fins (3)
fin type(4)
fin length (10)
Bottle speed ((9)
pitch(5)
pitch(5)
diameter (6)
(A
UG
ER
S)
LO
WE
R-U
PP
ER
toner flow (1)4 -26 HF#
tilt angle (2)+ \ - 2deg.
dispenser (3)tolerances#1 vs.#2
Inputs Primary Response
P/C calls for toner
* Replenisher dispense rate for 6%A/C at 40PPM to 25%A/C at 65PPM with a 3:1 Ratio of toner to carrier by weight.
Control Factors Noise Factors
Signal FactorCarrier added
Sump Mass & Charge
Main Function: TrickleCharging of Developer
Ideal Function: Trickleout equals carrier added
Dev. Housing tilt angle**+ / - 2 Deg. (2)
Tri
ckle
(gm
s)
Carrier Added (gms )
S/ N ~ Beta2 / Sigma2
Primary Response
overflow location (1)
overflowheight (2)
Mix Auger Type (3)
Mix Auger Speed (4 )
Developerdispense rate*2-10 GPM (1)
Toner Concentration1-4 % (3)***
Steps 1 & 2:Example for Toner Dispenser
4
Step 1: Fixture & Measurement System Development
Step 2: Parameter Design Plans
345
345
6

22
EEFW - Robust Design Revision #002
Level21 3Signal Factor
Auger Speed (rpm) 12081.542.5
Signal 3Response Factor
Dispense Rate (g/m)*y1 ,y2 ,y3 ,y4
Control Factor Units
mm
mm
1
Levels
2 3
mm
mm
rpm
type
mm
#
#
scoopangle
5 6
40 50
8
12
13
large
14.5
10.5
10.5
med
9.75
perp
4
30
4
8
sm
4.82
9
# of Fins
Spiral Pitch
Spiral Depth
Auger Pitch
Auger Dia
Fin Type
Auger Opening
Bottle Speed
1
2
3
4
5
6
7
8
Noise Factor
Material Flow Rate &Angle
Units Level1 2
Dispenser #
gpm deg
#
4.0 -2
1 2
22.0 +2
Ideal Function:Convert auger RPM to dispense rate
Steps 1 & 2: Process Chart (P-Chart)
Step 1: Fixture & Measurement System Development
Step 2: Parameter Design Plans
345
345
6
Signal 2Signal 1
y5 ,y6 ,y7 ,y8
y9 ,y10,y11 ,y12
* 3 signal levels * 4 noise levels =12 data per test

23
EEFW - Robust Design Revision #002
Dispense Rate vs. Auger Speed:
Auger Speed (rpm)
12042.5
g/m
Dis
pen
sed
40 Data Points @4 Noise Levels
Beta = Grams / Revolution = Mechanical Efficiency
Two Step Optimization
Maximize S/N ratio Tune to target beta
81.5
Step 3: Optimization Plots
45
6
Step 3 : Conduct / Analyze Experiments
2
1
24
EEFW - Robust Design Revision #002
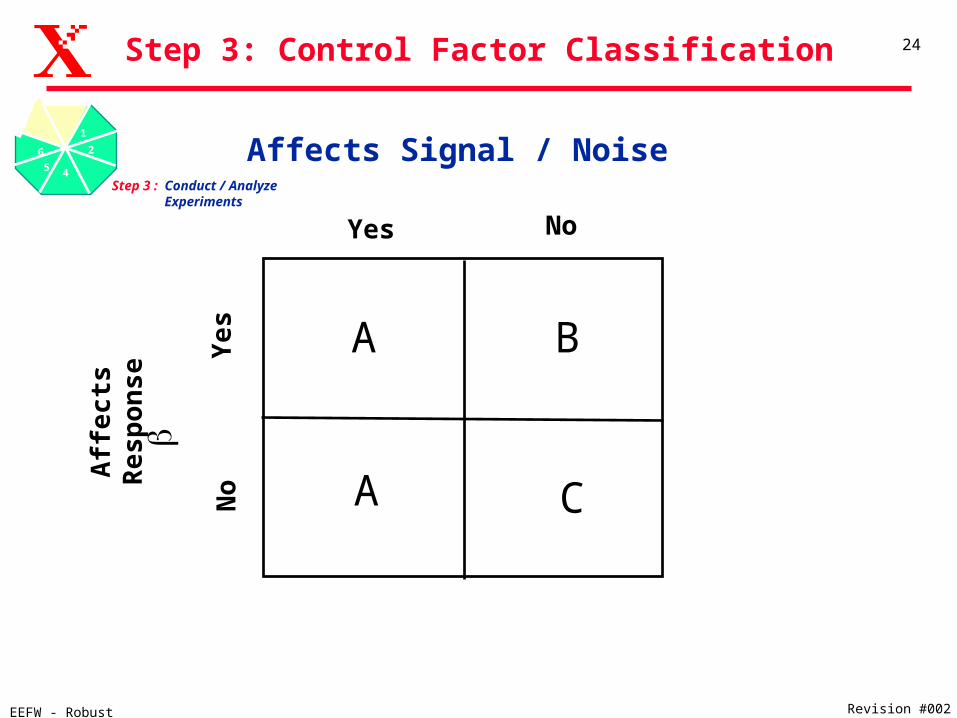
Step 3: Control Factor Classification
Affects Signal / Noise
A
A
B
C
Yes NoN
oY
es
Aff
ec
ts
Re
sp
on
se
45
6
Step 3 : Conduct / Analyze Experiments
2
1
25
EEFW - Robust Design Revision #002
S/N
Rat
ioSe
nsit
ivit
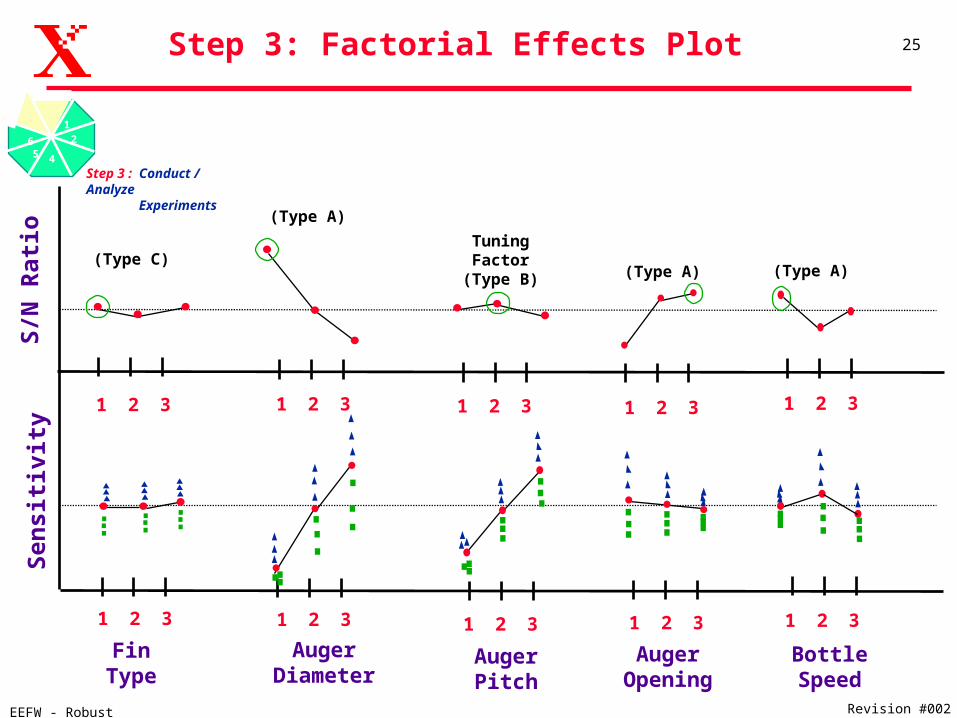
yStep 3: Factorial Effects Plot
456
Step 3 : Conduct / Analyze Experiments
21
AugerPitch
1 2 3
1 2 3
TuningFactor
(Type B)
AugerDiameter
1 2 3
1 2 3
(Type A)
AugerOpening
1 2 3
1 2 3
(Type A)
1 2 3
1 2 3
BottleSpeed
(Type A)
FinType
1 2 3
1 2 3
(Type C)

26
EEFW - Robust Design Revision #002
Predicted Actual
S/N Ratio
Sensitivity
Sigma
-21.21
0.14
1.611.48
0.126
-21.40
Steps 4 & 5: Subsystem & System Verification
6 2
1
3
Step 4: Reset & Verify
Nominal Set Points
Step 5: System Latitude /Robustness Demo
System Verification :
• After verification with both prototype and production intent subsystem hardware
• Toner Dispenser integrated with total developer system for verification of developer requirements
• Total Developer system integrated in Systems Verification Test for analysis of Image Quality Responses
PreviousCondition
-25.36
0.13
2.41
Gain=4.15 dB

27
EEFW - Robust Design Revision #002
45 3
2
1Step 6: Tolerance Design/Analysis
Tolerance Design
• Trade-offs are made between reduction in quality loss due to performance variation and increase in manufacturing cost (selective reduction of tolerances, selective specification of higher grade material/components)
• Performed only after signal to noise is maximized in parameter design
• Sensitivity analysis and economic considerations are used to select the correct tolerances for drawings
Step 6: Tolerance Design / Analysis

28
EEFW - Robust Design Revision #002
• The Robustness of Function ( Dynamic Signal to Noise ) is used to achieve Technology Readiness.
• Dynamic Signal to Noise will enable low cost Reusable and Reproducible Technologies for both design and manufacturing.
• Ideal Quality equals Target Performance even in the presence of noise, throughout design life.
• Robust Design is the process of developing and improving the design latitude.
• Parameter Design minimizes the sensitivity to noises without eliminating the causes of the noise.
• Signal to Noise is a proactive improvement metric.
• Robust Design enables the prevention of problems. Problem solving minimized.
Key Messages
29
EEFW - Robust Design Revision #002
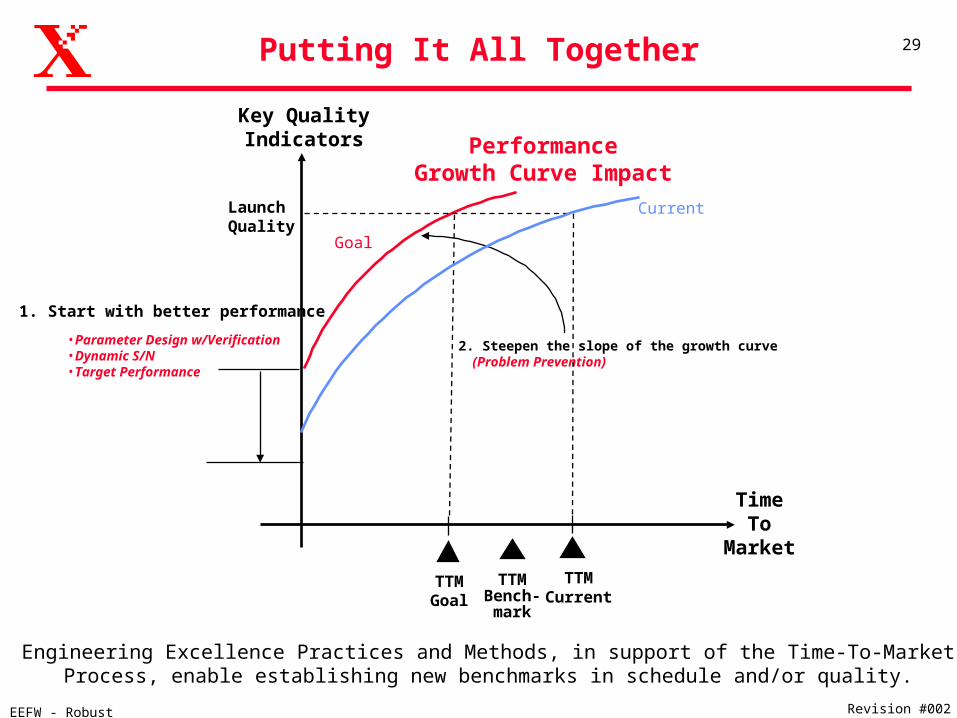
Putting It All Together
1. Start with better performance
2. Steepen the slope of the growth curve (Problem Prevention)
• Parameter Design w/Verification• Dynamic S/N• Target Performance
PerformanceGrowth Curve Impact
TimeTo
Market
Goal
Current
Key QualityIndicators
LaunchQuality
TTMBench-mark
TTMGoal
TTMCurrent
Engineering Excellence Practices and Methods, in support of the Time-To-MarketProcess, enable establishing new benchmarks in schedule and/or quality.
30
EEFW - Robust Design Revision #002
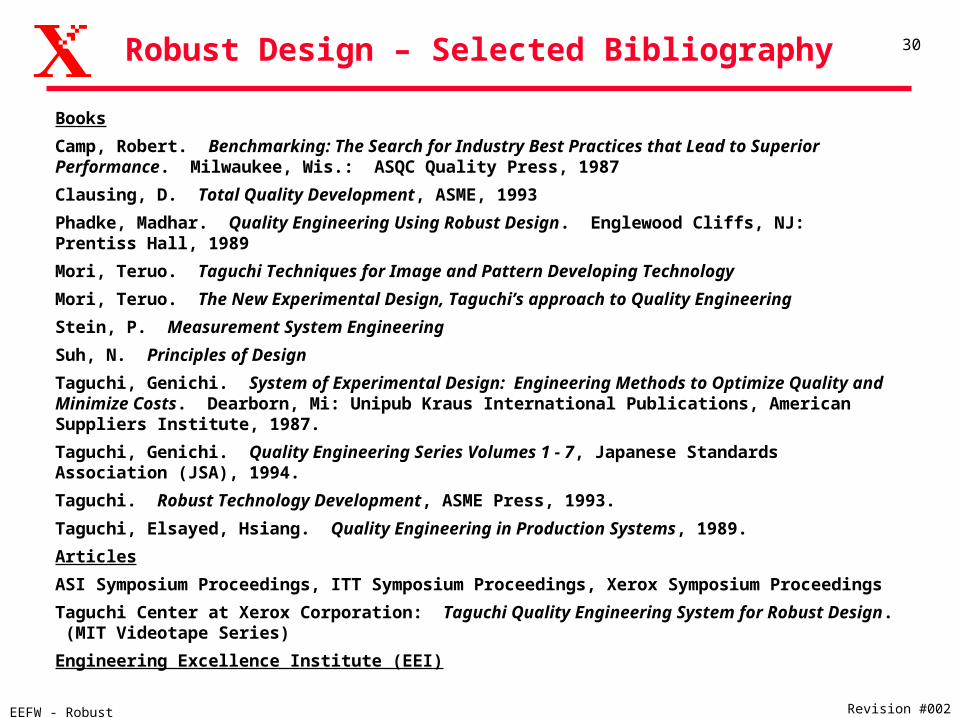
Robust Design – Selected Bibliography
Books
Camp, Robert. Benchmarking: The Search for Industry Best Practices that Lead to Superior Performance. Milwaukee, Wis.: ASQC Quality Press, 1987
Clausing, D. Total Quality Development, ASME, 1993
Phadke, Madhar. Quality Engineering Using Robust Design. Englewood Cliffs, NJ: Prentiss Hall, 1989
Mori, Teruo. Taguchi Techniques for Image and Pattern Developing Technology
Mori, Teruo. The New Experimental Design, Taguchi’s approach to Quality Engineering
Stein, P. Measurement System Engineering
Suh, N. Principles of Design
Taguchi, Genichi. System of Experimental Design: Engineering Methods to Optimize Quality and Minimize Costs. Dearborn, Mi: Unipub Kraus International Publications, American Suppliers Institute, 1987.
Taguchi, Genichi. Quality Engineering Series Volumes 1 - 7, Japanese Standards Association (JSA), 1994.
Taguchi. Robust Technology Development, ASME Press, 1993.
Taguchi, Elsayed, Hsiang. Quality Engineering in Production Systems, 1989.
Articles
ASI Symposium Proceedings, ITT Symposium Proceedings, Xerox Symposium Proceedings
Taguchi Center at Xerox Corporation: Taguchi Quality Engineering System for Robust Design. (MIT Videotape Series)
Engineering Excellence Institute (EEI)
31
EEFW - Robust Design Revision #002
Reference Slides
Robust Design / Reference
32
EEFW - Robust Design Revision #002
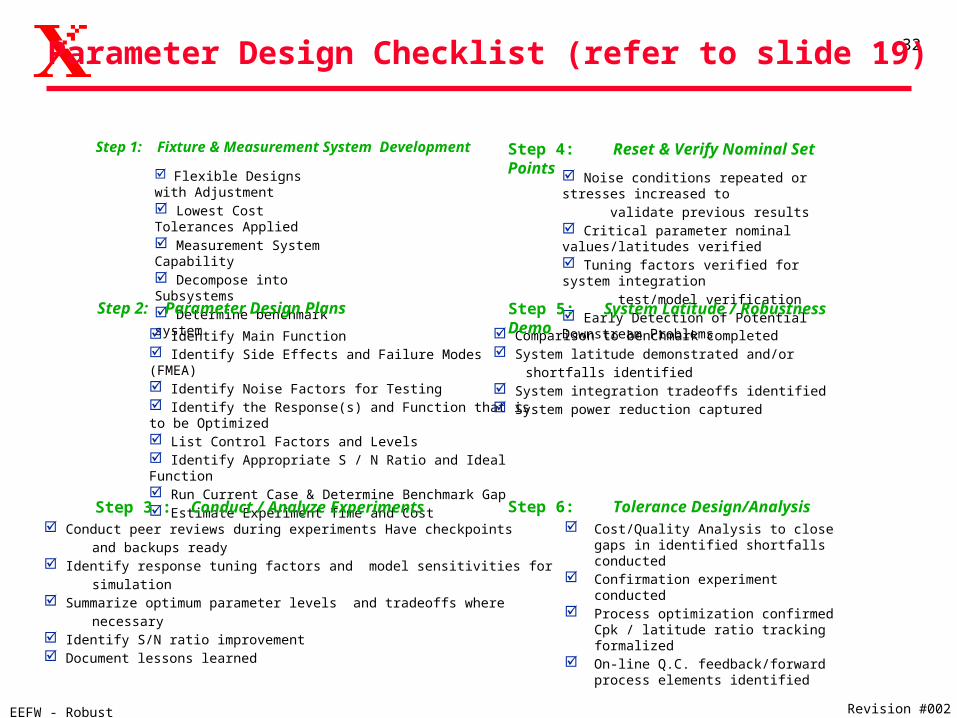
Step 1: Fixture & Measurement System Development
Flexible Designs with Adjustment Lowest Cost Tolerances Applied Measurement System Capability Decompose into Subsystems Determine benchmark system
Step 2: Parameter Design Plans
Identify Main Function Identify Side Effects and Failure Modes (FMEA) Identify Noise Factors for Testing Identify the Response(s) and Function that is to be Optimized List Control Factors and Levels Identify Appropriate S / N Ratio and Ideal Function Run Current Case & Determine Benchmark Gap Estimate Experiment Time and Cost
Noise conditions repeated or stresses increased to validate previous results Critical parameter nominal values/latitudes verified Tuning factors verified for system integration test/model verification Early Detection of Potential Downstream Problems
Comparison to benchmark completed System latitude demonstrated and/or shortfalls identified System integration tradeoffs identified System power reduction captured
Cost/Quality Analysis to close gaps in identified shortfalls conducted
Confirmation experiment conducted Process optimization confirmed Cpk / latitude ratio
tracking formalized On-line Q.C. feedback/forward process elements
identified
Step 3 : Conduct / Analyze Experiments Conduct peer reviews during experiments Have checkpoints and backups ready Identify response tuning factors and model sensitivities for simulation Summarize optimum parameter levels and tradeoffs where necessary Identify S/N ratio improvement Document lessons learned
Step 4: Reset & Verify Nominal Set Points
Step 5: System Latitude / Robustness Demo
Step 6: Tolerance Design/Analysis
Parameter Design Checklist (refer to slide 19)

Control Factor Best Nominal Values Noise Analysis
Control Factors Noise Factors
Signal FactorAuger Speed
Dispense Rate (Gm/Min)
Function: Replenisher Dispensing
Ideal Function: Dispensetoner consistent and predictable rate.
C/F Best Nom. Values Noise Analysis
Control Factors Noise Factors
Signal FactorCarrier added
Sump Mass & Charge
Main Function: TrickleCharging of Developer
Ideal Function: Trickleout equals carrier added
Additional Analysis
Additional Analysis
AA
BCR
espo
nse
No
Y
es
Signal/ NoiseYes No
(BO
TT
LE
)
HJD Robustness LRB level @ April ‘96Sheet #1 Updates 4/96 J. Lioy
Dis
pens
e G
PM
Auger RPM
S / N ~ Beta2/ Sigma2
Tri
ckle
(gm
s)
Carrier Added (gms )
Qualification Method Used
Spiral Pitch(1)
Spiral Depth(2)
diameter (6)
(CA
P) # of fins (3)
fin type(4)
fin length (10)
Bottle speed ((9)
pitch(5)
pitch(5)
diameter (6)
(A
UG
ER
S)
LO
WE
R-U
PP
ER
toner flow (1)4 -26 HF#
tilt angle (2)+ \ - 2deg. Dev. Housing
tilt angle**+ / - 2 Deg. (2)
dispenser (3)tolerances#1 vs.#2
C/F# LEVEL TYPE C/F# LEVEL TYPE1) 40MM (A) 6) 9MM (A)2) 4 MM (A) 7) 12MM (A)3) 4 (A) 8) 9MM (A)4) Straight (C) 9) 5RPM (A)5) 10.5MM (B) 10) 40MM (A)
#1- 18GPM Max.#2 & #3 < 1GPM
Bottle seal - Vacuumrequired added valve
Primary input Primary Response
P/C calls for toner
Primary Response
overflow location (1)
overflowheight (2)
Mix Auger Type (3)
Mix Auger Speed (4 )
Developerdispense rate*2-10 GPM (1)
Toner Concentration1-4 % (3)***
* Replenished dispense rate for 6%A/C at 40PPM to 25%A/C at 65PPM with a 3:1 Ratio of toner to carrier by weight.
C/F# LEVEL TYPE.1) outboard (A)2) 14 MM (B) 3)A 18 MM Psed. (A)4) 400 RPM (A)** Aug to wall< 2.5MM
** Added Auger to wall dist. (C/F )*** Toner flow replaced T.C. noise3)A Change from 12H to 18P mixing rgf-4/96-hjdnid2
S / N ~ Beta2/ Sigma2
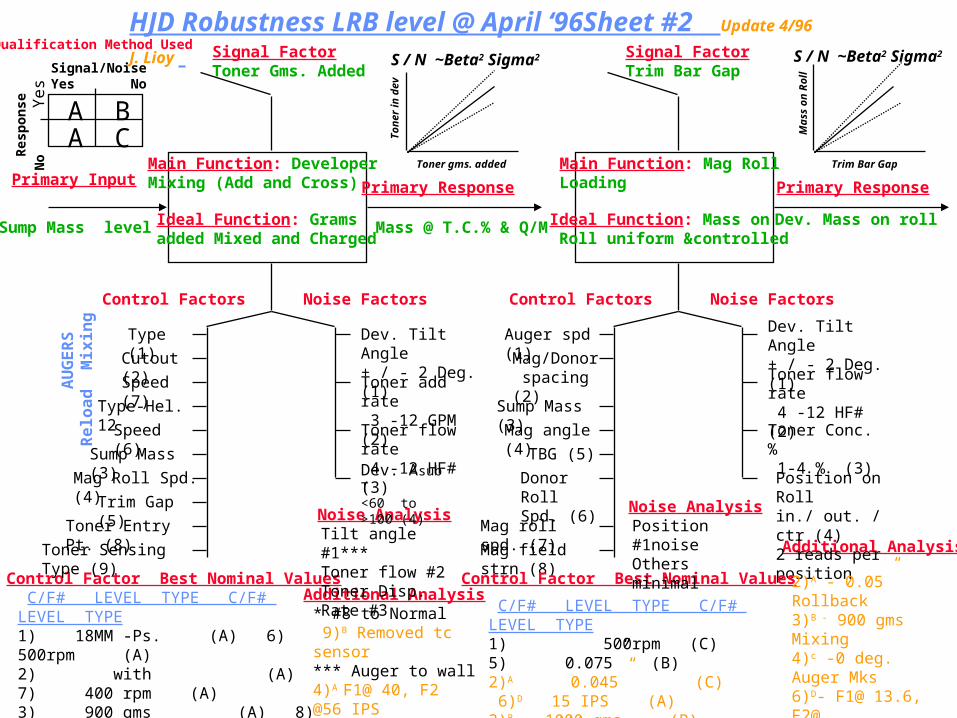
Control Factor Best Nominal Values
Noise Analysis
Control Factors Noise Factors
Signal FactorToner Gms. Added
Mass @ T.C.% & Q/M
Main Function: Developer Mixing (Add and Cross)
Ideal Function: Grams added Mixed and Charged
Noise Analysis
Control Factors Noise Factors
Signal FactorTrim Bar Gap
Dev. Mass on roll
Main Function: Mag RollLoading
Ideal Function: Mass on Roll uniform &controlled
Additional Analysis
Additional Analysis
AA
BCR
espo
nse
No
Y
es
Signal/NoiseYes No
Type (1)
Cutout (2)
Ton
er in
dev
Toner gms. added
S / N ~Beta2 Sigma2
Mas
s on
Rol
l
Trim Bar Gap
Qualification Method Used
Primary ResponsePrimary Input
Sump Mass level
Primary Response
Speed (7)
Type-Hel. 12
Toner Entry Pt. (8)
Toner Sensing Type (9)
C/F# LEVEL TYPE C/F# LEVEL TYPE1) 18MM -Ps. (A) 6) 500rpm (A)2) with (A) 7) 400 rpm (A)3) 900 gms (A) 8) Front * (A)4)A 50 IPS (A) 9)B Long Snout (A)5) 0.075” (A)
AU
GE
RS
Rel
oad
Mix
ing
Speed (6)
Sump Mass (3)
Trim Gap (5)
Mag Roll Spd. (4)
Dev. Tilt Angle+ / - 2 Deg. (1)
Dev. Asub T<60 to >100 (4)
Toner add rate 3 -12 GPM (2)
Toner flow rate 4 -12 HF# (3)
Tilt angle #1***Toner flow #2Toner Disp. Rate #3
* #8 to Normal 9)B Removed tc sensor*** Auger to wall4)A F1@ 40, F2 @56 IPSTuning for power &PQ
Mag/Donor spacing (2)
Sump Mass (3)
TBG (5)
Donor Roll Spd. (6)
Mag roll spd. (7)
Auger spd (1)
Mag angle (4)
Mag field strn.(8)
Dev. Tilt Angle+ / - 2 Deg. (1)
Toner flow rate 4 -12 HF# (2)
Toner Conc. % 1-4 % (3)
Position on Rollin./ out. / ctr (4)2 reads per position
Control Factor Best Nominal Values
C/F# LEVEL TYPE C/F# LEVEL TYPE1) 500rpm (C) 5) 0.075” (B)2)A 0.045” (C) 6)D 15 IPS (A)3)B 1000 gms (B) 7)F 50 IPS (A)4)c +10 deg. (A) 8) Norm Lvl. (C)
rgf-4/96- hjdnid2
Position #1noiseOthers minimal
2)A - 0.05” Rollback3)B - 900 gms Mixing 4)c -0 deg. Auger Mks6)D- F1@ 13.6, [email protected] IPS for PQ tune.7) -F1@ 40, F2 @56 IPSTune Power& PQ
HJD Robustness LRB level @ April ‘96Sheet #2 Update 4/96 J. Lioy S / N ~Beta2 Sigma2

Noise Analysis
Control Factors Noise Factors
Signal FactorsVdm D.C. Bias
Main Function: Donor Roll Loading
Ideal Function: ConstantMass, Charge, and Size
Noise Analysis
Control Factors Noise Factors
Signal FactorsVjump A.C. - P-P
Main Function: Cloud Generation
Ideal Function: Cloud of uniform mass and charge
Additional Analysis
Additional Analysis
AA
BCR
espo
nse
No
Y
es
Signal/NoiseYes No
AC P-P (5)
Dev
. Mas
s
Vdm Bias (volts)
S / N ~Beta2 / Sigma2
Clo
ud
Den
sity
V jump A.C.
Qualification Method Used
Primary Response Primary Response
Mag Roll Mass Donor roll tonerMass, Charge ,Size
Primary Input
Toner Cloud in Gap
AC freq. (6)
AC P-P (7)
AC freq. (8)
Toner properties
Donor Roll Props.
Don
orto
P/R
Don
or t
o M
ag.
Bia
s V
olta
ges
Don
or t
o M
ag.
AC P-P (1)
AC freq. (2)
Donor RollTime cons.(3)
Mag ang. (4)
Donor spd (5)
Mag. field (6)
Donor /mag spacing (7)
Mass on roll (8)
Cycle number1st - 10th - (1)
Dev. Conduct108 - 1011 - (2)
Toner Flow4-12 HF # (3)
Control Factor Best Nominal Values C/F# LEVEL TYPE C/F# LEVEL TYPE1) 200V (C) 5)c 14 IPS (A)2)A 500Hz (A) 6) Normal (A)3 B < 2000uS ( C) 7) 0.04”-0.06” (B)4) 0 - 5 deg (B) 8) 20+ (A)
Cycle number -Large
2)A- 3.25 KHz same as main P/S frequency3 B-Remains undefinedfor function as well asmeasurement changes.5)c- F1@ 13.6, [email protected] IPS for PQ tune
Control Factor Best Nominal Values
C/F# LEVEL TYPE C/F# LEVEL TYPE5) 3KV (A)6) 3Khz (A) 7) 200 V (A)8) 9Khz (A) All @ 0.014” GAP to P/R rgf-4/96- hjdnid2
Toner properties
Cyclic State
Environmental
HJD Robustness LRB level @ April ‘96Sheet #3 Update 4/96 J. Lioy S / N ~Beta2 / Sigma2

Noise Analysis
Control Factors Noise Factors
Signal FactorsNeeds Discussion
Primary Response
Main Function: Non - Interactive Development
Ideal Function: P/R Mass not reflected back to theother color donor rolls
Noise Analysis
Control Factors Noise Factors
Signal FactorsVdev = Vpr- Vdonor
Primary Response
Main Function: Photoreceptor Development
Ideal Function: Reproduce image to match input signal
Additional Analysis
Additional Analysis
AA
BCR
espo
nse
No
Y
es
Signal/NoiseYes No
Donor Roll Spd. (3)
Donor to P/R Gap (1)
P/R
Mas
s
Signal
S / N ~ Beta2 / Sigma2
Res
pons
e
Signal
S / N ~ Beta2 / Sigma2Qualification Methods Used
Primary Input
Toner Cloud Image Metrics for Lines , solids , halftones
P/R Mass Developed
Toner properties
Donor Roll Props.
Jumping Biases
Jumping Electrodes
Cyclic State
Environmental
Toner properties
Donor to Mag Gap (2)
Mag Roll Spd. (4)
Cloud GenerationFactors 5,6,7,8
Toner Cons.& Tribo (AsubT) (1)Toner Flow 4 - 12 HT # (3)Toner CohesionNumber (4)
Toner Residence Time (5) Print Number and Area Coverage Combined
Control Factor Best Nominal ValuesControl Factor Best Nominal Values C/F# LEVEL TYPE C/F# LEVEL TYPE
C/F# LEVEL TYPE C/F# LEVEL TYPE1)A 0.014” (A) 5)E 3KV (A)2)B 0.045” (A) 6)F 3KHz (A)3)C 16 IPS ( A) 7) 200 V (A)4)D 50 IPS (A) 8)G 9 K (A)
rgf-4/96- hjdnid1
Residence time key noise
1)A- 0.012” -PQ & Power 2)B- 0.045” Rollback 3)C-F1 / F2 Speed Tuning 4)D-F1 / F2 Speed Tuning 5)E - 2.2-2.4 KV P/S arcing 6)F - 3.25 KHz PQ Tuning 8)G - 3.25 KHz P/S Cost
HJD Robustness LRB level @ April ‘96Sheet #4 Update 4/96 J. Lioy

37
EEFW - Robust Design Revision #002
Developer Housing Critical Parameter Diagram
S. Mordenga / R Faull April96
OTHER DESIGN CONTROL PARAMETERS
MAG ROLL TO DONOR ROLL SPEED RATIO - 3:1 (WITH)
DONOR ROLL TO P/R SPEED RATIO - 1.6 :1 (AGAINST)
Vdm ADJUSTABLE FOR DEVELOPMENT CONTROL (100+VLTS)
AC JUMPING FIELD < 4.5 VOLTS / MICRON AT 3.25 KHZ.
Donor Roll
Pickup Auger
Speed @ 500
Mixing Auger
Speed @ 400
P/R DIRECTION IS UPWARD OUT OF THE PAGE
Auger to wall clearance < 2.00 MM
GROUND
Photoreceptor
FLOW
Vd AC
Vm AC
Vdm
Vdb
MATERIAL
Mag Roll
Replenisher
entry point
Trickle
port
Mag field strength and
position
Donor roll
time constant
Vexp
Robust Design / Reference

38
EEFW - Robust Design Revision #002
Critical Parameter Drawing for F2/F2 Replenisher Dispenser
S. Mordenga/ R Faull April'96
DEVELOPER HOUSING
BOTTLE SPEED
SET @ 5 RPM
PADDLE WHEEL SECTION
BOTTLE CRADLE
FRICTIONAL FORCE
SUMP
UPPER AUGER
SPEED @120RPM
LOWER AUGER
SPEED @100RPM
AGITATOR BAR
SPEED @24 RPM
OTHER DESIGN CONTROL PARAMETERSBOTTLE FEED RATE TO UPPER AUGER - 4 GRAMS PER REVOLUTIONUPPER AUGER FEED RATE TO LOWER AUGER - 0.16 GRAMS PER REV.LOWER AUGER FEED RATE TO DEVELOPER HOUSING - .2-.23 GR. / REV.VACUUM IN BOTTLE WHILE RUNNING AT FULL RATE < TBD PSI
TONER DISPENSER OUTPUT SPEC. FOR F1/F2 IS 21.4 GRAMS PER MINUTE
Robust Design / Reference


