ROBUST AND REAL-TIME MOTION CAPTURE OF RIGID BODIES …
13
Paper Ref: S0215_P0429 3 rd International Conference on Integrity, Reliability and Failure, Porto/Portugal, 20-24 July 2009 -1- ROBUST AND REAL-TIME MOTION CAPTURE OF RIGID BODIES BASED ON STEREOSCOPIC VISION Paulo Malheiros 1 , Paulo Rosa Santos 2 , António Paulo Moreira 1 , Paulo Costa 1 , Fernando Veloso Gomes 2 , Francisco Taveira Pinto 2 1 Department of Electrical and Computer Engineering 2 Hydraulics and Water Resources Institute Faculty of Engineering of the University of Porto Porto, Portugal, Email: [email protected] , [email protected] SYNOPSIS This paper presents a stereoscopic vision system developed to measure the motion of rigid bodies in real-time along its six degrees of freedom (6DOF). The idea was to use it in the measurement of the motions of a full-scale oil tanker moored at the oil terminal of the Port of Leixões, Portugal, in the scope of an R&D project. Prior to its installation on site the system was tested and validated in laboratory. For that, use was made of ongoing physical model tests of the behaviour of a moored oil tanker (scale 1/100). To analyse its accuracy the results obtained with the developed system were compared with a commercial motion capture system built for “in house” applications. INTRODUCTION Operational and security conditions in a port terminal are closely linked to the movements of the moored ships caused by wave action. Reducing the amplitude of the moored ship motions is crucial to increase the on and off-loading operations efficiency, to minimize port operational costs, as well as to reduce security and environmental risks, especially when dealing with dangerous cargoes. For this reason it is very important to establish acceptable levels for ship movement and wave heights inside the harbour when designing a port. The study of the behaviour of moored ships in harbours can be justified in the initial design stage of a new port or terminal to assess the effects of some interventions on a particular berth, and to try to improve operation and security conditions at existing berths. Usually there are three tools to deal with this issue: experience with previous and related projects, numerical modelling, and physical modelling (Taveira Pinto, 2008). Despite its importance for port engineering research, prototype measurements of ship motion amplitude and mooring lines and fender forces are usually scarce. Sometimes available data is not very accurate or is limited to qualitative information. Prototype measurements are not affected by scale or laboratory effects and test conditions are realistic (of course) but limited. The need to measure the ship motions at the port terminal was the driving force for the development of a robust stereoscopic computer vision system. From a safe distance, two or more synchronised cameras, show in Figure 1, can capture and record ship images from different locations, consequently determining its motion.
Transcript of ROBUST AND REAL-TIME MOTION CAPTURE OF RIGID BODIES …
Paper Ref: S0215_P0429 3rd International Conference on Integrity, Reliability and Failure, Porto/Portugal, 20-24 July 2009
-1-
ROBUST AND REAL-TIME MOTION CAPTURE OF RIGID BODIES BASED ON STEREOSCOPIC VISION Paulo Malheiros1, Paulo Rosa Santos2, António Paulo Moreira1, Paulo Costa1, Fernando Veloso Gomes2, Francisco Taveira Pinto2
1 Department of Electrical and Computer Engineering 2 Hydraulics and Water Resources Institute Faculty of Engineering of the University of Porto Porto, Portugal, Email: [email protected], [email protected]
SYNOPSIS This paper presents a stereoscopic vision system developed to measure the motion of rigid bodies in real-time along its six degrees of freedom (6DOF). The idea was to use it in the measurement of the motions of a full-scale oil tanker moored at the oil terminal of the Port of Leixões, Portugal, in the scope of an R&D project. Prior to its installation on site the system was tested and validated in laboratory. For that, use was made of ongoing physical model tests of the behaviour of a moored oil tanker (scale 1/100). To analyse its accuracy the results obtained with the developed system were compared with a commercial motion capture system built for “in house” applications.
INTRODUCTION Operational and security conditions in a port terminal are closely linked to the movements of the moored ships caused by wave action. Reducing the amplitude of the moored ship motions is crucial to increase the on and off-loading operations efficiency, to minimize port operational costs, as well as to reduce security and environmental risks, especially when dealing with dangerous cargoes. For this reason it is very important to establish acceptable levels for ship movement and wave heights inside the harbour when designing a port.
The study of the behaviour of moored ships in harbours can be justified in the initial design stage of a new port or terminal to assess the effects of some interventions on a particular berth, and to try to improve operation and security conditions at existing berths. Usually there are three tools to deal with this issue: experience with previous and related projects, numerical modelling, and physical modelling (Taveira Pinto, 2008).
Despite its importance for port engineering research, prototype measurements of ship motion amplitude and mooring lines and fender forces are usually scarce. Sometimes available data is not very accurate or is limited to qualitative information. Prototype measurements are not affected by scale or laboratory effects and test conditions are realistic (of course) but limited.
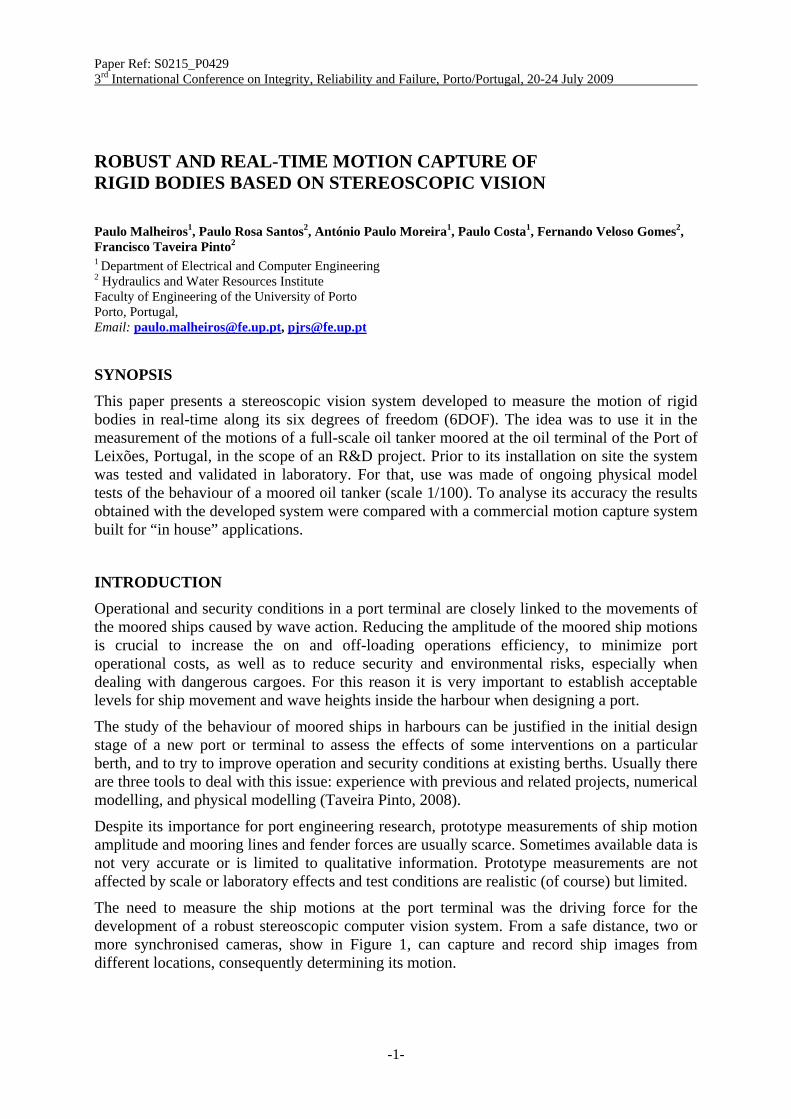
The need to measure the ship motions at the port terminal was the driving force for the development of a robust stereoscopic computer vision system. From a safe distance, two or more synchronised cameras, show in Figure 1, can capture and record ship images from different locations, consequently determining its motion.
-2-
Fig. 1 Stereoscopic vision measurement system.
Physical Modelling The DOLPHIN project aims to study the behaviour of moored ships in harbours and, in particular, at Berth “A” of Leixões Oil Terminal, trying to deal with its operational problems.
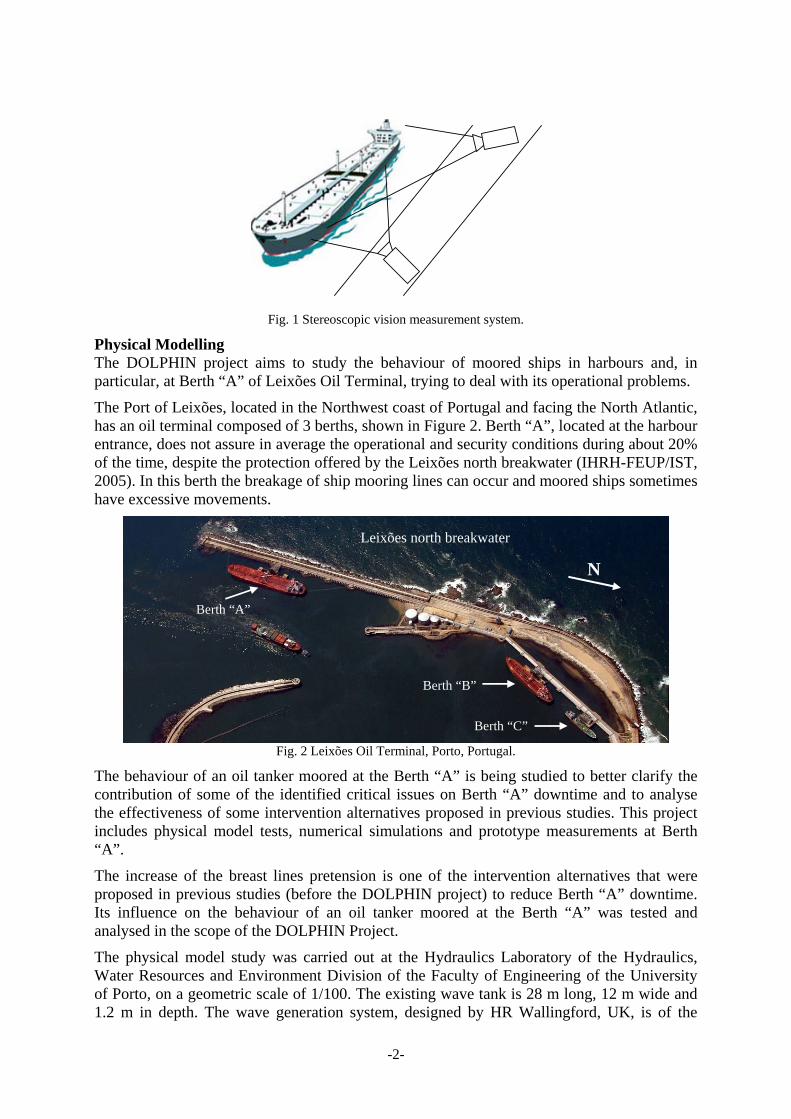
The Port of Leixões, located in the Northwest coast of Portugal and facing the North Atlantic, has an oil terminal composed of 3 berths, shown in Figure 2. Berth “A”, located at the harbour entrance, does not assure in average the operational and security conditions during about 20% of the time, despite the protection offered by the Leixões north breakwater (IHRH-FEUP/IST, 2005). In this berth the breakage of ship mooring lines can occur and moored ships sometimes have excessive movements.
Fig. 2 Leixões Oil Terminal, Porto, Portugal.
The behaviour of an oil tanker moored at the Berth “A” is being studied to better clarify the contribution of some of the identified critical issues on Berth “A” downtime and to analyse the effectiveness of some intervention alternatives proposed in previous studies. This project includes physical model tests, numerical simulations and prototype measurements at Berth “A”.
The increase of the breast lines pretension is one of the intervention alternatives that were proposed in previous studies (before the DOLPHIN project) to reduce Berth “A” downtime. Its influence on the behaviour of an oil tanker moored at the Berth “A” was tested and analysed in the scope of the DOLPHIN Project.
The physical model study was carried out at the Hydraulics Laboratory of the Hydraulics, Water Resources and Environment Division of the Faculty of Engineering of the University of Porto, on a geometric scale of 1/100. The existing wave tank is 28 m long, 12 m wide and 1.2 m in depth. The wave generation system, designed by HR Wallingford, UK, is of the
Berth “A”
Berth “B”
Berth “C”
Leixões north breakwater
N
-3-
multi-element type and composed by 16 paddles. The system is also equipped with a dynamic wave absorption system.
The ship selected for the study intends to represent the biggest class of oil tankers that regularly demand Berth “A” and corresponds to a 105,000 dwt oil tanker, with 245 m overall length, 43 m of breath, and a maximum draft of 14.1 m.
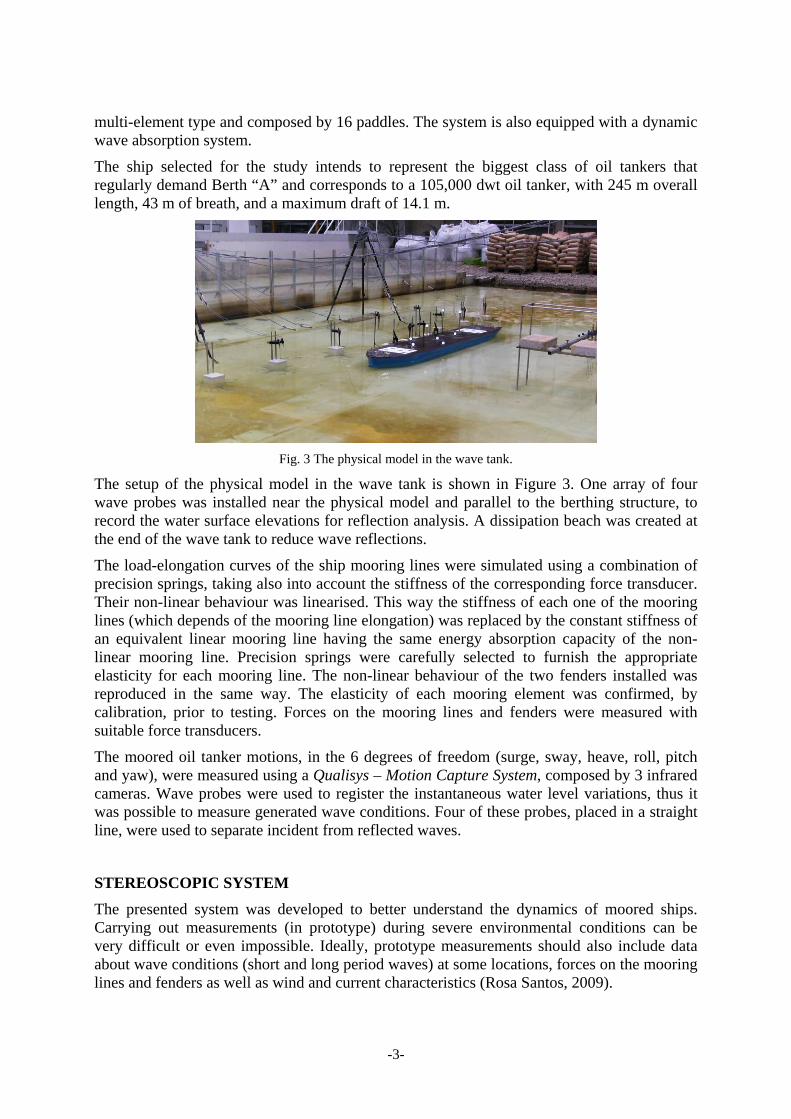
Fig. 3 The physical model in the wave tank.
The setup of the physical model in the wave tank is shown in Figure 3. One array of four wave probes was installed near the physical model and parallel to the berthing structure, to record the water surface elevations for reflection analysis. A dissipation beach was created at the end of the wave tank to reduce wave reflections.
The load-elongation curves of the ship mooring lines were simulated using a combination of precision springs, taking also into account the stiffness of the corresponding force transducer. Their non-linear behaviour was linearised. This way the stiffness of each one of the mooring lines (which depends of the mooring line elongation) was replaced by the constant stiffness of an equivalent linear mooring line having the same energy absorption capacity of the non-linear mooring line. Precision springs were carefully selected to furnish the appropriate elasticity for each mooring line. The non-linear behaviour of the two fenders installed was reproduced in the same way. The elasticity of each mooring element was confirmed, by calibration, prior to testing. Forces on the mooring lines and fenders were measured with suitable force transducers.
The moored oil tanker motions, in the 6 degrees of freedom (surge, sway, heave, roll, pitch and yaw), were measured using a Qualisys – Motion Capture System, composed by 3 infrared cameras. Wave probes were used to register the instantaneous water level variations, thus it was possible to measure generated wave conditions. Four of these probes, placed in a straight line, were used to separate incident from reflected waves.
STEREOSCOPIC SYSTEM The presented system was developed to better understand the dynamics of moored ships. Carrying out measurements (in prototype) during severe environmental conditions can be very difficult or even impossible. Ideally, prototype measurements should also include data about wave conditions (short and long period waves) at some locations, forces on the mooring lines and fenders as well as wind and current characteristics (Rosa Santos, 2009).
-4-
Furthermore the restrictions imposed in such a volatile environment require the use of a passive measurement system. The development of a computer vision system to measure ship motions at the Berth “A” (Figure 2) was based on stereoscopic vision with two or more cameras. From a safe distance, two or more synchronised cameras can capture and record ship images from different locations.
With multiple cameras and choosing some ship features as natural landmarks it is possible, after a calibration process, to map the landmark pixels into points in the 3D space. The next step is to recover the ship's position and orientation from the landmark positions.
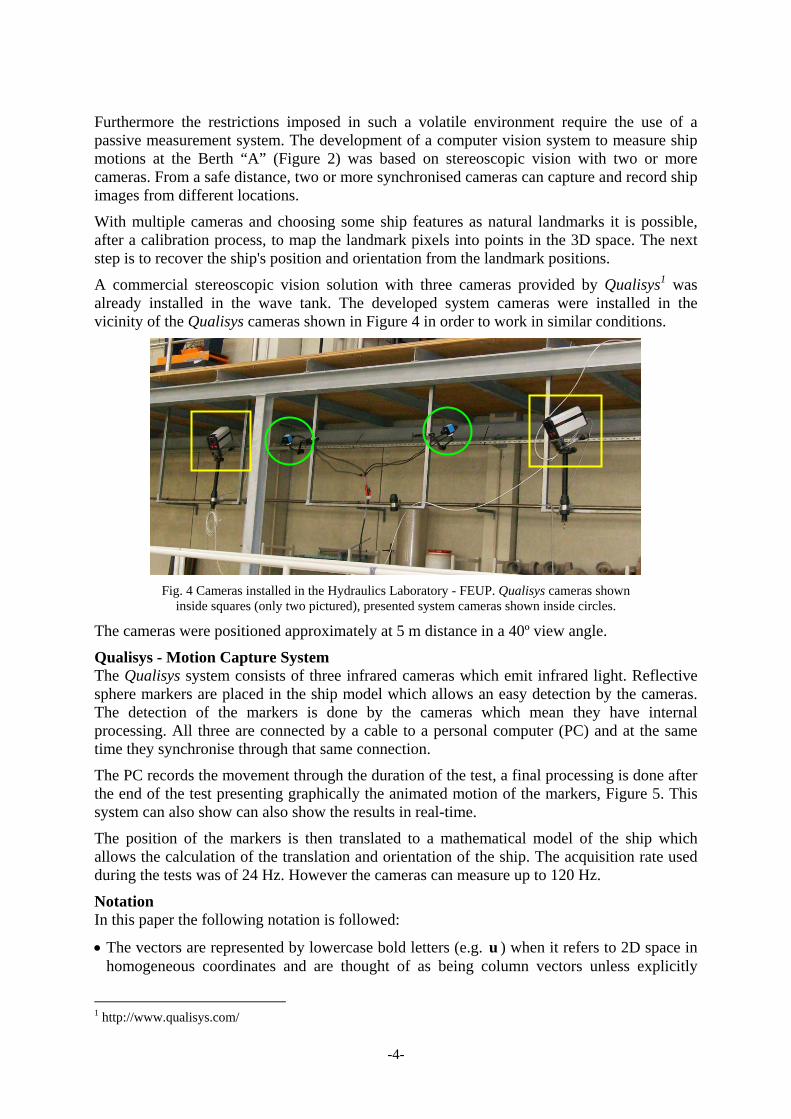
A commercial stereoscopic vision solution with three cameras provided by Qualisys1 was already installed in the wave tank. The developed system cameras were installed in the vicinity of the Qualisys cameras shown in Figure 4 in order to work in similar conditions.
Fig. 4 Cameras installed in the Hydraulics Laboratory - FEUP. Qualisys cameras shown
inside squares (only two pictured), presented system cameras shown inside circles.
The cameras were positioned approximately at 5 m distance in a 40º view angle.
Qualisys - Motion Capture System The Qualisys system consists of three infrared cameras which emit infrared light. Reflective sphere markers are placed in the ship model which allows an easy detection by the cameras. The detection of the markers is done by the cameras which mean they have internal processing. All three are connected by a cable to a personal computer (PC) and at the same time they synchronise through that same connection.
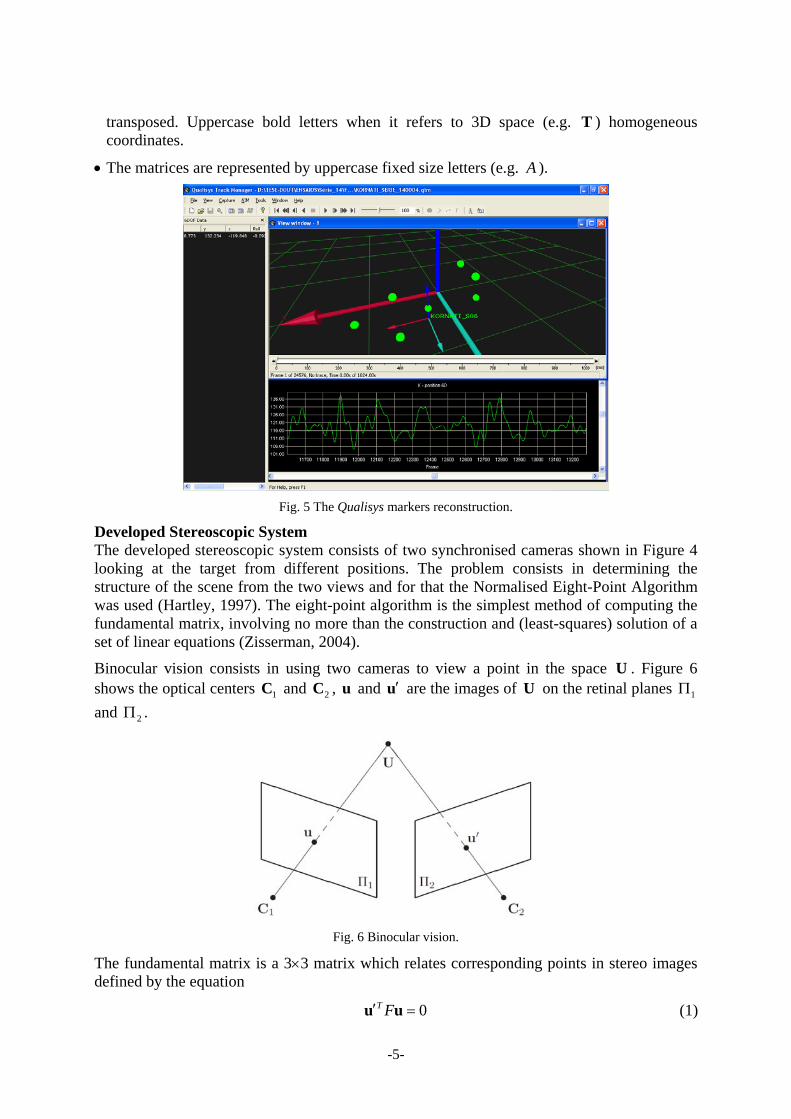
The PC records the movement through the duration of the test, a final processing is done after the end of the test presenting graphically the animated motion of the markers, Figure 5. This system can also show can also show the results in real-time.
The position of the markers is then translated to a mathematical model of the ship which allows the calculation of the translation and orientation of the ship. The acquisition rate used during the tests was of 24 Hz. However the cameras can measure up to 120 Hz.
Notation In this paper the following notation is followed:
• The vectors are represented by lowercase bold letters (e.g. u ) when it refers to 2D space in homogeneous coordinates and are thought of as being column vectors unless explicitly
1 http://www.qualisys.com/
-5-
transposed. Uppercase bold letters when it refers to 3D space (e.g. T ) homogeneous coordinates.
• The matrices are represented by uppercase fixed size letters (e.g. A ).
Fig. 5 The Qualisys markers reconstruction.
Developed Stereoscopic System The developed stereoscopic system consists of two synchronised cameras shown in Figure 4 looking at the target from different positions. The problem consists in determining the structure of the scene from the two views and for that the Normalised Eight-Point Algorithm was used (Hartley, 1997). The eight-point algorithm is the simplest method of computing the fundamental matrix, involving no more than the construction and (least-squares) solution of a set of linear equations (Zisserman, 2004).
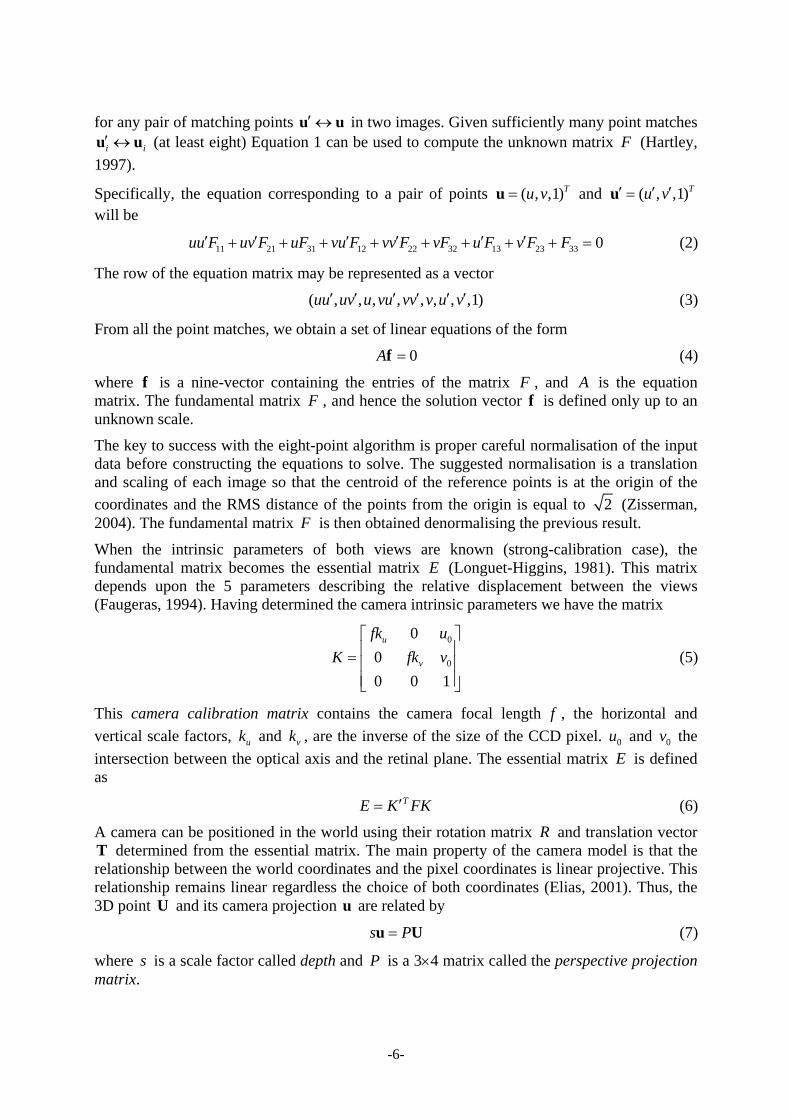
Binocular vision consists in using two cameras to view a point in the space U . Figure 6 shows the optical centers 1C and 2C , u and ′u are the images of U on the retinal planes 1Π and 2Π .
Fig. 6 Binocular vision.
The fundamental matrix is a 3×3 matrix which relates corresponding points in stereo images defined by the equation
0T F′ =u u (1)
-6-
for any pair of matching points ′ ↔u u in two images. Given sufficiently many point matches i i′ ↔u u (at least eight) Equation 1 can be used to compute the unknown matrix F (Hartley,
1997).
Specifically, the equation corresponding to a pair of points ( , ,1)Tu v=u and ( , ,1)Tu v′ ′ ′=u will be
11 21 31 12 22 32 13 23 33 0uu F uv F uF vu F vv F vF u F v F F′ ′ ′ ′ ′ ′+ + + + + + + + = (2)
The row of the equation matrix may be represented as a vector
( , , , , , , , ,1)uu uv u vu vv v u v′ ′ ′ ′ ′ ′ (3)
From all the point matches, we obtain a set of linear equations of the form
0A =f (4)
where f is a nine-vector containing the entries of the matrix F , and A is the equation matrix. The fundamental matrix F , and hence the solution vector f is defined only up to an unknown scale.
The key to success with the eight-point algorithm is proper careful normalisation of the input data before constructing the equations to solve. The suggested normalisation is a translation and scaling of each image so that the centroid of the reference points is at the origin of the coordinates and the RMS distance of the points from the origin is equal to 2 (Zisserman, 2004). The fundamental matrix F is then obtained denormalising the previous result.
When the intrinsic parameters of both views are known (strong-calibration case), the fundamental matrix becomes the essential matrix E (Longuet-Higgins, 1981). This matrix depends upon the 5 parameters describing the relative displacement between the views (Faugeras, 1994). Having determined the camera intrinsic parameters we have the matrix
0
0
000 0 1
u
v
fk uK fk v
⎡ ⎤⎢ ⎥= ⎢ ⎥⎢ ⎥⎣ ⎦
(5)
This camera calibration matrix contains the camera focal length f , the horizontal and vertical scale factors, uk and vk , are the inverse of the size of the CCD pixel. 0u and 0v the intersection between the optical axis and the retinal plane. The essential matrix E is defined as
TE K FK′= (6)
A camera can be positioned in the world using their rotation matrix R and translation vector T determined from the essential matrix. The main property of the camera model is that the relationship between the world coordinates and the pixel coordinates is linear projective. This relationship remains linear regardless the choice of both coordinates (Elias, 2001). Thus, the 3D point U and its camera projection u are related by
s P=u U (7)
where s is a scale factor called depth and P is a 3×4 matrix called the perspective projection matrix.
-7-
Finally it is possible to determine [ ]R T from four possible solutions from SVD decomposition of the matrix E (Longuet-Higgins, 1981). Using a linear triangulation method the point U is found.
SOLUTION STRUCTURE
Two FireWire CCD Bayer industrial cameras were used in this application, with 640×480 resolution and with external trigger. An interface board with an 8-bit microcontroller was used to generate the trigger signal for the cameras thus controlling the acquisition rate and using a serial RS-232 connection to the PC allows to easily modify this parameter. Since this is a slow system a 10 Hz acquisition rate was found acceptable for our tests. Using a standard industrial camera also has a lower cost than the compared purpose built cameras.
The presented solution was developed in Object Pascal using Lazarus2 which is open source and runs in many operating systems. A virtual graphical representation in OpenGL of the scene was implemented using the GLScene components which are very useful for a fast validation of the results.
The main set of components used in this application was the 5dpo Component Library developed by the 5dpo Team for the robotic applications. This library contains components for image acquisition (Firewire and USB Cameras), video display and serial communication and is also open source.
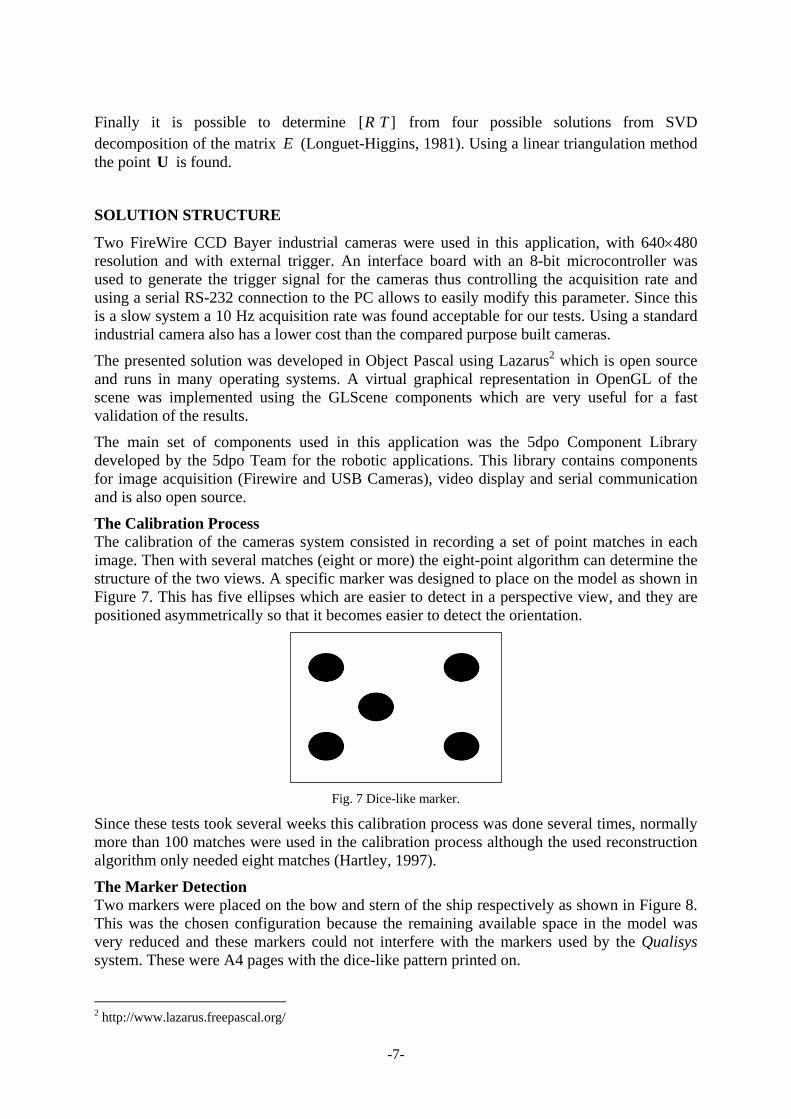
The Calibration Process The calibration of the cameras system consisted in recording a set of point matches in each image. Then with several matches (eight or more) the eight-point algorithm can determine the structure of the two views. A specific marker was designed to place on the model as shown in Figure 7. This has five ellipses which are easier to detect in a perspective view, and they are positioned asymmetrically so that it becomes easier to detect the orientation.
Fig. 7 Dice-like marker.
Since these tests took several weeks this calibration process was done several times, normally more than 100 matches were used in the calibration process although the used reconstruction algorithm only needed eight matches (Hartley, 1997).
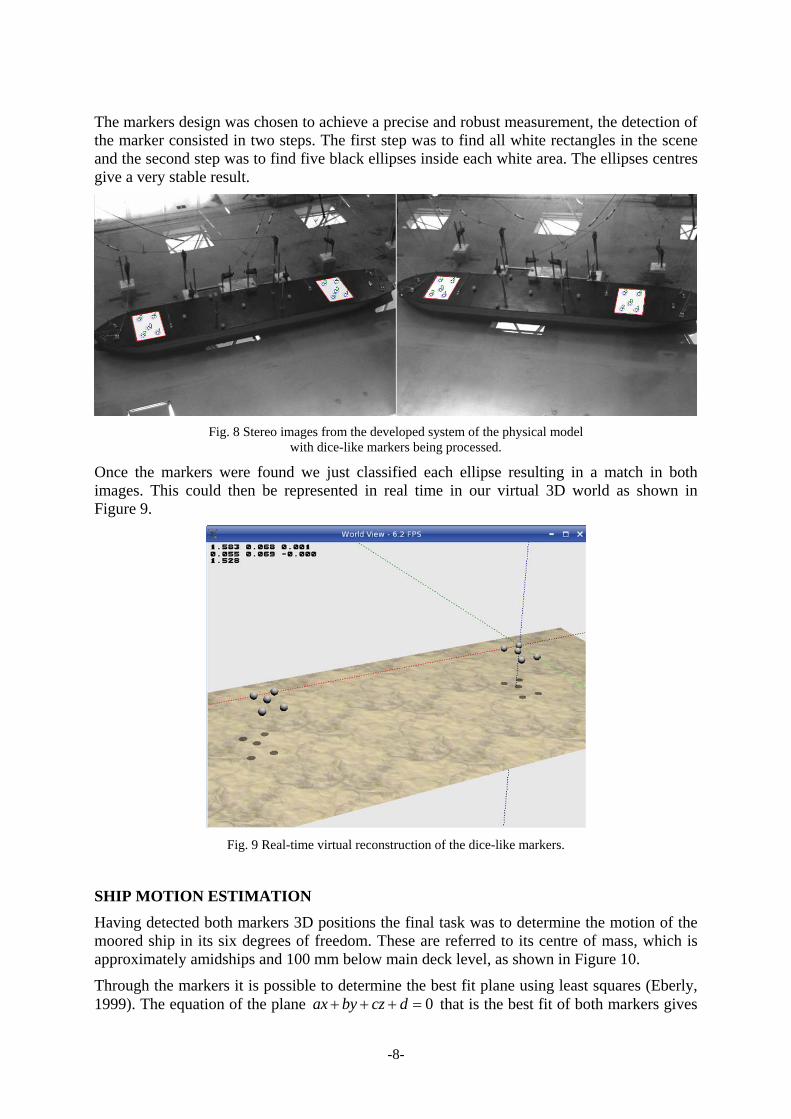
The Marker Detection Two markers were placed on the bow and stern of the ship respectively as shown in Figure 8. This was the chosen configuration because the remaining available space in the model was very reduced and these markers could not interfere with the markers used by the Qualisys system. These were A4 pages with the dice-like pattern printed on.
2 http://www.lazarus.freepascal.org/
-8-
The markers design was chosen to achieve a precise and robust measurement, the detection of the marker consisted in two steps. The first step was to find all white rectangles in the scene and the second step was to find five black ellipses inside each white area. The ellipses centres give a very stable result.
Fig. 8 Stereo images from the developed system of the physical model
with dice-like markers being processed.
Once the markers were found we just classified each ellipse resulting in a match in both images. This could then be represented in real time in our virtual 3D world as shown in Figure 9.
Fig. 9 Real-time virtual reconstruction of the dice-like markers.
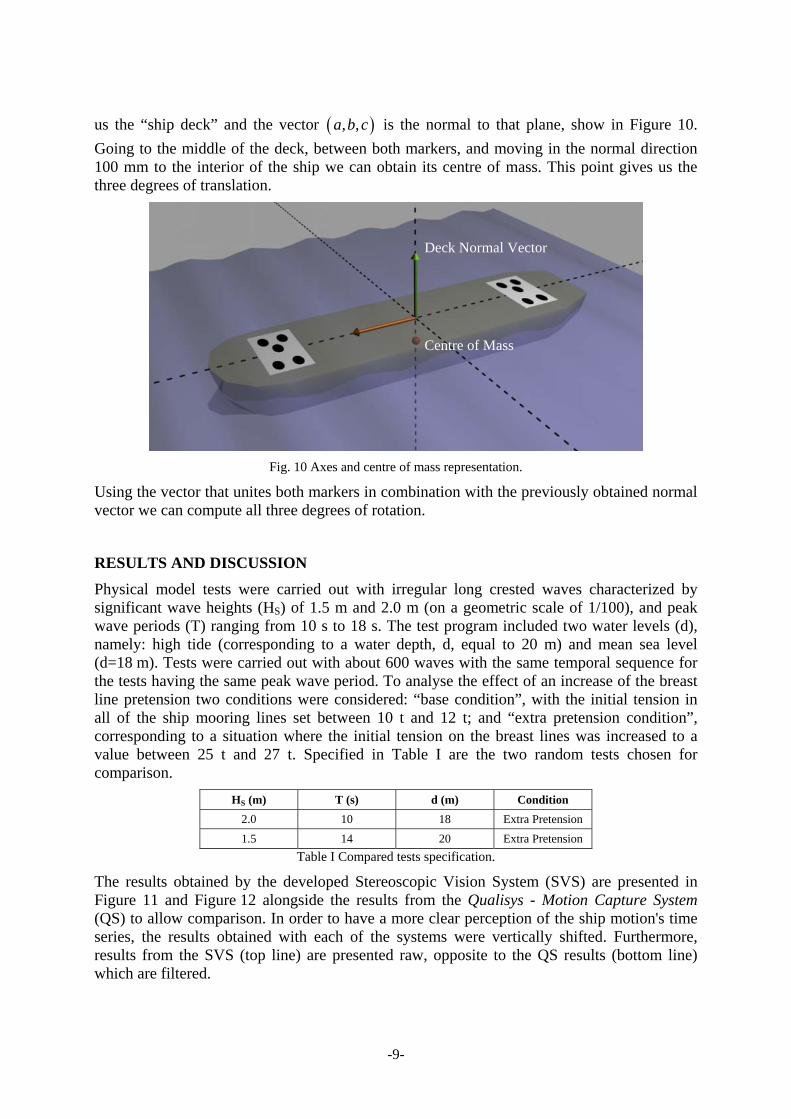
SHIP MOTION ESTIMATION Having detected both markers 3D positions the final task was to determine the motion of the moored ship in its six degrees of freedom. These are referred to its centre of mass, which is approximately amidships and 100 mm below main deck level, as shown in Figure 10.
Through the markers it is possible to determine the best fit plane using least squares (Eberly, 1999). The equation of the plane 0ax by cz d+ + + = that is the best fit of both markers gives
-9-
us the “ship deck” and the vector ( ), ,a b c is the normal to that plane, show in Figure 10. Going to the middle of the deck, between both markers, and moving in the normal direction 100 mm to the interior of the ship we can obtain its centre of mass. This point gives us the three degrees of translation.
Fig. 10 Axes and centre of mass representation.
Using the vector that unites both markers in combination with the previously obtained normal vector we can compute all three degrees of rotation.
RESULTS AND DISCUSSION Physical model tests were carried out with irregular long crested waves characterized by significant wave heights (HS) of 1.5 m and 2.0 m (on a geometric scale of 1/100), and peak wave periods (T) ranging from 10 s to 18 s. The test program included two water levels (d), namely: high tide (corresponding to a water depth, d, equal to 20 m) and mean sea level (d=18 m). Tests were carried out with about 600 waves with the same temporal sequence for the tests having the same peak wave period. To analyse the effect of an increase of the breast line pretension two conditions were considered: “base condition”, with the initial tension in all of the ship mooring lines set between 10 t and 12 t; and “extra pretension condition”, corresponding to a situation where the initial tension on the breast lines was increased to a value between 25 t and 27 t. Specified in Table I are the two random tests chosen for comparison.
HS (m) T (s) d (m) Condition 2.0 10 18 Extra Pretension 1.5 14 20 Extra Pretension
Table I Compared tests specification.
The results obtained by the developed Stereoscopic Vision System (SVS) are presented in Figure 11 and Figure 12 alongside the results from the Qualisys - Motion Capture System (QS) to allow comparison. In order to have a more clear perception of the ship motion's time series, the results obtained with each of the systems were vertically shifted. Furthermore, results from the SVS (top line) are presented raw, opposite to the QS results (bottom line) which are filtered.
Deck Normal Vector
Centre of Mass
-10-
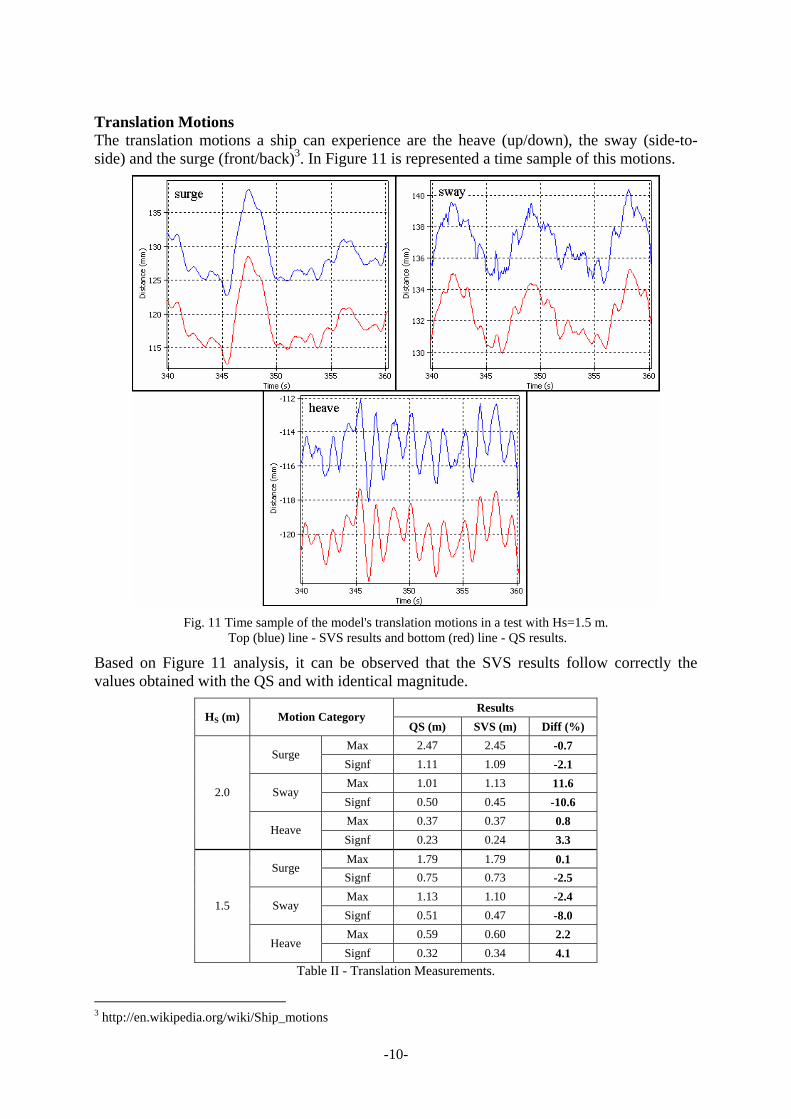
Translation Motions The translation motions a ship can experience are the heave (up/down), the sway (side-to-side) and the surge (front/back)3. In Figure 11 is represented a time sample of this motions.
Fig. 11 Time sample of the model's translation motions in a test with Hs=1.5 m.
Top (blue) line - SVS results and bottom (red) line - QS results.
Based on Figure 11 analysis, it can be observed that the SVS results follow correctly the values obtained with the QS and with identical magnitude.
Results HS (m) Motion Category
QS (m) SVS (m) Diff (%) Max 2.47 2.45 -0.7
Surge Signf 1.11 1.09 -2.1 Max 1.01 1.13 11.6
Sway Signf 0.50 0.45 -10.6 Max 0.37 0.37 0.8
2.0
Heave Signf 0.23 0.24 3.3 Max 1.79 1.79 0.1
Surge Signf 0.75 0.73 -2.5 Max 1.13 1.10 -2.4
Sway Signf 0.51 0.47 -8.0 Max 0.59 0.60 2.2
1.5
Heave Signf 0.32 0.34 4.1
Table II - Translation Measurements.
3 http://en.wikipedia.org/wiki/Ship_motions
-11-
Table II illustrates the maximum (Max) and significant (Signf) amplitude of the ship's translation motions measured with the SVS and QS systems during the two physical model tests, as well as, the differences (Diff) between both systems in percentage. Significant wave height is the average wave height (trough to crest) of the one-third largest waves in a record.
The developed system showed consistency in all tests performed in which the sway results showed a bigger difference from the QS system. This difference is mainly due to the markers position as explained in the next section.
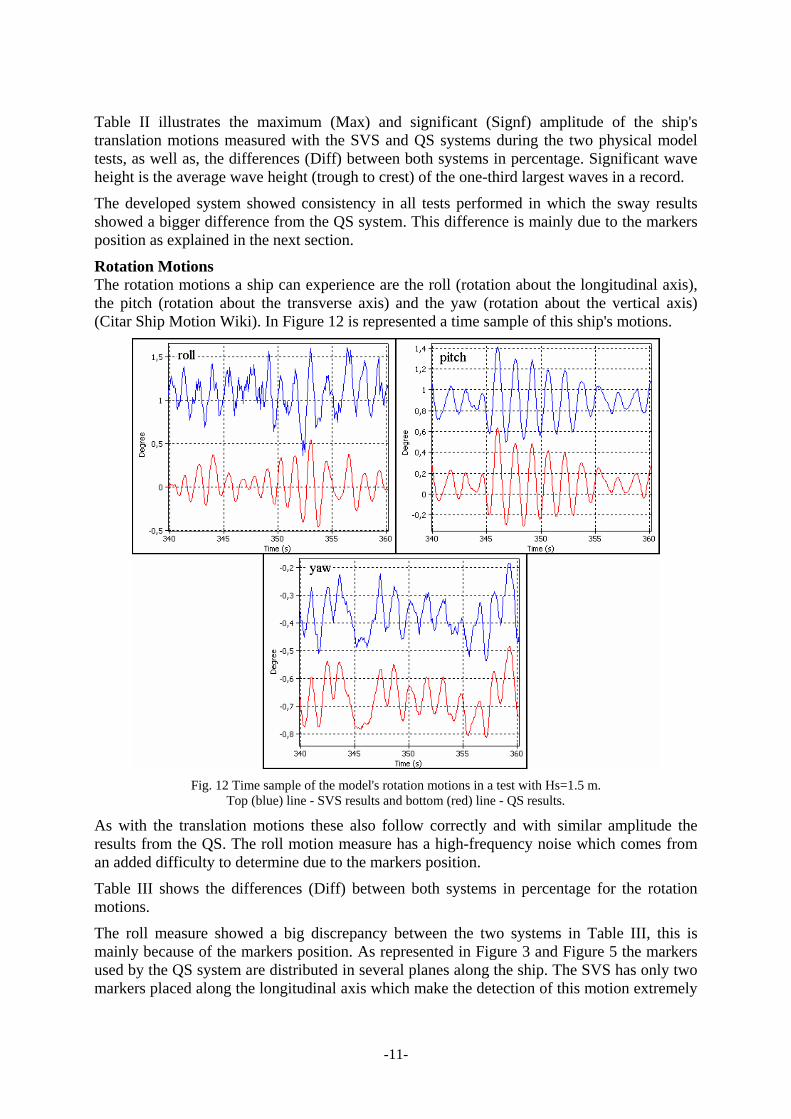
Rotation Motions The rotation motions a ship can experience are the roll (rotation about the longitudinal axis), the pitch (rotation about the transverse axis) and the yaw (rotation about the vertical axis) (Citar Ship Motion Wiki). In Figure 12 is represented a time sample of this ship's motions.
Fig. 12 Time sample of the model's rotation motions in a test with Hs=1.5 m.
Top (blue) line - SVS results and bottom (red) line - QS results.
As with the translation motions these also follow correctly and with similar amplitude the results from the QS. The roll motion measure has a high-frequency noise which comes from an added difficulty to determine due to the markers position.
Table III shows the differences (Diff) between both systems in percentage for the rotation motions.
The roll measure showed a big discrepancy between the two systems in Table III, this is mainly because of the markers position. As represented in Figure 3 and Figure 5 the markers used by the QS system are distributed in several planes along the ship. The SVS has only two markers placed along the longitudinal axis which make the detection of this motion extremely
-12-
difficult. As explained before the markers had to be placed this way in order to not interfere with the QS markers. Nevertheless the pitch and yaw motions are well measured.
Results HS (m) Motion Category
QS (deg) SVS (deg) Diff (%) Max 0.75 0.97 29.8
Roll Signf 0.42 0.57 34.0 Max 0.46 0.47 2.4
Pitch Signf 0.30 0.30 0.0 Max 0.74 0.77 3.5
2.0
Yaw Signf 0.40 0.36 -9.7 Max 1.21 1.46 21.0
Roll Signf 0.63 0.75 19.3 Max 0.83 0.83 -0.5
Pitch Signf 0.45 0.45 0.2 Max 0.66 0.68 3.8
1.5
Yaw Signf 0.29 0.30 1.4
Table III - Rotation Measurements.
CONCLUSIONS AND FUTURE WORKS
Conclusions The developed stereoscopic system was able to measure with high precision in four out of the six degrees of freedom of the ship model. For the sway and roll movements best results could not be obtained using this marker configuration.
All tests showed a good agreement with the results obtained with the Qualisys system. It was possible to measure a few millimetre variations with the cameras positioned approximately at 5 m distance from the target body.
The presented system measurements are acquired in real-time and with a significantly lower cost than the commercial system used for comparison.
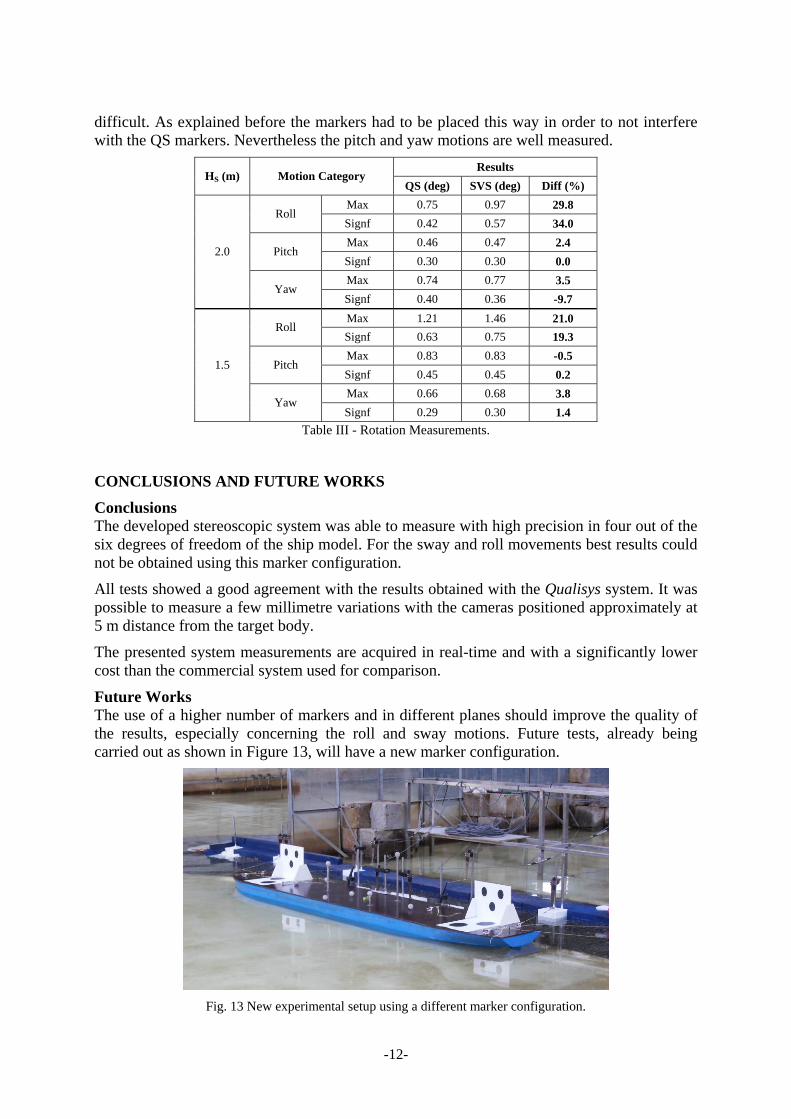
Future Works The use of a higher number of markers and in different planes should improve the quality of the results, especially concerning the roll and sway motions. Future tests, already being carried out as shown in Figure 13, will have a new marker configuration.
Fig. 13 New experimental setup using a different marker configuration.
-13-
These future tests will be ideal for validating the determination of the motion when vertical features (e.g. ship bridge) are present. Real conditions are simulated using a physical model of the Port of Leixões, built at a scale of 1/100.
ACKNOWLEDGMENTS DOLPHIN project (PTDC/ECM/72835/2006) is being funded by the Portuguese Science and Technology Foundation (FCT) through the POCI/FEDER program.
EU FEDER Governo da República Portuguesa
Paulo Rosa Santos and Paulo Malheiros acknowledge the FCT for their PhD grants. The authors are indebted to APDL – Port Authority of Douro and Leixões, S.A. for their support to the undergoing study and to INETI-IST for lending the Qualisys – Motion Capture System.
REFERENCES Eberly D., Least Squares Fitting of Data, paper via Geometric Tools, LLC, 1999
Elias R., Laganière R., Projective Geometry for Three-Dimensional Computer Vision, paper in Viva Research Lab, TR-2001-08, SITE, Nov 2001.
Faugeras O.,Laveau S., 3-d scene representation as a collection of images and fundamental matrices. Technical Report 2205, Institut National de Recherche en Informatique et Automatique, INRIA, Unité de Recherche INRIA-Sophia Antipolis, February 1994.
Hartley R.I., In Defense of the Eight-Point Algorithm, IEEE Transactions on Pattern Analysis And Machine Intelligence, Vol. 19, No. 6, June 1997, p. 580-593.
IHRH-FEUP/IST, Operational conditions on the oil terminal at Leixões Harbour - Porto – Portugal. Technical Report, 6 Vol. (in Portuguese), 2005.
Longuet-Higgins, H.C., A computer algorithm for reconstructing a scene from two projections. Nature, 293:133-135, 1981.
Rosa Santos P., Veloso Gomes F., Taveira Pinto F., Alfredo Santos J., Guedes Soares C., Fonseca N., Paço A., Moreira A. P., Costa P., Malheiros P., Brógueira Dias E., Influence of the use of Mooring Line Pretension on the Behaviour of a Moored Oil Tanker, Proceedings of International Conference in Ocean Engineering, ICOE 2009 IIT Madras, Chennai, India. 2009.
Taveira Pinto F.,Veloso Gomes F., Rosa Santos P., Guedes Soares C., Fonseca N., Alfredo Santos J., Moreira A. P., Costa P.,Brógueira Dias E., Analysis of the behavior of moored tankers, Proceedings of the 27th International Conference on Offshore Mechanics and Arctic Engineering - OMAE2008 (ASME), Estoril, Portugal, 15-20 June 2008, ISBN 0-7918-3821-8. 10 pages.
Zisserman A., Hartley R.I., Multiple View Geometry in Computer Vision, Second Ed., Cambridge University Press, 2004, p 281-282.