Robin Fleming – Group CEO May 20, 2016 · BSP entered into a sale agreement in January 2015 to...
37
Presentation to Shareholders Robin Fleming – Group CEO May 20, 2016
Transcript of Robin Fleming – Group CEO May 20, 2016 · BSP entered into a sale agreement in January 2015 to...
Presentation to Shareholders Robin Fleming – Group CEO May 20, 2016
Sub - title of Presentation Slide 1 BSP Annual General Meeting 2016
11.3%
7.7%
4.9%
13.3%
9.9%
4.3%
2.4% 2.0% 2.7%
- 1,000 2,000 3,000 4,000 5,000 6,000 7,000 8,000
2011 2012 2013 2014 2015 2016F2017F2018F2019F
In U
SD’m
PNG GDP PNG growth rate
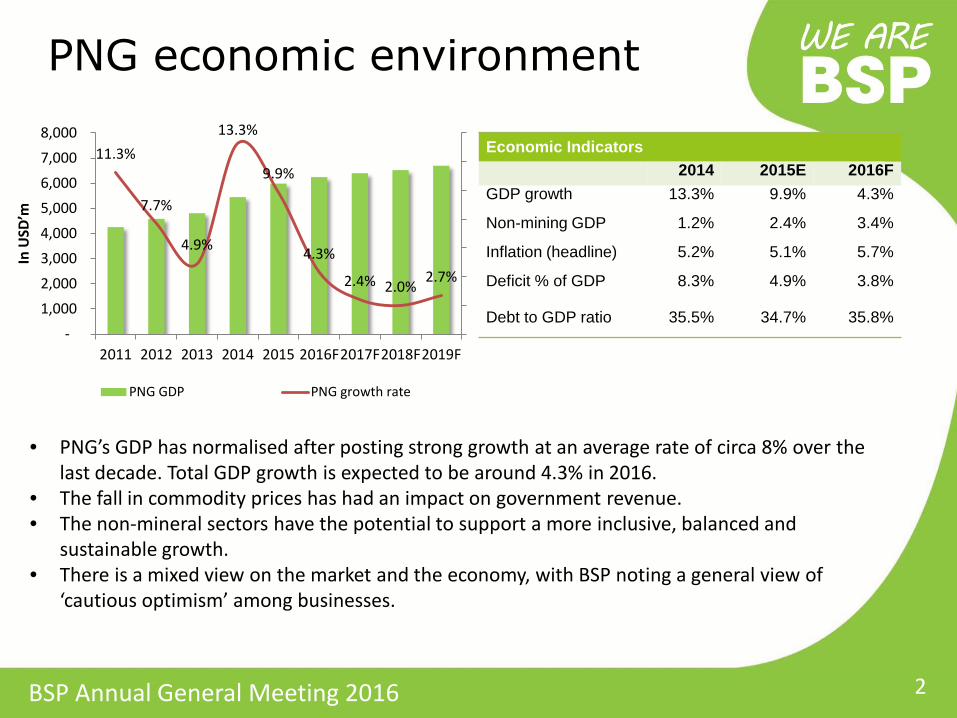
Economic Indicators 2014 2015E 2016F
GDP growth 13.3% 9.9% 4.3%
Non-mining GDP 1.2% 2.4% 3.4%
Inflation (headline) 5.2% 5.1% 5.7%
Deficit % of GDP 8.3% 4.9% 3.8%
Debt to GDP ratio 35.5% 34.7% 35.8%
• PNG’s GDP has normalised after posting strong growth at an average rate of circa 8% over the last decade. Total GDP growth is expected to be around 4.3% in 2016.
• The fall in commodity prices has had an impact on government revenue. • The non-mineral sectors have the potential to support a more inclusive, balanced and
sustainable growth. • There is a mixed view on the market and the economy, with BSP noting a general view of
‘cautious optimism’ among businesses.
PNG economic environment
2
Sub - title of Presentation Slide 1 BSP Annual General Meeting 2016
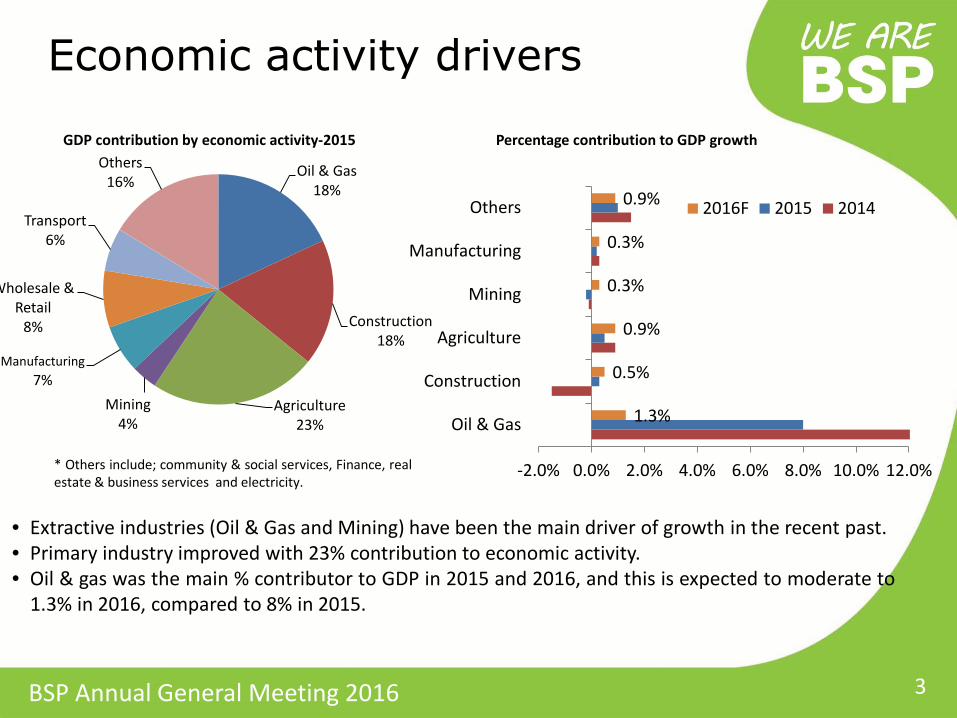
• Extractive industries (Oil & Gas and Mining) have been the main driver of growth in the recent past. • Primary industry improved with 23% contribution to economic activity. • Oil & gas was the main % contributor to GDP in 2015 and 2016, and this is expected to moderate to
1.3% in 2016, compared to 8% in 2015.
Economic activity drivers
3
* Others include; community & social services, Finance, real estate & business services and electricity.
Percentage contribution to GDP growth GDP contribution by economic activity-2015
Oil & Gas 18%
Construction 18%
Agriculture 23%
Mining 4%
Manufacturing 7%
Wholesale & Retail
8%
Transport 6%
Others 16%
1.3%
0.5%
0.9%
0.3%
0.3%
0.9%
-2.0% 0.0% 2.0% 4.0% 6.0% 8.0% 10.0% 12.0%
Oil & Gas
Construction
Agriculture
Mining
Manufacturing
Others 2016F 2015 2014
Sub - title of Presentation Slide 1 BSP Annual General Meeting 2016
5.8
6.4
0.01.02.03.04.05.06.07.0
Dec'11 Dec'12 Dec'13 Dec'14 Dec'15
Inflation (%, quarterly)
0.30
0.35
0.40
0.45
0.50
0.55
Mar'12 Mar'13 Mar'14 Mar'15 Mar'16
USD AUD
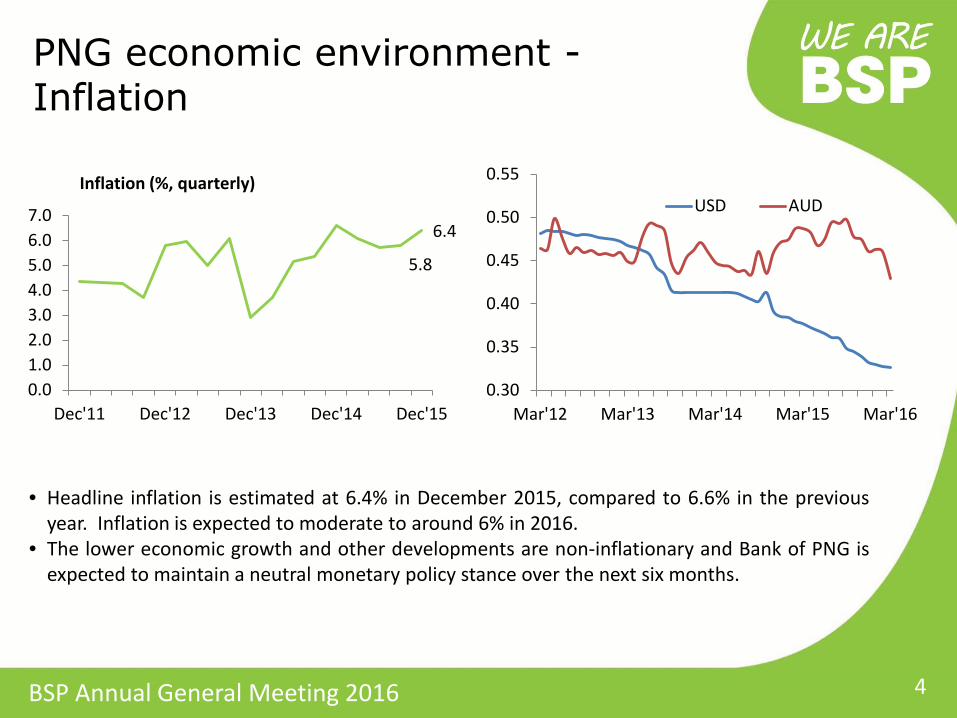
• Headline inflation is estimated at 6.4% in December 2015, compared to 6.6% in the previous year. Inflation is expected to moderate to around 6% in 2016.
• The lower economic growth and other developments are non-inflationary and Bank of PNG is expected to maintain a neutral monetary policy stance over the next six months.
PNG economic environment - Inflation
4
Sub - title of Presentation Slide 1 BSP Annual General Meeting 2016
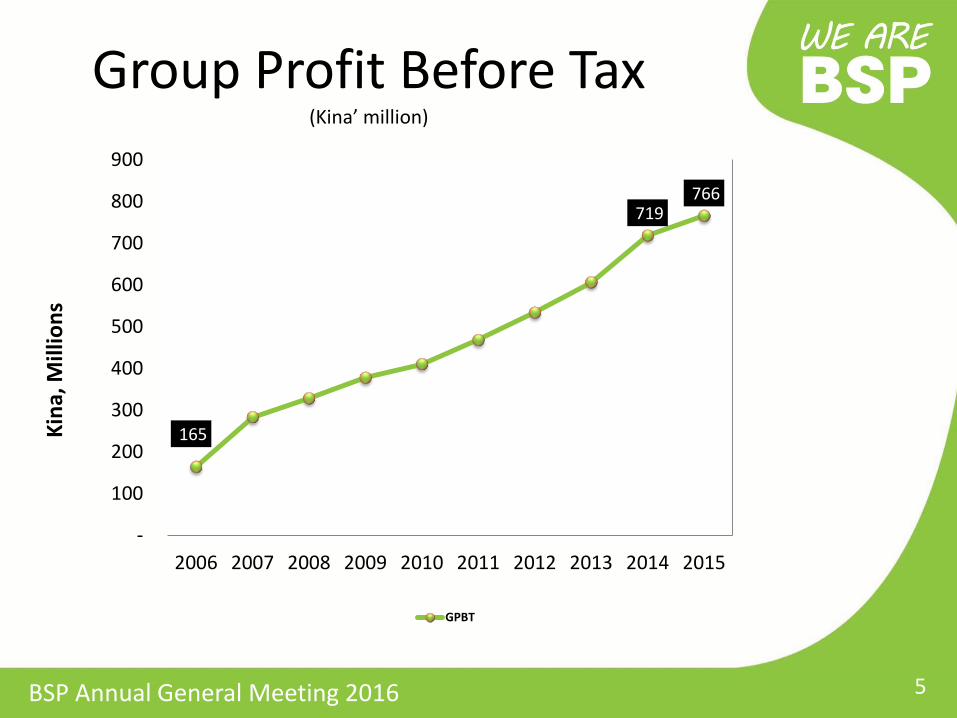
Group Profit Before Tax (Kina’ million)
5
165
719 766
-
100
200
300
400
500
600
700
800
900
2006 2007 2008 2009 2010 2011 2012 2013 2014 2015
Axis
Titl
e
GPBT
Kina
, Mill
ions
Sub - title of Presentation Slide 1 BSP Annual General Meeting 2016
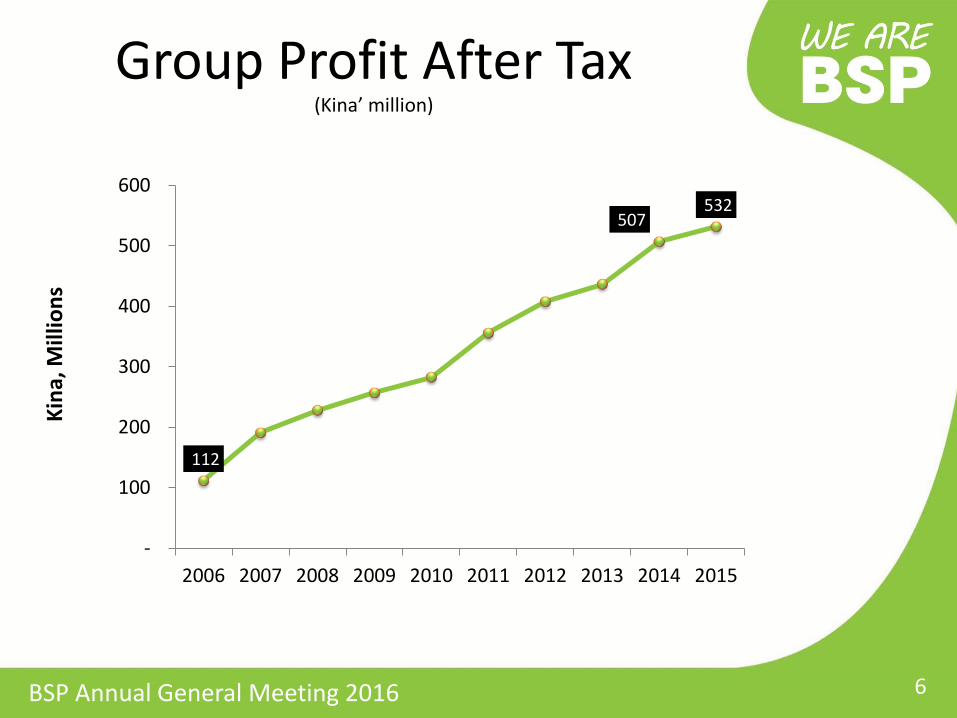
Group Profit After Tax (Kina’ million)
6
112
507 532
-
100
200
300
400
500
600
2006 2007 2008 2009 2010 2011 2012 2013 2014 2015
Ki
na, M
illio
ns
Sub - title of Presentation Slide 1 BSP Annual General Meeting 2016
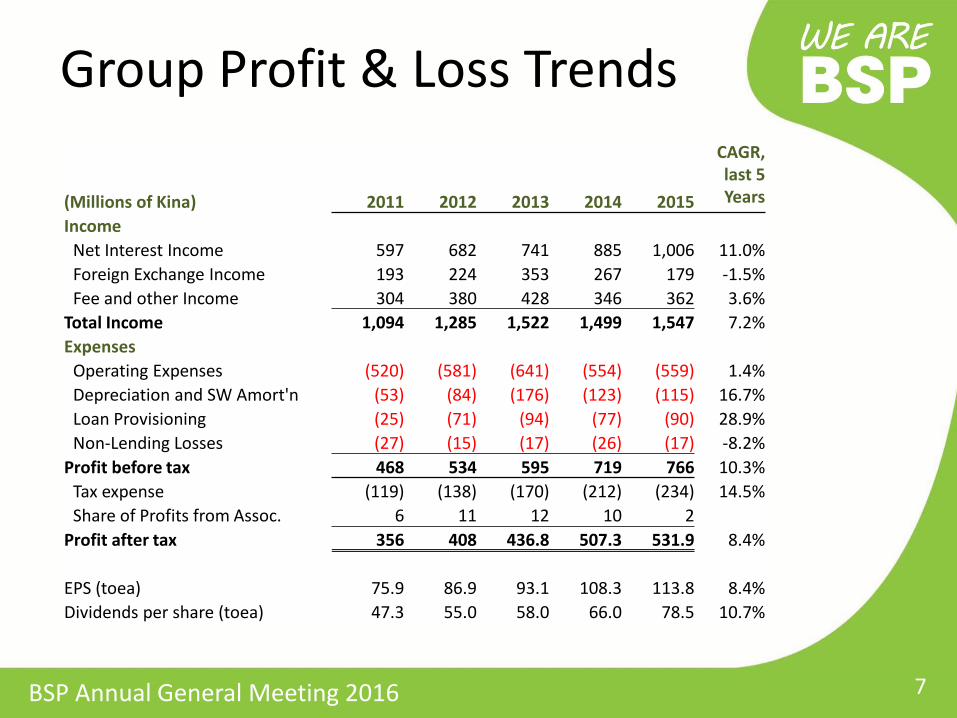
Group Profit & Loss Trends
(Millions of Kina) 2011 2012 2013 2014 2015
CAGR, last 5 Years
Income Net Interest Income 597 682 741 885 1,006 11.0% Foreign Exchange Income 193 224 353 267 179 -1.5% Fee and other Income 304 380 428 346 362 3.6%
Total Income 1,094 1,285 1,522 1,499 1,547 7.2% Expenses
Operating Expenses (520) (581) (641) (554) (559) 1.4% Depreciation and SW Amort'n (53) (84) (176) (123) (115) 16.7% Loan Provisioning (25) (71) (94) (77) (90) 28.9% Non-Lending Losses (27) (15) (17) (26) (17) -8.2%
Profit before tax 468 534 595 719 766 10.3% Tax expense (119) (138) (170) (212) (234) 14.5% Share of Profits from Assoc. 6 11 12 10 2
Profit after tax 356 408 436.8 507.3 531.9 8.4% EPS (toea) 75.9 86.9 93.1 108.3 113.8 8.4% Dividends per share (toea) 47.3 55.0 58.0 66.0 78.5 10.7%
7
Sub - title of Presentation Slide 1 BSP Annual General Meeting 2016
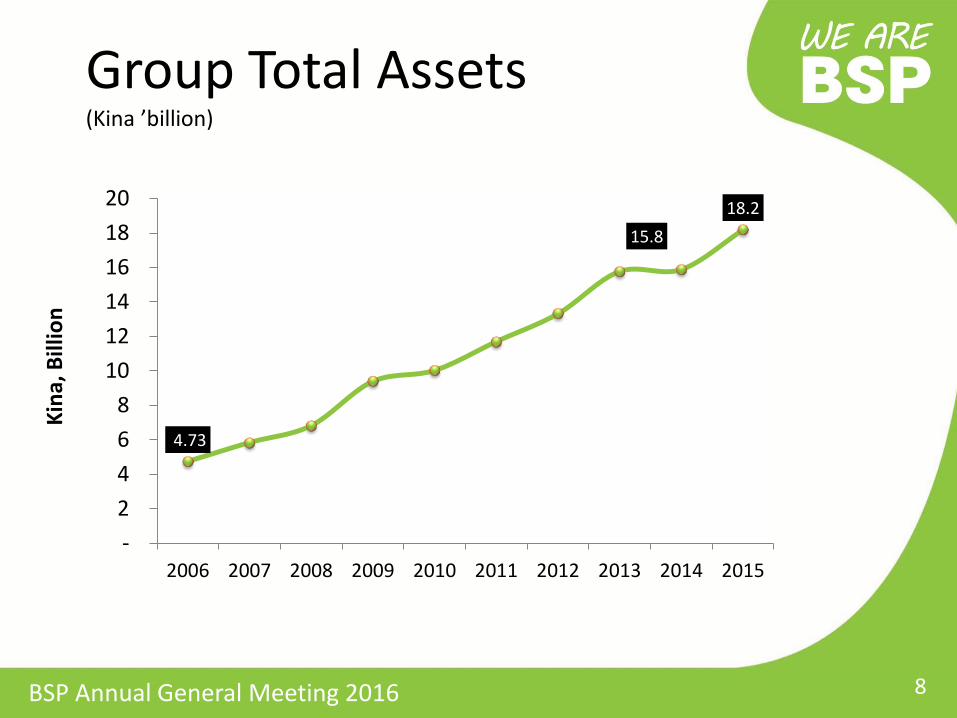
Group Total Assets (Kina ’billion)
8
4.73
15.8 18.2
- 2 4 6 8
10 12 14 16 18 20
2006 2007 2008 2009 2010 2011 2012 2013 2014 2015
Kina
, Bill
ion
Sub - title of Presentation Slide 1 BSP Annual General Meeting 2016
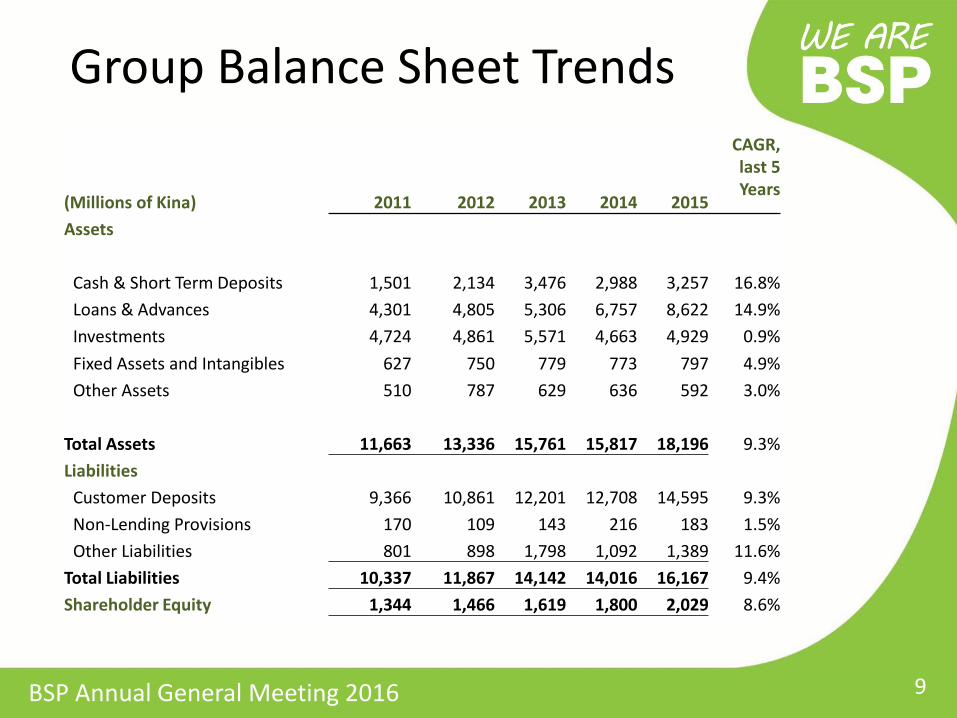
Group Balance Sheet Trends
(Millions of Kina) 2011 2012 2013 2014 2015
CAGR, last 5 Years
Assets
Cash & Short Term Deposits 1,501 2,134 3,476 2,988 3,257 16.8% Loans & Advances 4,301 4,805 5,306 6,757 8,622 14.9% Investments 4,724 4,861 5,571 4,663 4,929 0.9% Fixed Assets and Intangibles 627 750 779 773 797 4.9% Other Assets 510 787 629 636 592 3.0%
Total Assets 11,663 13,336 15,761 15,817 18,196 9.3% Liabilities
Customer Deposits 9,366 10,861 12,201 12,708 14,595 9.3% Non-Lending Provisions 170 109 143 216 183 1.5% Other Liabilities 801 898 1,798 1,092 1,389 11.6%
Total Liabilities 10,337 11,867 14,142 14,016 16,167 9.4% Shareholder Equity 1,344 1,466 1,619 1,800 2,029 8.6%
9
Sub - title of Presentation Slide 1 BSP Annual General Meeting 2016
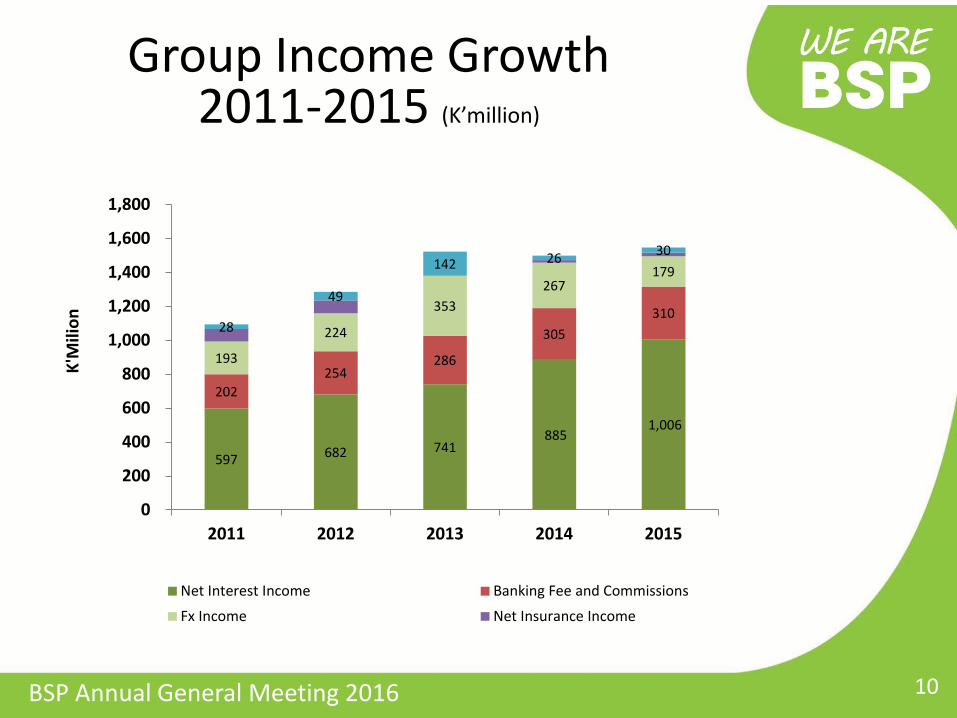
Group Income Growth 2011-2015 (K’million)
10
597 682 741 885
1,006
202 254
286
305 310
193
224
353 267
179
28
49
142 26 30
0
200
400
600
800
1,000
1,200
1,400
1,600
1,800
2011 2012 2013 2014 2015
Net Interest Income Banking Fee and Commissions
Fx Income Net Insurance Income
K'M
ilion
Sub - title of Presentation Slide 1 BSP Annual General Meeting 2016
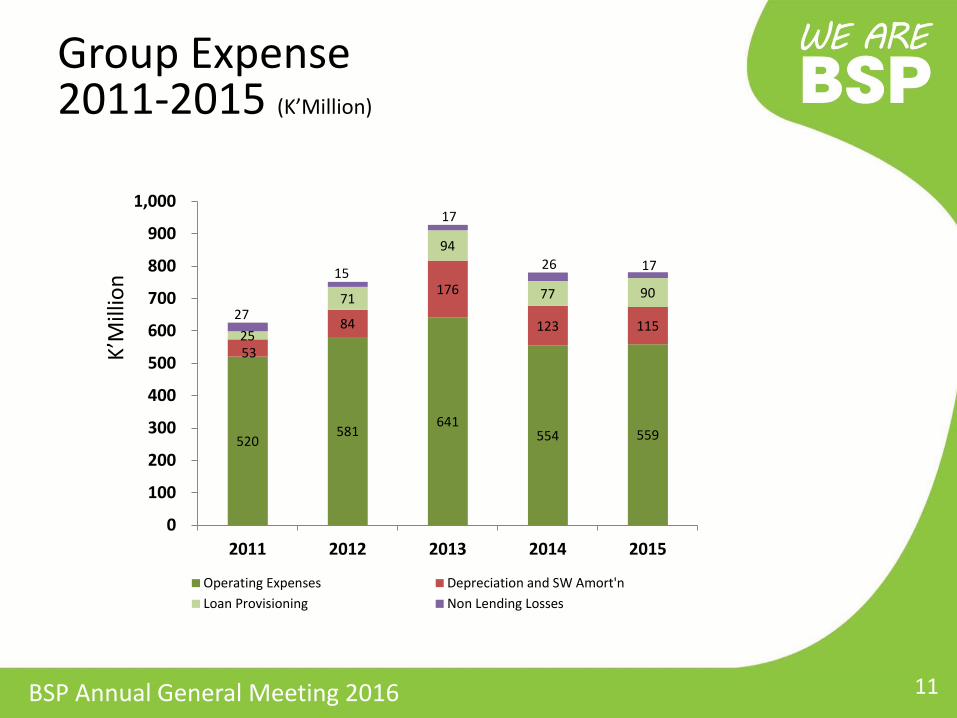
Group Expense 2011-2015 (K’Million)
11
520 581
641 554 559
53
84
176
123 115 25
71
94
77 90 27
15
17
26 17
0
100
200
300
400
500
600
700
800
900
1,000
2011 2012 2013 2014 2015
Operating Expenses Depreciation and SW Amort'nLoan Provisioning Non Lending Losses
K’M
illio
n
Sub - title of Presentation Slide 1 BSP Annual General Meeting 2016
Suva
VANUA LEVU
VITI LEVUNadi
Lomaloma
Taveuni
Navua Suva CentralDominion House
Centre Point
Sigatoka
SavusavuNabowalu
Labasa
Ovalau
Vunisea
KorovouLautoka
Tavua
Ba
Rakiraki
FIJIFIJI Labasa
VANUA LEVU
Taveuni Savusavu
Nabowalu
Rakiraki
Ovalau
Lomaloma
Tavua
Lautoka Ba
Nadi
Korovou
Suva Suva Central Dominion House Pacific House Centre Point
Navua Sigatoka
Vunisea
VITI LEVU
SOLOMON IS.
Honiara Honiara Point Cruz Ranadi
Gizo
Noro
Munda
Auki
SAMOA
Salelologa Apia Apia Vaitelei
TONGA
Vava’u
Nuku’ alofa
COOK IS. Aitutaki
Manuea
Atiu
Mitiaro
Mauke
AVARUA
Mangaia
Southern Islands
Rarotonga
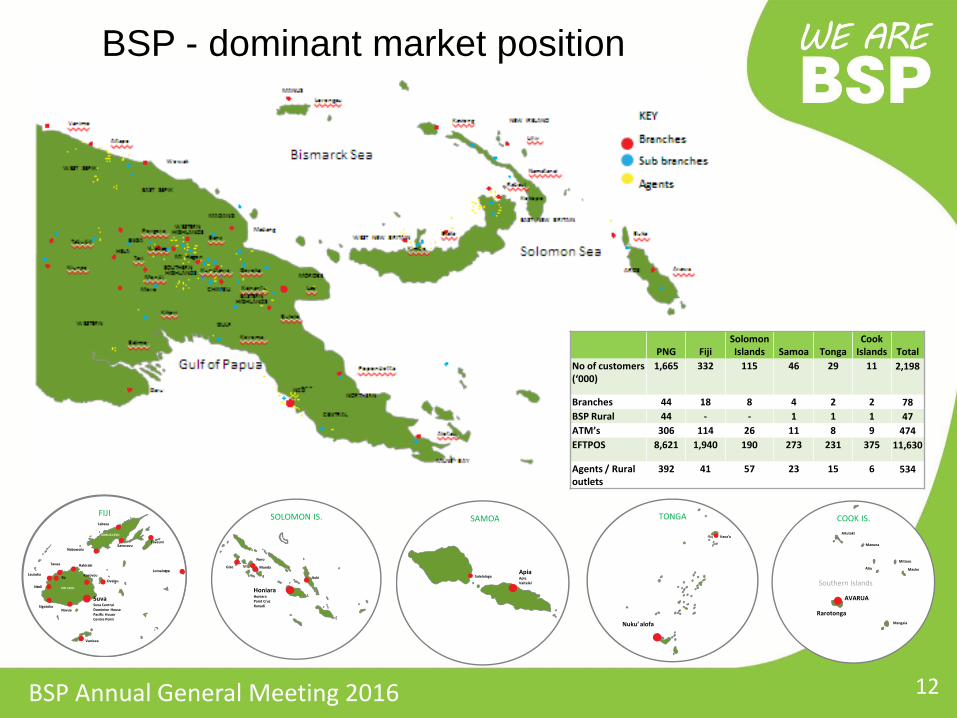
BSP - dominant market position
PNG Fiji Solomon Islands Samoa Tonga
Cook Islands Total
No of customers (‘000)
1,665 332 115 46 29 11 2,198
Branches 44 18 8 4 2 2 78 BSP Rural 44 - - 1 1 1 47 ATM’s 306 114 26 11 8 9 474 EFTPOS 8,621 1,940 190 273 231 375 11,630
Agents / Rural outlets
392 41 57 23 15 6 534
12
Sub - title of Presentation Slide 1 BSP Annual General Meeting 2016
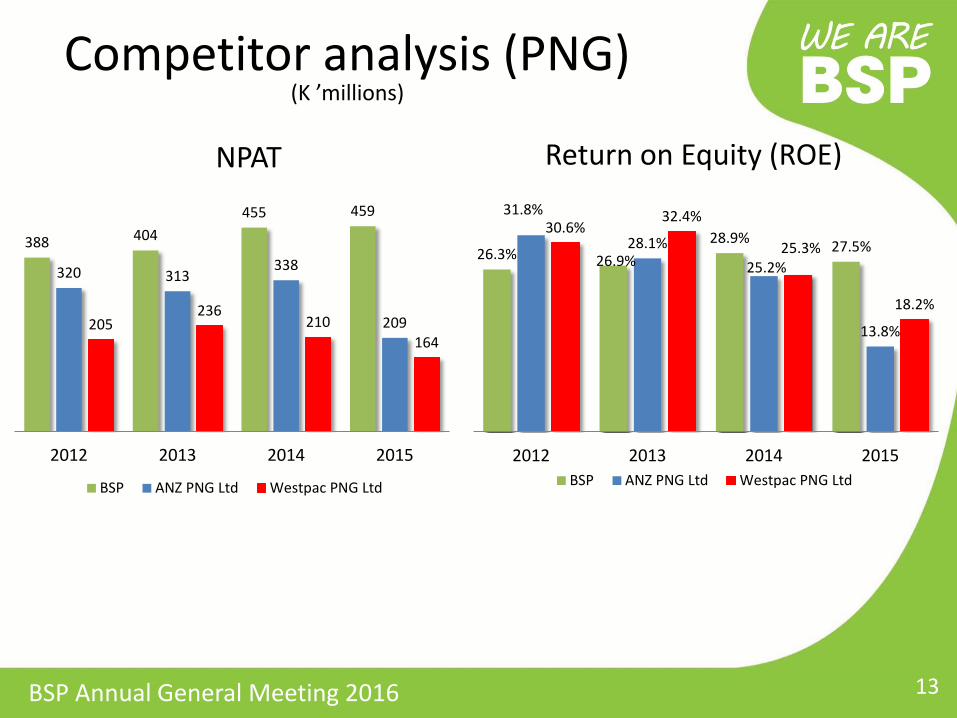
Return on Equity (ROE) NPAT
Competitor analysis (PNG) (K ’millions)
13
388 404 455 459
320 313 338
209 205 236
210 164
2012 2013 2014 2015
BSP ANZ PNG Ltd Westpac PNG Ltd
26.3% 26.9% 28.9% 27.5%
31.8%
28.1% 25.2%
13.8%
30.6% 32.4%
25.3%
18.2%
2012 2013 2014 2015BSP ANZ PNG Ltd Westpac PNG Ltd
Sub - title of Presentation Slide 1 BSP Annual General Meeting 2016
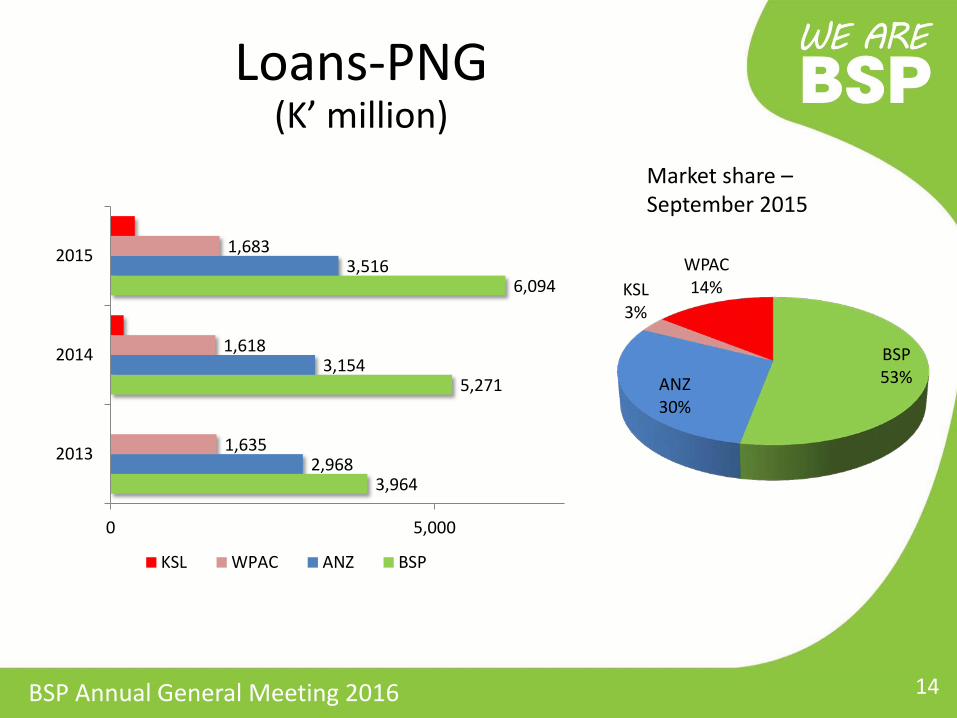
Loans-PNG (K’ million)
14
3,964
5,271
6,094
2,968
3,154
3,516
1,635
1,618
1,683
2013
2014
2015
0 5,000
KSL WPAC ANZ BSP
BSP 53% ANZ
30%
KSL 3%
WPAC 14%
Market share – September 2015
Sub - title of Presentation Slide 1 BSP Annual General Meeting 2016
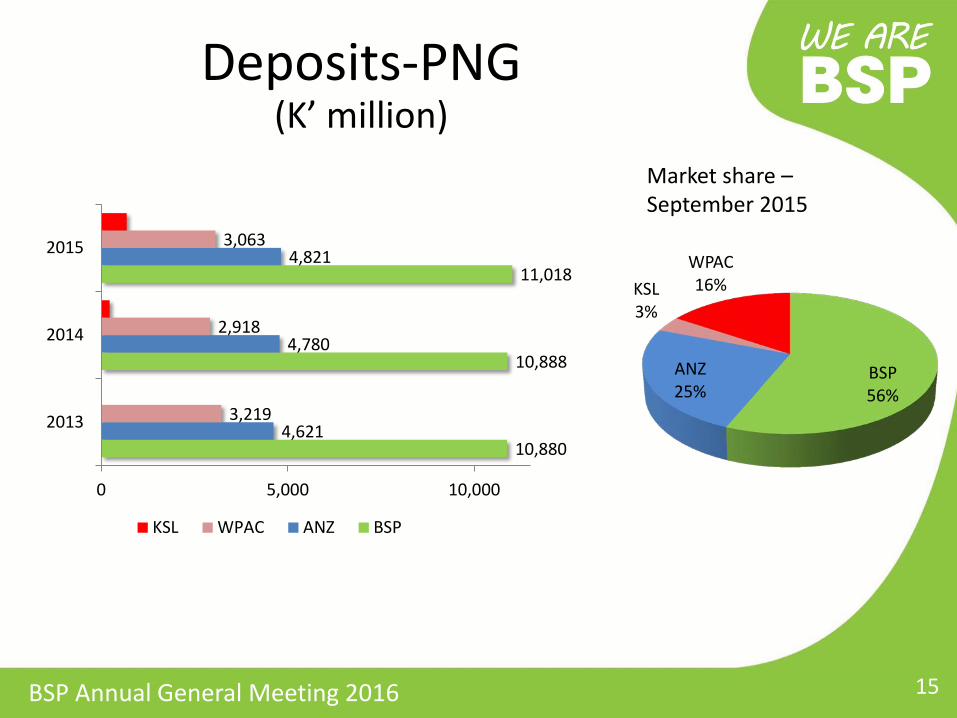
Deposits-PNG (K’ million)
15
10,880
10,888
11,018
4,621
4,780
4,821
3,219
2,918
3,063
2013
2014
2015
0 5,000 10,000
KSL WPAC ANZ BSP
BSP 56%
ANZ 25%
KSL 3%
WPAC 16%
Market share – September 2015
Sub - title of Presentation Slide 1 BSP Annual General Meeting 2016
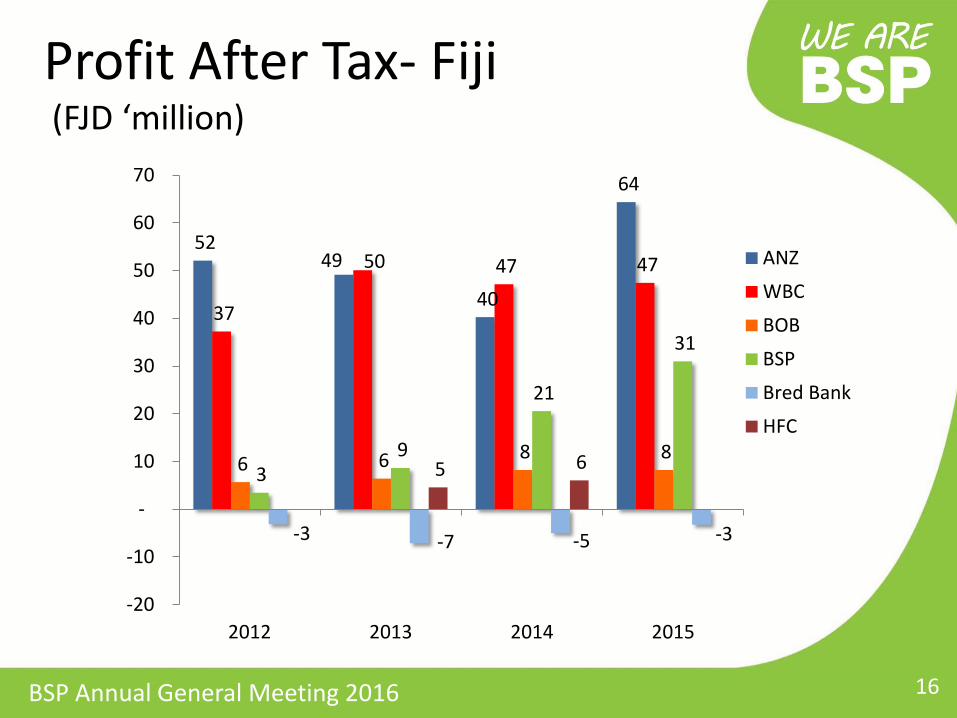
Profit After Tax- Fiji (FJD ‘million)
52 49
40
64
37
50 47 47
6 6 8 8 3
9
21
31
-3 -7 -5 -3
5 6
-20
-10
-
10
20
30
40
50
60
70
2012 2013 2014 2015
ANZ
WBC
BOB
BSP
Bred Bank
HFC
16
Sub - title of Presentation Slide 1 BSP Annual General Meeting 2016
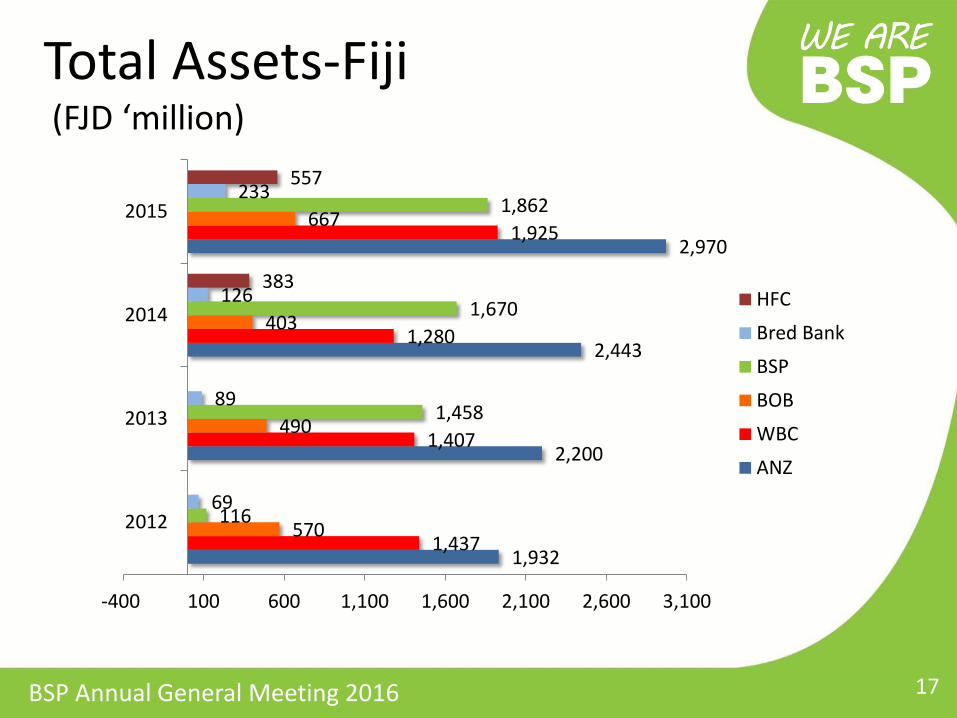
Total Assets-Fiji (FJD ‘million)
1,932
2,200
2,443
2,970
1,437
1,407
1,280
1,925
570
490
403
667
116
1,458
1,670
1,862
69
89
126
233
383
557
-400 100 600 1,100 1,600 2,100 2,600 3,100
2012
2013
2014
2015
HFC
Bred Bank
BSP
BOB
WBC
ANZ
17
Sub - title of Presentation Slide 1 BSP Annual General Meeting 2016
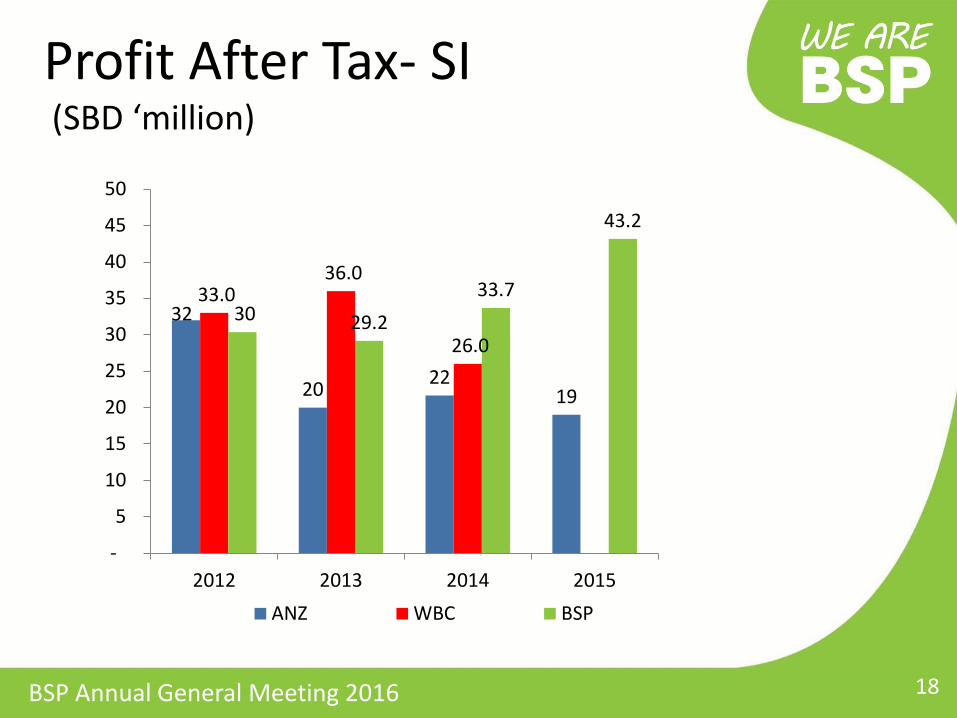
Profit After Tax- SI (SBD ‘million)
18
32
20 22 19
33.0 36.0
26.0 30 29.2
33.7
43.2
-
5
10
15
20
25
30
35
40
45
50
2012 2013 2014 2015ANZ WBC BSP
Sub - title of Presentation Slide 1 BSP Annual General Meeting 2016
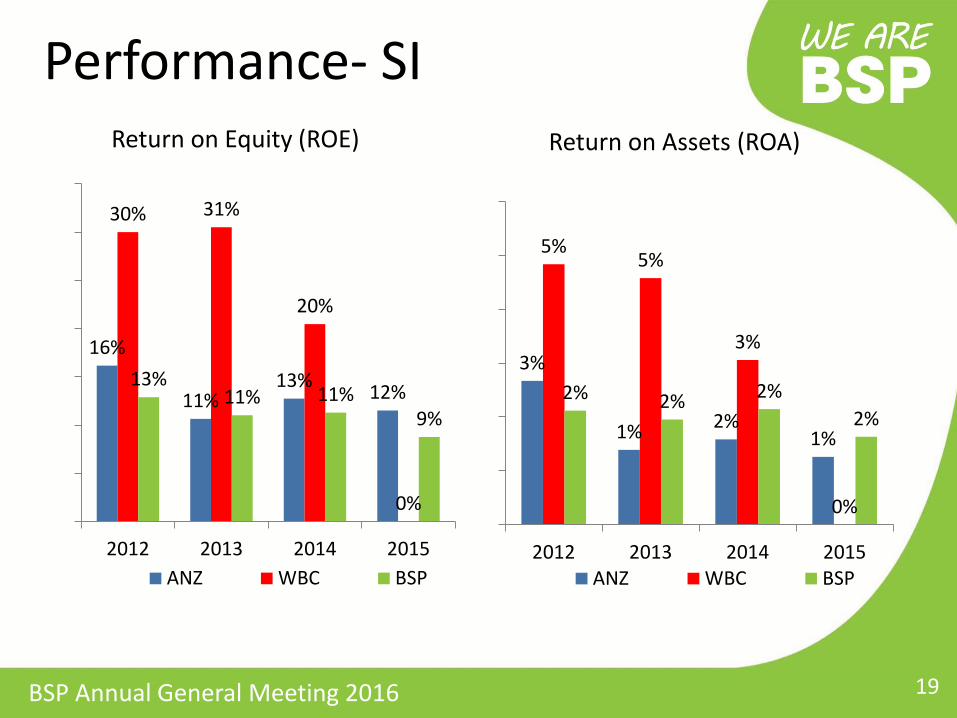
Performance- SI
19
Return on Equity (ROE) Return on Assets (ROA)
16%
11% 13% 12%
30% 31%
20%
0%
13% 11% 11%
9%
2012 2013 2014 2015ANZ WBC BSP
3%
1% 2% 1%
5% 5%
3%
0%
2% 2% 2% 2%
2012 2013 2014 2015ANZ WBC BSP
Sub - title of Presentation Slide 1 BSP Annual General Meeting 2016
Westpac Acquisition: 1. BSP entered into a sale agreement in January 2015 to acquire
Westpac’s operations in Solomon Islands, Vanuatu, Samoa, Tonga and Cook Islands for A$125m.
2. Completed acquisition of Samoa, Tonga and Cook Islands on July 10th, 2015 and integration with BSP has been successful
3. Acquisition of Solomon Islands operations was completed in October 2015. Currently undergoing system integration.
4. Regulatory approval for Vanuatu acquisition has been granted by the Reserve Bank of Vanuatu; acquisition plans are currently on track, with completion of transition currently anticipated to happen in July 2016.
Strategic Focus 2016/17
20

Sub - title of Presentation Slide 1 BSP Annual General Meeting 2016
BSP Finance 1. Business Finance operations in Fiji and PNG are progressing
well and are tracking to business plans, since their inception in late 2014. Financial and operational success targets have been set and pursued for continuation of loan book growth and profitability, and operational efficiency.
2. BSP Finance will follow BSP’s regional expansion program by exploring opportunities to expand to other geographies that BSP Bank already exist in.
3. BSP Finance is also exploring market entry opportunities outside of the Pacific Region.
Strategic Focus 2016/17
21
Sub - title of Presentation Slide 1 BSP Annual General Meeting 2016
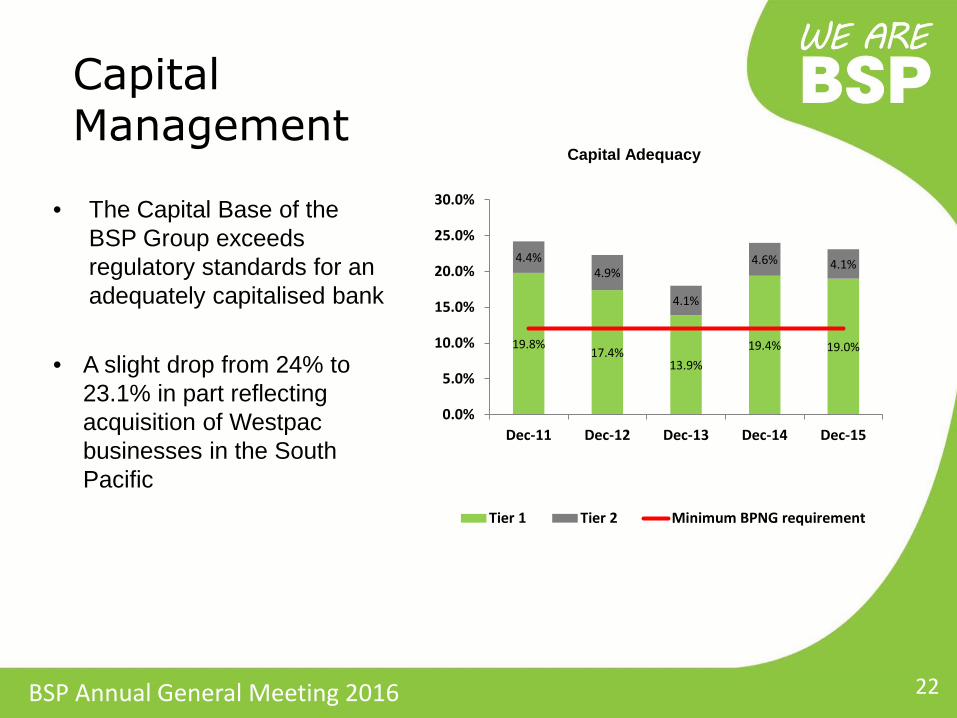
19.8% 17.4%
13.9% 19.4% 19.0%
4.4% 4.9%
4.1%
4.6% 4.1%
0.0%
5.0%
10.0%
15.0%
20.0%
25.0%
30.0%
Dec-11 Dec-12 Dec-13 Dec-14 Dec-15
Tier 1 Tier 2 Minimum BPNG requirement
Capital Adequacy
Capital Management
• The Capital Base of the BSP Group exceeds regulatory standards for an adequately capitalised bank
• A slight drop from 24% to 23.1% in part reflecting acquisition of Westpac businesses in the South Pacific
22
Sub - title of Presentation Slide 1 BSP Annual General Meeting 2016
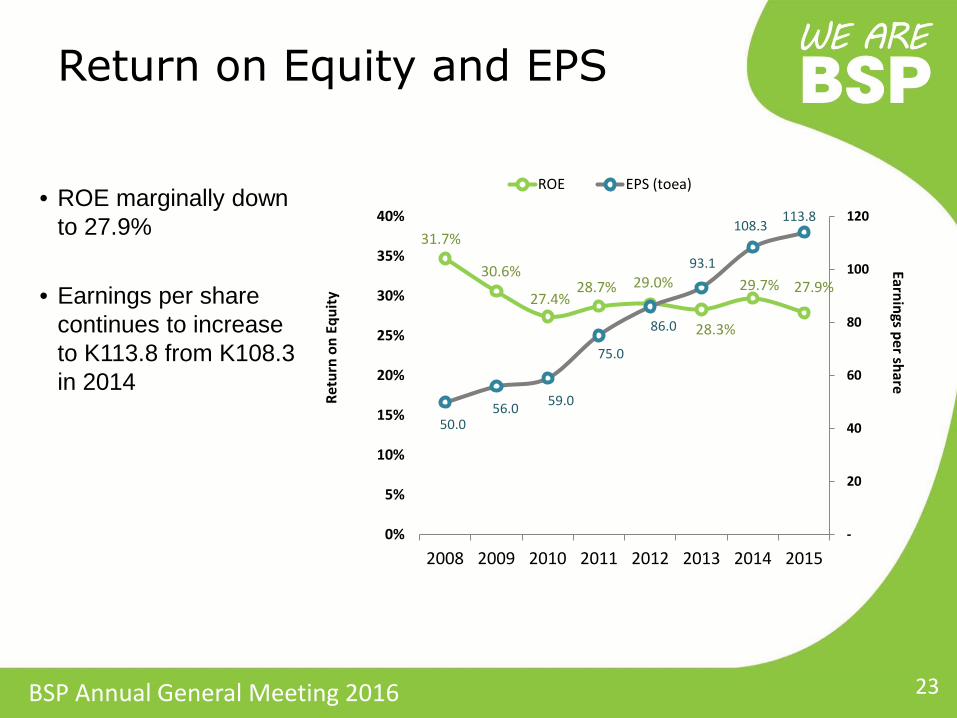
Return on Equity and EPS
• ROE marginally down to 27.9%
• Earnings per share continues to increase to K113.8 from K108.3 in 2014
23
31.7%
30.6%
27.4% 28.7% 29.0%
28.3%
29.7% 27.9%
50.0 56.0 59.0
75.0
86.0
93.1
108.3 113.8
-
20
40
60
80
100
120
0%
5%
10%
15%
20%
25%
30%
35%
40%
2008 2009 2010 2011 2012 2013 2014 2015
ROE EPS (toea)
Earnings per share Retu
rn o
n Eq
uity

Sub - title of Presentation Slide 1 BSP Annual General Meeting 2016
Non Performing Loans and Provisioning to Total Loans
• Non Performing loans increased in 2015, primarily driven by the impact from newly acquired operations in Tonga, Cook Islands, Samoa, and Solomon Islands.
• Provisioning also
increased to 4.9% in 2015.
24
3.8% 4.4%
5.0% 4.6% 4.9%
2.1% 1.2%
0.8% 0.6%
1.7%
FY2011 FY2012 FY2013 FY2014 FY2015
Provision to Loans NPL
Sub - title of Presentation Slide 1 BSP Annual General Meeting 2016
Q1/2016 Results
25

Sub - title of Presentation Slide 1 BSP Annual General Meeting 2016
Group profit after tax was up by 2% (+K3m) to K143.7m in Q1’16. NPAT was 10% higher than the previous corresponding period (pcp) figure of K130.5m. • Total Revenue down 5% this qtr to
K397m from K419m, however up 9% from pcp. The decline was attributed mainly to a drop in fees and commission income. Other areas that also declined from last qtr were Interest from liquid investments and FX income.
• Loan loss provisioning down 19% (K3.6m) to K15.2m from K18.8m this quarter, which reflects higher recoveries and reduced retail write-off Q1’16.
• Depreciation & amortisation down 21% to K23m from last qtr (K29m) from a decline in the level of software amortisation.
• Other Operating Expenses (less dep’n and amort’n) down 2% (K3m) to K156m from K159m due to cost savings in general admin costs.
Profit & Loss (Kina ‘million)
26
143.7
396.7
15.2
179.1
23.2
155.9
0
50
100
150
200
250
300
350
400
450
Net Profit(After tax plus
associates)
TotalRevenue
Loan lossprovisioning
OtherOperatingExpenses
Depreciationand
Amortisation
Oth Op Expless Depn and
A'mn
Q1-15 Q2-15 Q3-15 Q4-15 Q1-16

Sub - title of Presentation Slide 1 BSP Annual General Meeting 2016
8.8
5.5
14.7
18.5
-
2
4
6
8
10
12
14
16
18
20
Loans Other IntEarningAssets
Deposits Total Assets
Kina
bill
ions
Q1-15 Q2-15 Q3-15 Q4-15 Q1-16Total Assets up 1% to K18.5b this qtr from K18.2b in Q4’15. The increase reflects increases in cash and loans and advances • Net loans increased by 1% to K8.8b this
qtr from K8.6b as at the end of Dec’15. Compared to the previous corresponding period of 2015, loans was up by 28% or K1.93b.
• Total deposits grew 1% to K14.7b from
K14.6b largely attributed to growth in deposits in SI, Samoa and Tonga.
Balance Sheet (Kina ‘billion)
27
Sub - title of Presentation Slide 1 BSP Annual General Meeting 2016
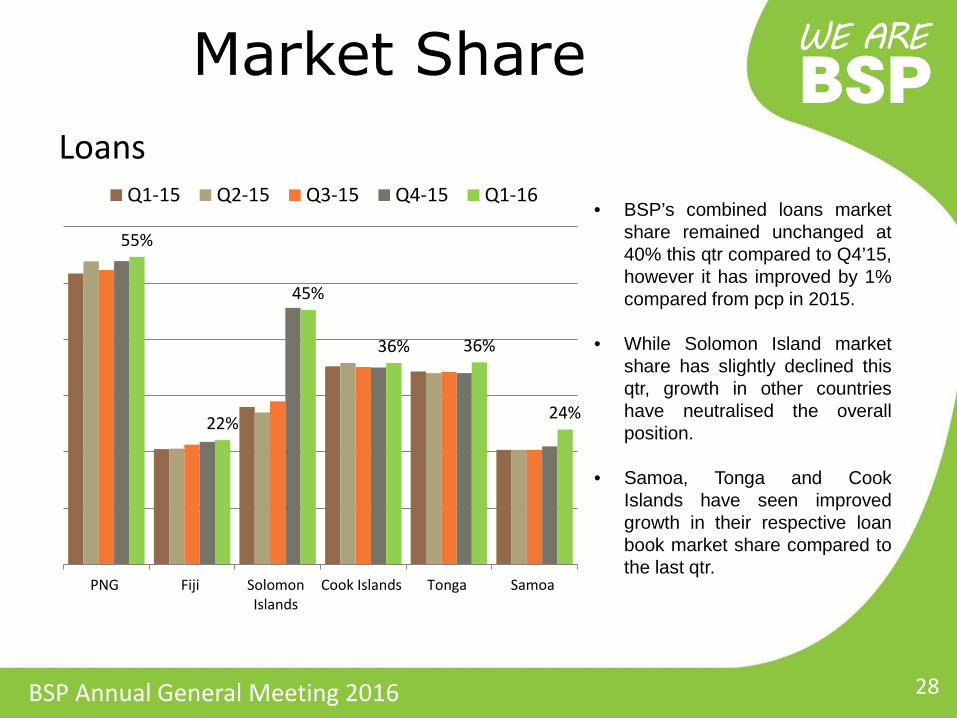
55%
22%
45%
36% 36%
24%
PNG Fiji SolomonIslands
Cook Islands Tonga Samoa
Q1-15 Q2-15 Q3-15 Q4-15 Q1-16• BSP’s combined loans market
share remained unchanged at 40% this qtr compared to Q4’15, however it has improved by 1% compared from pcp in 2015.
• While Solomon Island market
share has slightly declined this qtr, growth in other countries have neutralised the overall position.
• Samoa, Tonga and Cook Islands have seen improved growth in their respective loan book market share compared to the last qtr.
Market Share Loans
28
Sub - title of Presentation Slide 1 BSP Annual General Meeting 2016
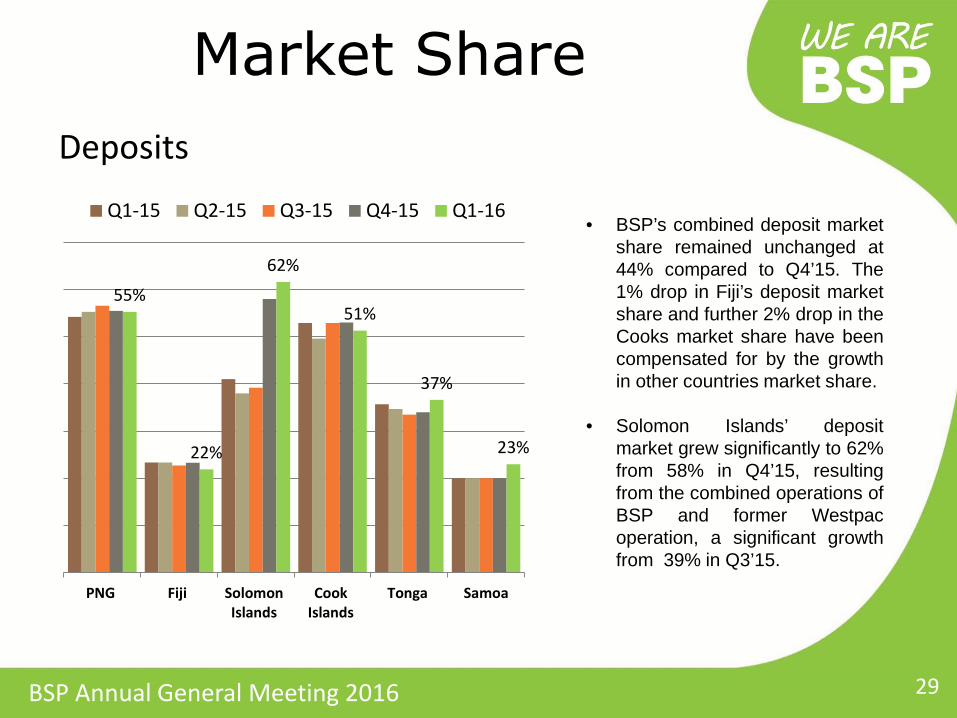
55%
22%
62%
51%
37%
23%
PNG Fiji SolomonIslands
CookIslands
Tonga Samoa
Q1-15 Q2-15 Q3-15 Q4-15 Q1-16• BSP’s combined deposit market
share remained unchanged at 44% compared to Q4’15. The 1% drop in Fiji’s deposit market share and further 2% drop in the Cooks market share have been compensated for by the growth in other countries market share.
• Solomon Islands’ deposit market grew significantly to 62% from 58% in Q4’15, resulting from the combined operations of BSP and former Westpac operation, a significant growth from 39% in Q3’15.
Market Share Deposits
29
Sub - title of Presentation Slide 1 BSP Annual General Meeting 2016
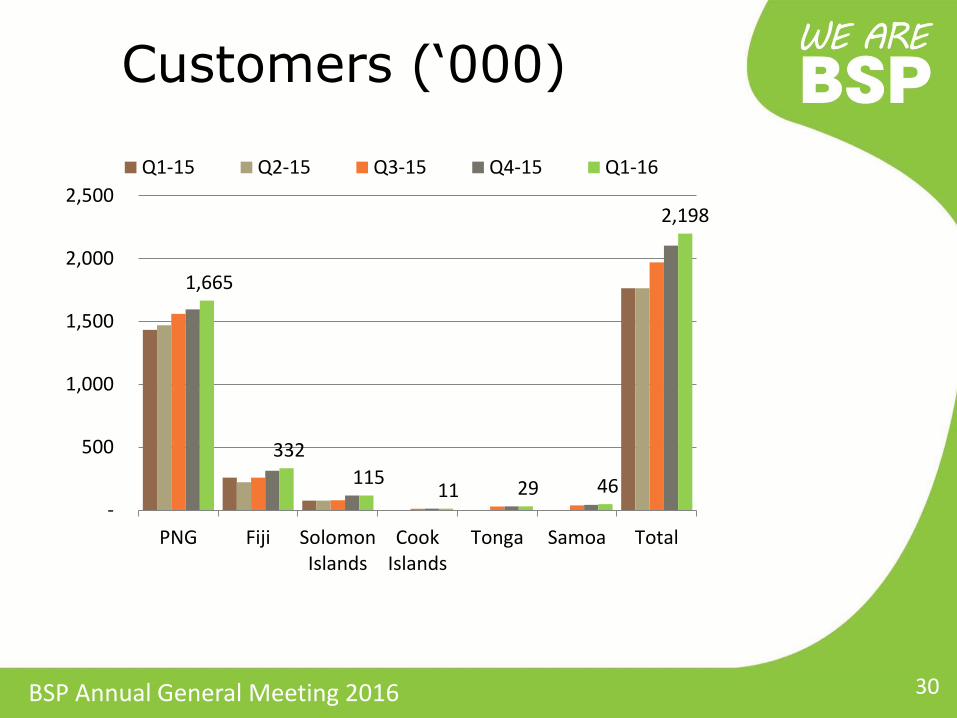
Customers (‘000)
30
1,665
332 115 11 29 46
2,198
-
500
1,000
1,500
2,000
2,500
PNG Fiji SolomonIslands
CookIslands
Tonga Samoa Total
Q1-15 Q2-15 Q3-15 Q4-15 Q1-16
Sub - title of Presentation Slide 1 BSP Annual General Meeting 2016
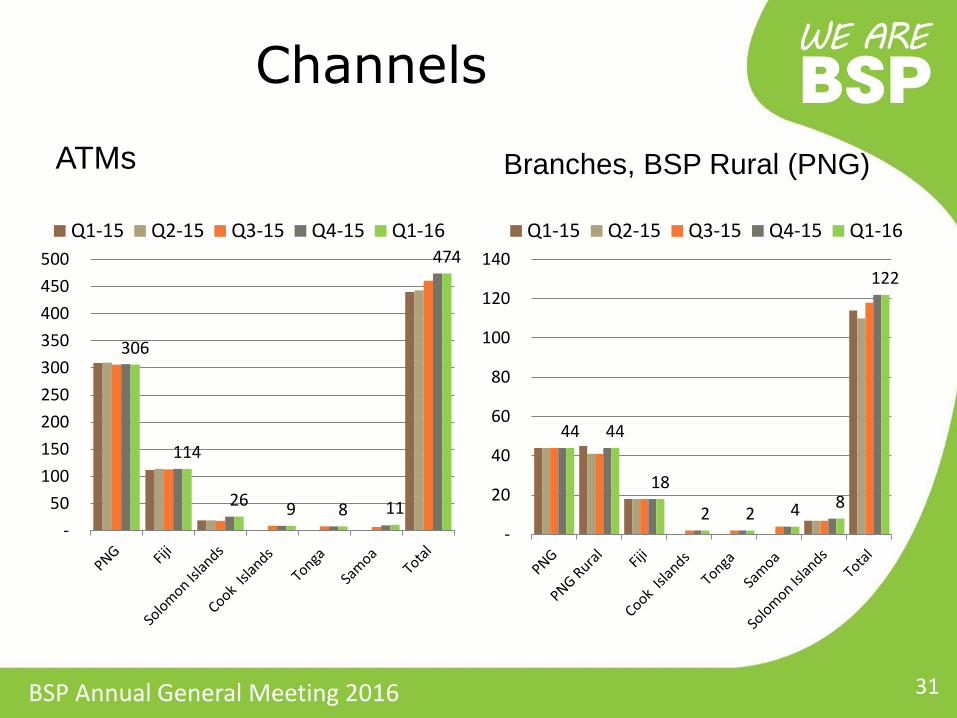
306
114
26 9 8 11
474
- 50
100 150 200 250 300 350 400 450 500
Q1-15 Q2-15 Q3-15 Q4-15 Q1-16
Branches, BSP Rural (PNG) ATMs
Channels
31
44 44
18
2 2 4 8
122
-
20
40
60
80
100
120
140Q1-15 Q2-15 Q3-15 Q4-15 Q1-16
Sub - title of Presentation Slide 1 BSP Annual General Meeting 2016
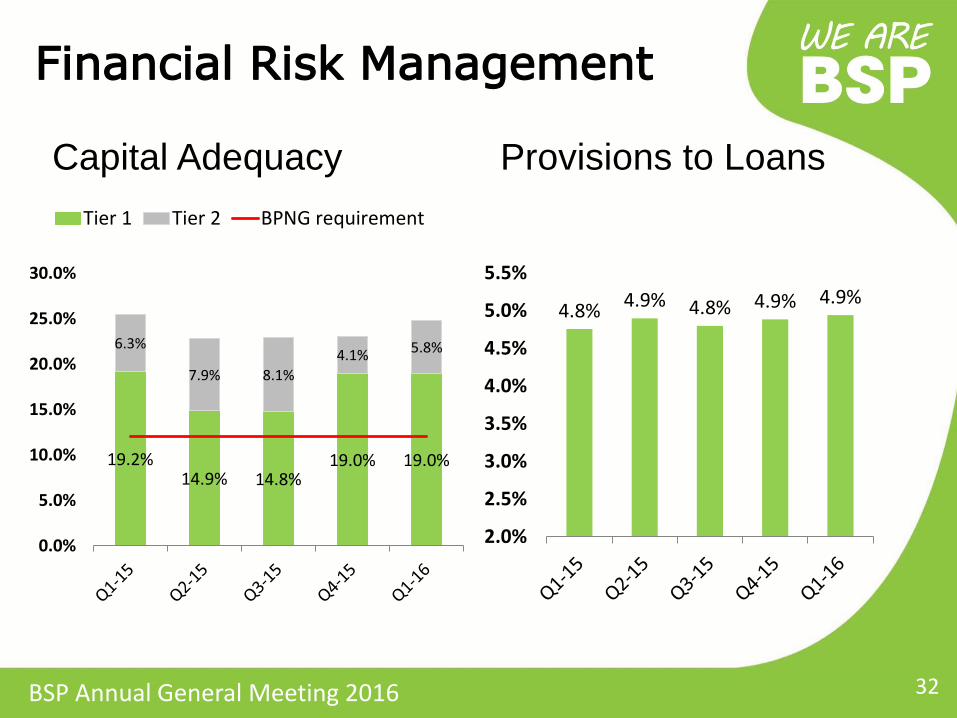
19.2% 14.9% 14.8%
19.0% 19.0%
6.3%
7.9% 8.1% 4.1% 5.8%
0.0%
5.0%
10.0%
15.0%
20.0%
25.0%
30.0%
Tier 1 Tier 2 BPNG requirement
Provisions to Loans Capital Adequacy
Financial Risk Management
32
4.8% 4.9% 4.8% 4.9% 4.9%
2.0%
2.5%
3.0%
3.5%
4.0%
4.5%
5.0%
5.5%
Sub - title of Presentation Slide 1 BSP Annual General Meeting 2016
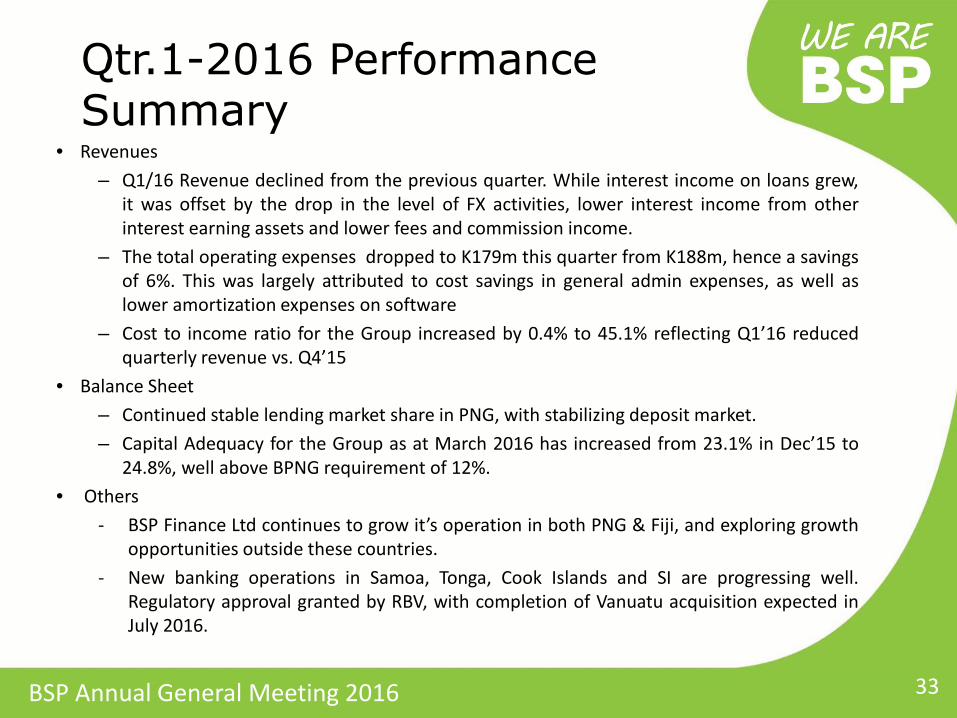
• Revenues – Q1/16 Revenue declined from the previous quarter. While interest income on loans grew,
it was offset by the drop in the level of FX activities, lower interest income from other interest earning assets and lower fees and commission income.
– The total operating expenses dropped to K179m this quarter from K188m, hence a savings of 6%. This was largely attributed to cost savings in general admin expenses, as well as lower amortization expenses on software
– Cost to income ratio for the Group increased by 0.4% to 45.1% reflecting Q1’16 reduced quarterly revenue vs. Q4’15
• Balance Sheet – Continued stable lending market share in PNG, with stabilizing deposit market. – Capital Adequacy for the Group as at March 2016 has increased from 23.1% in Dec’15 to
24.8%, well above BPNG requirement of 12%. • Others
- BSP Finance Ltd continues to grow it’s operation in both PNG & Fiji, and exploring growth opportunities outside these countries.
- New banking operations in Samoa, Tonga, Cook Islands and SI are progressing well. Regulatory approval granted by RBV, with completion of Vanuatu acquisition expected in July 2016.
Qtr.1-2016 Performance Summary
33
Sub - title of Presentation
Slide 1 BSP Annual General Meeting 2016
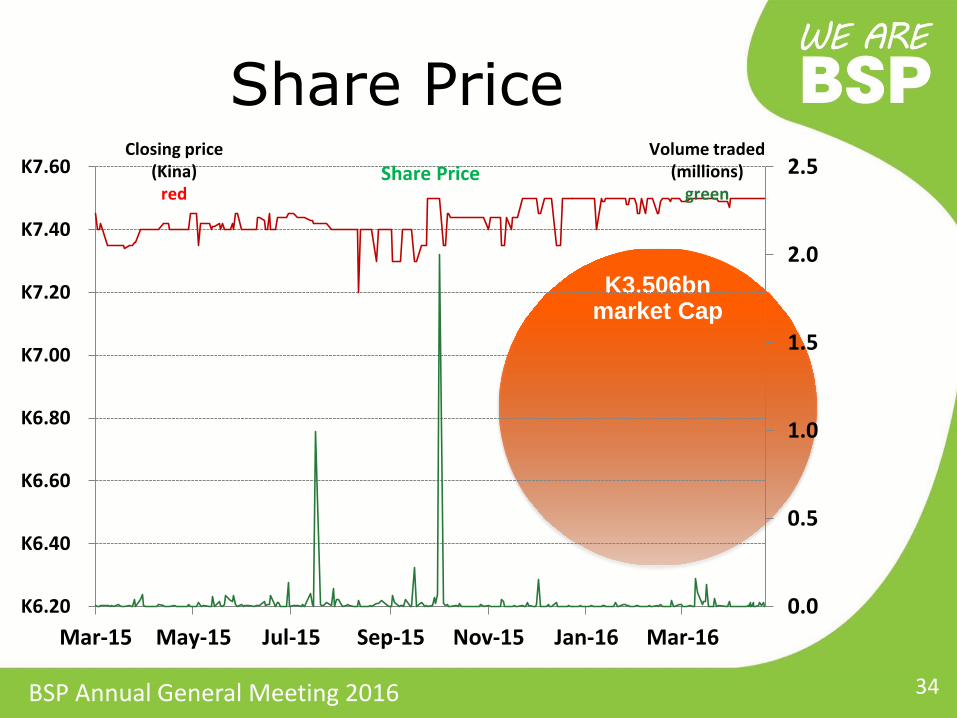
Share Price
K3.506bn market Cap
0.0
0.5
1.0
1.5
2.0
2.5
K6.20
K6.40
K6.60
K6.80
K7.00
K7.20
K7.40
K7.60
Mar-15 May-15 Jul-15 Sep-15 Nov-15 Jan-16 Mar-16
Closing price (Kina)
red
Volume traded (millions)
green Share Price
34
Sub - title of Presentation Slide 1 BSP Annual General Meeting 2016
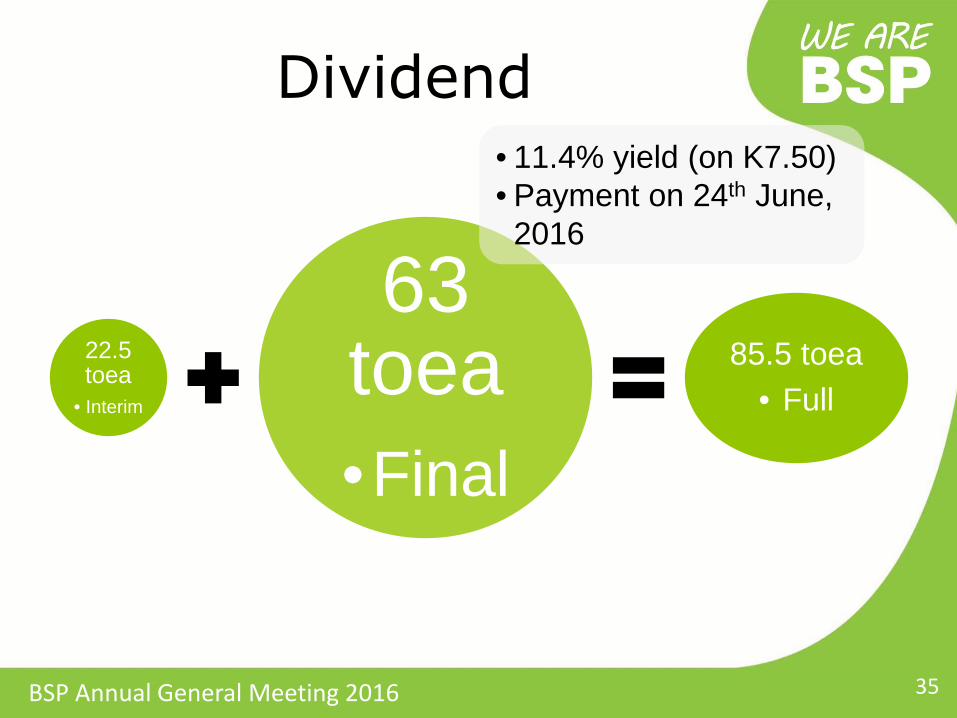
Dividend
22.5 toea
• Interim
63 toea •Final
85.5 toea • Full
• 11.4% yield (on K7.50) • Payment on 24th June,
2016
35
Sub - title of Presentation Slide 1 BSP Annual General Meeting 2016
• 2015 was an outstanding year with better than market performance
• Cost to income ratio of 44.7% reinforces a strong cost focus
• Capital adequacy, loan loss reserves, dividend yield and EPS all market leading
• BSP’s expansion in the South Pacific well executed
• Increasing contribution from non PNG Business
• BSP is a significant contributor to economic growth in PNG and the Pacific
Conclusion
36
Sub - title of Presentation Slide 1 BSP Annual General Meeting 2016
Thank You
37