
Roberts - ASA Nutrient Cycling Symposium Potash
36
Global Potassium Reserves and Potassium Fertilizer Use Terry L. Roberts, President, IPNI Symposium – Global Nutrient Cycling Monday, October 6, 2008 2008 Joint Annual Meeting
-
Upload
muhammad-aamir -
Category
Documents
-
view
219 -
download
0
Transcript of Roberts - ASA Nutrient Cycling Symposium Potash
8/8/2019 Roberts - ASA Nutrient Cycling Symposium Potash
http://slidepdf.com/reader/full/roberts-asa-nutrient-cycling-symposium-potash 1/36
Global Potassium
Reserves and PotassiumFertilizer Use
Terry L. Roberts,President, IPNI
Symposium – Global Nutrient CyclingMonday, October 6, 2008
2008 Joint Annual Meeting
8/8/2019 Roberts - ASA Nutrient Cycling Symposium Potash
http://slidepdf.com/reader/full/roberts-asa-nutrient-cycling-symposium-potash 2/36
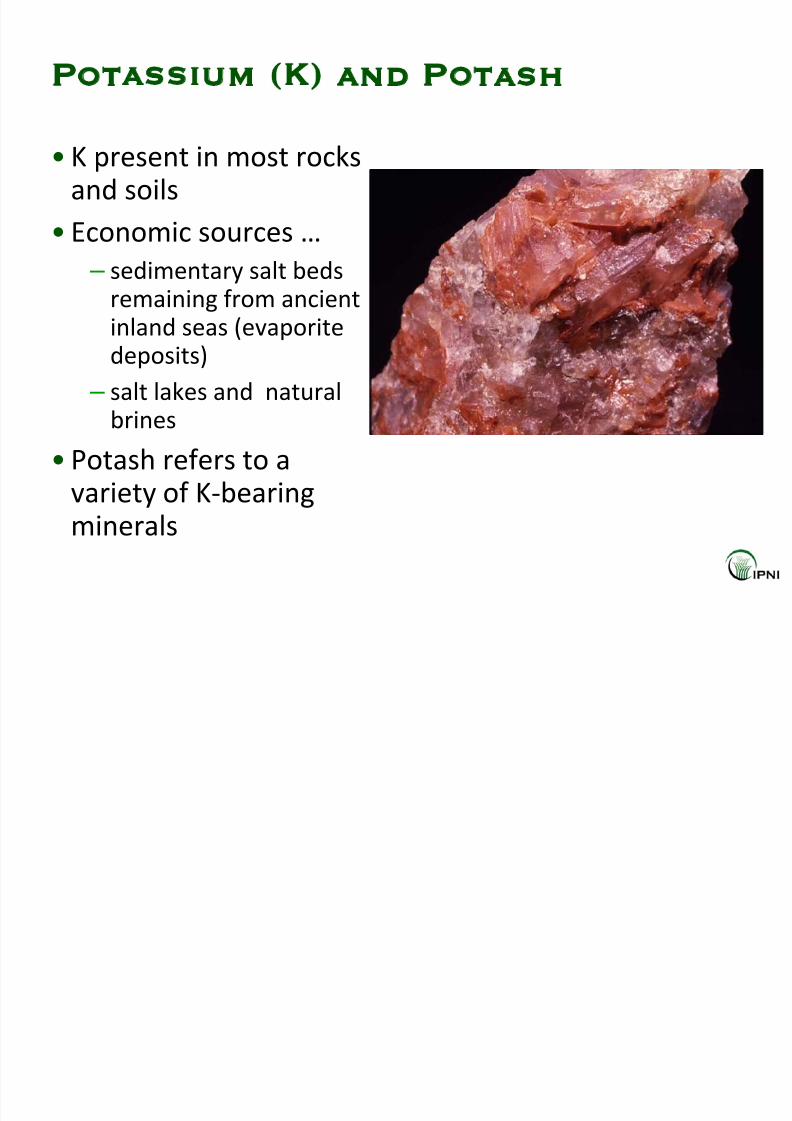
Potassium (K) and Potash
• K present in most rocks
and soils
• Economic sources …
– sedimentary salt beds
remaining
from
ancient
inland seas (evaporite
deposits)
– salt lakes and natural
brines
• Potash refers to a
variety of K‐bearing
minerals
8/8/2019 Roberts - ASA Nutrient Cycling Symposium Potash
http://slidepdf.com/reader/full/roberts-asa-nutrient-cycling-symposium-potash 3/36
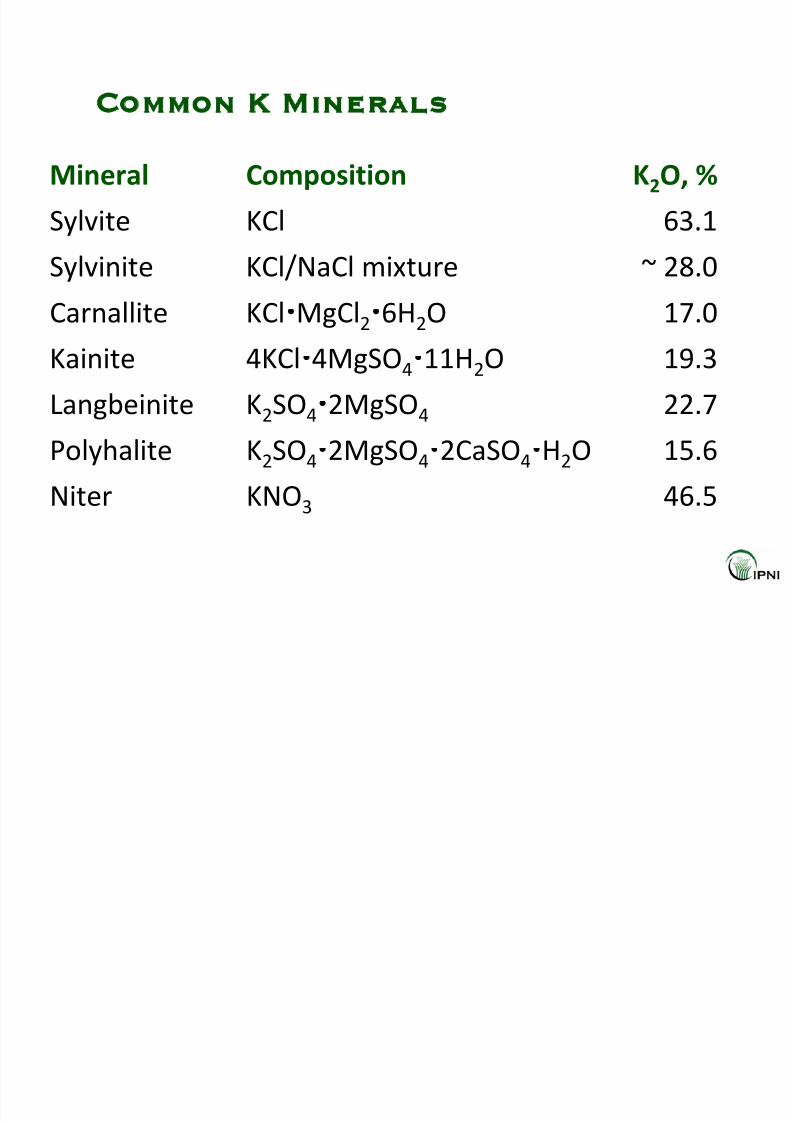
Common K Minerals
Mineral Composition K2O, %Sylvite KCl 63.1
Sylvinite KCl/NaCl mixture ~ 28.0
Carnallite KClMgCl26H2O 17.0Kainite 4KCl4MgSO411H2O 19.3
Langbeinite K2SO4
2MgSO4 22.7Polyhalite K2SO42MgSO42CaSO4H2O 15.6
Niter KNO3 46.5
8/8/2019 Roberts - ASA Nutrient Cycling Symposium Potash
http://slidepdf.com/reader/full/roberts-asa-nutrient-cycling-symposium-potash 4/36
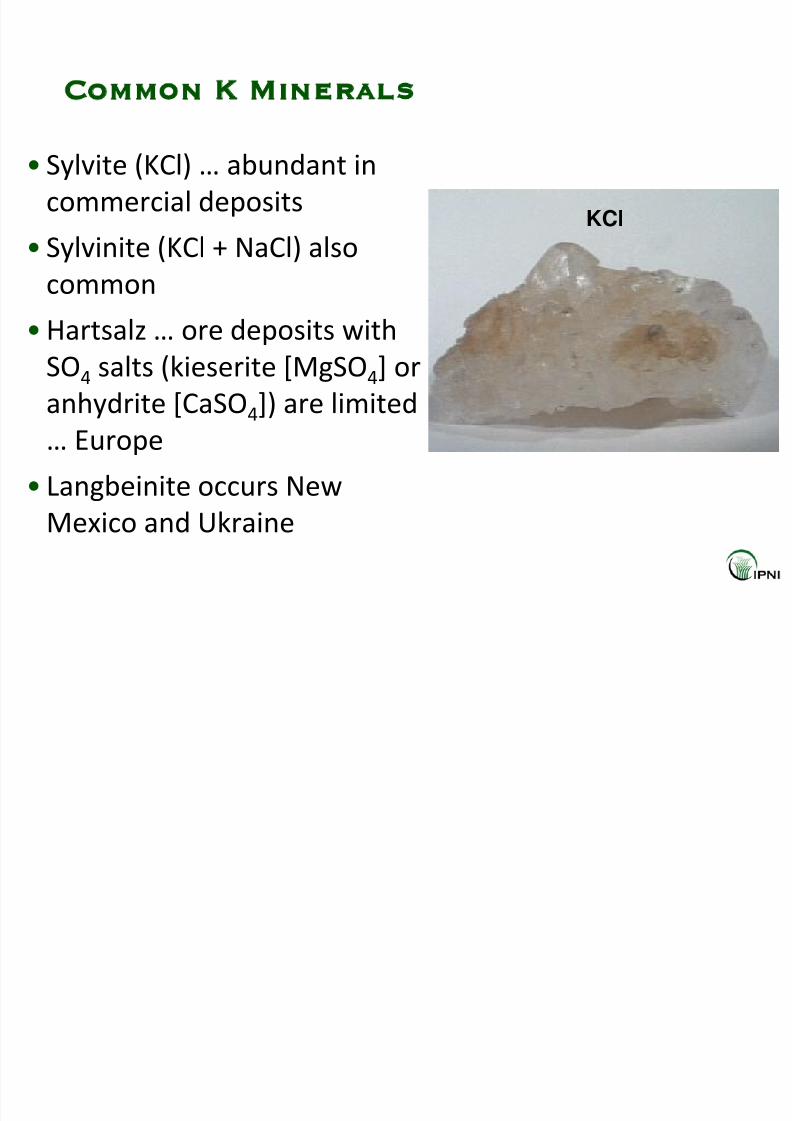
Common K Minerals
• Sylvite (KCl) … abundant in
commercial deposits
• Sylvinite (KCl + NaCl) also
common
• Hartsalz … ore deposits with
SO4 salts (kieserite [MgSO4] or
anhydrite
[CaSO4])
are
limited
… Europe
• Langbeinite occurs New
Mexico and
Ukraine
KCl

8/8/2019 Roberts - ASA Nutrient Cycling Symposium Potash
http://slidepdf.com/reader/full/roberts-asa-nutrient-cycling-symposium-potash 5/36
World Potash Reserves
• About 100
large
buried
deposits + 100 brine
deposits of commercial
potential
• The world has an
estimated 250 billionmetric tons of K2O
resources
Source: U.S. Geological Survey
8/8/2019 Roberts - ASA Nutrient Cycling Symposium Potash
http://slidepdf.com/reader/full/roberts-asa-nutrient-cycling-symposium-potash 6/36
Potash Resources and Reserves
• Resources include proven, probable, and inferred
reserves
– Reserves: deposits
of
sufficient
quantity
and
quality
that
are
currently mined
– Reserve base: reserves + deposits that are marginally
economic or
sub
economic
• U.S. Geological Survey estimates global reserves at 18
billion t K2O
…
8.3
billon
t considered
commercially
exploitable.
Source:
U.S.
Geological
Survey,
Mineral
Commodity
Summaries
and
Potash,
January
2008
8/8/2019 Roberts - ASA Nutrient Cycling Symposium Potash
http://slidepdf.com/reader/full/roberts-asa-nutrient-cycling-symposium-potash 7/36
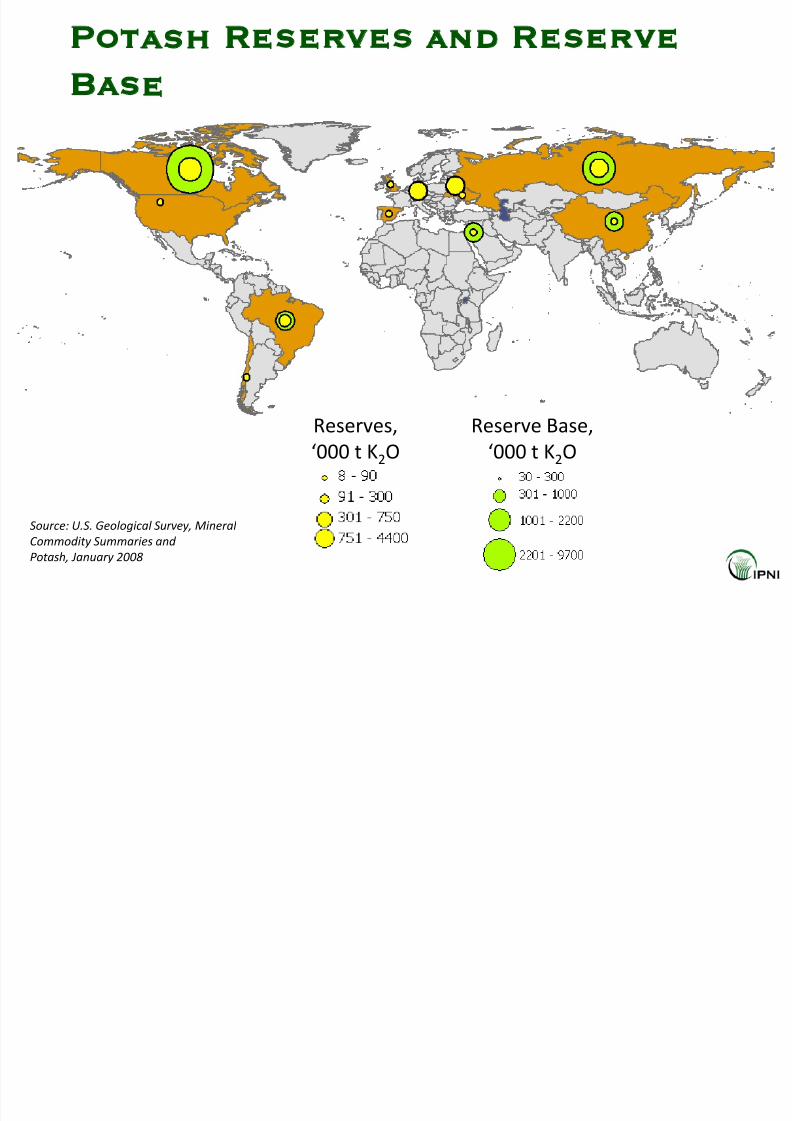
Potash Reserves and Reserve
Base
Reserve Base,
‘000 t K2O
Reserves,
‘000 t K2O
Source: U.S. Geological Survey, Mineral Commodity Summaries and
Potash, January 2008

8/8/2019 Roberts - ASA Nutrient Cycling Symposium Potash
http://slidepdf.com/reader/full/roberts-asa-nutrient-cycling-symposium-potash 8/36
Potash Deposits – North America
• World’s largest reserves
occur in Saskatchewan
• Ore is exceptionally high
grade (25‐30% K2O) at
depths of
950
‐1,100
m
increasing to > 3,500 m
• Uniform thickness (2.4‐3 m)
and mineralization
and
no
structural deformations
• Sylvinite, some
carnallite, and clay
Potash Reserves InSaskatchewan
Source: PPIC 1989

8/8/2019 Roberts - ASA Nutrient Cycling Symposium Potash
http://slidepdf.com/reader/full/roberts-asa-nutrient-cycling-symposium-potash 9/36
Potash Deposits – FSU
• FSU has extensive proven reserves of K minerals … second only
to the deposits in Saskatchewan
• Russia
– Verkhnekamsk
deposit
in
the
Urals
near
Solikamsk – Potash depth at 75 to 450 m in 13 potentially minable beds ranging in
thickness from 26 to 30 m (sylvinite) and 70 to 80 m (zone of sylvinite‐
carnallite).
– Mined beds
1.2
to
6 m
thick
with
15%
K2O
with
3 to
5%
insolubles
• Belarus – Starobinsk deposit is 2nd largest in ore body in FSU
near Soligorsk
– 30 potash
beds
in
4 horizons.
Most
mining
350
to
620
m
depth
in
second horizon (1.8 to 4.4 m thick)
– Sylvinite ore averaging 11% K2O and 5% insolubles
Source: Searls 2002, U.S. Geological Survey, Mineral s Yearbook; Stone, 2002, Canadian Minerals Yearbook
8/8/2019 Roberts - ASA Nutrient Cycling Symposium Potash
http://slidepdf.com/reader/full/roberts-asa-nutrient-cycling-symposium-potash 10/36
Potash Deposits – Western Europe
• Oldest deposits are the Hessen and Thüringen beds
in southern Germany
– contain 15
to
20%
sylvite,
kieserite,
and
carnallite
(~10%
K2O)
– Beds are relatively flat‐lying, but also folding, with some
barren zones,
sudden
thickness
changes,
etc.
making
mining difficult
• Also carnallite and kieserite deposits in central
Germany and
sylvite
and
carnallite
in
northern
Germany
• Sylvite deposits
in
England
and
sylvinite
in
Spain
Source: Searls 2002, U.S. Geological Survey, Mineral s Yearbook;
Stone, 2002, Canadian Minerals Yearbook
8/8/2019 Roberts - ASA Nutrient Cycling Symposium Potash
http://slidepdf.com/reader/full/roberts-asa-nutrient-cycling-symposium-potash 11/36
Potash Deposits
• Middle East:
K extracted
from
Dead
Sea
– contains an estimated 1 billion t KCl
• Latin America
– sylvinite and
carnallite
in
the
Sergipe
basin
in
Brazil
– KNO3 in Chile in Atacama Desert (est. 1 billion t NaNO3 and 100 million
t KNO3) and Salar de Atacama, a high‐attitude dry lake (brine est. at
120 million t KCl and 80 million t K2SO4
• Asia : Carnallite and K‐bearing brines in Qinghai and
Xinjiang Provinces
• Undeveloped Deposits
– Thailand, Argentina, Amazon Basin in
Brazil, Morocco, Poland, and additional deposits in the FSU
Source: U.S. Geological Survey, Mineral Commodity Summaries and
Potash, January 2008

8/8/2019 Roberts - ASA Nutrient Cycling Symposium Potash
http://slidepdf.com/reader/full/roberts-asa-nutrient-cycling-symposium-potash 12/36
Production of KCl and K2SO
4, Mt
Source: IFA Statistics
8/8/2019 Roberts - ASA Nutrient Cycling Symposium Potash
http://slidepdf.com/reader/full/roberts-asa-nutrient-cycling-symposium-potash 13/36
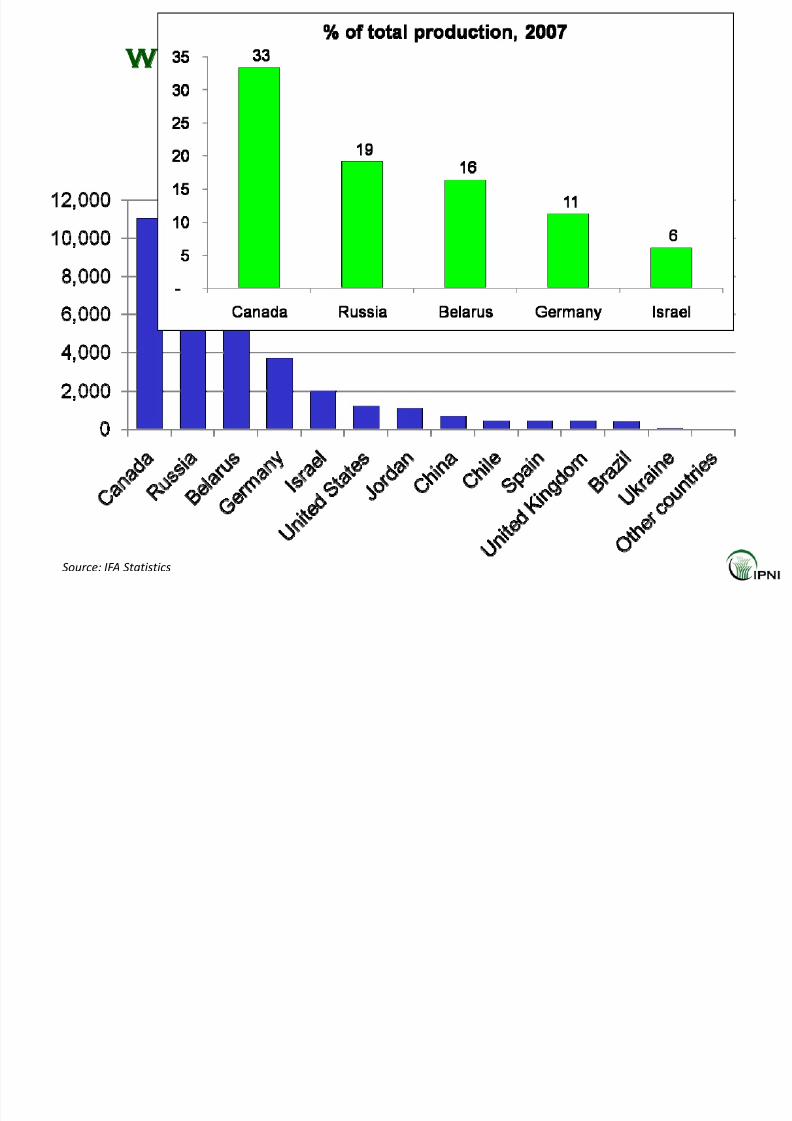
World Mine Production, 2007
‘000 t K2O
Source: IFA Statistics
8/8/2019 Roberts - ASA Nutrient Cycling Symposium Potash
http://slidepdf.com/reader/full/roberts-asa-nutrient-cycling-symposium-potash 14/36
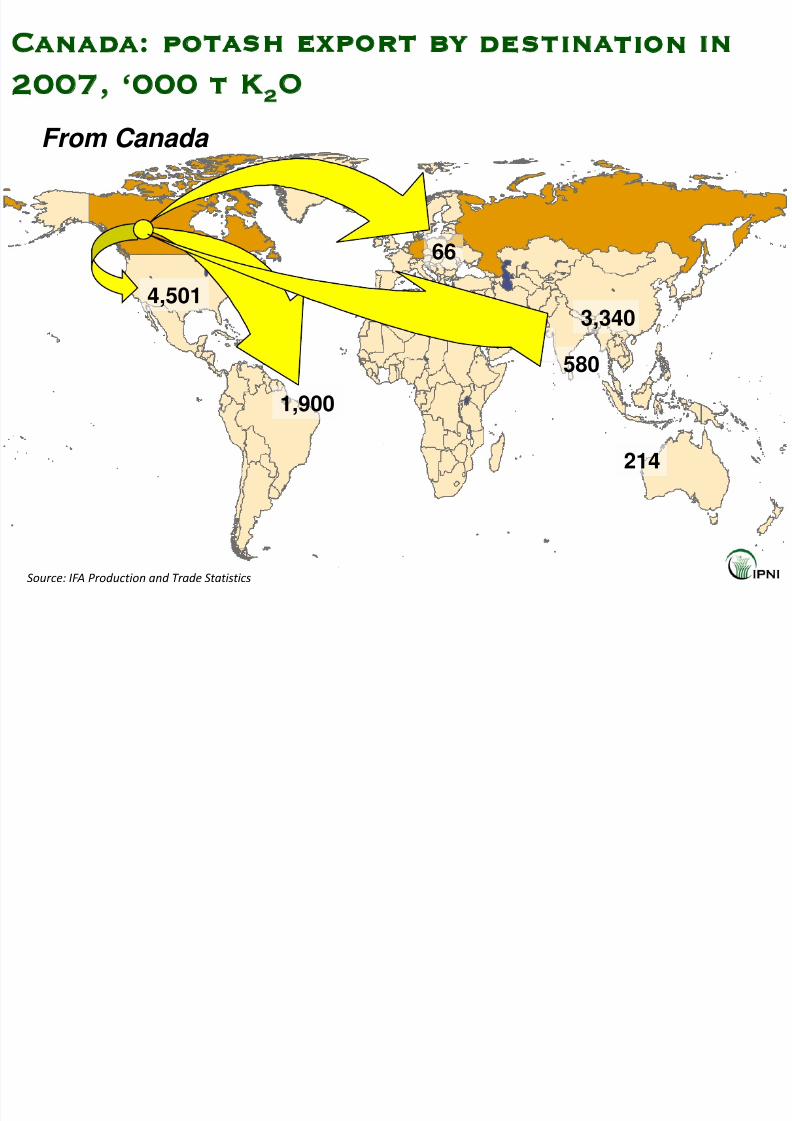
Canada: potash export by destination in
2007, ‘000 t K2
O
4,501
66
From Canada
1,900
3,340
580
214
Source: IFA Production and Trade Statistics

8/8/2019 Roberts - ASA Nutrient Cycling Symposium Potash
http://slidepdf.com/reader/full/roberts-asa-nutrient-cycling-symposium-potash 15/36
Russia: potash export by destination
in 2007, ‘000 t K2O
344
1,961
1,896
From Russia/Belarus
1,059
4,339
Source: IFA Production and Trade Statistics
116
78
8/8/2019 Roberts - ASA Nutrient Cycling Symposium Potash
http://slidepdf.com/reader/full/roberts-asa-nutrient-cycling-symposium-potash 16/36
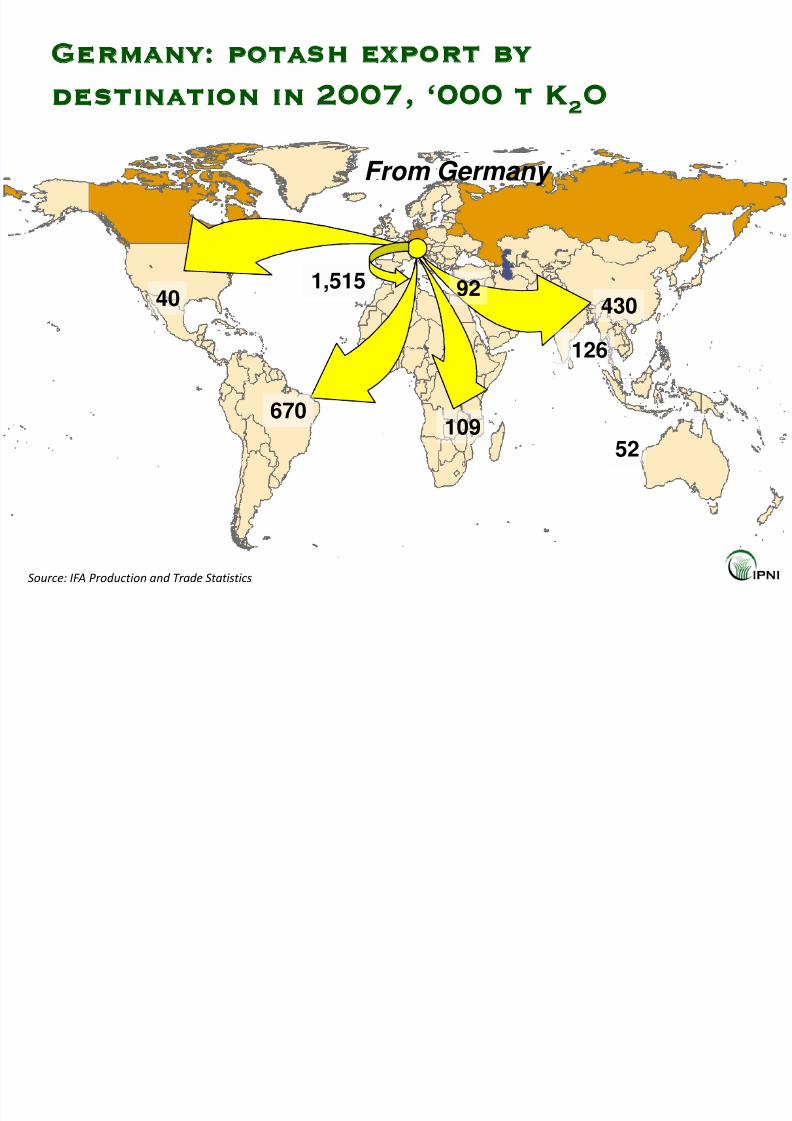
Germany: potash export by
destination in 2007, ‘000 t K2O
670
40
From Germany
109
430
126
52
1,515 92
Source: IFA Production and Trade Statistics
8/8/2019 Roberts - ASA Nutrient Cycling Symposium Potash
http://slidepdf.com/reader/full/roberts-asa-nutrient-cycling-symposium-potash 17/36
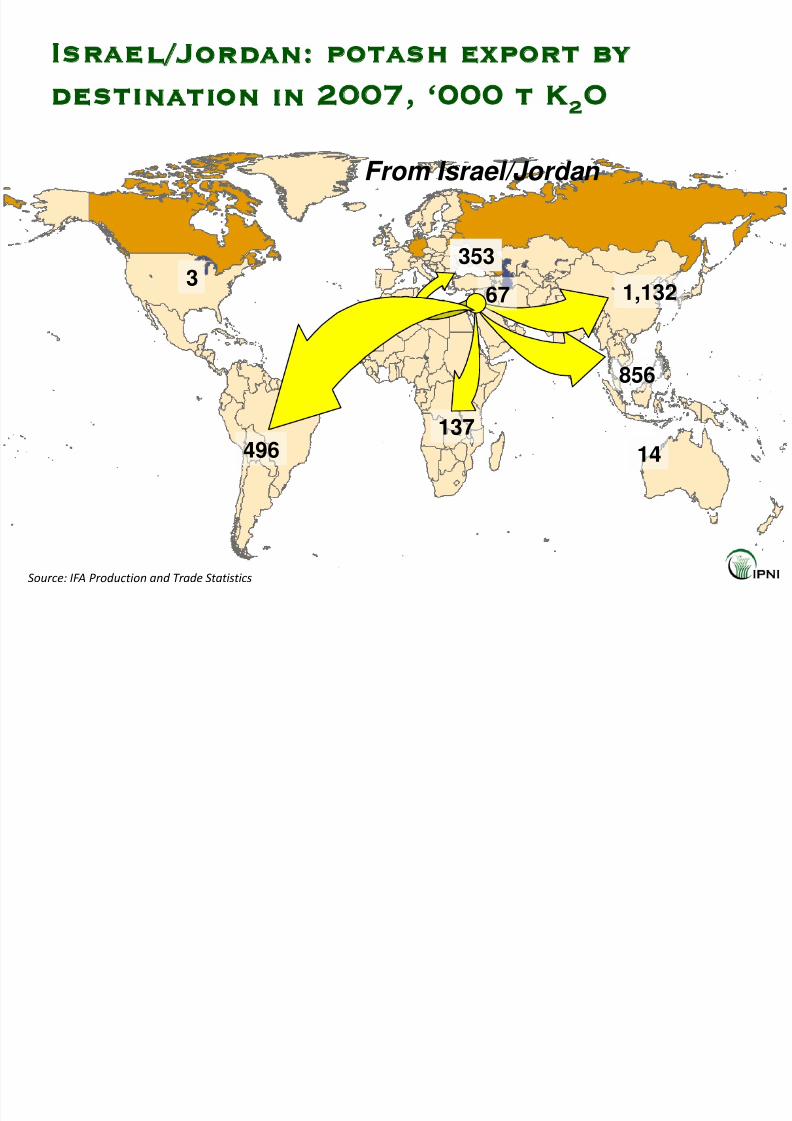
Israel/Jordan: potash export by
destination in 2007, ‘000 t K2O
353
856
From Israel/Jordan
1,132
137
67
14496
3
Source: IFA Production and Trade Statistics
8/8/2019 Roberts - ASA Nutrient Cycling Symposium Potash
http://slidepdf.com/reader/full/roberts-asa-nutrient-cycling-symposium-potash 18/36
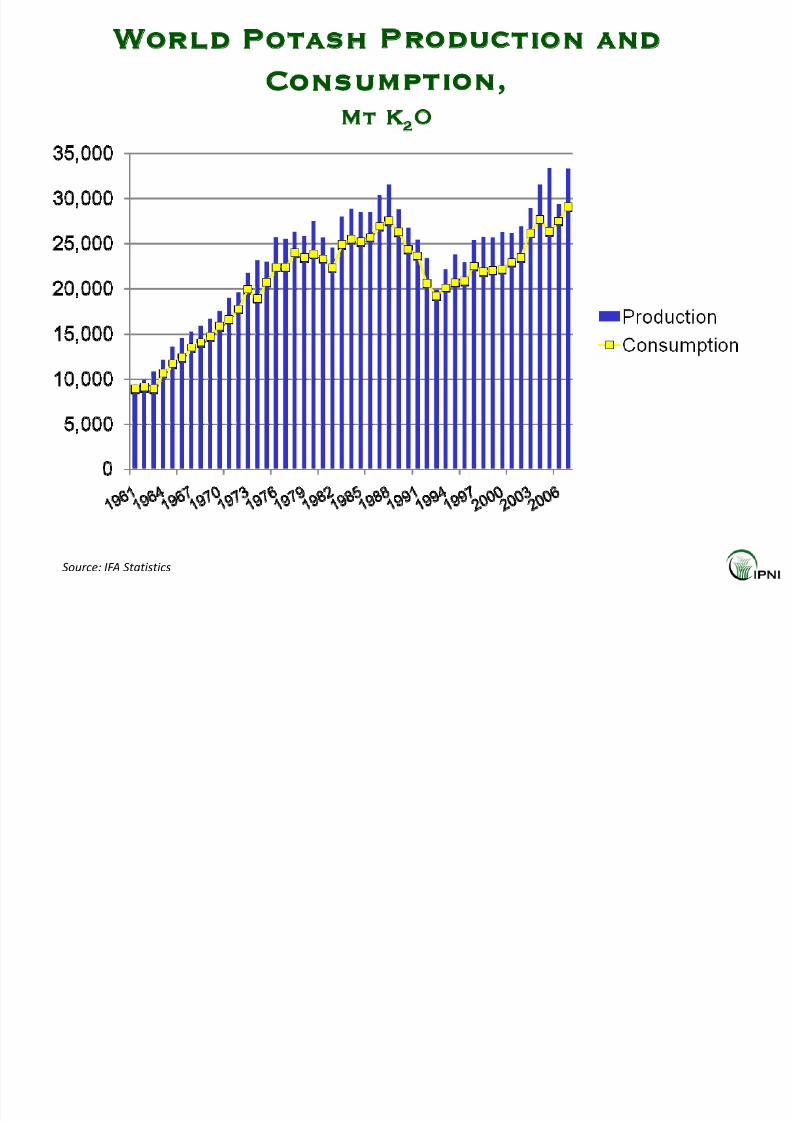
World Potash Production and
Consumption,
Mt K2O
Source: IFA Statistics
8/8/2019 Roberts - ASA Nutrient Cycling Symposium Potash
http://slidepdf.com/reader/full/roberts-asa-nutrient-cycling-symposium-potash 19/36
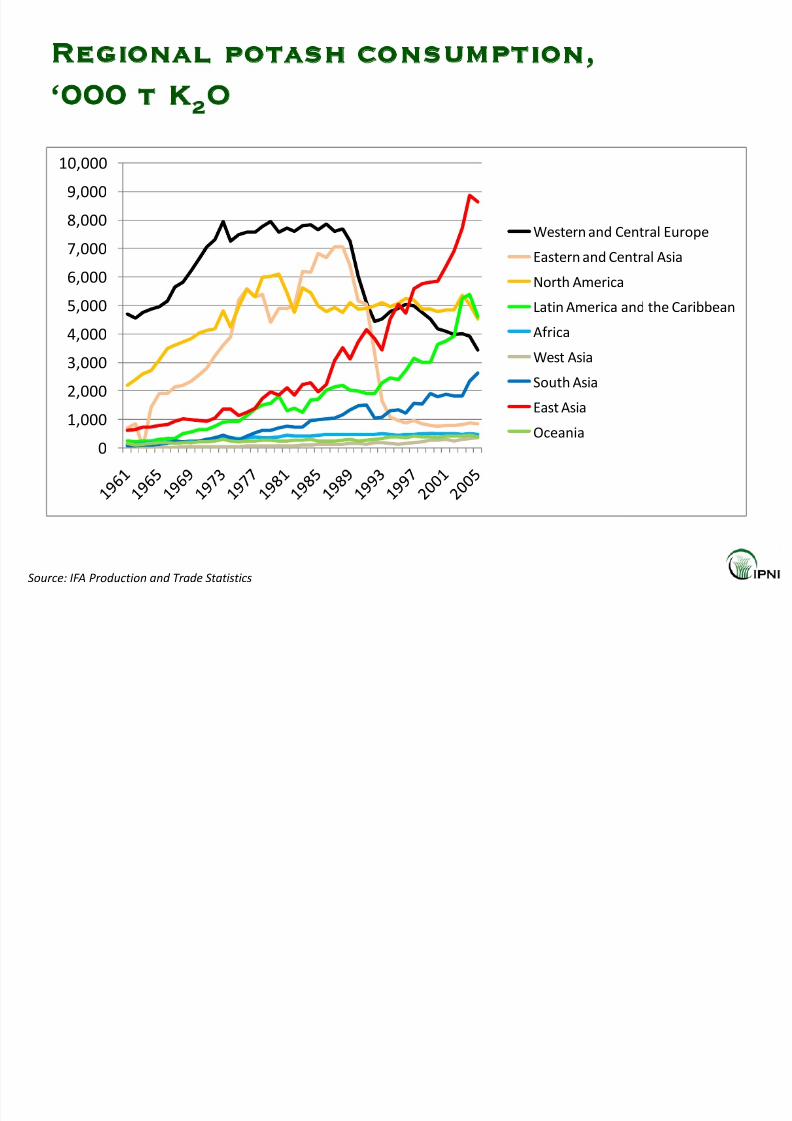
Regional potash consumption,
‘000 t K2O
0
1,000
2,000
3,000
4,0005,000
6,000
7,000
8,000
9,000
10,000
Western and Central EuropeEastern and Central AsiaNorth AmericaLatin
America
and
the
Caribbean
Africa
West AsiaSouth AsiaEast AsiaOceania
Source: IFA Production and Trade Statistics
8/8/2019 Roberts - ASA Nutrient Cycling Symposium Potash
http://slidepdf.com/reader/full/roberts-asa-nutrient-cycling-symposium-potash 20/36
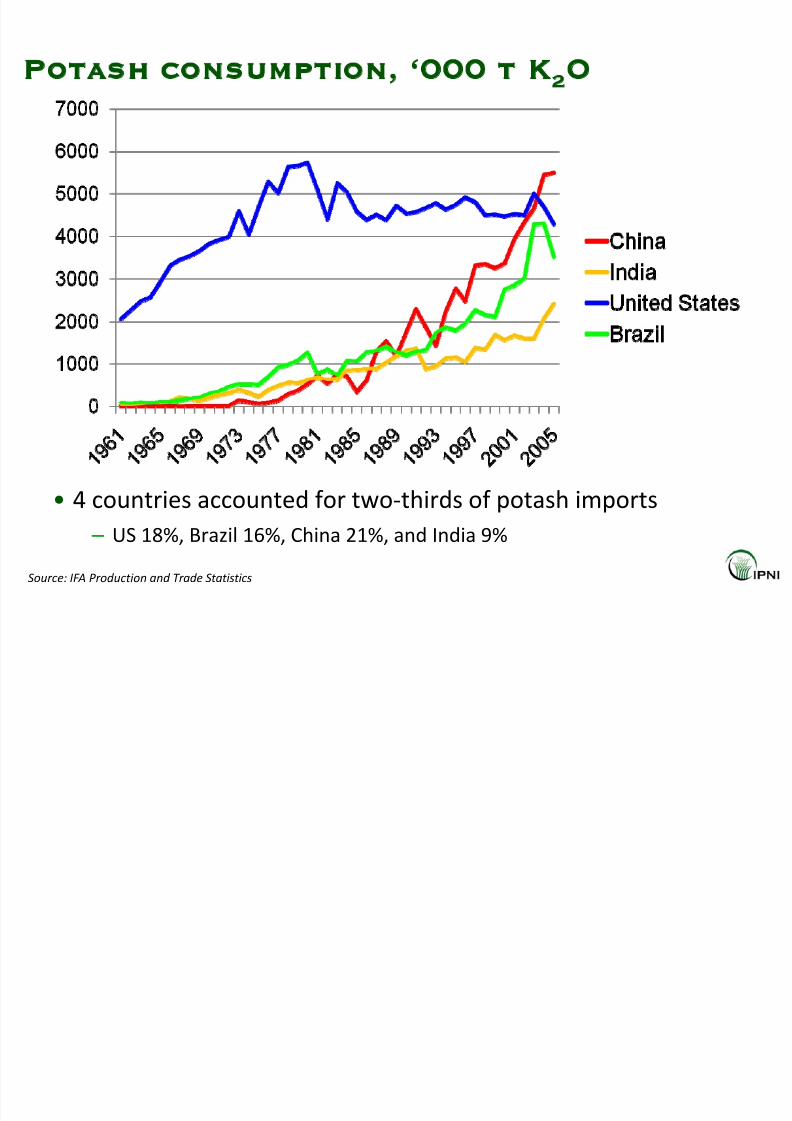
Potash consumption, ‘000 t K2O
• 4 countries accounted for two‐thirds of potash imports
– US 18%, Brazil 16%, China 21%, and India 9%
Source: IFA Production and Trade Statistics

8/8/2019 Roberts - ASA Nutrient Cycling Symposium Potash
http://slidepdf.com/reader/full/roberts-asa-nutrient-cycling-symposium-potash 21/36
Global Fertilizer Consumption
Forecasts
to 2012/13 (Mt nutrients)
N P2O5 K2O Total
Ave. 2005/06
to 2007/08 (e)95.5 38.6 27.6 162.1
2012/13 (f) 115.6 45.7 33.0 194.3
Ave. Annual
Change
+3.2% +2.8% +3.0% +3.1%
Source: P.
Heffer,
2008.
Medium
‐Term
Outlook
for
World
Agriculture
and
Fertilizer
Demand
2007/08
–
20012/13. IFA Annual Conference, Vienna, Austria
8/8/2019 Roberts - ASA Nutrient Cycling Symposium Potash
http://slidepdf.com/reader/full/roberts-asa-nutrient-cycling-symposium-potash 22/36
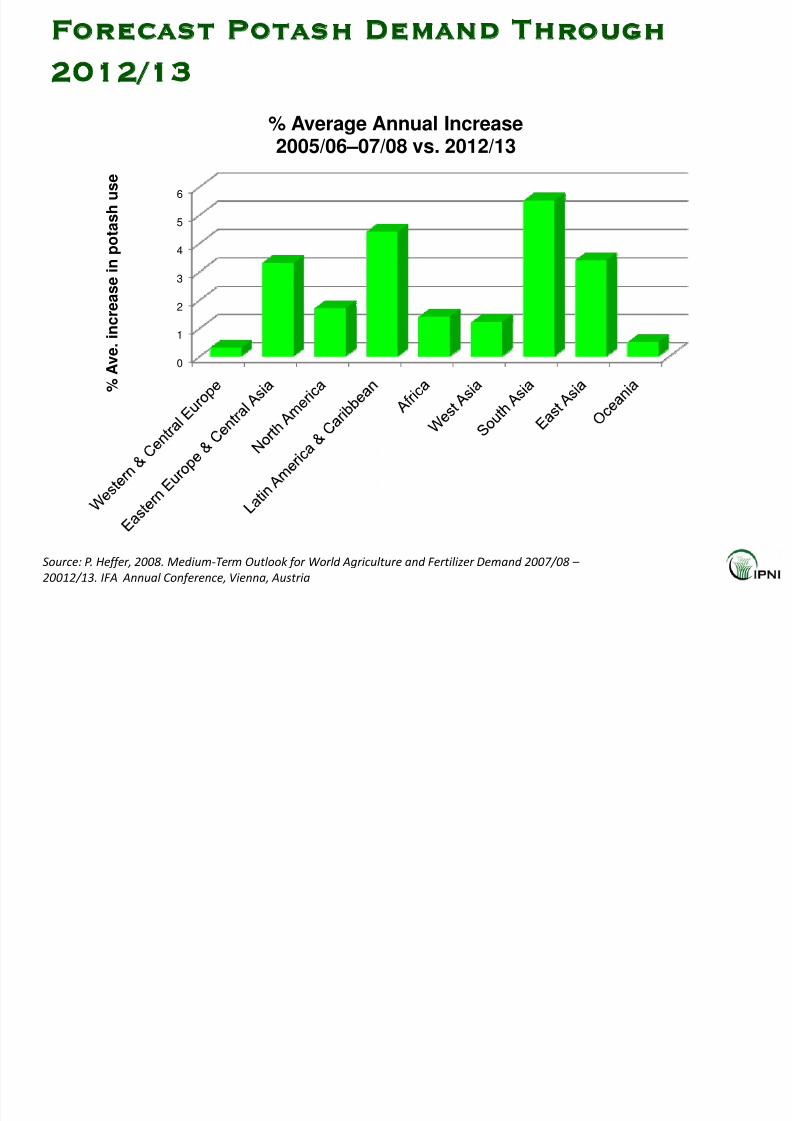
Forecast Potash Demand Through
2012/13
0
1
2
3
4
5
6
% A v e . i n c r e a s e i n p o t a s h
u s e
% Average Annual Increase2005/06–07/08 vs. 2012/13
Source: P. Heffer, 2008. Medium‐Term Outlook for World Agriculture and Fertilizer Demand 2007/08 –
20012/13. IFA Annual Conference, Vienna, Austria

8/8/2019 Roberts - ASA Nutrient Cycling Symposium Potash
http://slidepdf.com/reader/full/roberts-asa-nutrient-cycling-symposium-potash 23/36
World potash supply/demand balance
15,000
18,000
21,000
24,000
27,000
30,000
33,000
36,000
39,000
42,000
45,000
2001 2002 2003 2004 2005 2006 2007 2008 2009 2010 2011 2012
‘ 0 0
0 t K 2 O
Supply of potash
Source: Prud’homme 2008. Global Fertilizers and Raw Materials Supply and Supply/Demand
Balances 2008‐2012.IFA Production and Trade

8/8/2019 Roberts - ASA Nutrient Cycling Symposium Potash
http://slidepdf.com/reader/full/roberts-asa-nutrient-cycling-symposium-potash 24/36
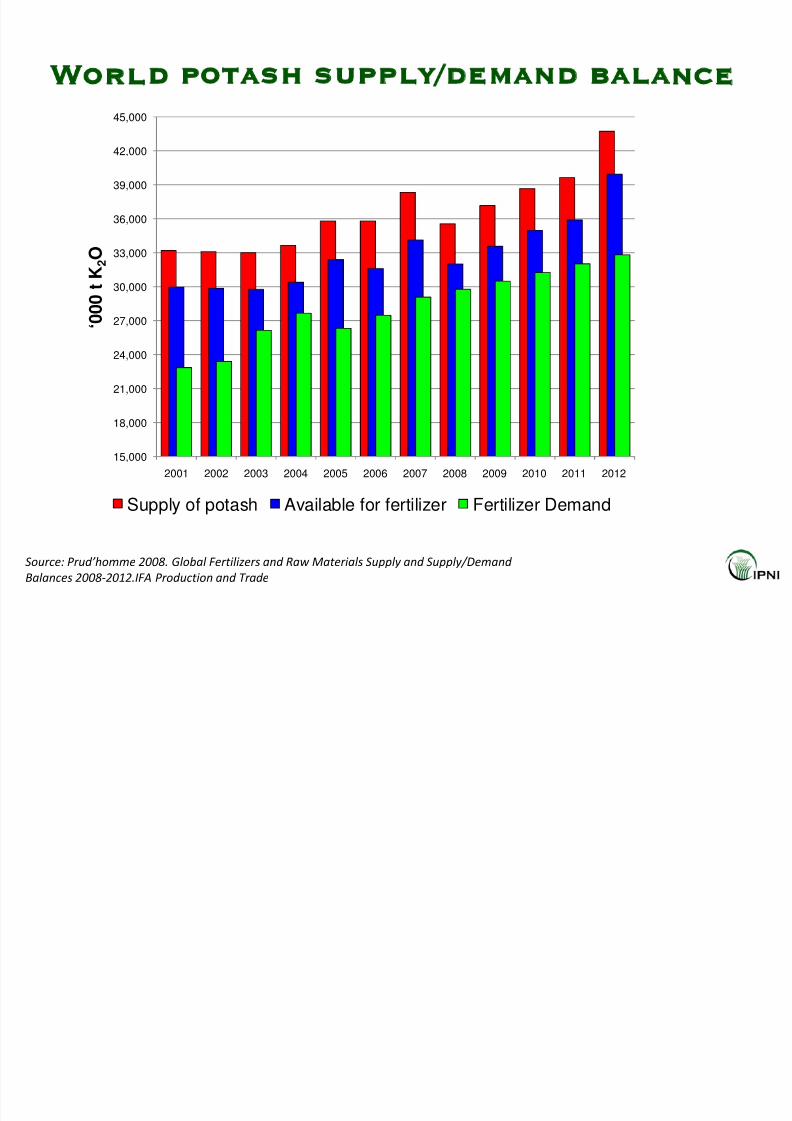
World potash supply/demand balance
15,000
18,000
21,000
24,000
27,000
30,000
33,000
36,000
39,000
42,000
45,000
2001 2002 2003 2004 2005 2006 2007 2008 2009 2010 2011 2012
‘ 0 0 0 t K 2 O
Supply of potash Available for fertilizer
Source: Prud’homme 2008. Global Fertilizers and Raw Materials Supply and Supply/Demand
Balances 2008‐2012.IFA Production and Trade
8/8/2019 Roberts - ASA Nutrient Cycling Symposium Potash
http://slidepdf.com/reader/full/roberts-asa-nutrient-cycling-symposium-potash 25/36
World potash supply/demand balance
15,000
18,000
21,000
24,000
27,000
30,000
33,000
36,000
39,000
42,000
45,000
2001 2002 2003 2004 2005 2006 2007 2008 2009 2010 2011 2012
‘ 0 0
0 t K 2 O
Supply of potash Available for fertilizer Fertilizer Demand
Source: Prud’homme 2008. Global Fertilizers and Raw Materials Supply and Supply/Demand
Balances 2008‐2012.IFA Production and Trade
8/8/2019 Roberts - ASA Nutrient Cycling Symposium Potash
http://slidepdf.com/reader/full/roberts-asa-nutrient-cycling-symposium-potash 26/36
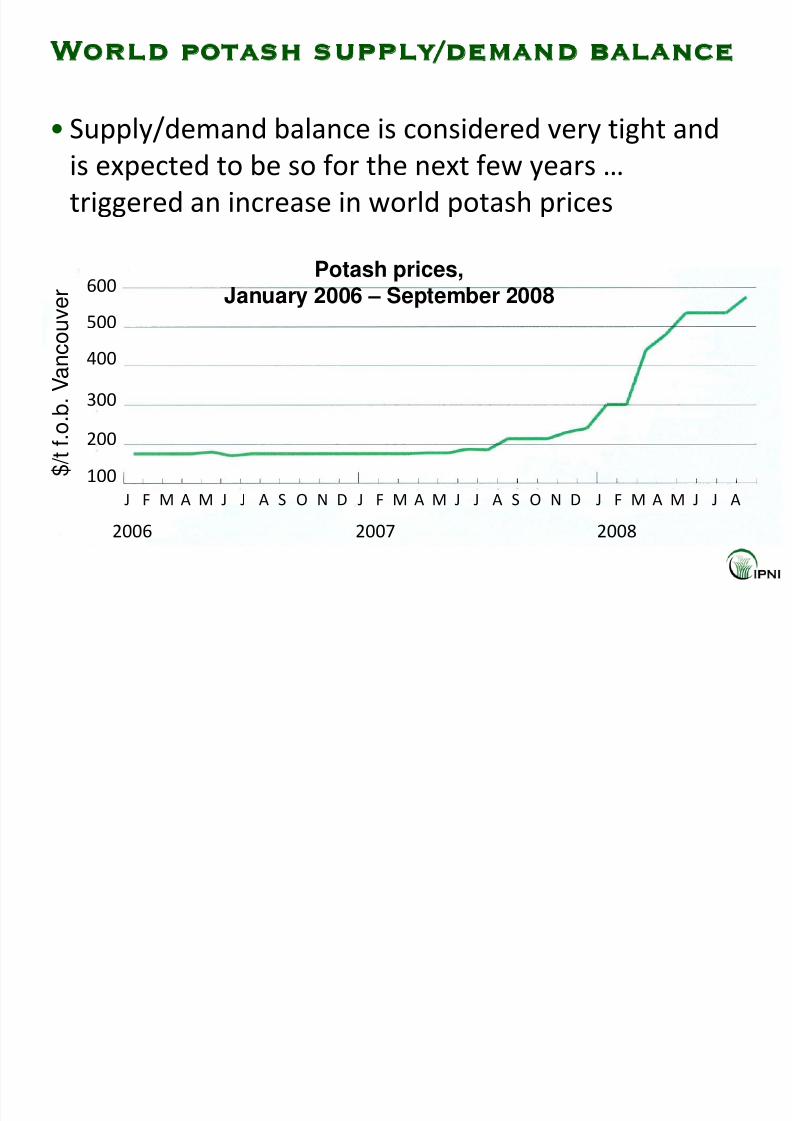
World potash supply/demand balance
• Supply/demand balance is considered very tight and
is expected to be so for the next few years …
triggered an
increase
in
world
potash
prices
100
600
500
400
300
200
2006 2007 2008
J F M MA JJ S O N DA J F M MA JJ S O N DA J F M MA JJ A
$ / t f . o . b .
V a n c o u v
e r
Potash prices,January 2006 – September 2008
8/8/2019 Roberts - ASA Nutrient Cycling Symposium Potash
http://slidepdf.com/reader/full/roberts-asa-nutrient-cycling-symposium-potash 27/36
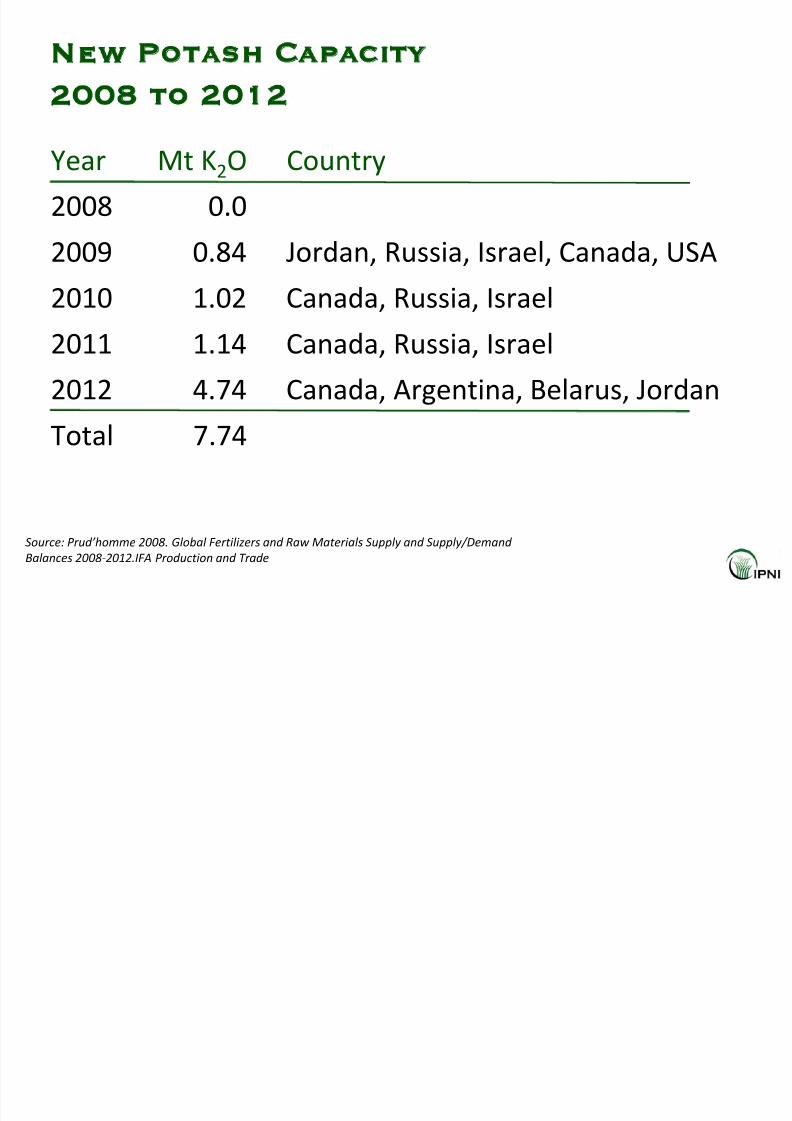
New Potash Capacity
2008 to 2012
Year Mt K2O Country
2008 0.02009 0.84 Jordan, Russia, Israel, Canada, USA
2010 1.02 Canada, Russia, Israel
2011 1.14 Canada, Russia, Israel
2012 4.74 Canada, Argentina, Belarus, Jordan
Total 7.74
Source: Prud’homme 2008. Global Fertilizers and Raw Materials Supply and Supply/Demand
Balances 2008‐2012.IFA Production and Trade
8/8/2019 Roberts - ASA Nutrient Cycling Symposium Potash
http://slidepdf.com/reader/full/roberts-asa-nutrient-cycling-symposium-potash 28/36
Tight supply/demand balance … new
interest in potash mining
• Saskatchewan is the world’s largest producer with
37%
of
supply
and
>
50%
of
global
potash
reserves – No potash exploration permits issued 15 years prior to
2004 … next 3 years the area under lease increased from
250,000
to
3
million
hectares – New companies … BHP Bilton, Potash One Inc., Potash
North Resource Corp., Athabasca Potash, Ivany Potash,
Sidon International Resources, Grizzly Diamonds Ltd., Alix
Resources Corp., Geo Minerals Ltd., and JSC Acron
• Estimated capital cost for a conventional mine … $2.8
billion,
excluding
infrastructure
outside
the
plant
gate
and with no production for 5‐7 years.
8/8/2019 Roberts - ASA Nutrient Cycling Symposium Potash
http://slidepdf.com/reader/full/roberts-asa-nutrient-cycling-symposium-potash 29/36
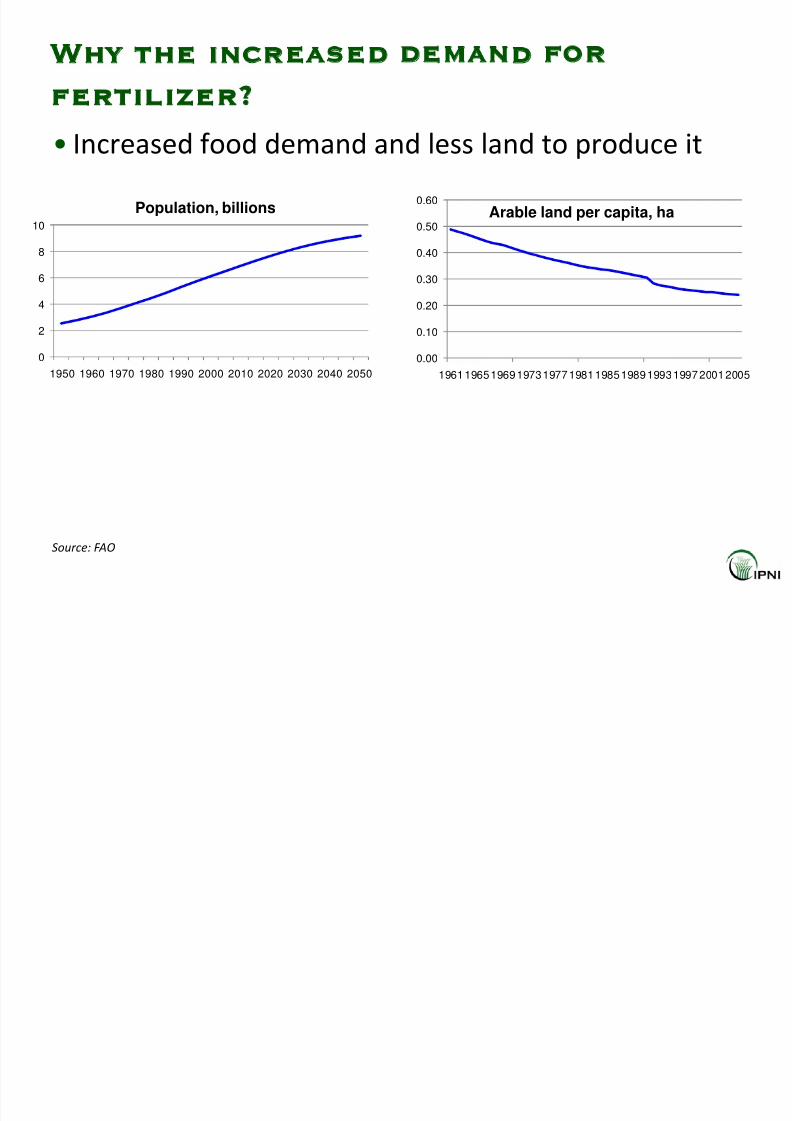
Why the increased demand for
fertilizer?• Increased food demand and less land to produce it
0
2
4
6
8
10
1950 1960 1970 1980 1990 2000 2010 2020 2030 2040 2050
Population, billions
0.00
0.10
0.20
0.30
0.40
0.50
0.60
196119651969197319771981198519891993199720012005
Arable land per capita, ha
Source: FAO
8/8/2019 Roberts - ASA Nutrient Cycling Symposium Potash
http://slidepdf.com/reader/full/roberts-asa-nutrient-cycling-symposium-potash 30/36
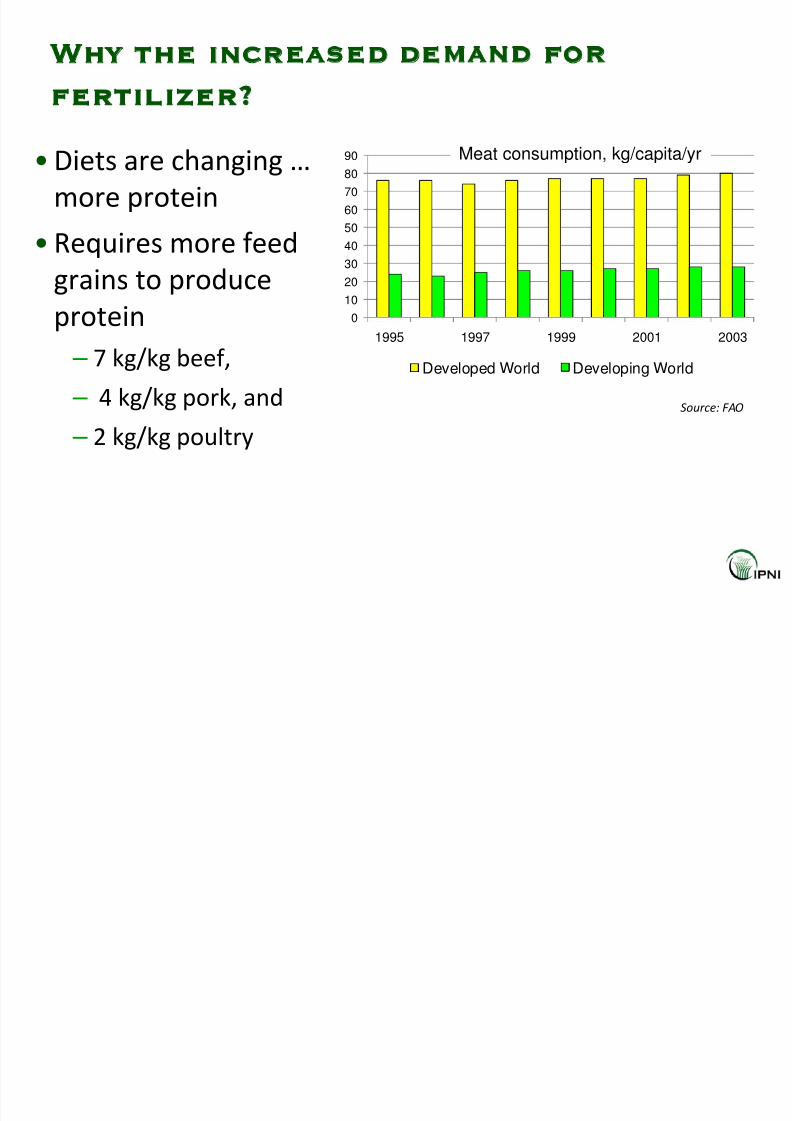
Why the increased demand for
fertilizer?
• Diets are changing …
more
protein• Requires more feed
grains to produce
protein – 7 kg/kg beef,
– 4 kg/kg pork, and
– 2 kg/kg poultry
0
10
20
30
40
5060
70
80
90
1995 1997 1999 2001 2003
Developed World Developing World
Source: FAO
Meat consumption, kg/capita/yr
8/8/2019 Roberts - ASA Nutrient Cycling Symposium Potash
http://slidepdf.com/reader/full/roberts-asa-nutrient-cycling-symposium-potash 31/36
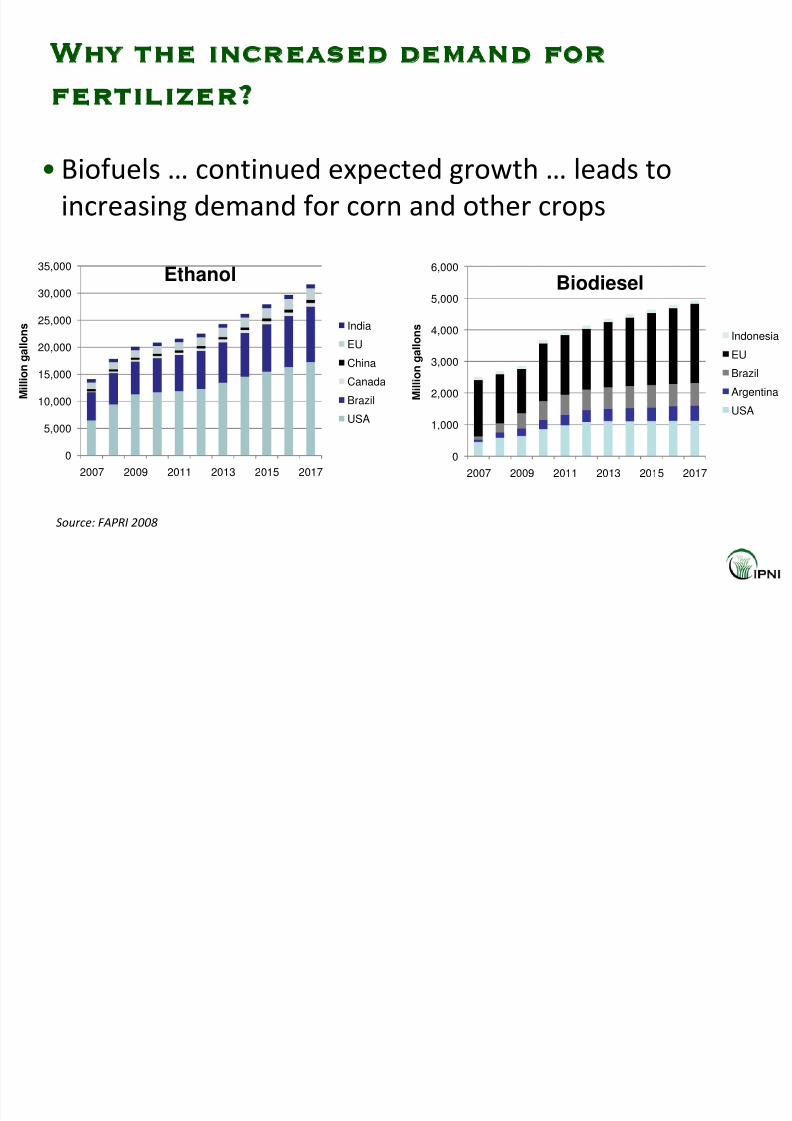
Why the increased demand for
fertilizer?
• Biofuels … continued expected growth … leads to
increasing demand
for
corn
and
other
crops
0
5,000
10,000
15,000
20,000
25,000
30,000
35,000
2007 2009 2011 2013 2015 2017
M i l l i o n g a l l o n s
Ethanol
India
EU
China
Canada
Brazil
USA
0
1,000
2,000
3,000
4,000
5,000
6,000
2007 2009 2011 2013 2015 2017
M i l l i o n g a l l o n s
Biodiesel
Indonesia
EU
Brazil
Argentina
USA
Source: FAPRI
2008
8/8/2019 Roberts - ASA Nutrient Cycling Symposium Potash
http://slidepdf.com/reader/full/roberts-asa-nutrient-cycling-symposium-potash 32/36
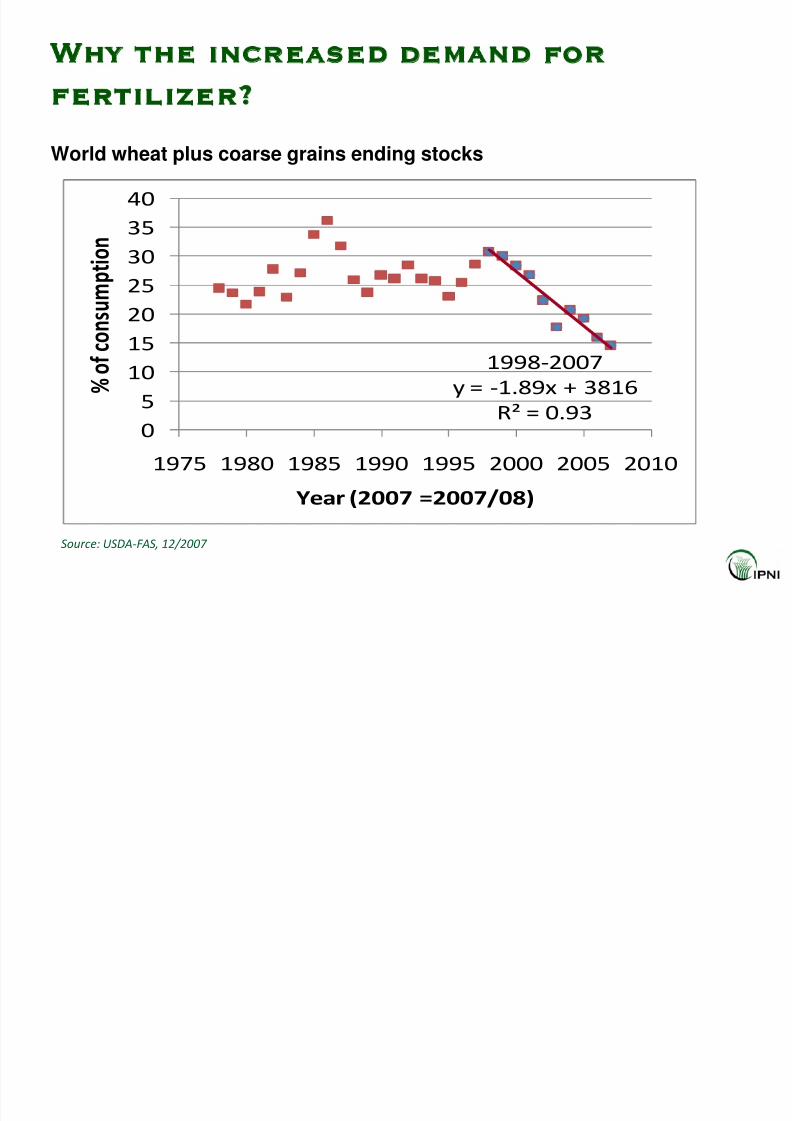
Why the increased demand for
fertilizer?
1998‐2007
y = ‐1.89x + 3816
R²
=
0.930
5
10
1520
25
30
35
40
1975 1980 1985 1990 1995 2000 2005 2010
% o f c o n s u m p t i o n
Year (2007 =2007/08)
World wheat plus coarse grains ending stocks
Source: USDA‐FAS, 12/2007
8/8/2019 Roberts - ASA Nutrient Cycling Symposium Potash
http://slidepdf.com/reader/full/roberts-asa-nutrient-cycling-symposium-potash 33/36
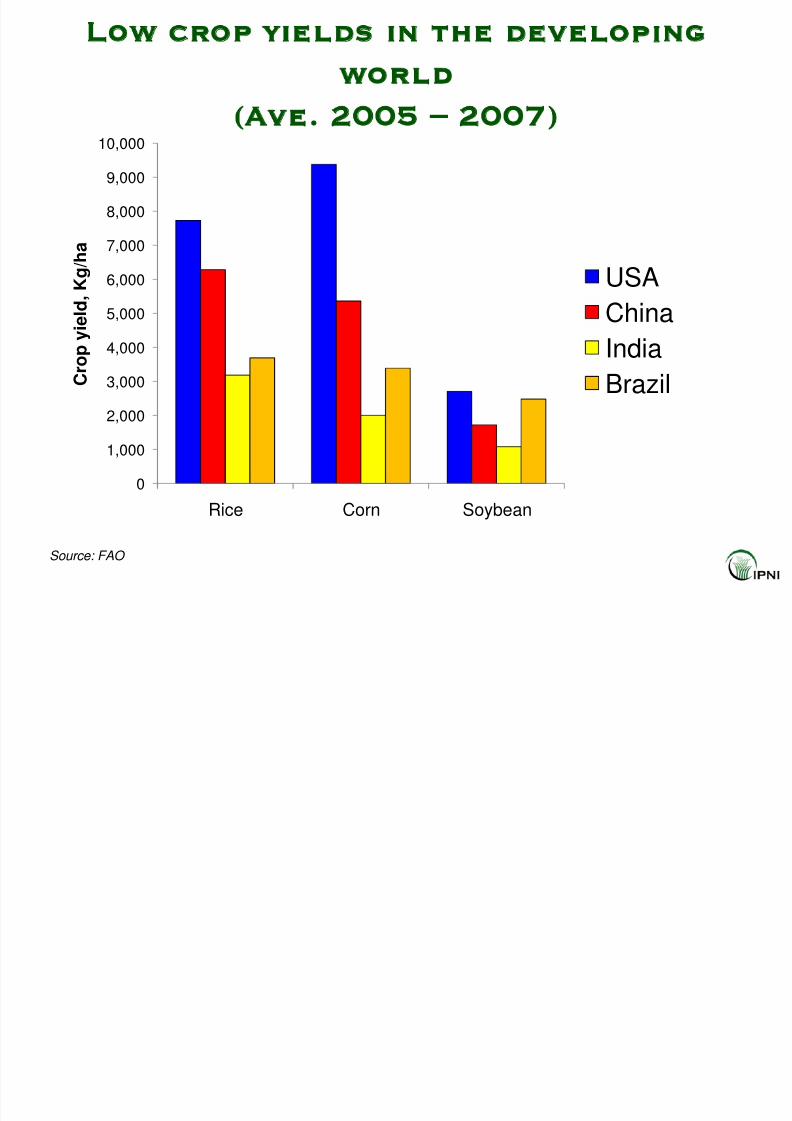
Low crop yields in the developing
world
(Ave. 2005 – 2007)
0
1,000
2,000
3,000
4,000
5,000
6,000
7,000
8,000
9,000
10,000
Rice Corn Soybean
C r o p y i e l d , K g / h a
USA
ChinaIndia
Brazil
Source: FAO
8/8/2019 Roberts - ASA Nutrient Cycling Symposium Potash
http://slidepdf.com/reader/full/roberts-asa-nutrient-cycling-symposium-potash 34/36
Concluding Remarks
• Global potash supply/balance will remain tight
through
2012 – During this time demand will absorb capacity increases
– Potential surplus … 2.2 and 3.9 Mt K2O, which is considered
marginal given
plant’s
production
configuration
and
ramp
‐up stages
• 2012 … potential capacity should exceed demand

8/8/2019 Roberts - ASA Nutrient Cycling Symposium Potash
http://slidepdf.com/reader/full/roberts-asa-nutrient-cycling-symposium-potash 35/36
Concluding Remarks
• At present levels of production (33 Mt K2O per year)
and
with
current/planned
capacity,
the
industry
can
easily meet future demand
• Reserves (8.3 billion t) are sufficient to supply potash
for 250
years
…
another
250+
considering
the
reserve
base (18 billion t)
• Allowing for known resources (250 billion t) … there is
sufficient potash to meet demand for thousands of years
8/8/2019 Roberts - ASA Nutrient Cycling Symposium Potash
http://slidepdf.com/reader/full/roberts-asa-nutrient-cycling-symposium-potash 36/36
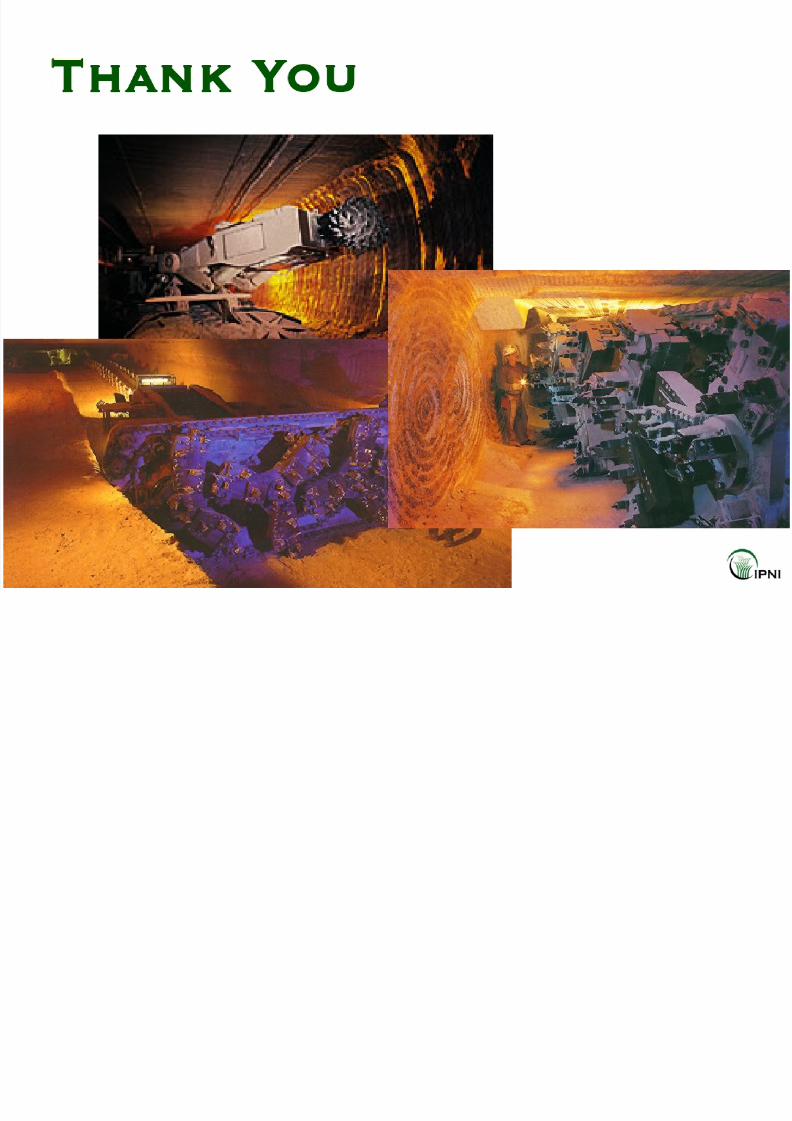
Thank You