Robert S. Laramee [email protected] 1 Visualization: An Introduction and Applications Robert...
33
1 Visualization: An Introduction and Applications Robert S. Laramee [email protected] Visualization: An Introduction and Applications Robert S. Laramee Department of Computer Science Swansea University
-
Upload
jeffry-ferguson -
Category
Documents
-
view
217 -
download
0
Transcript of Robert S. Laramee [email protected] 1 Visualization: An Introduction and Applications Robert...

1 Visualization: An Introduction and Applications
Robert S. [email protected]
Visualization:An Introduction and
Applications
Robert S. Laramee
Department of Computer Science
Swansea University
2 Visualization: An Introduction and Applications
Robert S. [email protected]
Overview Introduction Visualization Volume Visualization (+Application) Flow Visualization (+Application)
Information Visualization (+Application)
Conclusions

3 Visualization: An Introduction and Applications
Robert S. [email protected]
Introduction: Who is Bob? July 2006: Joined Computer Science Dept at Swansea University
2001-2006: worked at VRVis Research Center (VRVis.at)–the bridge between academia and industry in Austria
2005: PhD, Computer Science, Vienna University of Technology (TUWien)
2000: Msc., Computer Science, University of New Hampshire, Durham, NH
1997: BSc., Physics, University of Massachusetts (ZooMass), Amherst, MA
Research in Data visualization Software Engineering Human-computer interaction

4 Visualization: An Introduction and Applications
Robert S. [email protected]
Visualization: What is it?
“The purpose of computing is insight, not numbers”
[Richard W. Hamming, 1962]
Visualization: A tool that allows the user to gain insight into data.
To form a mental vision, image, or picture of (something not visible or present to the sight, or of an abstraction); to make visible to the mind or imagination [Oxford English Dictionary, 1989]
The non-fiction version of computer graphics

5 Visualization: An Introduction and Applications
Robert S. [email protected]
Visualization – Background Visualization is very old
Often an intuitive step to make
something clearer, e.g., a graph
Data set sizes are ever-increasing making a graphical approach necessary
Classical (easy) approaches known from business graphics (Excel, etc.)
Visualization = its own scientific discipline since ~1987
First visualization conference: 1990
L. da Vinci (1452-1519)
1997:

6 Visualization: An Introduction and Applications
Robert S. [email protected]
User & Task
What is the problem?
User task/questionsVisualization goals
Examples: surgery planning filter analysis stock market vis.
[Oeltze et al., 2004]
[Shneiderman/Wattenberg, 2001]
[VRVis, 2004]

7 Visualization: An Introduction and Applications
Robert S. [email protected]
Three
examples
Data & Domain Application
domain Data origin Data
organization Data extent Form of data
[TIANI, 2001]
[illustration by Kirby et al., 1999]
[Bischi et al., 2004]

8 Visualization: An Introduction and Applications
Robert S. [email protected]
Typical Visualization TasksVisualization is good for:
exploration find the unknown, unexpected hypothesis generation
analysis confirm or reject hypotheses information drill-down
presentation communicate/disseminate
results
[Seo/Shneiderman 2004]
[Doleisch et al., 2003]
[Bruckner/Gröller
2005]

9 Visualization: An Introduction and Applications
Robert S. [email protected]
Visualization: 3 FociThree main sub-fields:
Volume Visualization
Flow Visualization
Information Visualization
Scientific Visualization
3D
nD
Inherent geometry
Usually no inherent geometry

10 Visualization: An Introduction and Applications
Robert S. [email protected]
From the Data Point of View
Data with inherent location (and time) – “SciVis“ 3D, 3D+time, 2D, etc. scalar, vector, multi-variate, etc. data organization: Cartesian grid, simulation
grid, etc. continuous
Tabular data (lines rows) – “InfoVis“ multi-variate data heterogeneous data (nominal, categorical, etc.) discontinuous (or discrete)

11 Visualization: An Introduction and Applications
Robert S. [email protected]
What is Volume Visualization?Volume Visualization is the depiction of Volume
data Picture/image 3D2D Projection (e.g., MIP), slicing, surface
extraction, volume rendering, … Volume Data =
3D1D Data scalar data, 3D data space, space filling
(dense-as opposed to sparse) User goals:
to gain insight into 3D Data depends strongly on what user is interested in
(focus + context)

12 Visualization: An Introduction and Applications
Robert S. [email protected]
About Volume VisualizationExample a density volume from CT etc.
perceptual challenge (3D→2D) selection (slices) vs. projection
(rendering) feature selection
performance challenge (billions of data items) data structures (grids) utilizing the GPU

13 Visualization: An Introduction and Applications
Robert S. [email protected]
Volume Visualization: An Application
Medical Visualization

14 Visualization: An Introduction and Applications
Robert S. [email protected]
What is Flow Visualization? a classic topic within scientific visualization depiction of vector quantities (as opposed to scalar
quantities) applications include: automotive design, aerodynamics,
astronomy, engineering, fluid mechanics, meteorology, oceanography, medicine, simulation, turbomachinery,
Challenges:
1. to effectively visualize both magnitude + direction often simultaneously
2. large data sets
3. time-dependent data
4. What should be visualized? (data filtering/feature extraction)
15 Visualization: An Introduction and Applications
Robert S. [email protected]
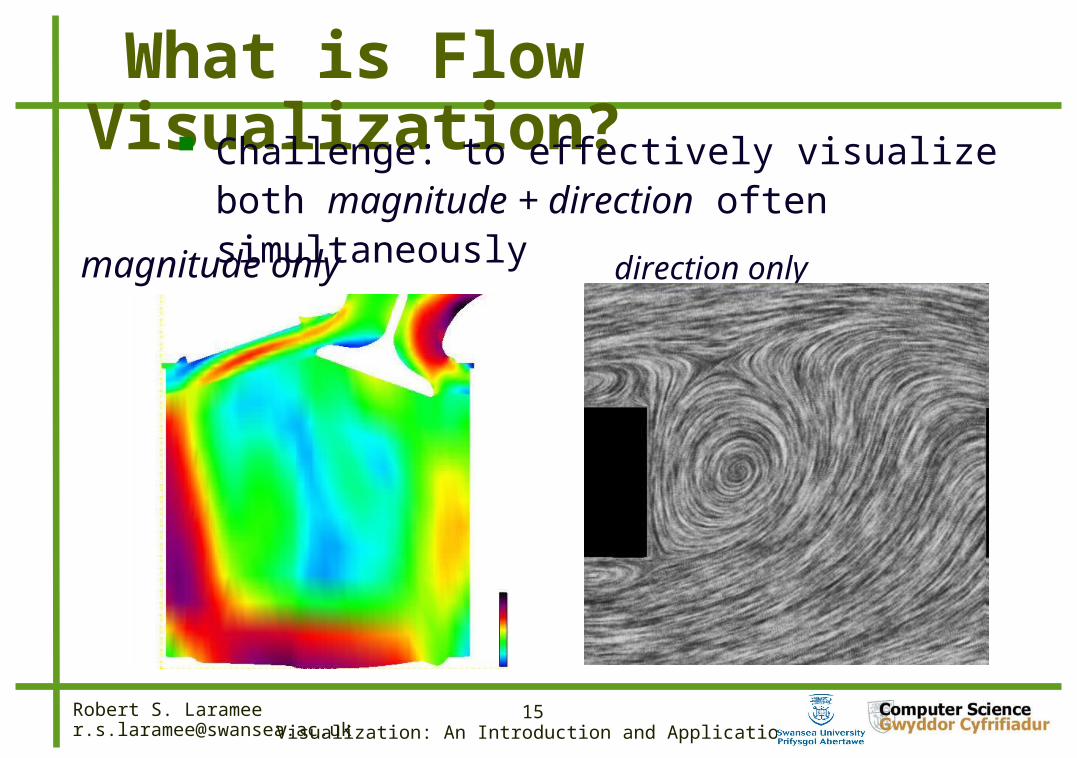
What is Flow Visualization? Challenge: to effectively visualize both
magnitude + direction often simultaneously
magnitude only direction only

16 Visualization: An Introduction and Applications
Robert S. [email protected]
swirl motion: characterized by motion about cylinder-aligned axis
more stable (easier)
tumble motion: characterized by motion about axis orthogonal to cylinder
unstable, more difficult
Flow Visualization: An Application

17 Visualization: An Introduction and Applications
Robert S. [email protected]
Achieving ideal patterns of motion leads to optimal mixing (of air and fuel) conditions e.g., higher exhaust/gas ratio (EGR) decrease in fuel consumption lower emissions
1. Can visualization provide insight into or verify characteristic shape/behavior of flow?
2. What tools help to visualize swirl/tumble motion?
3. Where (in the combustion chamber) are ideal ideal flow pattern not being realized?
Flow Visualization: An Application

18 Visualization: An Introduction and Applications
Robert S. [email protected]
Flow Visualization: An Application

19 Visualization: An Introduction and Applications
Robert S. [email protected]
InfoVis – Categorical Data Vis. Example: set of returned questionaires
(99 questions, most binary or categorical; ≈100.000 lines)
lots of columns
many lines
binary attribute,values just “0” or “1”

20 Visualization: An Introduction and Applications
Robert S. [email protected]
Project: Visualisation of Sensor Data from Animal Movement
Edward GrundyMark W. Jones
Robert S. LarameeRory P. Wilson
Emily L.C. Shepard
Visual Computing Group
Institute of Environmental Sustainability

21 Visualization: An Introduction and Applications
Robert S. [email protected]
Background
...to animals in the wild...
To gather data on:• acceleration,• temperature,• pressure,• etc
Biologists at Swanseahave attached sensors...
21

22 Visualization: An Introduction and Applications
Robert S. [email protected]
22
Old Visualization Technique
2D line plots of the acceleration data is difficult to interpret,
• Large time domain makes relating different periods difficult• Three channels (possibly more) need to be correlated mentally by user• Relating intensity plots to orientation or movement is difficult
walking washing flying flying flyingdiving

23 Visualization: An Introduction and Applications
Robert S. [email protected]
BackgroundUnderstanding animal behaviour helps us to understand the environment, but animals are difficult to follow (for good reason).
We can follow them easily in some places...
Or not at all...
With more difficulty in others...
23

24 Visualization: An Introduction and Applications
Robert S. [email protected]
24
Objectives
Given accelerometry data, it is useful to:
a) identify extraordinary events,
a) identify similarity,
a) relate to other attributes to form hypotheses
a) identify commonly adopted postures
While reducing cognitive effort required by line plots.

25 Visualization: An Introduction and Applications
Robert S. [email protected]
Acceleration data can be correlated with other attributes.
Visualisation of Multiple Attributes
• Replacing the magnitude of acceleration vector with pressure attribute improves readability of visualisation.
25
Visualisation now achieves objective (c); relating accelerometry to other attributes to form a hypothesis for behaviour.

26 Visualization: An Introduction and Applications
Robert S. [email protected]
Visualisation of DistributionFrequently adopted orientations indicate
common behaviours. These can be observed with a histogram
over sphere; achieving objective (d)(identifying commonly
adopted postures).
26
27 Visualization: An Introduction and Applications
Robert S. [email protected]
27
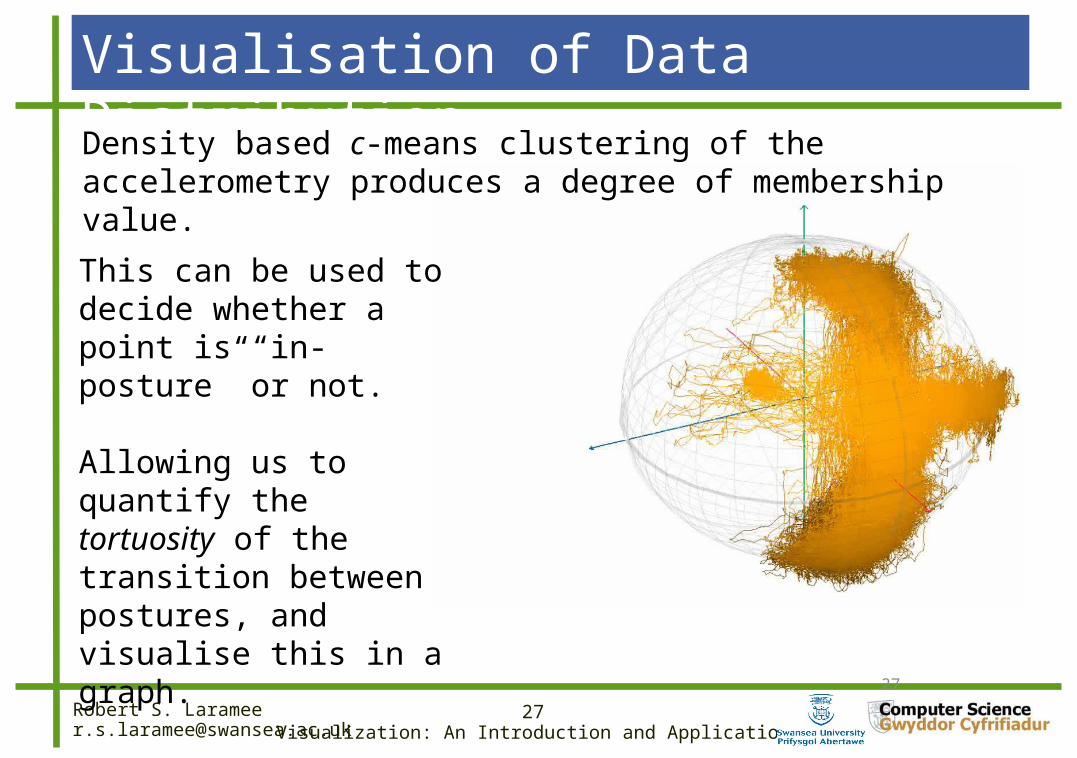
Visualisation of Data Distribution
This can be used to decide whether a point is “in-posture” or not.
Allowing us to quantify the tortuosity of the transition between postures, and visualise this in a graph.
Density based c-means clustering of the accelerometry produces a degree of membership value.

28 Visualization: An Introduction and Applications
Robert S. [email protected]
28
Domain Expert ReviewScatterplot and overlay are valuable tools for both exploration and communication of results.Open research problem in marine biology: “Why don’t diving birds get decompression sickness (the bends)?”
Visual correlation of:
• Acceleration• Pressure
Resulted in hypothesis:“Diving birds slow their ascent toprevent nitrogen bubbles buildingup in their blood.”
strata in ascent
absent during descent

29 Visualization: An Introduction and Applications
Robert S. [email protected]
State Transition DiagramsData clustering gives further insight into postures and energy expenditure.
29
Posture spheres present new interaction possibilities for statistical analysis.

30 Visualization: An Introduction and Applications
Robert S. [email protected]
Results: Animal Tracking Video

31 Visualization: An Introduction and Applications
Robert S. [email protected]
Summary
Driven by / driving the strongest human sense
Lots of different application fields Serves different purposes
Exploration, analysis, presentation
Depends on data characteristics, e.g., dimensionality data model (continuous vs. discrete)
Rapidly developing research field

32 Visualization: An Introduction and Applications
Robert S. [email protected]
Acknowledgements Thank you for your
attention! Any Questions?Thanks to the following people:
Helmut Doleisch, Christoph Garth, Edward Grundy, Markus Hadwiger, Helwig Hauser, Mark W Jones, Robert Kosara, Lukas Mroz, Juergen Schneider, Emily Shepard, Xavier Tricoche, Rory P Wilson

33 Visualization: An Introduction and Applications
Robert S. [email protected]
Visualization Application: Virtual Reality