Robert A. Fisher Virginia Institute of Marine Science ...web.vims.edu/adv/aqua/MRR2006_9.pdf · A...
16
Initial Market Assessment of the Cultured, Non-native Oyster C. ariakensis Robert A. Fisher Virginia Institute of Marine Science College of William and Mary Gloucester Point, Virginia 23062 December 2006
Transcript of Robert A. Fisher Virginia Institute of Marine Science ...web.vims.edu/adv/aqua/MRR2006_9.pdf · A...

�
Initial Market Assessment of the Cultured, Non-native Oyster C. ariakensis
Robert A. FisherVirginia Institute of Marine Science
College of William and MaryGloucester Point, Virginia 23062
December 2006

2
This work is a result of research sponsored in part by NOAA Office of Sea Grant, U.S. Department of Commerce, under Grant No. NA96RG0025 to the Virginia Graduate Marine Science Consortium and Virginia Sea Grant College Program. The U.S. government is authorized to produce and distrib-
ute reprints for governmental purposes not-withstanding any copyright notation that may appear
VSG-06-11 VIMS Marine Resource Report No. 2006-9
Additional copies of this publication are available from Sea Grant, at:Sea Grant Communications
Virginia Institue of Marine ScienceP.O. Box 1346
Gloucester Point, Virginia 23062804/684-7170
www.vims.edu/adv/

�
Abstract
While biological risk assessments dominate the academic and political debate concerning the intro-duction of the non-native oyster (Crassostrea ariaken-sis) in Mid-Atlantic States, opportunity assessments of market potential are also needed. The successful introduction of a new species hinges in part on con-sumer and commercial quality evaluations compared to the established eastern oyster, Crassostrea virginica. A discriminatory taste test (triangle test) indicated with 99% confidence (B=.01, Pd=30%) the propor-tion of the population who can perceive a differ-ence between the two species is between 0% and 32% for low salinity oysters, and between 8% and 51% for high salinity oysters. Three refrigerated storage (8°C) shellstock shelf life studies, conducted with both species from various grow out water temperatures (10°C, 17°C, and 26°C), consistently showed a significantly higher degree of mortality during refrigerated storage in C. ariakensis relative to C. virginica. As observed by accumulated drip, and confirmed by oyster meat moisture content analysis, substantial moisture is lost by C. ariakensis oysters (3.5% in low salinity oysters, 2% in high salinity oysters) within the first week of storage. Visceral desiccation in C. ariakensis was attributed to the lack of tight shell closure, with gaping occurring within 3 days of storage. Oyster condition index values were generally not a significant indicator of oyster quality during brief storage periods, though mois-ture monitoring may serve as a better indicator for shellstock shelf life. Microbial growth increased during storage for both species at both salinities, however, rate of increase was only significant for low salinity C. ariakensis. An incubation temperature of 25°C allowed for substantially higher aerobic plate count (APC) densities than at 35°C, indicat-ing the potential for underestimating growth if the standard temperature (35°C) is used. Nutritional profile comparisons between the species illustrated similarities of proximate, lipid, and some mineral values. However, differences in key minerals and vitamins were observed, which may possibly affect sensory evaluations. Observed shell deformities
located on the interior surfaces of the shells, rang-ing from blisters impacted with mud to calcareous knobs at the site of muscle attachment, pose mar-keting constraints for both species.
Introduction
The native oyster, C. virginica, population has been drastically reduced throughout the Chesa-peake Bay. For years, concerns about the sustain-ability of this important resource have focused on over-fishing and the impact of two protozoan ma-rine pathogens, Perkisus marinus (Dermo) and Haplo-sporidium nelsoni (MSX) (Burreson and Ragone Calvo 1996), which cause death before the oysters reach market size. The Virginia commercial oyster in-dustry has experienced annual production declines from 7,052 metric tons in 1950 to 44 metric tons in 2002, a 99% decline (Personal communication from NOAA Fisheries, Fisheries Statistics Divi-sion, Silver Spring, MD). The highly valued oyster processing industry in Virginia has become heavily reliant on imported oysters from other producing states. Grass-root oyster restoration programs have been initiated in recent years, targeting native oyster replenishment and non-native oyster introduction, with the goal to rebuild the Virginia oyster resource for commercial harvesting and ecological benefit. The resurgence of locally grown and harvested oysters, would bolster the processing sector which, when combined with a re-established harvesting sector, could generate over $110 million in total economic output, $82 million in incomes, and over 3, 000 jobs for the state each year (Murray 2002).
Research into the use of non-native oysters commenced at the Virginia Institute of Marine Science (VIMS) in the mid-1990s (VIMS, 1996). A comparative field study in 1997 documented superior growth rate and disease resistance to the marine pathogens responsible for MSX and Dermo of C. ariakensis over C. virginica (Calvo, et al. 2000), giving promise for successful introduction of an alternative species. The arguments for and against the introduction of a non-native species are divided down political and academic lines. Of foremost
�

2
concern is the risk of C. ariakensis colonizing and displacing C. virginica. With the advent of oyster tetraploid technology (Guo and Allen 1994), sterile (triploid) non-native oysters were made available by the Aquaculture Genetics and Breeding Technol-ogy Center (ABC) at VIMS for “in situ” testing with minimal environmental risk. However, evaluating the success of a food resource commodity incor-porates thorough evaluation of risk assessments weighed against opportunity assessment, or market potential.
The successful introduction of a new or sub-stitute product into an existing, well-established, highly valued market is difficult. New products are compared by rigorous, subjective and objective standards to existing commodities. Acceptance is more difficult if the market consists of a single, prized commodity. The domestic east coast oys-ter industry has been standardized by the various palatable and commercial qualities of the eastern oyster (C. virginica). The harvesting, processing, and distribution infrastructure on the U.S. east coast was built around C. virginica and continues to operate for this species. Consumers have also accus-tomed themselves to the appearance and subtle taste profiles of the native oyster from various growing areas. Successful introduction of C. ariakensis within the East Coast oyster market, therefore, will be largely determined by both consumer and industry acceptance, with the primary cri-teria being how it compares to C. virginica. Consumers determine the primary level of acceptance by taste and appearance. How-ever, industry will determine economic feasibility based upon characteristics such as handling, shelf life, and diversity of market forms. Without acceptable levels in these categories, market penetration may be severely limited, thus diminishing potential for introduction. This report is the finding of initial studies addressing consumer and commercial marketing is-sues surrounding the potential introduction of C. ariakensis.
Materials and Methods
For initial market acceptance assessment of the non-native oyster, C. ariakensis, in Virginia, a series of tests were performed to address both consumer and industry market concerns. In all testing, triploid C. ariakensis were compared to diploid C. virginica which were grown subtidally side-by-side at commercial growout sites represent-ing three salinity regimes. Non-native C. ariakensis oysters used for these studies were sterile triploids produced through tetraploid technology by ABC. Native C. virginica diploid oysters were produced at the ABC oyster hatchery. Field study sites were at Tom’s Cove [high salinity (31-33%), Chincoteague, VA], mouth of York River [moderate salinity (16-20%), Yorktown, VA], and Coan River [low salinity (10-14%), Lottsburg, VA], see map, Figure 1. Both species of oysters were deployed at each grow out site as seed during summer of 1999 for sensory and shelf life evaluations.
Che
sape
ake
Bay
Potomac River
Rappahannock River
York River
James River
Atlantic Ocean
Chinc
oteagu
eInl
et
Figure 1. Map of study sites. ● Low salinity (10-14 ppt), ▲ Moderate salinity (16-20 ppt), High salinity (31-33 ppt)
●
▲
▄
▄
2

�
Sensory Evaluation
Sensory testing to determine if a taste differ-ence could be perceived between native and non-native oysters was performed with the use of the Triangle Test for Similarity, a standard test method for sensory analysis (Meilgaard, 1999). Triangle Tests are used to identify perceived differences or similarities in sensory attributes between two samples, and do not identify preferences. This discriminatory test was used to determine if C. virginica and C. ariakesnis were sufficiently similar to be used interchangeably. Oysters from both high and low salinities were tested independently. The Triangle Test was performed at VIMS on May 18, 2000. Oysters used for this sensory evaluation were obtained from the high salinity (32%) and low salinity (12%) field growout study sites. Oysters of both species from each site where selected to acquire comparable meat sizing, resulting in oys-ter shellstock ranging from 80-100mm in length. Oysters were shucked into 2 oz. plastic cups, lid-ded, and placed into refrigeration (8°C) 1-1.5 hrs prior to initiating testing. Participants for the test were recruited from the VIMS community (faculty, staff, and graduate students ranging from 22 to 65 in age), all of which identified themselves as avid consumers of raw oysters. 41 males and 23 females participated.
The assessors were provided a brief training session to familiarize them with the triangle test (format, task to be performed and procedure for evaluation) and the type of product being tested. Groups of 8-10 assessors were seated in individual booths and presented two sets of samples (low salinity oysters and high salinity oysters) one at a time, with three coded shucked oyster meats per set. Two of the three samples in each set were one species while the third in the set was the odd sample (different species). Sets of samples were randomly chosen from prepared sets of six pos-sible combinations. Worksheets were provided to analysts instructing them to taste samples within a set from left to right and determine which sample was the odd sample. If they could not identify an
odd sample, they were instructed to guess. A glass of water and no-salt soda crackers were provided to each assessor to cleanse their palate between each sample tasting.
Within the design of the Triangle Test, the proportion of the population which is acceptable who can distinguish between the two samples (Pd, proportion of discriminators) is set. Understanding limitations on the number of assessors which could be accommodated at the VIMS facility, the param-eters (Hypothesis) of 99% certainty (B=.01) that no more than 30% of the population (Pd=30%) can detect a difference was set. Sixty-four assessors participated to give the test statistical validity.
Shellstock shelf life
Three shellstock refrigerated holding studies were conducted to evaluate half shell oyster shelf life; one during each growing period (early spring, early summer and early fall of 2001) to cover the varied growout water temperatures from which the oysters were harvested prior to refrigerated storage. The initial study was conducted in the early spring (March) with oysters grown at 3 different salin-ity regimes (high, moderate, and low) with water temperatures at all three sites ranging between 8-10°C at time of harvest. The early summer (May) and early fall (September) studies evaluated oysters grown only at the moderate salinity site with water temperatures of 17°C and 26°C, respectfully. For each study, C. virginica and C. ariakensis were grown side-by-side at each growout site to provide direct comparisons. Oysters of both species were re-moved from the growout sites, rinsed to remove mud, counted into pre-labeled sacks (totaling 50 oysters per sack), and then placed in refrigerated cold storage at 8°C (46.5°F).
A secondary group of 100 oysters of each spe-cies were held in reserve under identical parameters for condition index and microbiological testing. Holding practices mimicked current Virginia oyster distribution channel duration and environmental conditions for the half shell market. At specified days of storage, the oysters were removed from
3

2
cold storage and checked for gaping, which was used as the criteria signifying oyster death (relative to marketability). Oysters which displayed slight gapping initially, but attained shell closure quickly when handled, were noted but not considered a mortality. Gaping oysters were counted, then removed from the study, while the live oysters were returned to refrigerated storage.
Condition Index
To evaluate possible quality changes associated with refrigerated storage time, live oysters of both species from the reserve storage containers were measured for oyster microbial and condition indi-ces. Sampling for condition indices were conducted on days 0, 7, 12, 18, 22 for the March study, and days 0, 7, 14 for the May and September studies. Condition index (CI) was calculated after Crosby and Gale (1990) by the gravimetric formula:
meat dry weight (g) x 1000CI = whole live weight (g) – dry shell weight (g)
where; whole live weight (g) - dry shell weight (g) = Shell Cavity Capacity after Lawrence and Scott (1982) and referred to in this study as SCC.
Twelve live oysters of both species were removed from reserve storage containers at each sampling day, individually measured for total length, weighed (whole live weight), and shucked. The viscera (meat) from each oyster was placed on a #8 inclined sieve to drain for 2 minutes, weighed (wet meat weight), placed in a tared aluminum drying pan, and dried by the AOAC (1990) oven drying method. The shell valves of each oyster were also oven dried by the same procedure. After drying, the meats (dry meat weight) and shells (dry shell weight) were re-weighed.
Microbiological testing
Aerobic plate count (APC) densities were measured in the March shelf life study only, with sampling occurring on days 0, 1, 7, 14 and 21 of
refrigerated storage for oysters harvested from both low and high salinity sites. Samples consisting of twelve oysters of both species were removed from respective storage containers on each sampling day and washed thoroughly in autoclaved estuarine wa-ter of appropriate salinity with a brush to remove encrusting growth and detritus.
After shucking with an alcohol flamed knife, the 12 oyster meats and corresponding liquor per species were removed from the shell and weighed. A potassium phosphate buffer solution was added to each sample at a 1:1 ratio (w/v), the mixture homogenized by blending (90 seconds), diluted as appropriate, and plated in replicate on plate count agar.
Aerobic plate count determinations followed the analytical procedure discussed in the Com-pendium of Fish and Fishery Product Processes, Hazards, and Controls (Chapter 9, Aerobic Plate Count, USFDA, http://seafood.ucdavis.edu/haccp/com-pendiumlchapt09.htm). Plates were incubated at both 35°C and 25°C considering the potential for under-estimating densities of psychotrophic organisms at the former temperature and because APC informa-tion for C. ariakensis was unavailable.
Nutritional comparison
The nutritional profiles for C. ariakensis and C. virginica were determined for comparison. In April 2001, twelve oysters of both species were ran-domly selected and shucked from the low salinity study site. The 12 meats per group were compiled, representing a single sample for each species. The samples were shipped frozen to ABC Research Corporation, Gainesville, Florida for analytical determinations.
Results
Sensory Evaluation
Out of 64 assessors, 26 correctly identified the odd sample in the low salinity oysters and 34 cor-rectly identified the odd sample in the high salinity
4

3
moderate salinity site. In May, C. ariakensis mortal-ity increased at a moderate rate from 2% at day 3, to 14% by day 14, but increased from 4% to 60% over the same storage period in the September study. Similarly, C. virginica experienced 0% mortal-ity within the first 14 days of storage in May, but in the September study mortalities went from 0% on day 3 to 18% by day 14. Mortality increased significantly for both species as the growing season
Figure 2. Proportion of population that can detect difference in taste between C. virginica and C. ariakensis oysters.
oysters. Statistically, the minimum number of cor-rect responses required for significance was 25 (Mei-lgaard, 1999). Therefore, with 26 and 34 correct responses, it can be concluded that a sensory dif-ference between the two species exist at both gro-wout salinities. These results indicate that with 99% confidence the proportion of the population who can perceive a difference between the two species is near 30% for low salinity oysters, but considerably greater than 30% for high salinity oysters (Figure 2). With confidence limits calculated, it can be conclud-ed that with 99% confidence the true proportion of the population that can detect a difference between low salinity oysters is no greater than 32% and may be as low as 0% (Pmin =-.104, cannot be a nega-tive), and between high salinity samples is no greater than 51% and may be as low as 8%.
Shellstock shelf lifeConsistent throughout each study, C. ariakensis
experienced a significantly (P<.05) higher degree of mortality during refrigerated cold storage relative to C. virginica (Figures 3a, 3b, 3c).
Mortality in C. ariakensis from low and high salinity sites was similar during the March study, with greater losses occurring after 14 days of stor-age. There was a significant (P<.05) difference in the rate of mortality in both species occurring between the May and September studies within the
% a
ble
to d
etec
t diff
eren
ce
30% Pmax = 32%
Pmin = 0%
LowSalinity Oysters
HighSalinityOysters
Pmax = 52%
Pmin = 8%
September 2001
Figure 3c.
Figure 3a,b,c. Percent mortality of oysters held in refrig-erated (8ºC) dry storage.
May 2001
05
10152025
% M
orta
lity
0 3 7 10 14 18 21Days Held
virginica
ariakensis
March 2001
Figure 3a.
Figure 3b.
5

4
extended from summer to fall. Moisture was lost by C. ariakensis oysters
within the first week of storage (Figures 4a, 4b, 4c) which was visually observed by accumulated drip, and confirmed by oyster meat moisture content analysis. This moisture loss appeared to be the result of the inability of C. ariakensis to adequately maintain tight shell closure. Valve gaping was observed within 3 days during each study. In some instances, oysters attained shell closure after han-dling. Initial moisture loss was most likely due to the loss of free liquor within the mantle cavity, and not tissue moisture loss. As storage time increased, gaping became more prevalent and the ability to close after handling ceased. Prolonged periods of gaping resulted in tissue moisture loss, which became evident upon examining mortalities culled from the study.
All mortalities were observed to have a degree of visceral desiccation involved, especially within the mantle tissue. The mantle tissue was quite of-ten observed adhering to the valves, and had to be
Figure 4a, 4b, 4c. Average percent moisture change in oyster meats during refrigerated storage.
March 2001
Figure 4a.
May 2001
Figure 4b.
Ave
% M
oist
ure
September 2001
Figure 4c.Figure 5. Shucked C. ariakensis oysters after 14 days of refrigerated storage. Arrows indicate mantle tissue ad-hering to valves as a result of tissue moisture loss.
←
←
60
65
70
75
80
0 7 12 18 22Days Held
Ave
. % M
oist
ure
Cv low Ca low
Cv high Ca high
Ave
% M
oist
ure
60
65
70
75
80
0 14 21
Days Held
Ave
rage
% M
oist
ure
virginica ariakensis
Ave
% M
oist
ure
545658606264666870727476
1 7 14
Days Held
C. virginica C. ariakensis
6

5
scraped off for tissue recovery (Figure 5).
Condition index
A significant (P>.05) difference in the mean condition index was observed between the two growout sites at time of harvest in the March study, with lower CI values for both species from the higher salinity site (Figures 6a, 6b, 6c). The condi-tion index increased over time for both species and salinities. Within high salinity oysters, mean condi-tion indices for C. ariakensis became significantly higher than C. virginica as storage time increased.
The condition indices calculated for the May and September studies followed those of the March study, with increasing values over storage time. Initial CI values at time of harvest (day 1) for each study reflects seasonal differences. The observed greater rate of CI change in the September study
Figure 6a, 6b, 6c. Averarage condition index values for oysters held in refrigerated (8ºC) dry storage.
March 2001
Figure 6a.
Ave
CI
May 2001
Figure 6b.
050
100150200250300
1 14 21Days held
virginica ariakensis
September 2001
Figure 6c.
050
100150200250300
Ave
CI
1 7 14Days Held
virginica ariakensis
7
6
(Figure 6c) corresponds with its observed higher rate of mortality (Figure 3c). Microbiological testing
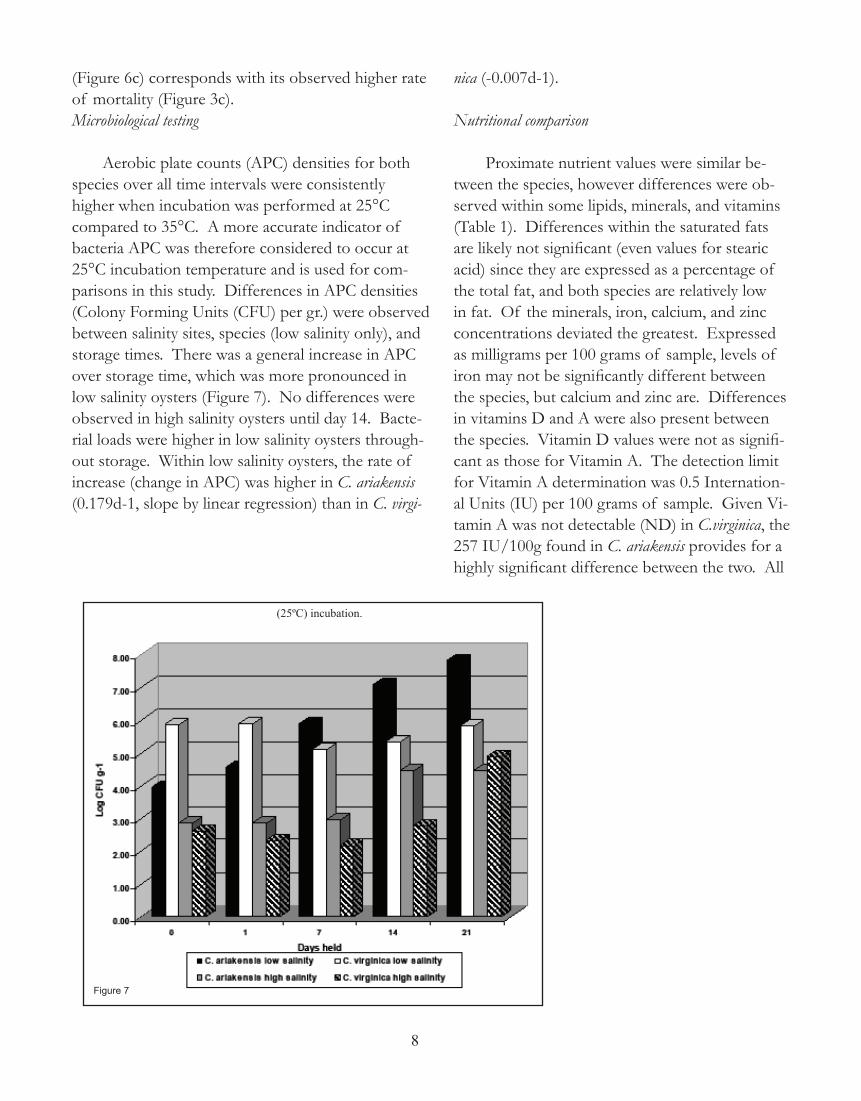
Aerobic plate counts (APC) densities for both species over all time intervals were consistently higher when incubation was performed at 25°C compared to 35°C. A more accurate indicator of bacteria APC was therefore considered to occur at 25°C incubation temperature and is used for com-parisons in this study. Differences in APC densities (Colony Forming Units (CFU) per gr.) were observed between salinity sites, species (low salinity only), and storage times. There was a general increase in APC over storage time, which was more pronounced in low salinity oysters (Figure 7). No differences were observed in high salinity oysters until day 14. Bacte-rial loads were higher in low salinity oysters through-out storage. Within low salinity oysters, the rate of increase (change in APC) was higher in C. ariakensis (0.179d-1, slope by linear regression) than in C. virgi-
nica (-0.007d-1).
Nutritional comparison
Proximate nutrient values were similar be-tween the species, however differences were ob-served within some lipids, minerals, and vitamins (Table 1). Differences within the saturated fats are likely not significant (even values for stearic acid) since they are expressed as a percentage of the total fat, and both species are relatively low in fat. Of the minerals, iron, calcium, and zinc concentrations deviated the greatest. Expressed as milligrams per 100 grams of sample, levels of iron may not be significantly different between the species, but calcium and zinc are. Differences in vitamins D and A were also present between the species. Vitamin D values were not as signifi-cant as those for Vitamin A. The detection limit for Vitamin A determination was 0.5 Internation-al Units (IU) per 100 grams of sample. Given Vi-tamin A was not detectable (ND) in C.virginica, the 257 IU/100g found in C. ariakensis provides for a highly significant difference between the two. All
(25ºC) incubation.
Figure 7
8

7
Nutrient C. virginica C. ariakensisProximatesMoisture (%) 78.2 77.4Protein (%) 7.6 7.9Fat (%) 3.0 3.3Ash (%) 1.3 1.3Carbohydrates (%) 9.9 10.1Calories/100g 97 102Calories from Fat/100g 27.0 29.7
LipidsSaturated (% in Fat) 46.29 40.08
6:0 0 08:0 0 010:0 0 012:0 0 014:0 Myristic acid 4.75 3.2516:0 Palmitic acid 40.28 32.6618:0 Stearic acid 1.26 4.1720:0 0 022:0 0 024:0 0 0
Cholesterol (mg/100g) 68.79 64.3
MineralsSodium (mg/100g) 141 136Iron (mg/100g) 2.60 3.66Calcium (mg/100g) 44.4 78.9Phosphorous(mg/100g) 165 141Magnesium (mg/100g) 29.7 28.4Potassium (mg/100g) 188 178Zinc (mg/100g) 87.2 31.5
VitaminsVitamin D (IU/100g) 209.1 302.7Vitamin C (mg/100g) 0 0Vitamin A
Activity (IU/100g) ND 257Carotene value ND NDRetinol value ND 257
Oyster Nutritional Comparison(April 2001)
Table 1.
9

8
of the Vitamin A in C. ariakensis was observed to be contributed by the retinol value. Discussion
The studies reported here provide basic in-formation towards the opportunity assessment of C. ariakensis as a potential species for introduction. It is clear that while C. ariakensis has been demon-strated by other authors to be superior to C. virgi-nica for growth rate and disease resistance, handling and marketing problems exist which could limit its potential as a marketable commodity. Oyster culture is a cost-intensive business where maximum value must be attained, thus the half-shell market is typically targeted. However, because C. ariakensis is fast growing (i.e. lower cost to produce), it may be suited for the lower valued, but potentially high-volume, shucked meat market. Successful penetra-tion of either market by cultured C. ariakensis will largely be determined on consumer acceptance, with the half shell market additionally dependant on how well industry can manage shellstock shelf life problems.
Though a taste difference between the two species was demonstrated at both grow-out salini-ties by a consumer panel, it was done so at a given testing sensitivity level. The test was structured under the hypothesis that no more than 30% (Pd=30%) of the population are able to detect a difference. Test significance was minimal for low salinity oysters. What constitutes a meaningful per-centage of the population who can detect a differ-ence between the two species has not been defined. Further, preference for either species was not specifically addressed in this study, only similarity. Descriptive comments made by assessors on their respective worksheets were not consistent for one species or the other. The terms “bland”, “fresh ocean”, and “metallic taste” were used equally to describe samples of both species.
Perceived differences in high salinity oysters were more significant than in low salinity oysters. In reviewing the nutritional profile of both species, differing levels of some macrominerals (calcium, phosphorus) and microminerals (zinc, iron), may
contribute to taste differences. Taste, or gustation, is a chemical sense which uses a solution to transfer the stimuli to taste receptors. When raw oysters are consumed, the residual oyster liquor provides the initial solution in which taste is transferred to the receptors. Liquor of fresh shucked oysters has a salinity of the water in which the oysters were harvested. Sodium chloride (salt) is both a flavor enhancer as well as a flavor suppresser. The ability of assessors to more readily identify a difference in high salinity oysters than in low salinity oysters may be attributed to the higher level of sodium chloride available to either enhance or suppress nutrient flavor profiles.
Differences between the species were per-ceived, but an indication of a “good” or “bad” difference was not obtained with the Triangle Test. Further sensory evaluation techniques are needed to provide descriptive analysis and consumer pref-erence information.
The limited shelf life of shellstock C. ariakensis may pose the greatest impediment for its wide-spread marketability. The inability to sustain shell closure during refrigerated storage severely limits distribution. The adductor muscle in oysters is opposed by the hinge ligament, so relaxation of adductor muscle allows the valves to open (gape). There are two parts, or muscle types, which com-prise the adductor muscle. The larger part of the adductor is composed of striated muscle, which provides for quick responses, as rapid shell closure. The smaller part, often referred to as the “catch” muscle, is composed of smooth muscle which is slow to react, but provides prolonged contraction. The catch muscle keeps the valves of the oyster tightly closed. When removed from the water, this allows the oyster to retain liquid within the valves to support life. When this muscle tires during re-frigerated storage, it relaxes, resulting in gaping and subsequent loss of moisture.
It is apparent that the catch component of C. ariakensis adductor muscle is less functional than that in C. virginica, which results in early gaping during storage. The initial stage of gaping does not signify the biological death of the oyster, rather
�0
9
the initiation of meat dessication and, therefore, termination of its marketable life. The early gaping of C. ariakensis during refrigerated storage severely impacts its potential for the half shell market.
Within the first week of storage, many C. ariakensis started to display a dull, “hollow” sound when handled, even with oysters not gaping. This hollow sound differs from that of the common “clapper” sound of a dead C. virginica. This could be due to the physical difference between the two species in this study, with C. ariakensis being larger and thinner shelled. However, this hollow sound corresponded to overall moisture loss during stor-age. Unless the hollow sound was accompanied by gaping, the oysters were not culled out as mortali-ties. This decision was made to adhere with the traditional method (visual) of culling dead oysters. However, in light of this study, other criteria may be needed to determine end of shelf life for C. ariakensis shellstock.
Comparing shellstock mortality associated with growing seasons, higher mortality was observed as growout water temperatures increased. Oysters harvested in September came out of 26°C water and were transferred to 8°C refrigeration within 12 hours, as per current ISSC requirements (Guides For the Control of Molluscan Shellfish, 1997). High rate of temperature reduction could possibly be attributed to higher rates of mortality due to thermal stress.
Aerobic plate counts are largely performed in fishery products to indicate quality changes that oc-cur as a result of an applied process, and generally do not relate to food safety hazards. Most quality indicator bacteria present in oysters from Virginia are naturally occurring microorganisms capable of psychrotrophic (cold loving) growth. As such, attempts to isolate and grow these organisms at an elevated temperature (35°C) imparts stress, which inhibits growth, or results in cell death. This was observed in this study, where lower counts were consistently recorded at 35°C incubation compared to 25°C. Incubation temperature may also affect recovery of bacteria associated with food safety hazards, and should be considered.
In this study, the observed differences in APC densities in low salinity oysters during storage could be attributed to gaping, which occurred especially in C. ariakensis oysters early in storage and contin-ued throughout. Gaping increases the availability of oxygen to support growth of the aerobic bac-teria population within the oyster. Tightly closed oysters provide for an anaerobic environment, which favors other organisms and suppresses the growth of the aerobic bacteria measured in APC testing. This scenario, however, was not observed in the high salinity oysters where gaping in C. ariaken-sis also occurred. These observations suggest a role of salinity in the storage process.
Condition indices are typically generated to measure the nutritive status of oysters during grow out, and not for detecting quality changes occur-ring during brief storage periods. However, given the CI equation, changes in the index are sensitive to moisture values, not within the visceral mass (since dry meat weight is used), but in the amount (weight) of free liquor within the live oyster. In this study, inflation of the index during storage is most likely caused by decreasing whole live oyster weights due to moisture loss, primarily from loss of free liquor when oysters gape but also from tissue dessication.
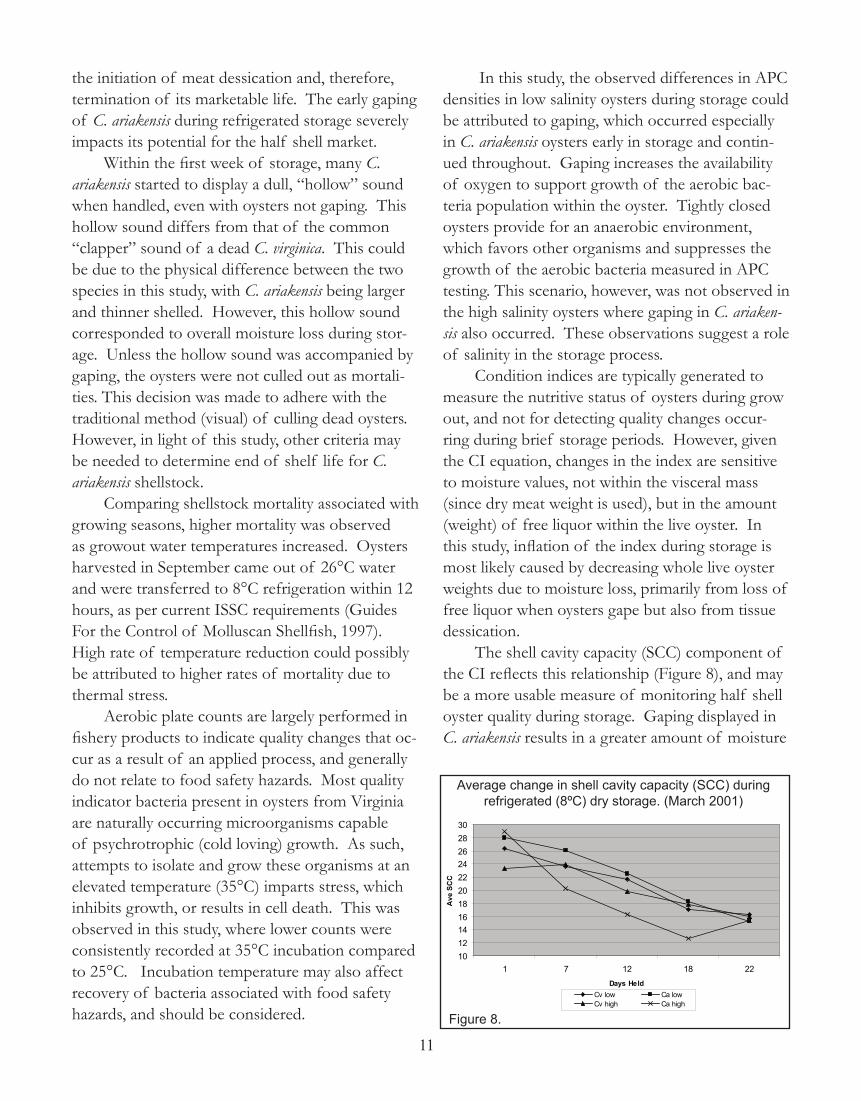
The shell cavity capacity (SCC) component of the CI reflects this relationship (Figure 8), and may be a more usable measure of monitoring half shell oyster quality during storage. Gaping displayed in C. ariakensis results in a greater amount of moisture
Average change in shell cavity capacity (SCC) during refrigerated (8ºC) dry storage. (March 2001)
Figure 8.
1012141618202224262830
1 7 12 18 22Days Held
Ave
SC
C
Cv low Ca lowCv high Ca high
��

�0
loss, which lowers the shell cavity capacity. This in turn elevates the CI (Figure 6a). Moisture monitor-ing, by percent in tissue or SCC, may provide for a usable measure of half shell oyster quality during storage in C. ariakensis.
Nutritional testing occurred in April, a point at which oysters normally begin expending energy for gametogenesis and shell deposition. Though triploid oysters are sterile, they undergo gametogen-esis at some level (Erskin, 2003). The nutritional profiles reflect little difference in proximate values, indicating similar nutritive status between the spe-cies. As previously reported, C. arakensis maintains a faster growth rate than C. virginica. The significant difference observed in calcium levels may be indica-tive of increased mineralization occurring in C. ariakensis relative to accelerated shell deposition.
Differences in some nutri-ent levels between the species may play a role in the taste differences perceived by the consumer. Prior to research centering on C. ariakensis as the potential substitute species on the east coast, the non-native pacific oyster, Crassostrea gigas, was investigated. Initial sensory evaluations by leading oyster growers in Virginia compared C. gigas with C. virginica and reported an unfavorable taste profile of C. gigas and preference for C. virginica (personal communica-tion). In comparing nutrient levels from this study to those in the USDA National Nutrient Data Base for Standard Reference (http://www.ars.usda.gov/nu-trientdata) for C. virginica and C. gigas, differences in key nutrients were observed between native and non-native oysters. Elevated levels of iron and Vitamin A, and reduced levels of zinc in C. ariaken-sis were consistent with levels recorded for C. gigas. However, the relationship these nutrients may play in taste perception is not clear.
Examination of the interior surface of oyster shells during condition index evaluations revealed
significant amounts of shell deformities which could potentially impact the half-shell market. These shell deformities were located on the interior surfaces of the shells of both species, ranging from blisters impacted with mud to calcareous knobs at the site of muscle attachment (adductor scar). Blisters were limited to surface areas outside the ad-ductor scar of the oyster valves, and were thought to be caused by the marine mud worm Polydora sp. The knobs were mostly restricted to within the adductor scar (Figure 9), ranging in shape from conical (up to 8.5mm in height) to elongate ridges (2 mm x 5 mm x 12 mm). These calcareous knobs protrude into the adductor muscle. Upon shuck-ing, the knobs either break off and remain in the
muscle, leaving an unsightly open lesion in the shell and a potential physical hazard to the consumer, or they deflect the shucking knife leaving a considerable amount of muscle still attached to the valve. In both cases, these shell deformities pose significant problems for the highly valued half shell market.
Gross observations of the knobs were strikingly similar to symptoms of the oyster shell dis-ease “maladie du pied” (foot dis-ease) reported in Ostrea edulis and Crassostrea angulata from Europe and Canada (Koringa 1951, Alderman
and Jones 1971, and Li et al. 1983), which is caused by a marine fungus. However, subsequent research implicates Polydora sp. as the causative agent for these shell deformities (R. Fisher, in preparation). The level of incidence of knobs formed in the adductor scar varied significantly by salinity (25% in high and 88% in low), but not by species (56% for both). The degree of prevalence of both shell deformities (blisters and knobs) in low to moderate salinity growout areas was observed to be higher in the thinner shelled C. ariakensis than in the thicker shelled C. virginica. No quantitative determinations were made as to percent of valve area affected by these shell deformities. Due to their potential
Figure 9. Calcareous knobs extending from valves at the site where the ad-ductor muscle attaches to the valves.
�2
��
impact on the half shell market, further research into the causative agent(s) of these shell abnormali-ties is warranted. The results presented here com-pared triploid C. ariakensis with diploid C. virginica. Because gametogenesis in triploid oysters deviates from that of diploid oyster, the potential for mar-ket quality parameters to be affected due to ploidy exists. Therefore, it is recommended that future
comparative studies between species involve the same ploidy, using all triploid or all diploid oysters.
References Cited
Alderman, D.J. and E.B.G. Jones. 1971a. Shell disease of oysters. Fishery Investigations, London (Series 2) 26(8):1-19.
Allen, S. K., Jr., S. L. Downing & K. K. Chew. 1989. Hatchery manual for producingtriploid oysters. University of Washington Press, Seattle. 27 pp.
AOAC, 1990. Official Methods of Analysis, 15th ed., Association of Official Analytical Chemists, Alring-ton, VA. Burreson, E.M. and L.M. Ragone Calvo. 1996. Epizootiology of Perkinsus marinus disease of oysters in Chesapeake Bay, with emphasis on data since 1985. Journal of Shellfish Research 15(1):17-34.
Calvo, G.W., M. W. Luckenbach, S.K. Allen Jr. and E.M. Burreson. 2000. A comparative field study of Crassostrea ariakensis and Crassostrea virginica in relation to salinity in Virginia. Special Report in Applied Marine Science and Ocean Engineering. No. 360, March 200
Crosby, M.P. and L.D. Gale. 1990. A review and evaluation of bivalve condition index methodologies with a suggested standard method. Journal of Shellfish Research 9(1): 233-237.
Erskin, A.J. 2003. Biology of mated triploid Crassostrea ariakensis in multiple environments: gametogen-esis, sex ratio, disease prevalence, and reversion. MS Thesis, VIMS. 159pp.
Galstoff, P.S. 1964. The American oyster, Crossostrea virginica Gmelin. U.S. Fish Wildl. Serv. Fish. Bull. 64: 1-480.
Guo, X. and S.K. Allen, Jr. 1994. Viable tetraploids in the Pacific oyster (Crassostrea gigas) produced by inhibiting polar body I in eggs from triploids. Mol. Mar. Biol. Biotechnol. 3:42-50.Korringa, P. 1951. Investigations on shell disease in the oyster, Ostrea edulis L. Rapports Proce`s-verbaux Re`union Conseil Permanent Intrnational pour l’Exploration de la Mer 128: 50-54.
Lawrence, D.R. and G.I. Scott. 1982. The determination and use of condition index of oysters. Estuaries 5:23-27.
�3

�2
Li, M.F., R.E. Drinnan, M. Drebot, and G. Newkirk. 1983. Studies of the shell disease of the European flat oyster Ostrea edulis Linne` in Nova Scotia. Journal of Shellfish Research 3: 135-140.
Murray, T.J. 2002. Making a Case for the Oyster: Putting Ecological Benefits into Economic Terms. Vir-ginia Marine Resource Bulletin, Virginia Sea Grant College Program, Virginia Institute of Marine Science, College of William and Mary. Vol 34, No. 2, Fall 2002, pp7-10.
Virginia Institute of Marine Science (VIMS). 1996. Strategic plan for molluscan shellfish research, includ-ing a rational plan for testing application of non-native oyster species. A report of the Virginia Institute of Marine Science to the Governor and the General Assembly of Virginia. House Doc. 16, Richmond. 123 pp.
Acknowledgements
The author would like to thank Dr. Howard Kator and Martha Rhodes of VIMS for microbiological assistance, Tom Murray, Mike Oesterling, and David Rudders of the Marine Advisory Services, Virginia Sea Grant College Program at VIMS for editing and statistical assistance, and Stan Allen (VIMS Aquacul-ture Genetics and Breeding Technology Center) and cooperating commercial oyster growers for provid-ing and growing oysters for testing. This work was supported by the Virginia Sea Grant College Program NA96RG0025 to S.K. Allen, Jr. and W. DuPaul.
14